
The Role of Green Infrastructure in Enhancing Microclimate Conditions: A Case Study of a Low-Rise Neighborhood in Abu Dhabi

Abstract
:1. Introduction
1.1. Background
1.2. Problem Statement
1.3. Aims
2. Methodology
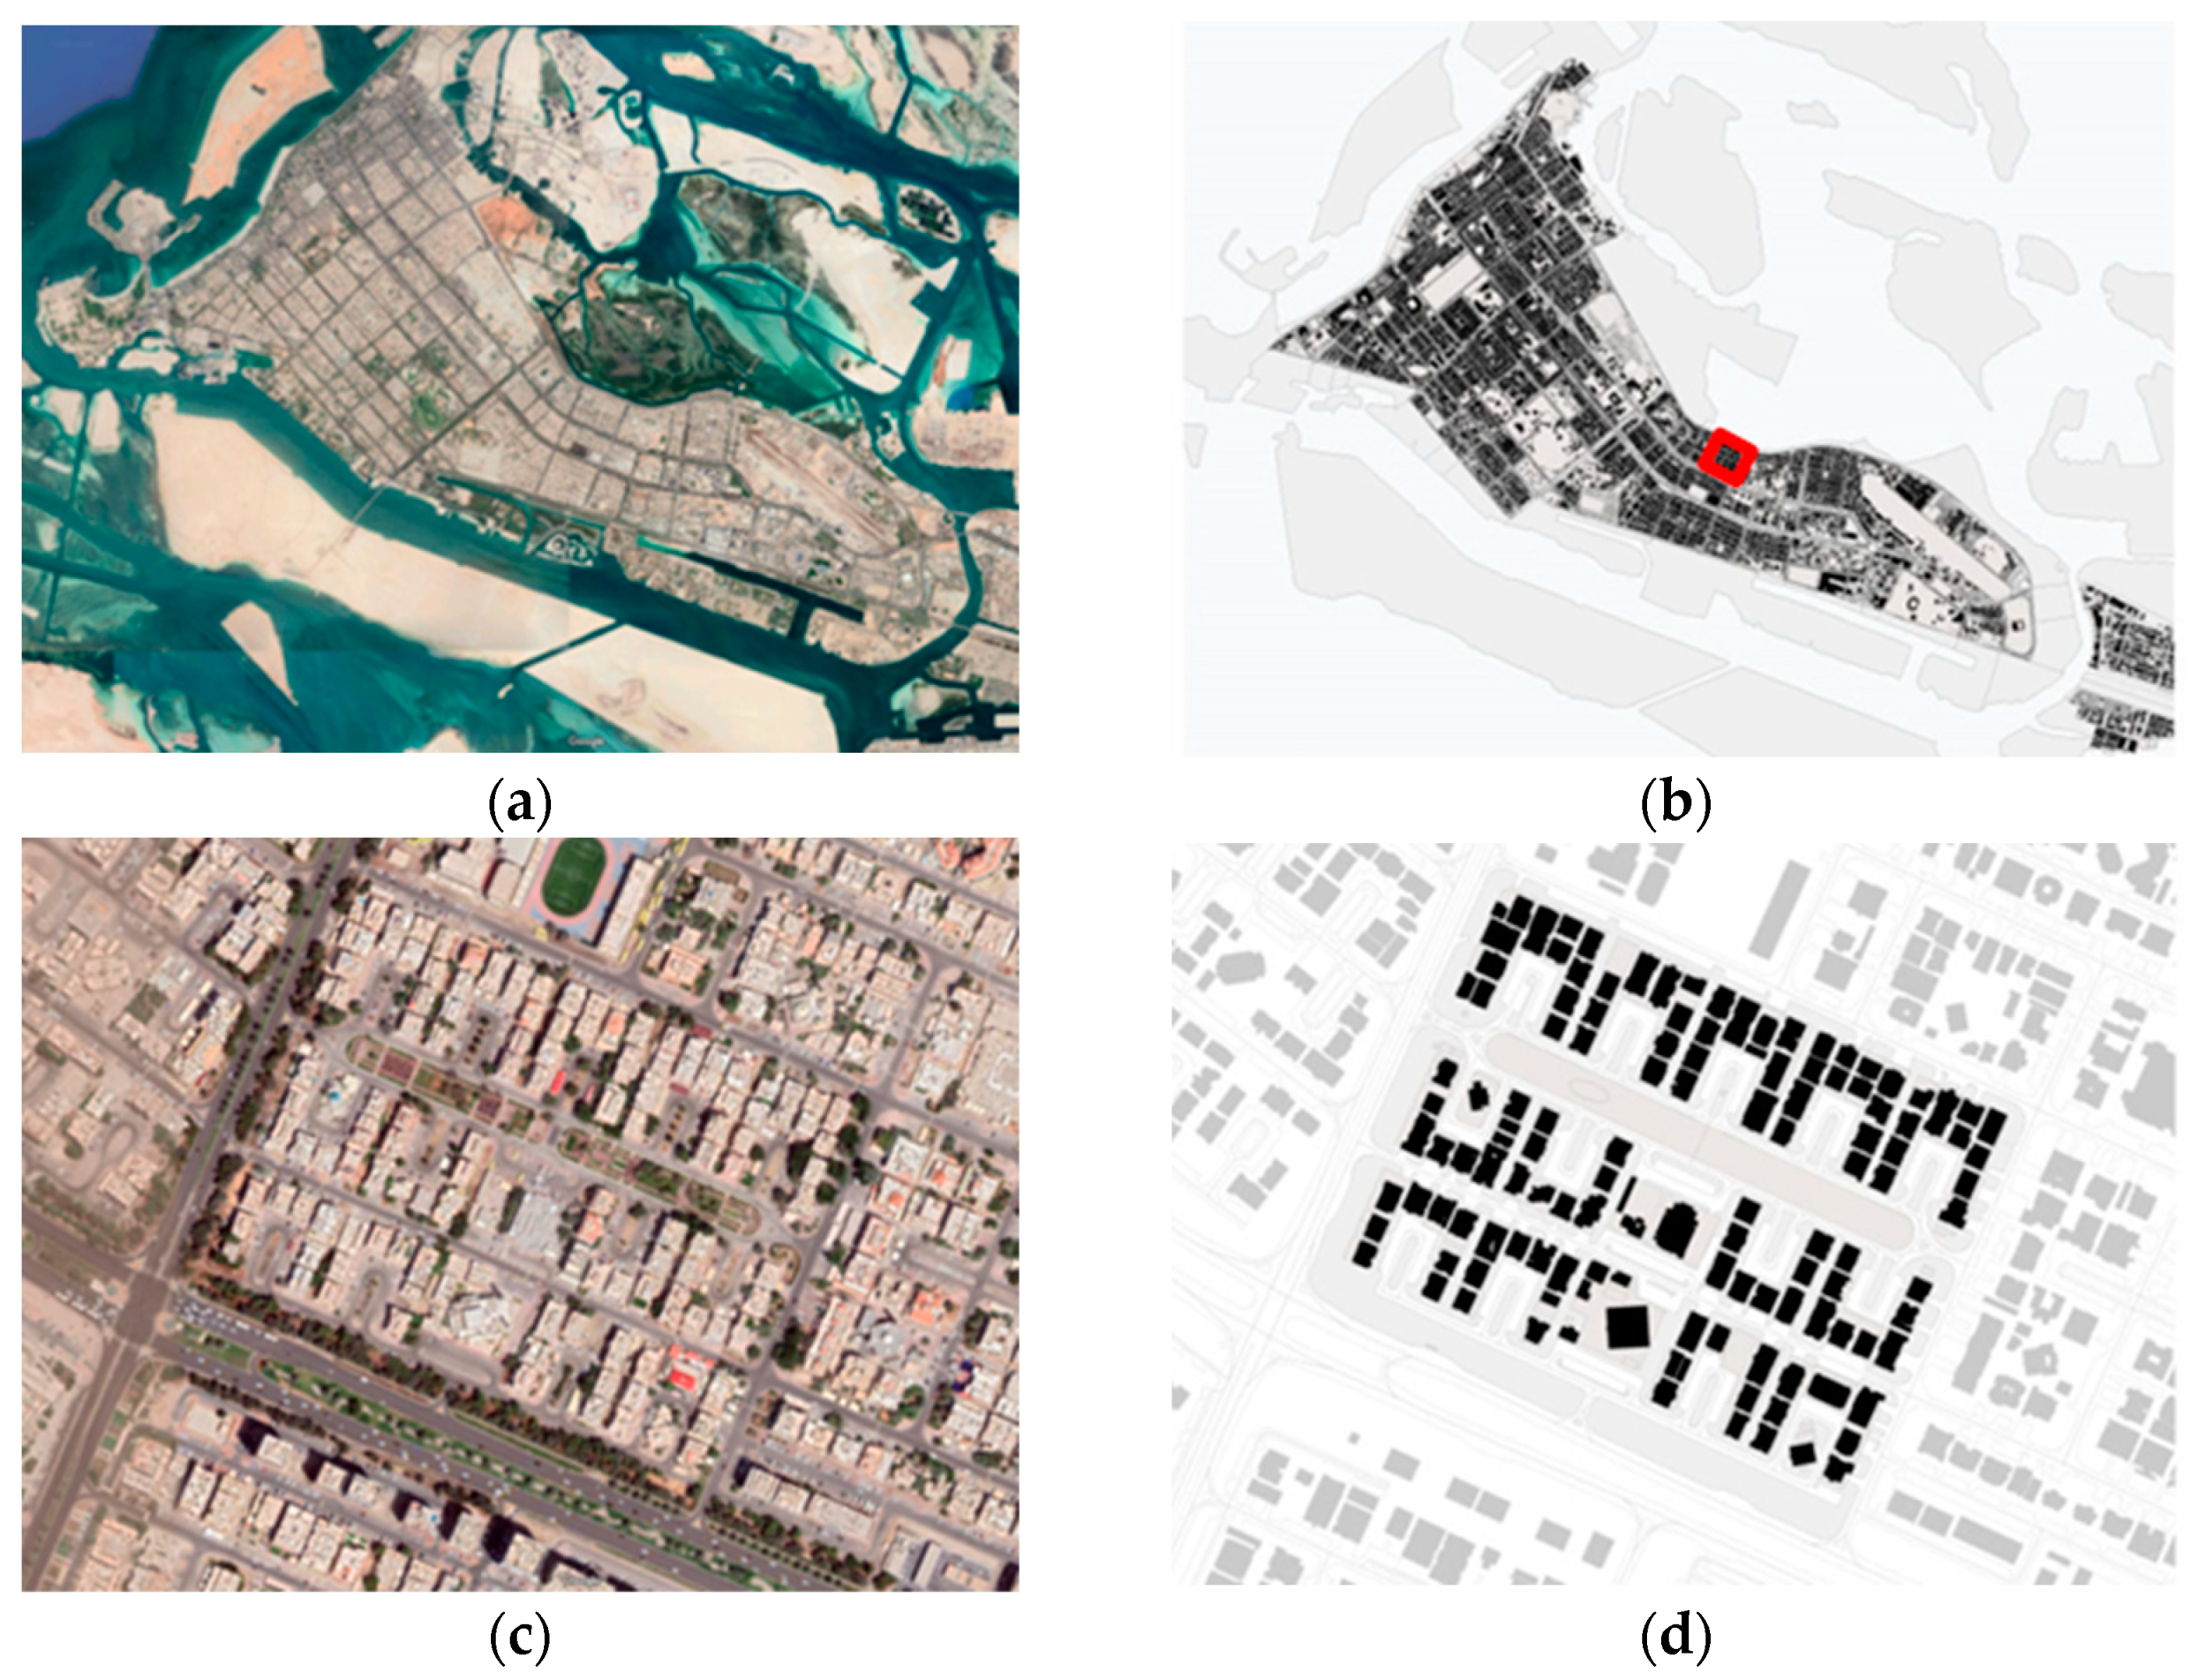
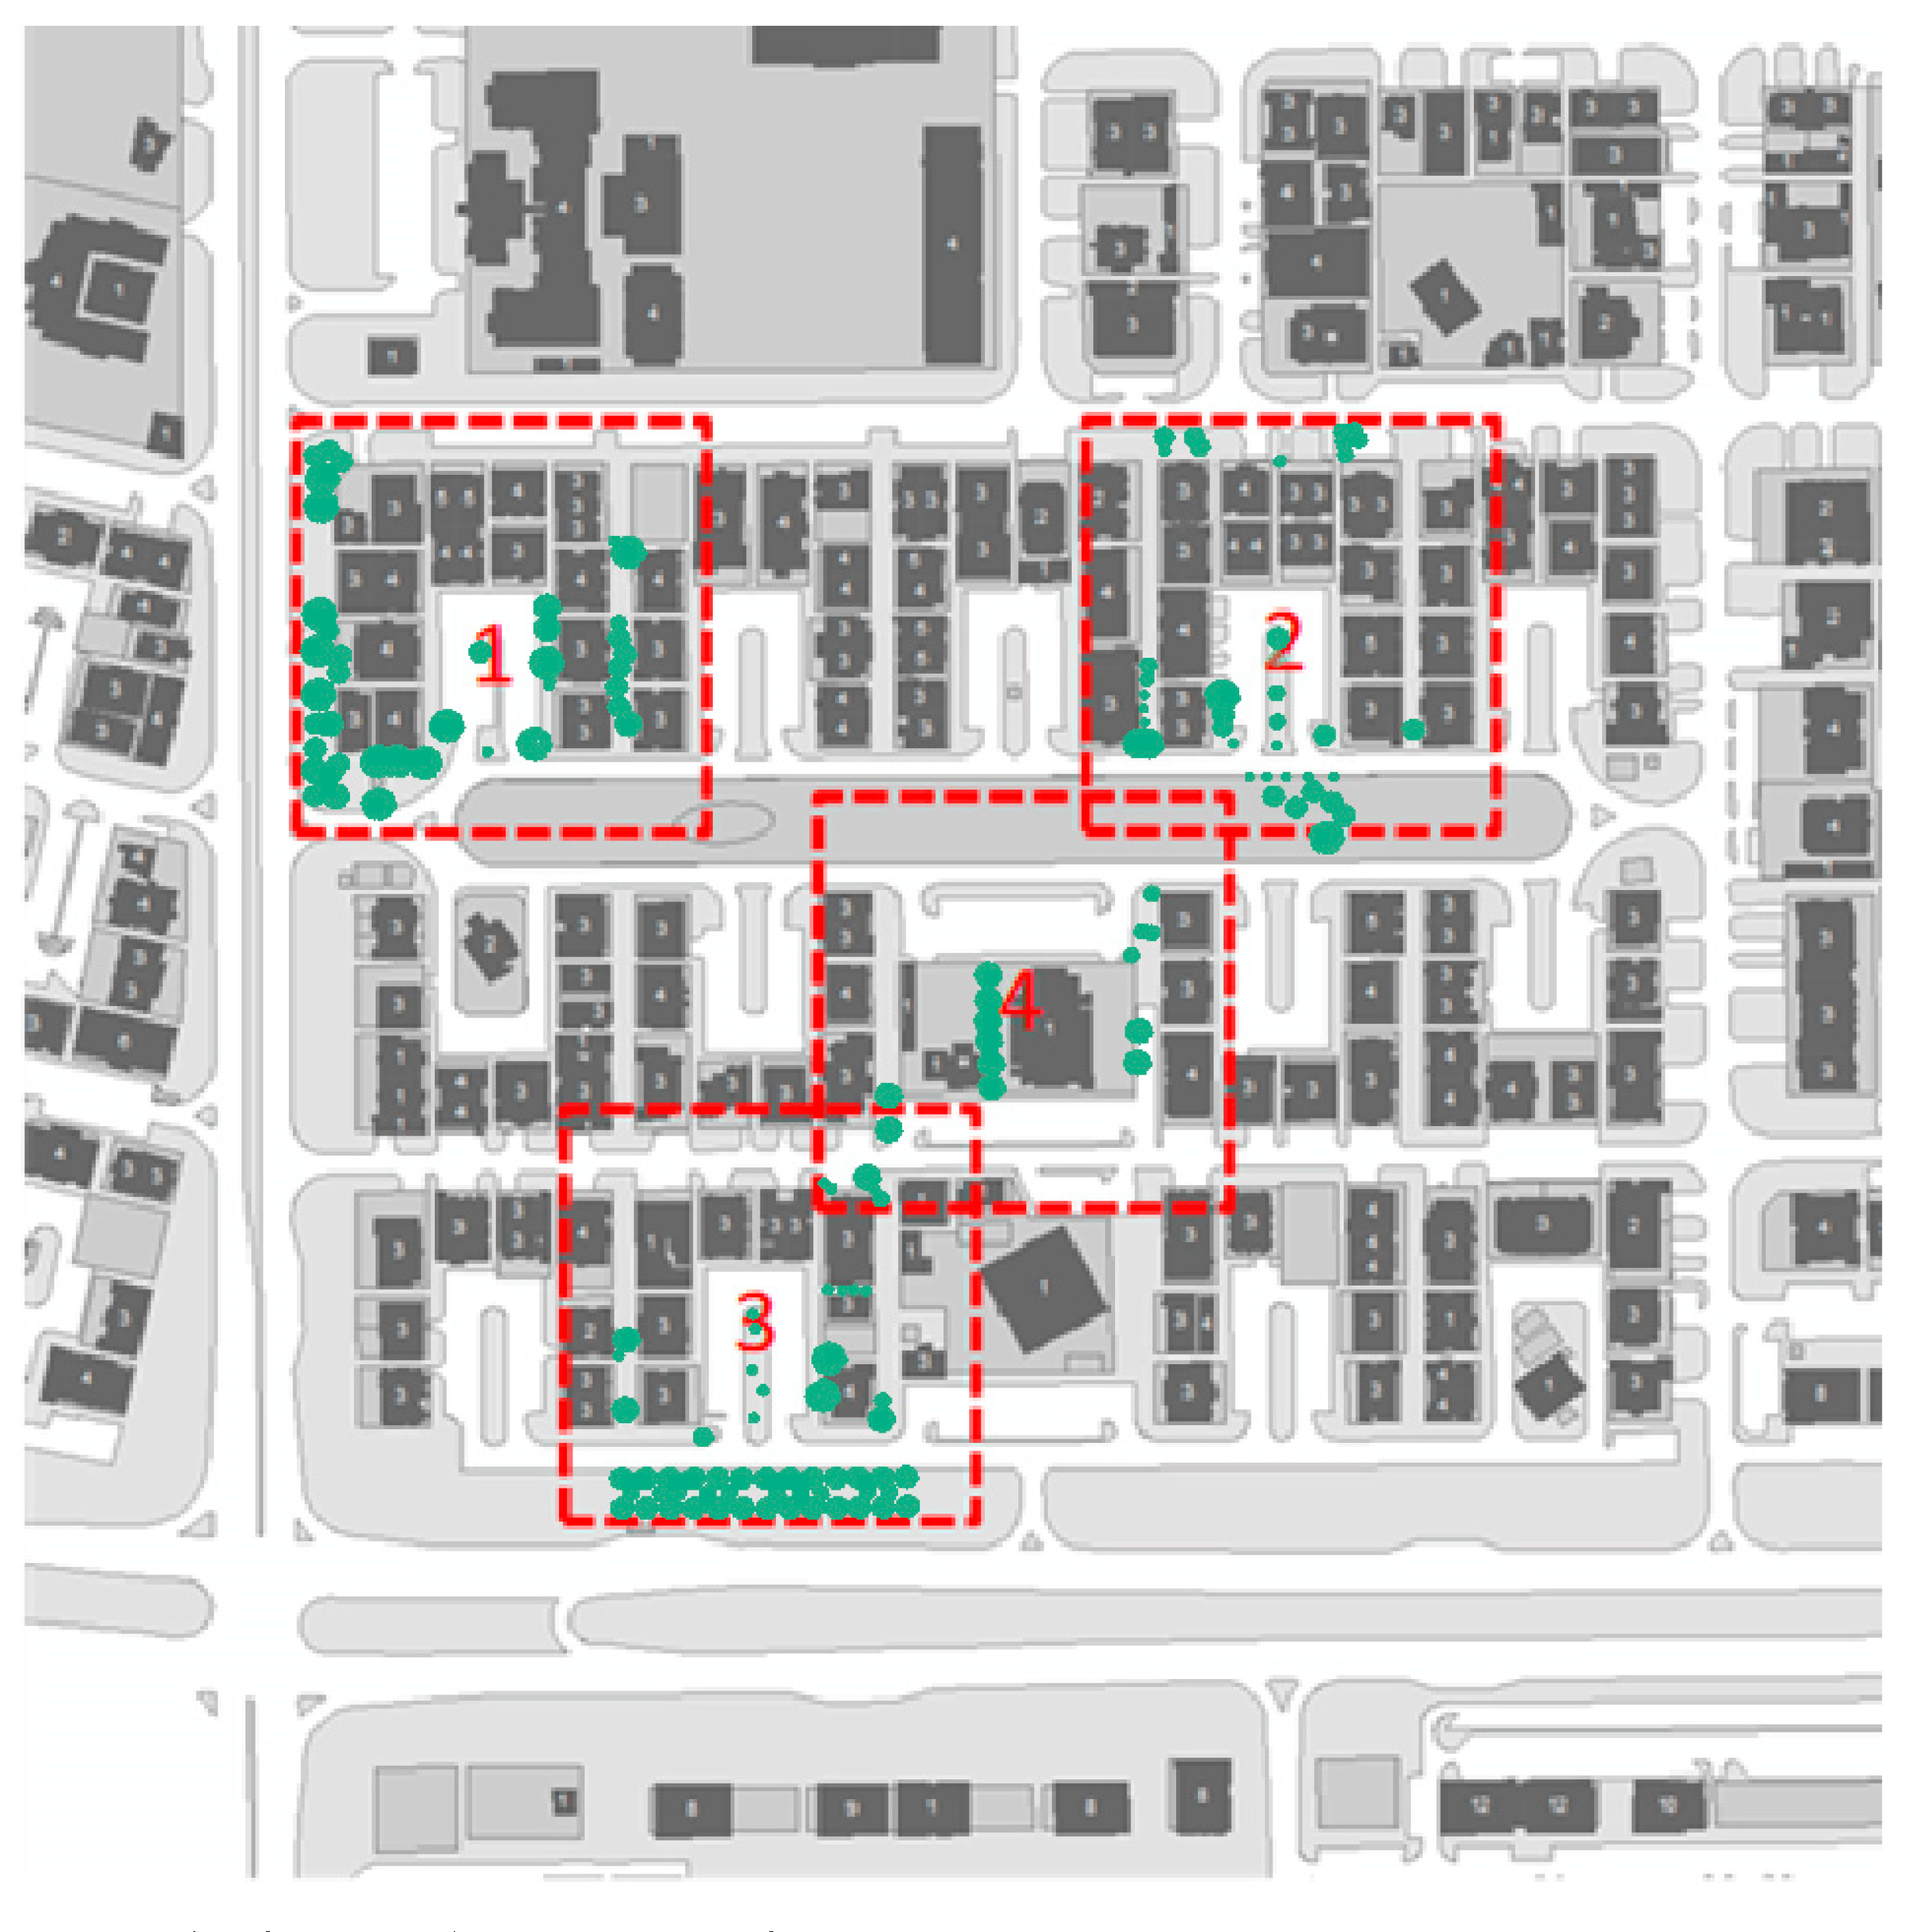
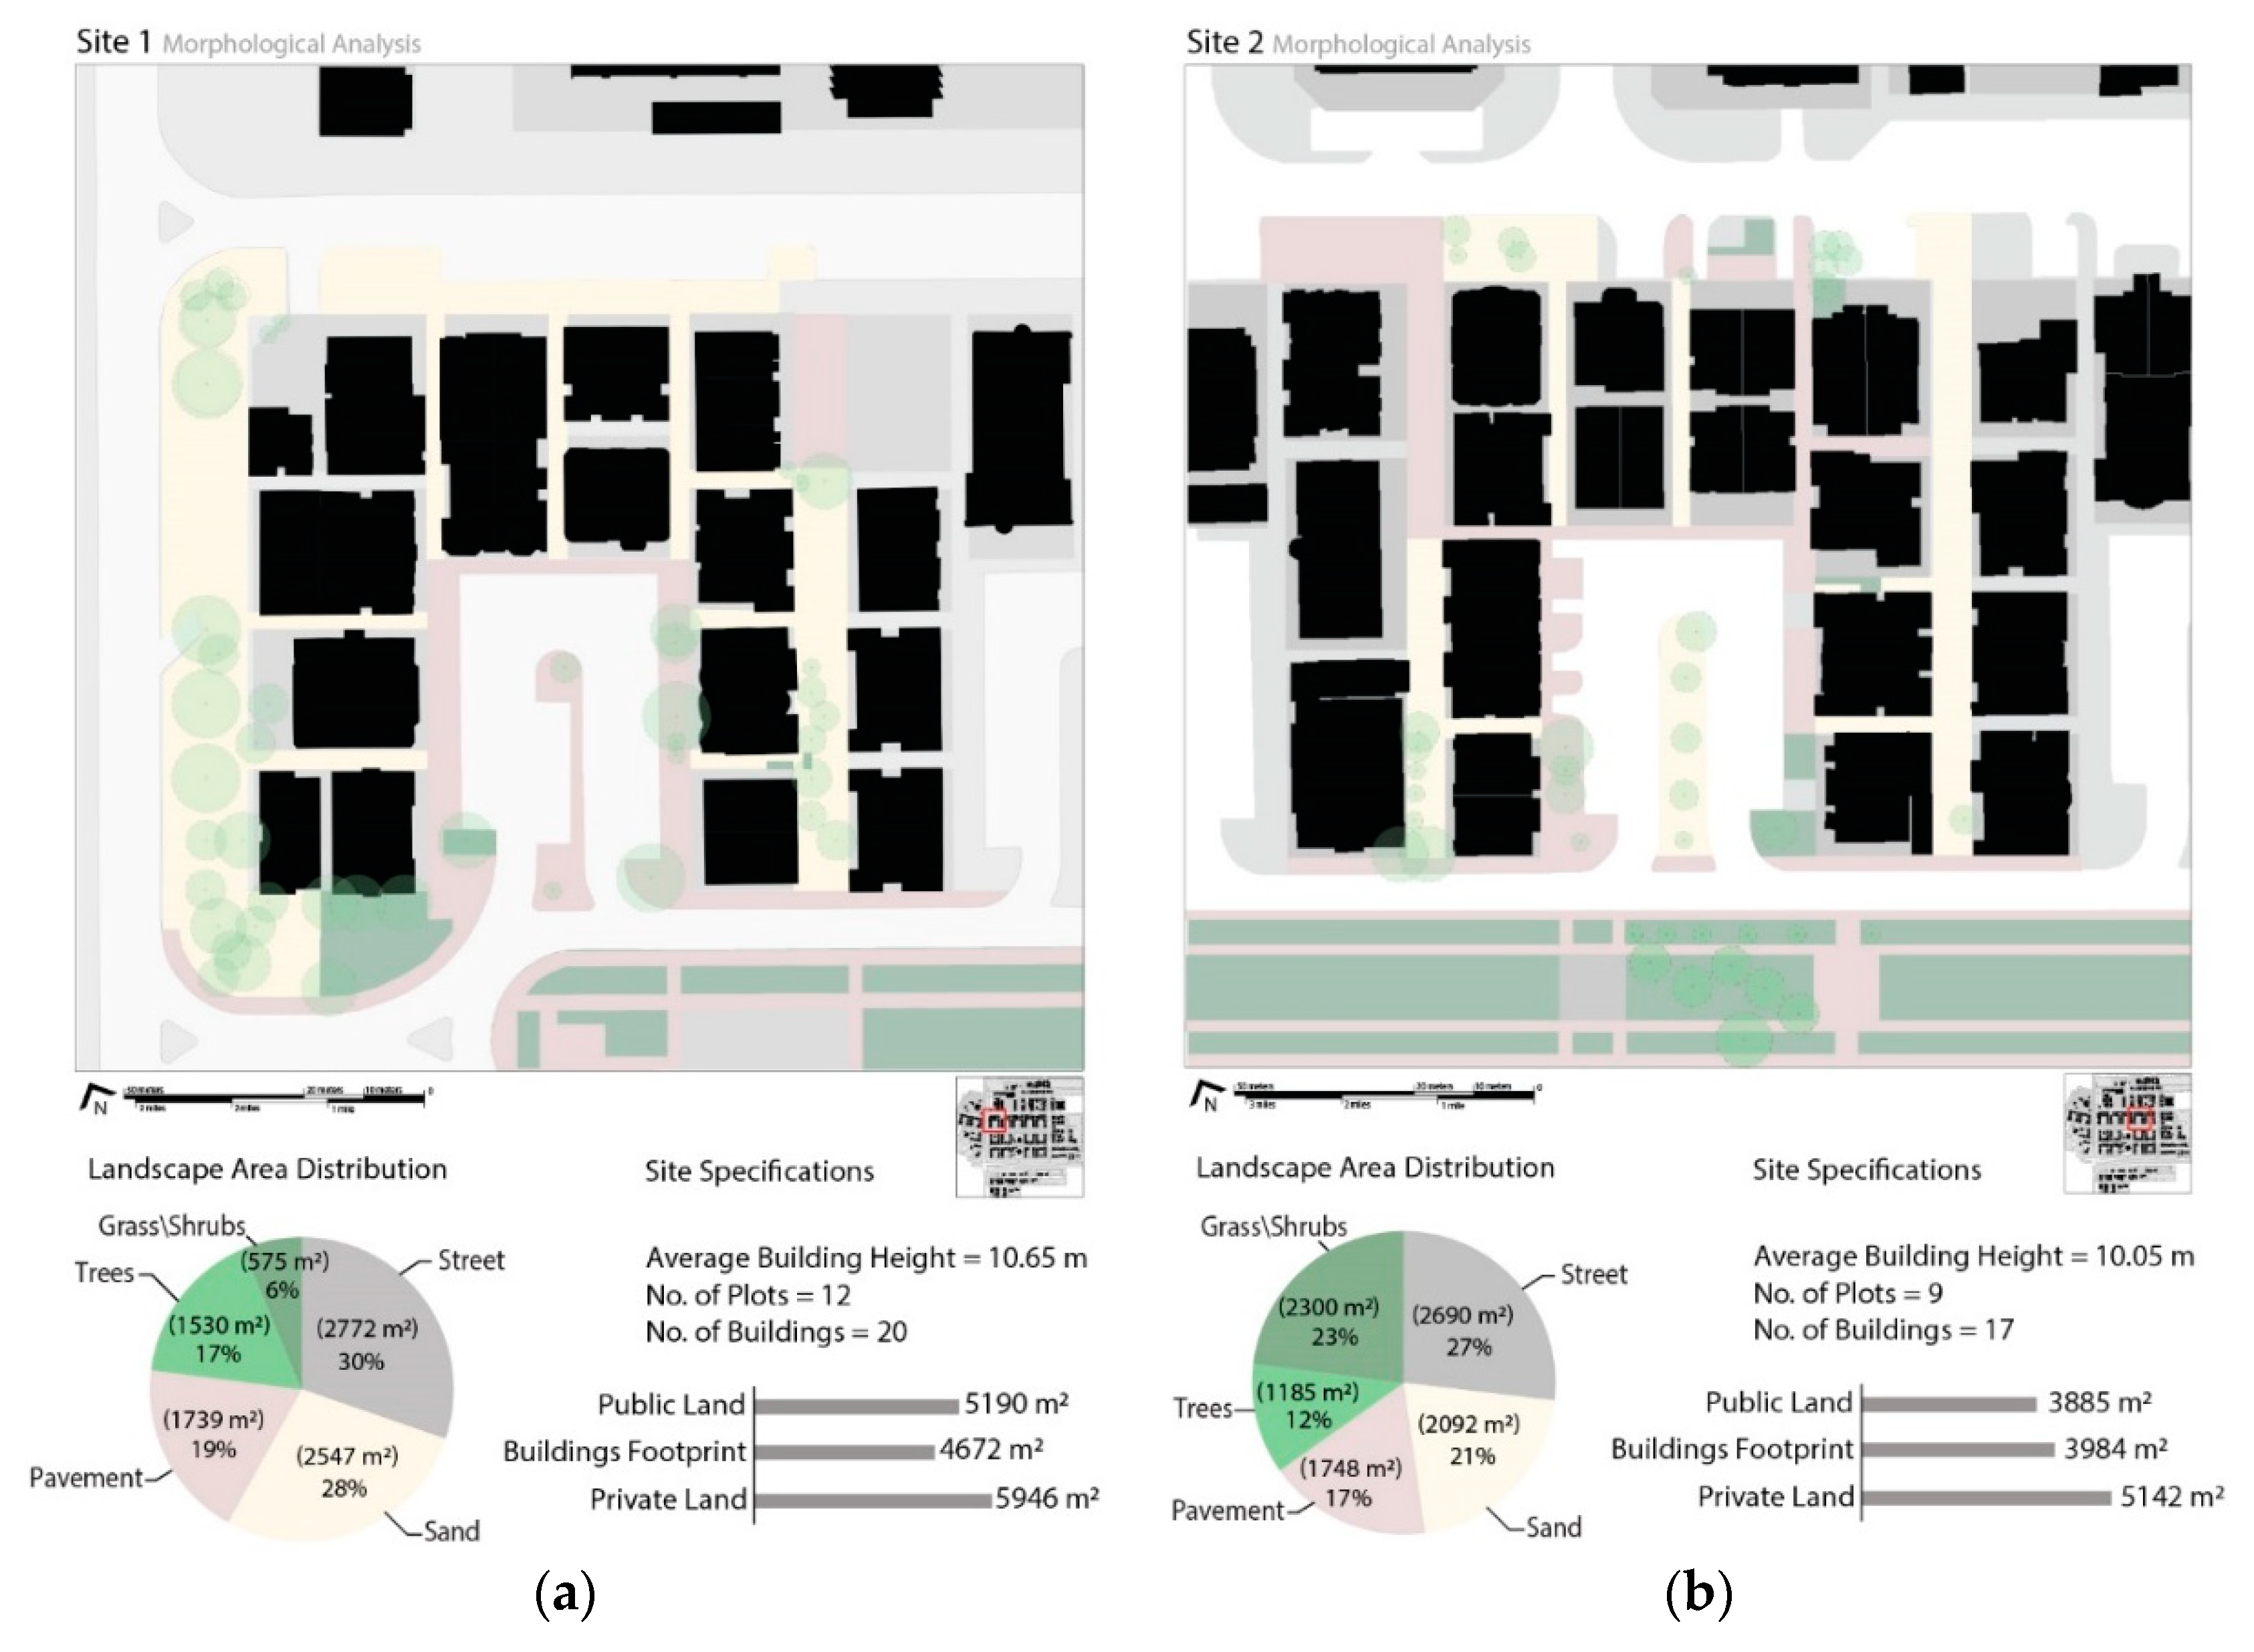
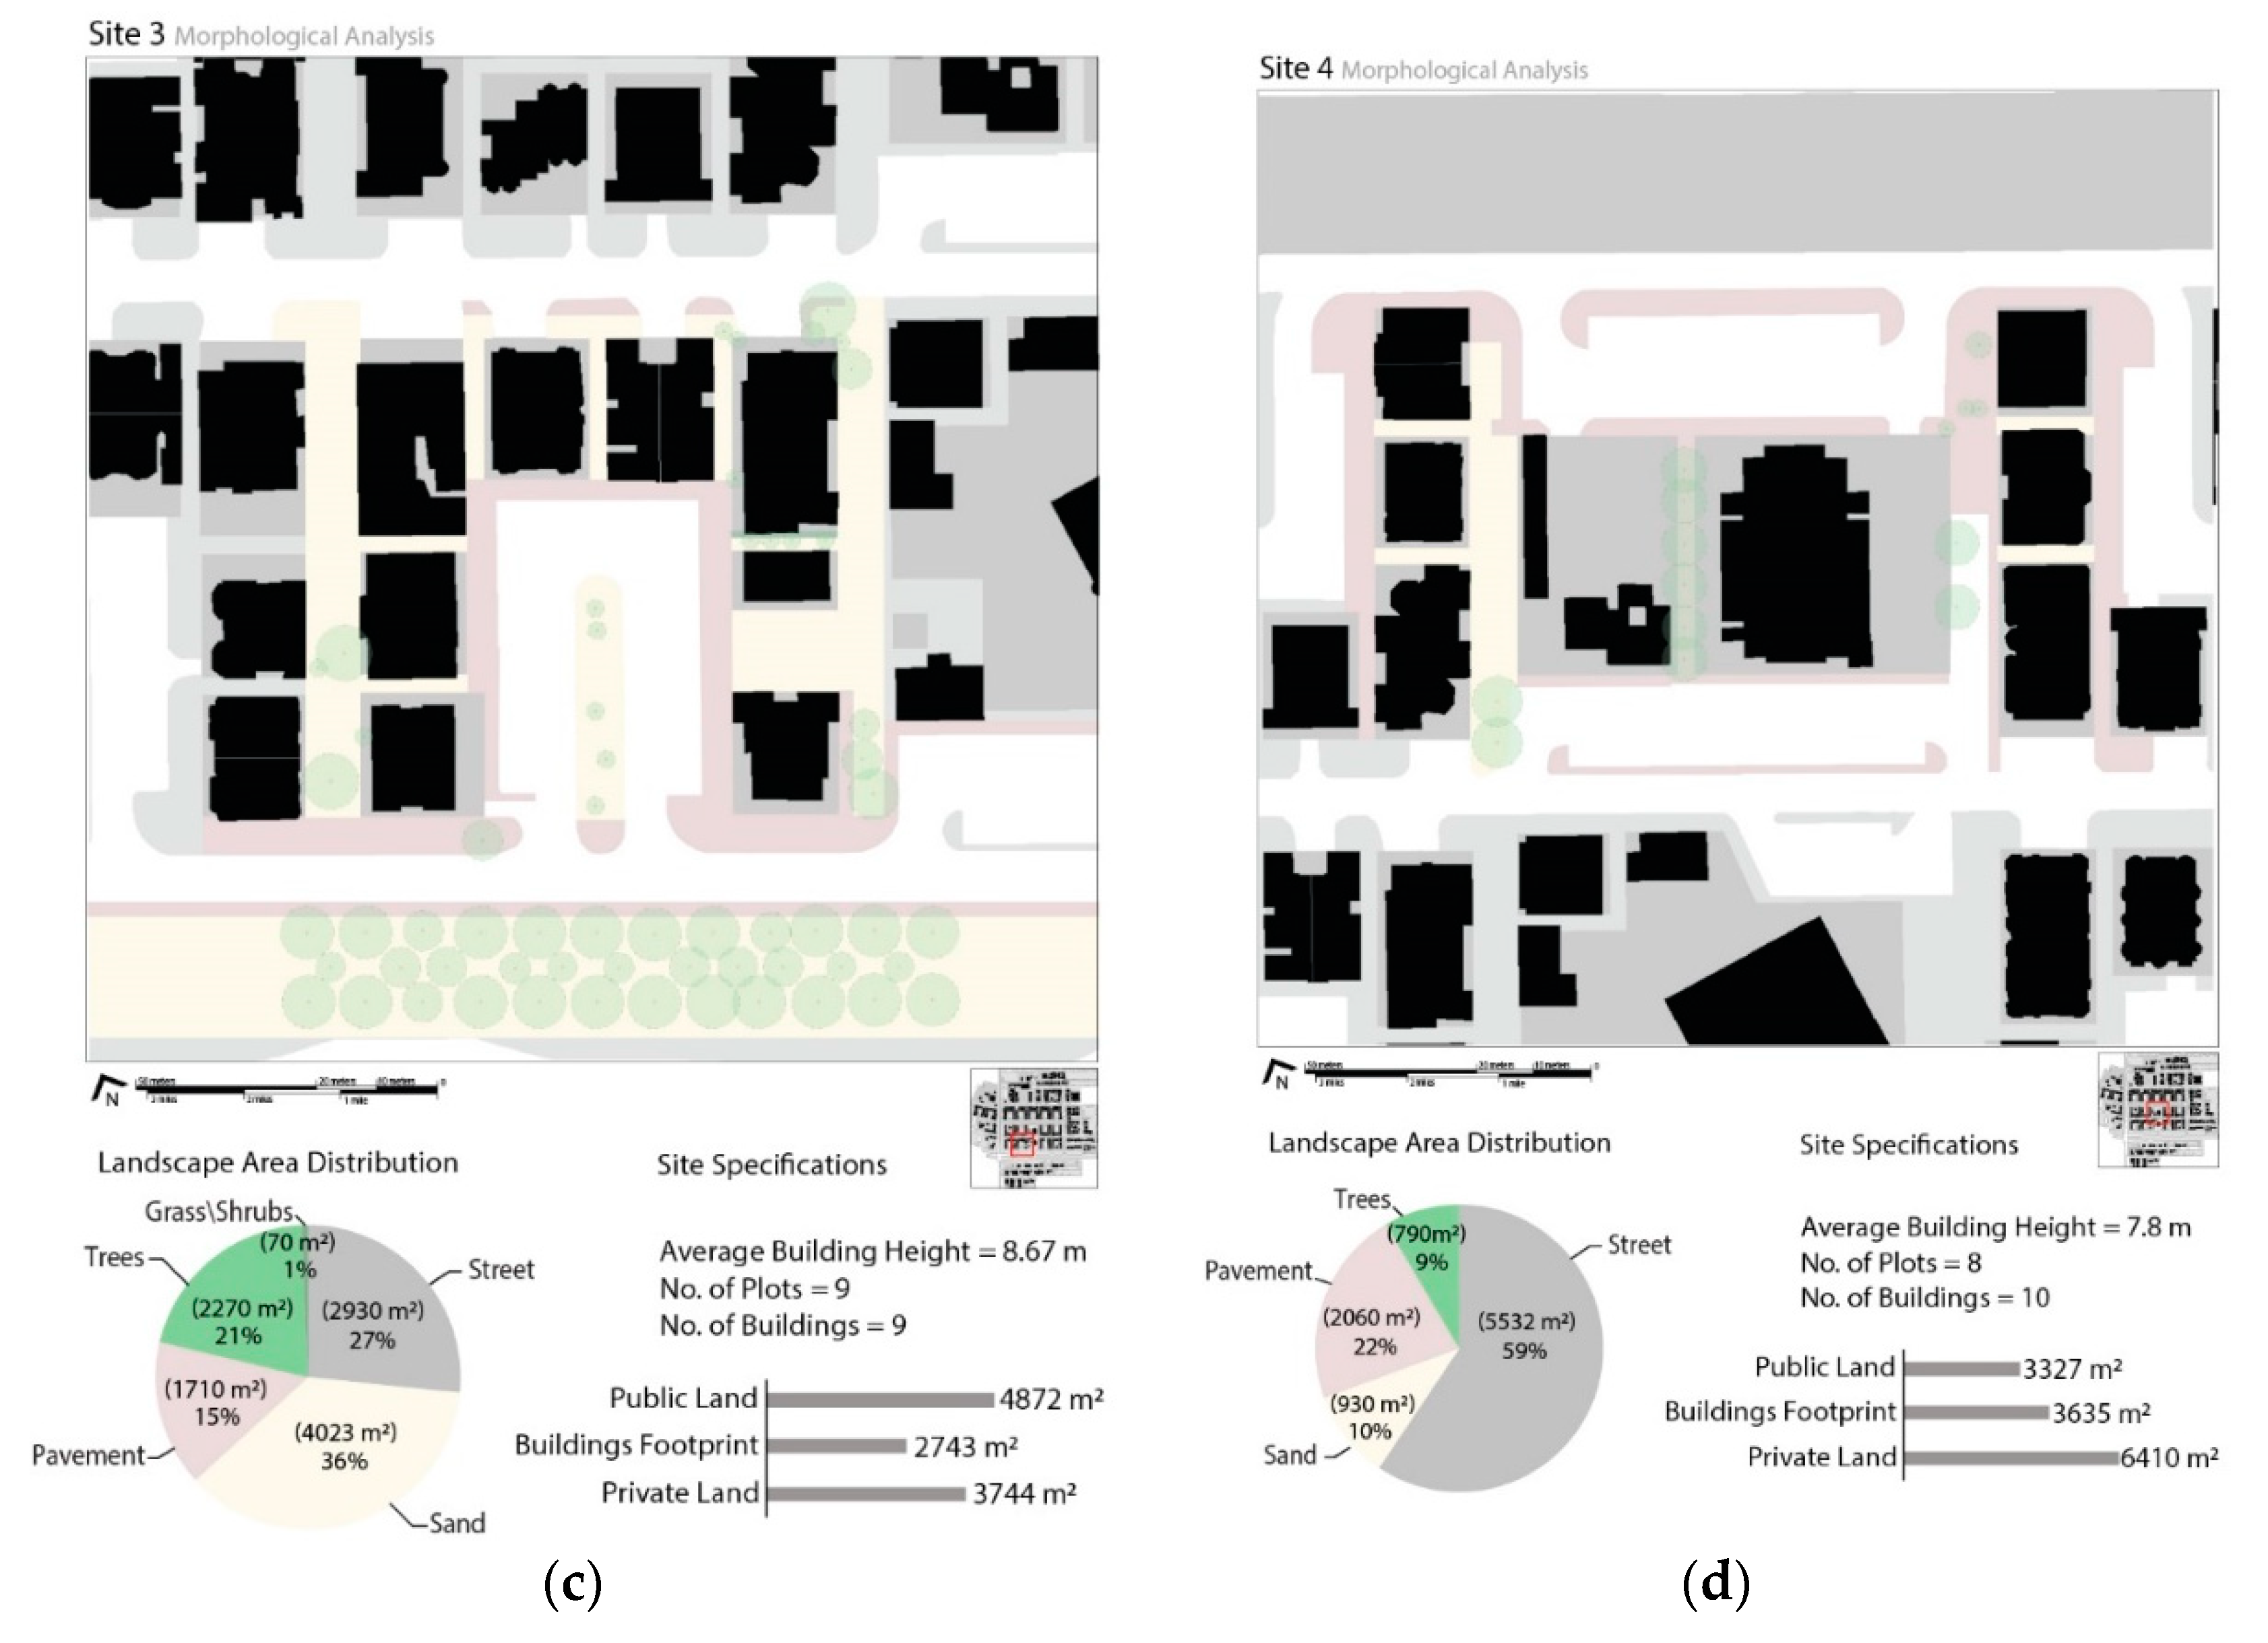
2.1. Study Sites
2.2. Data Collection
2.2.1. Field Measurements
2.2.2. Desktop Work (ENVI-Met Model)
2.2.3. Proposed Scenarios
3. Results
3.1. Existing Scenario and No-Vegetation Scenario
3.2. Analysis of Heat Maps Using Three Heat Regions
3.3. Proposed Scenarios
3.3.1. Site 1
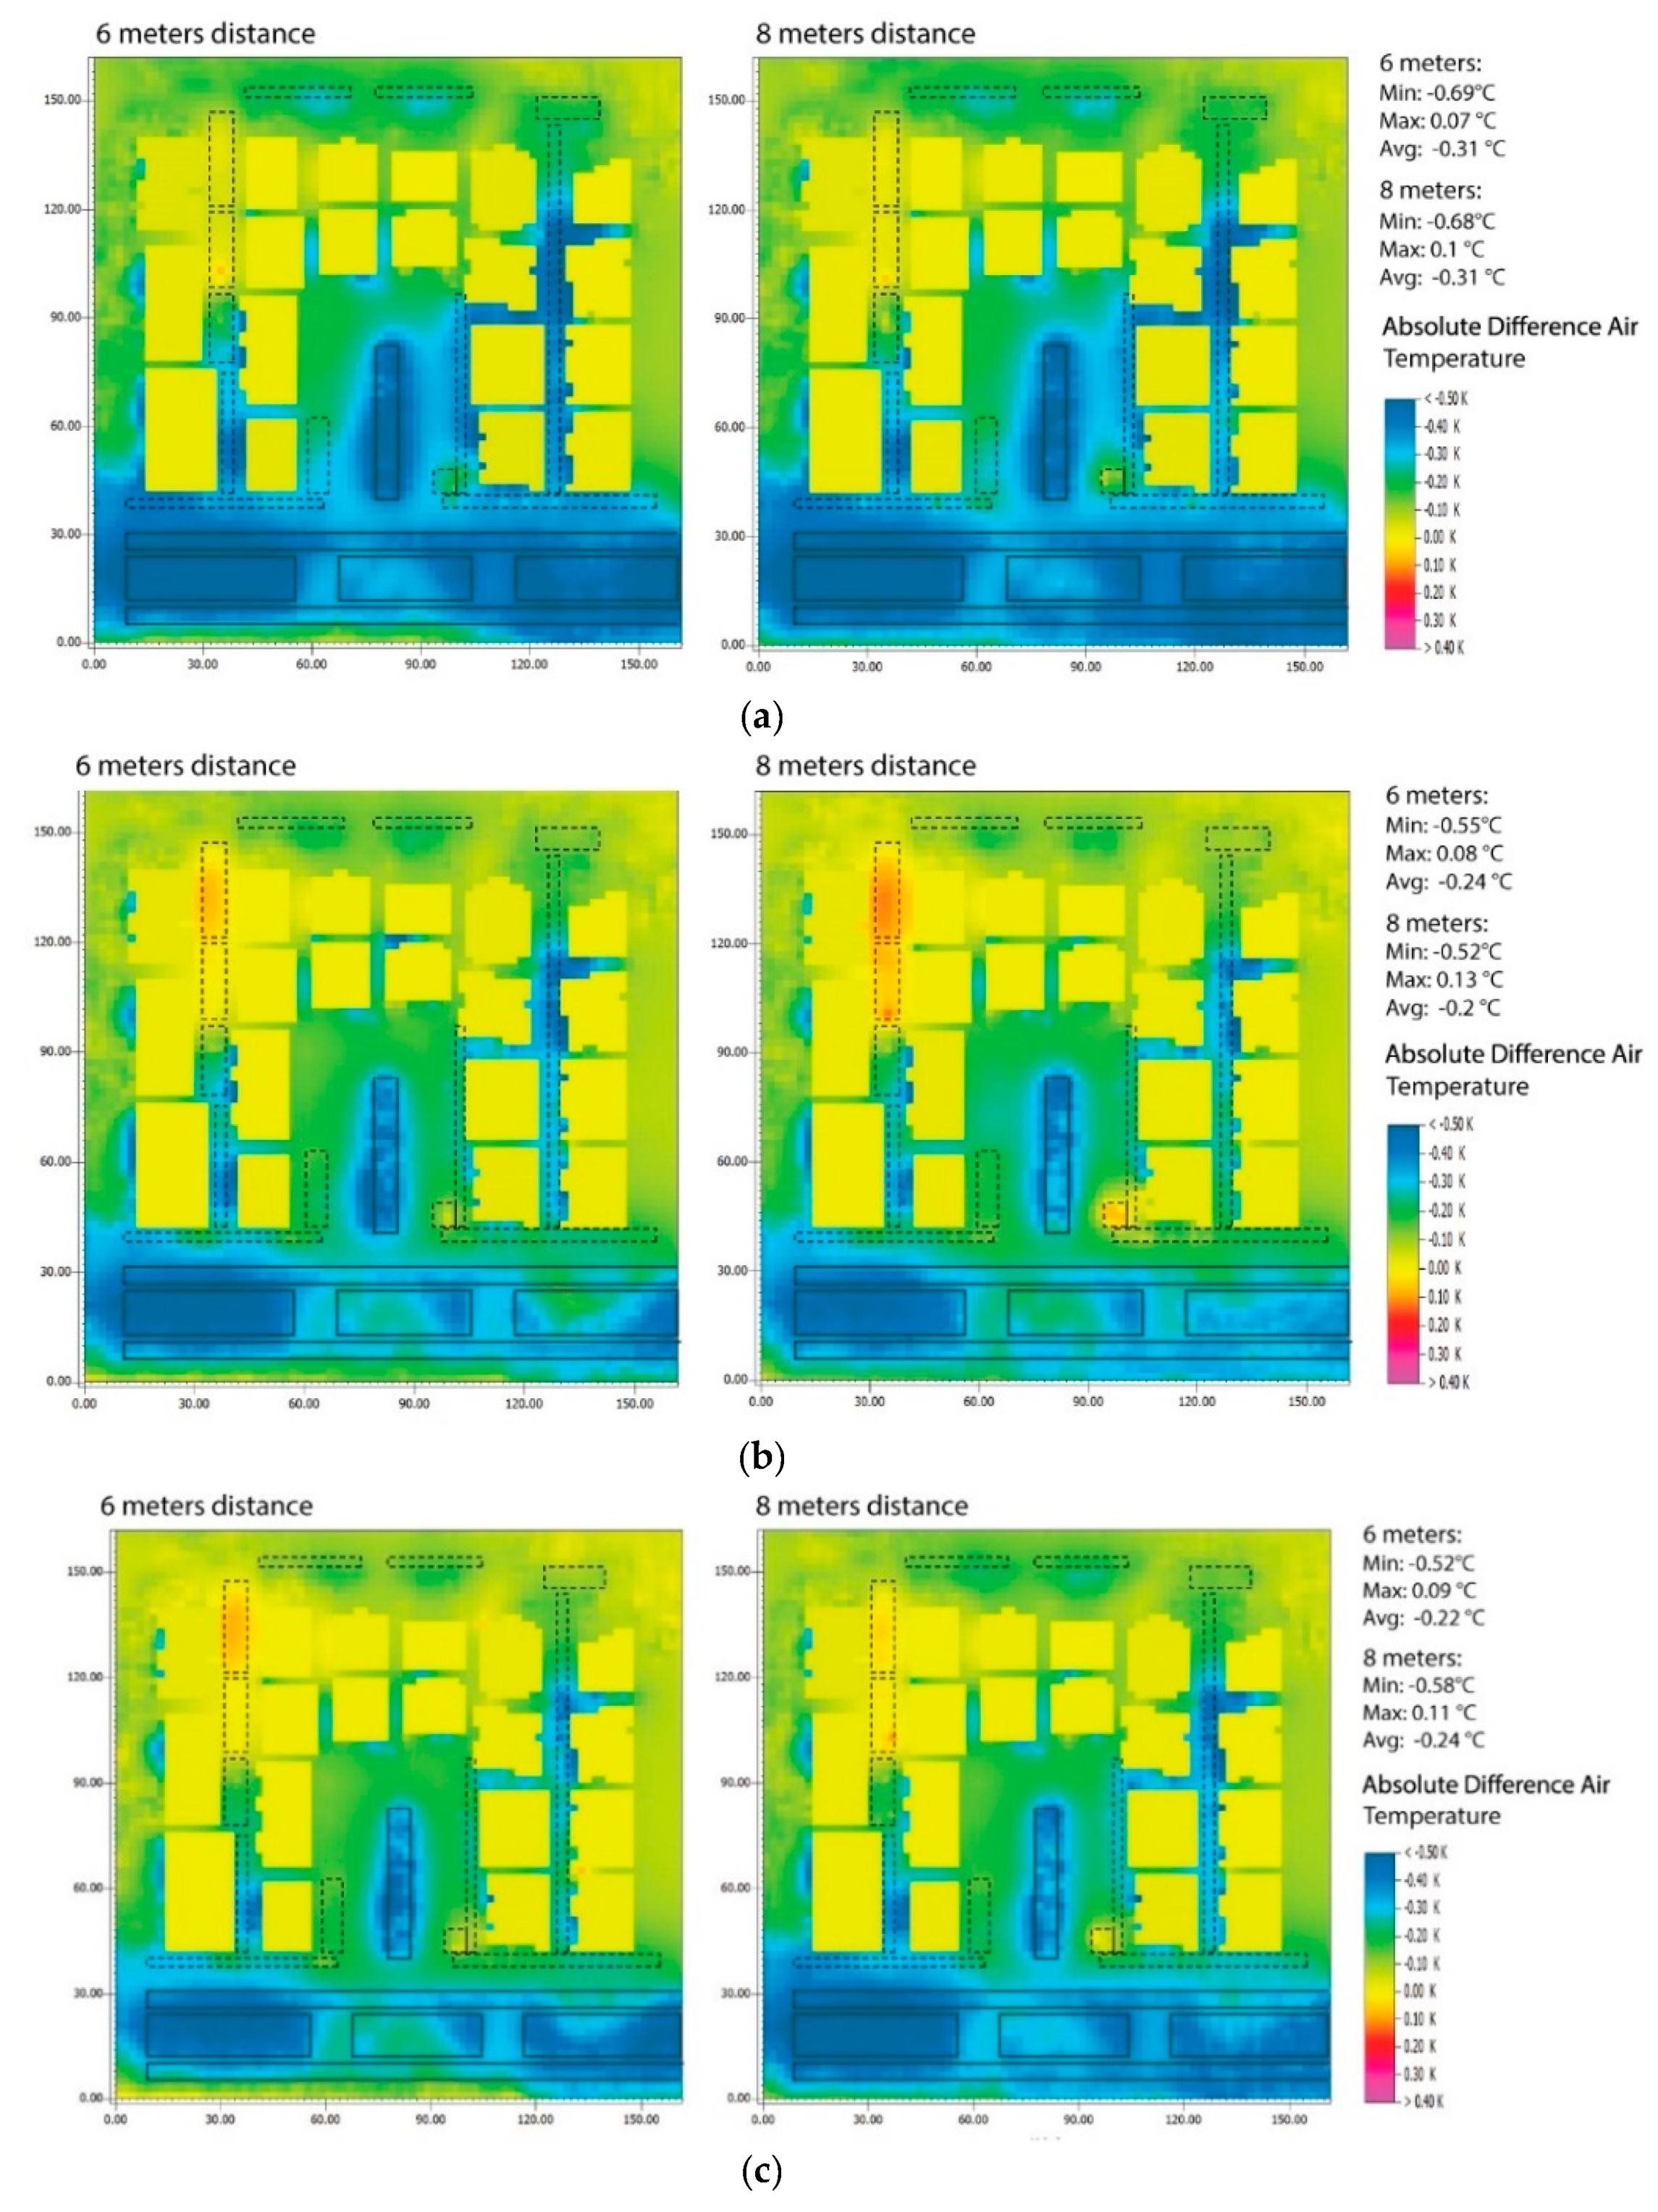
3.3.2. Site 2
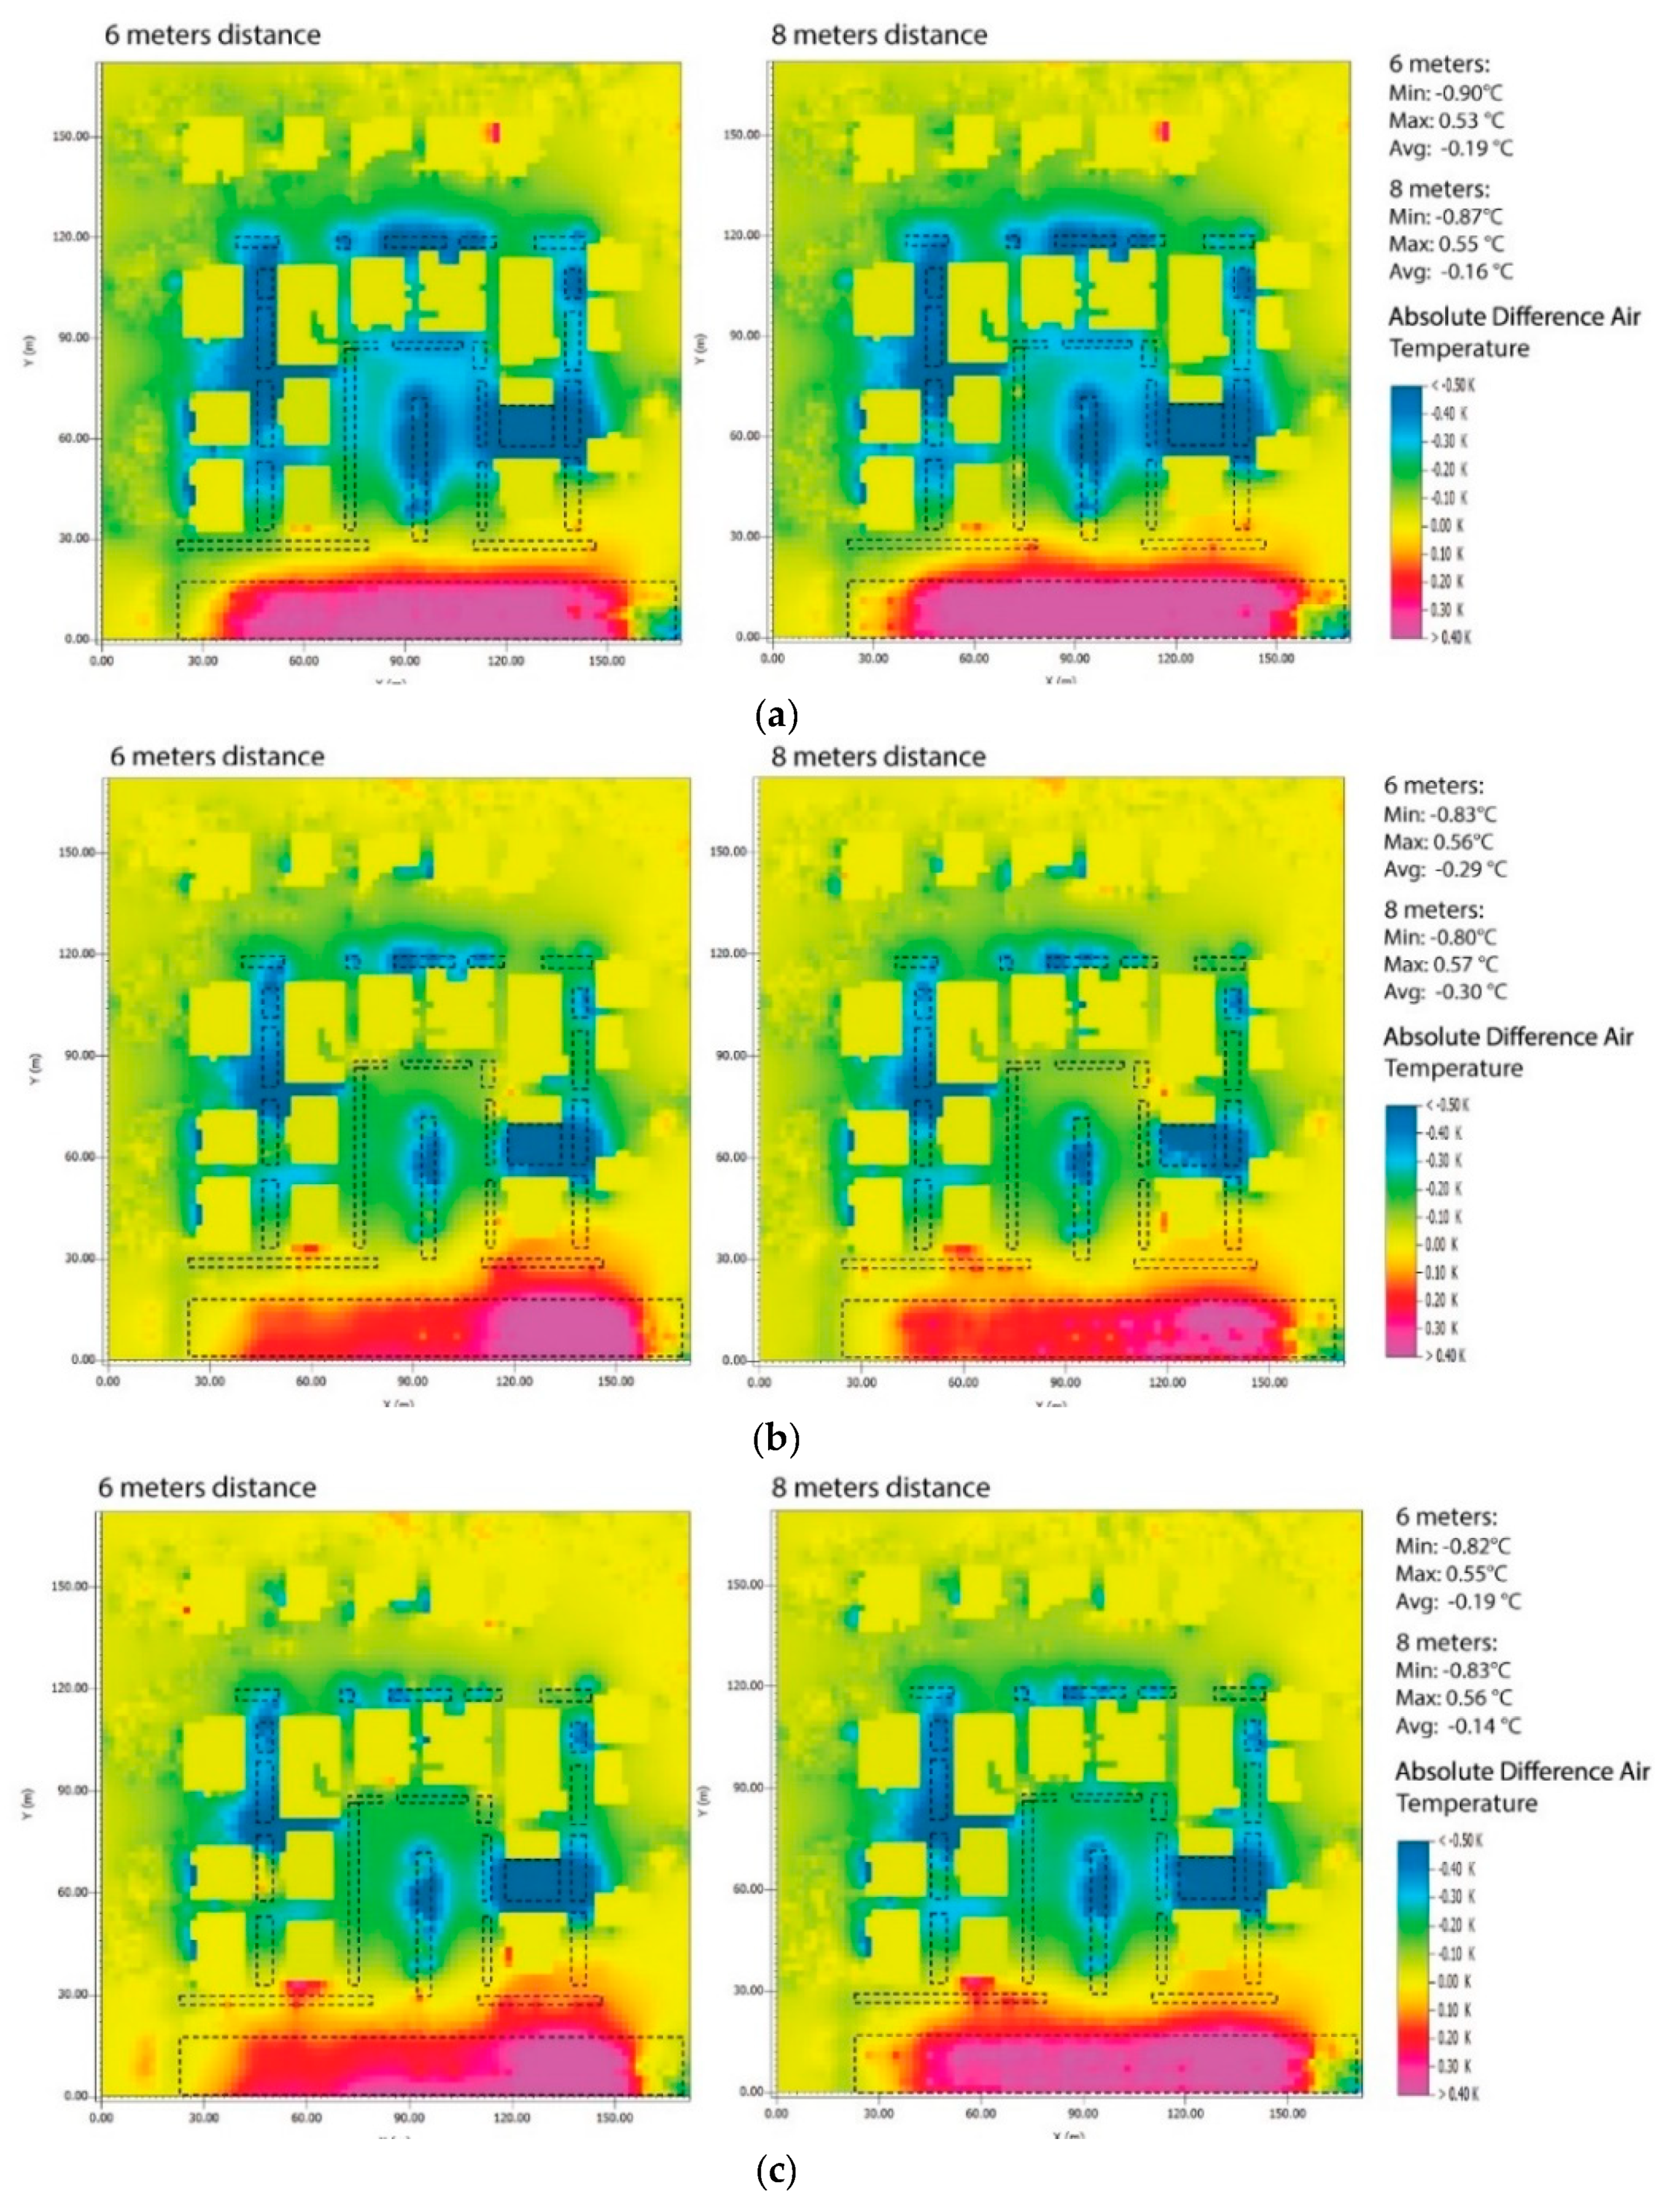
3.3.3. Site 3
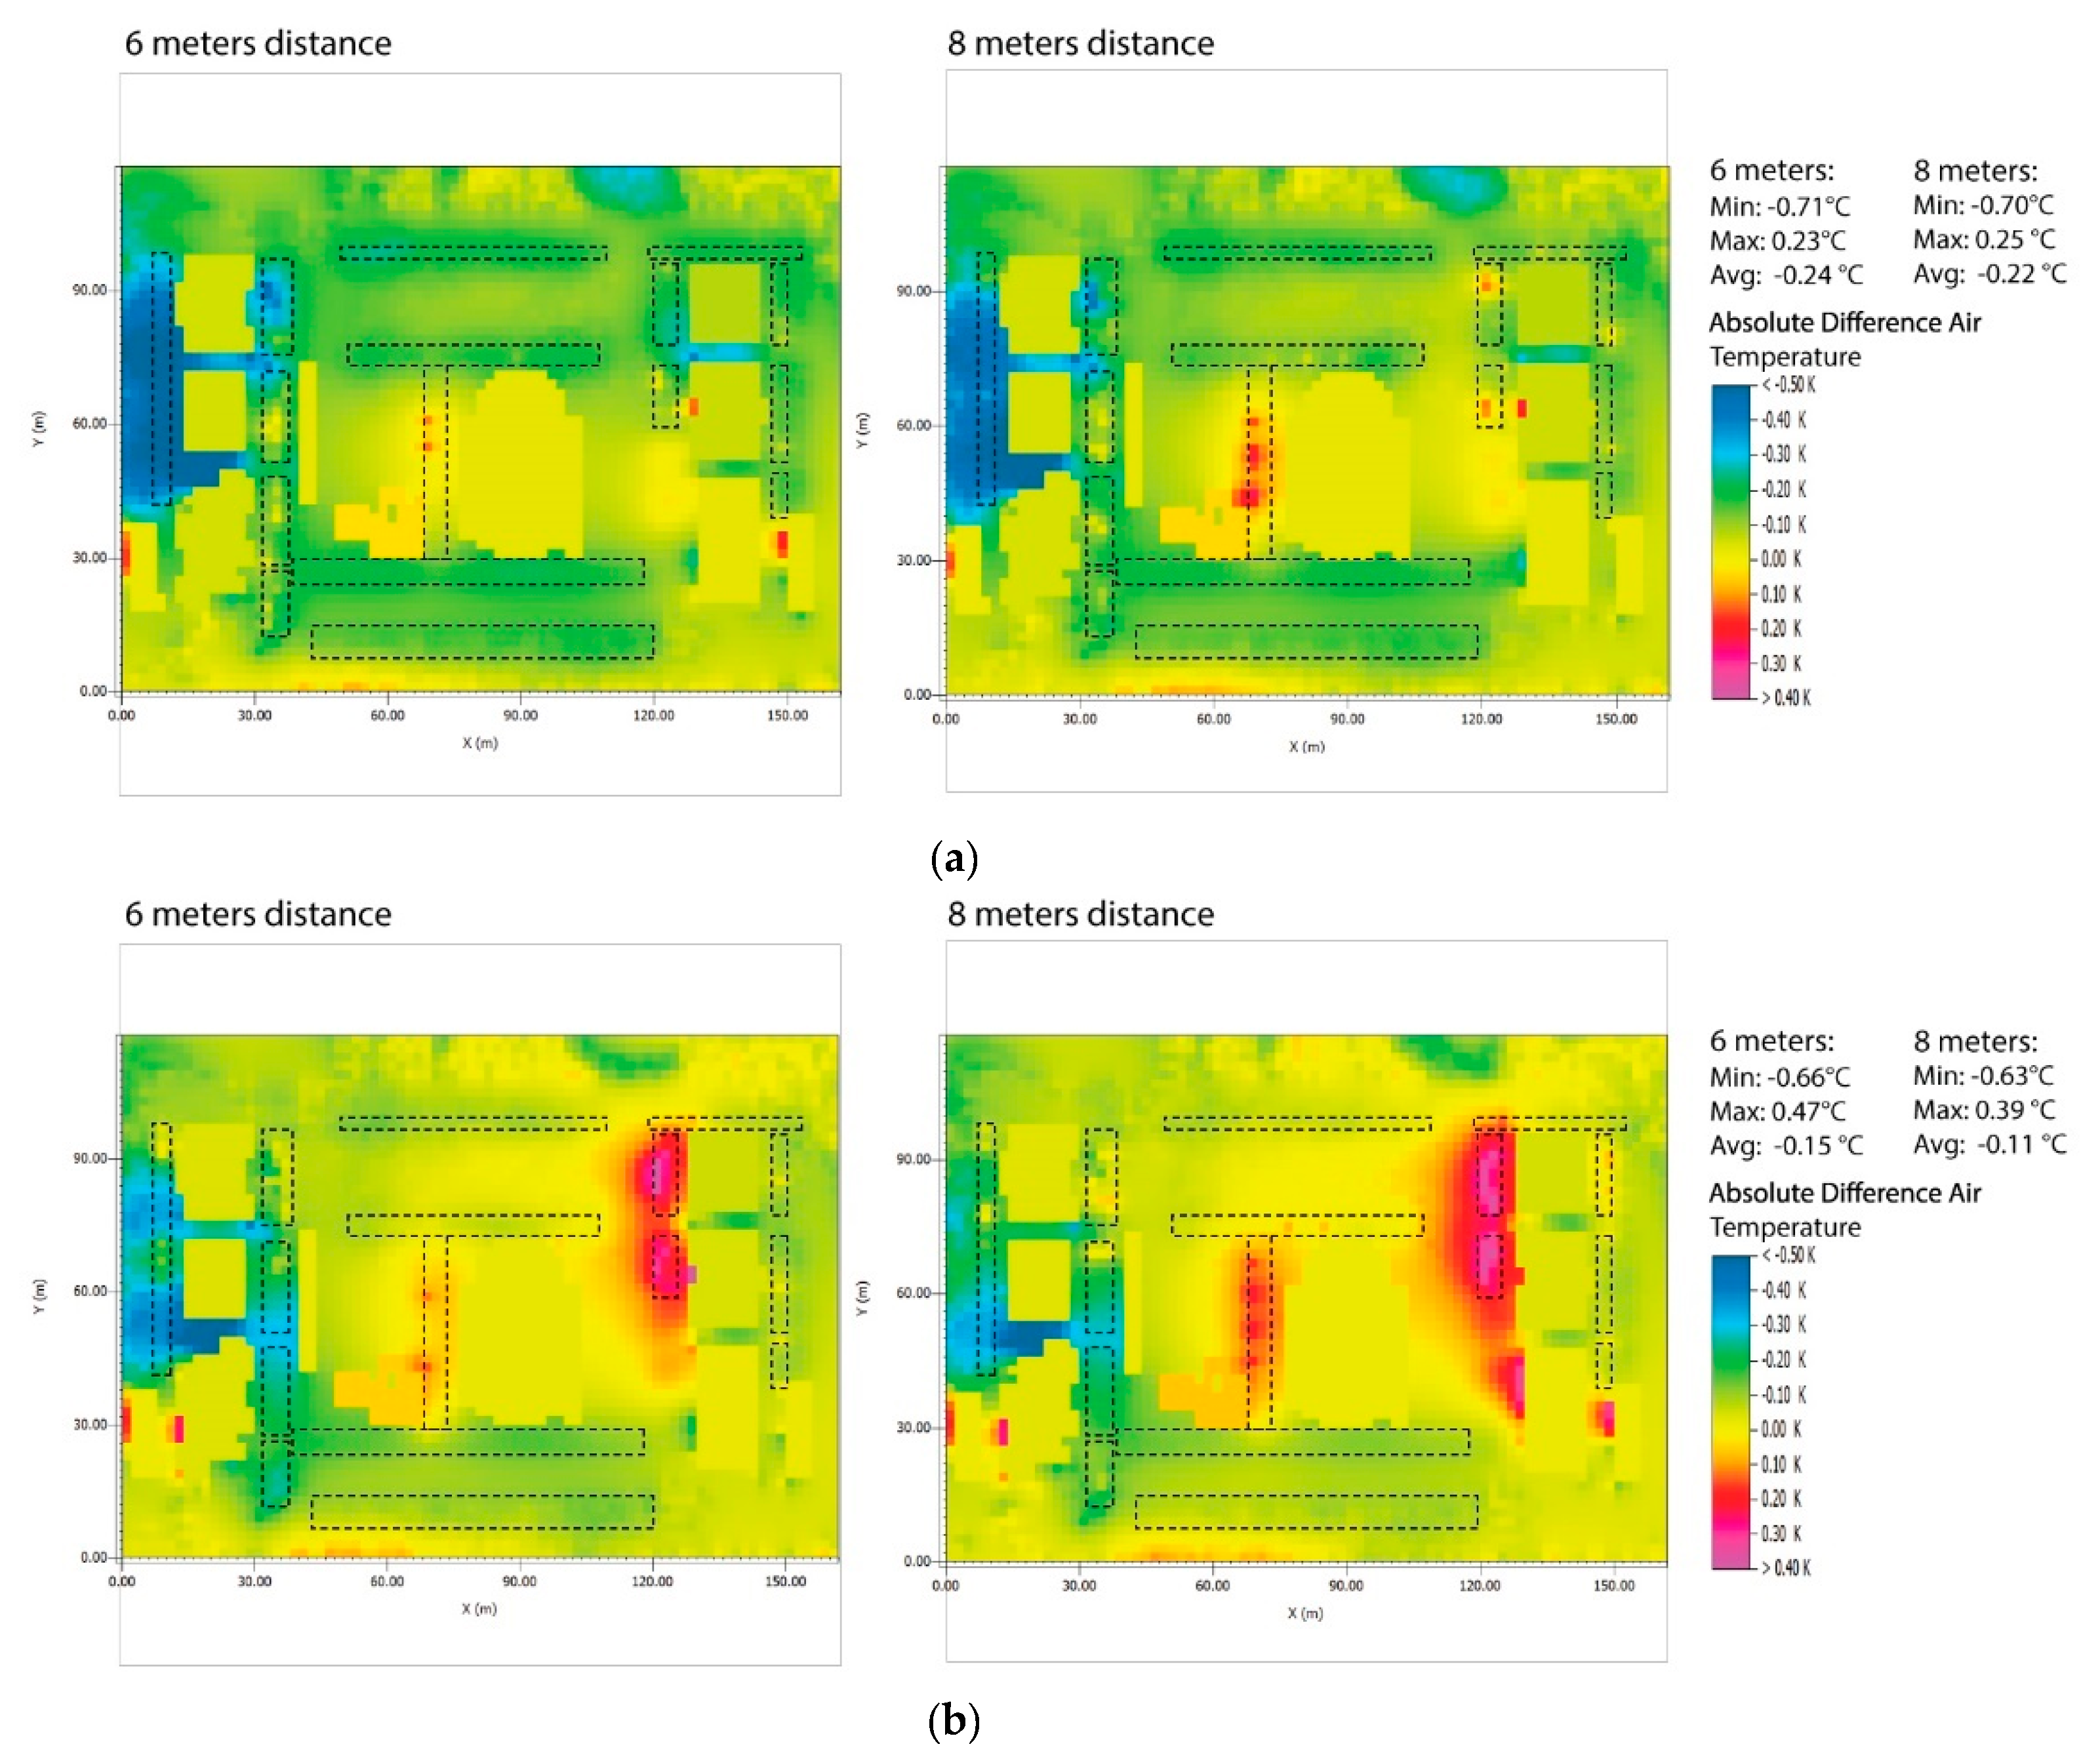
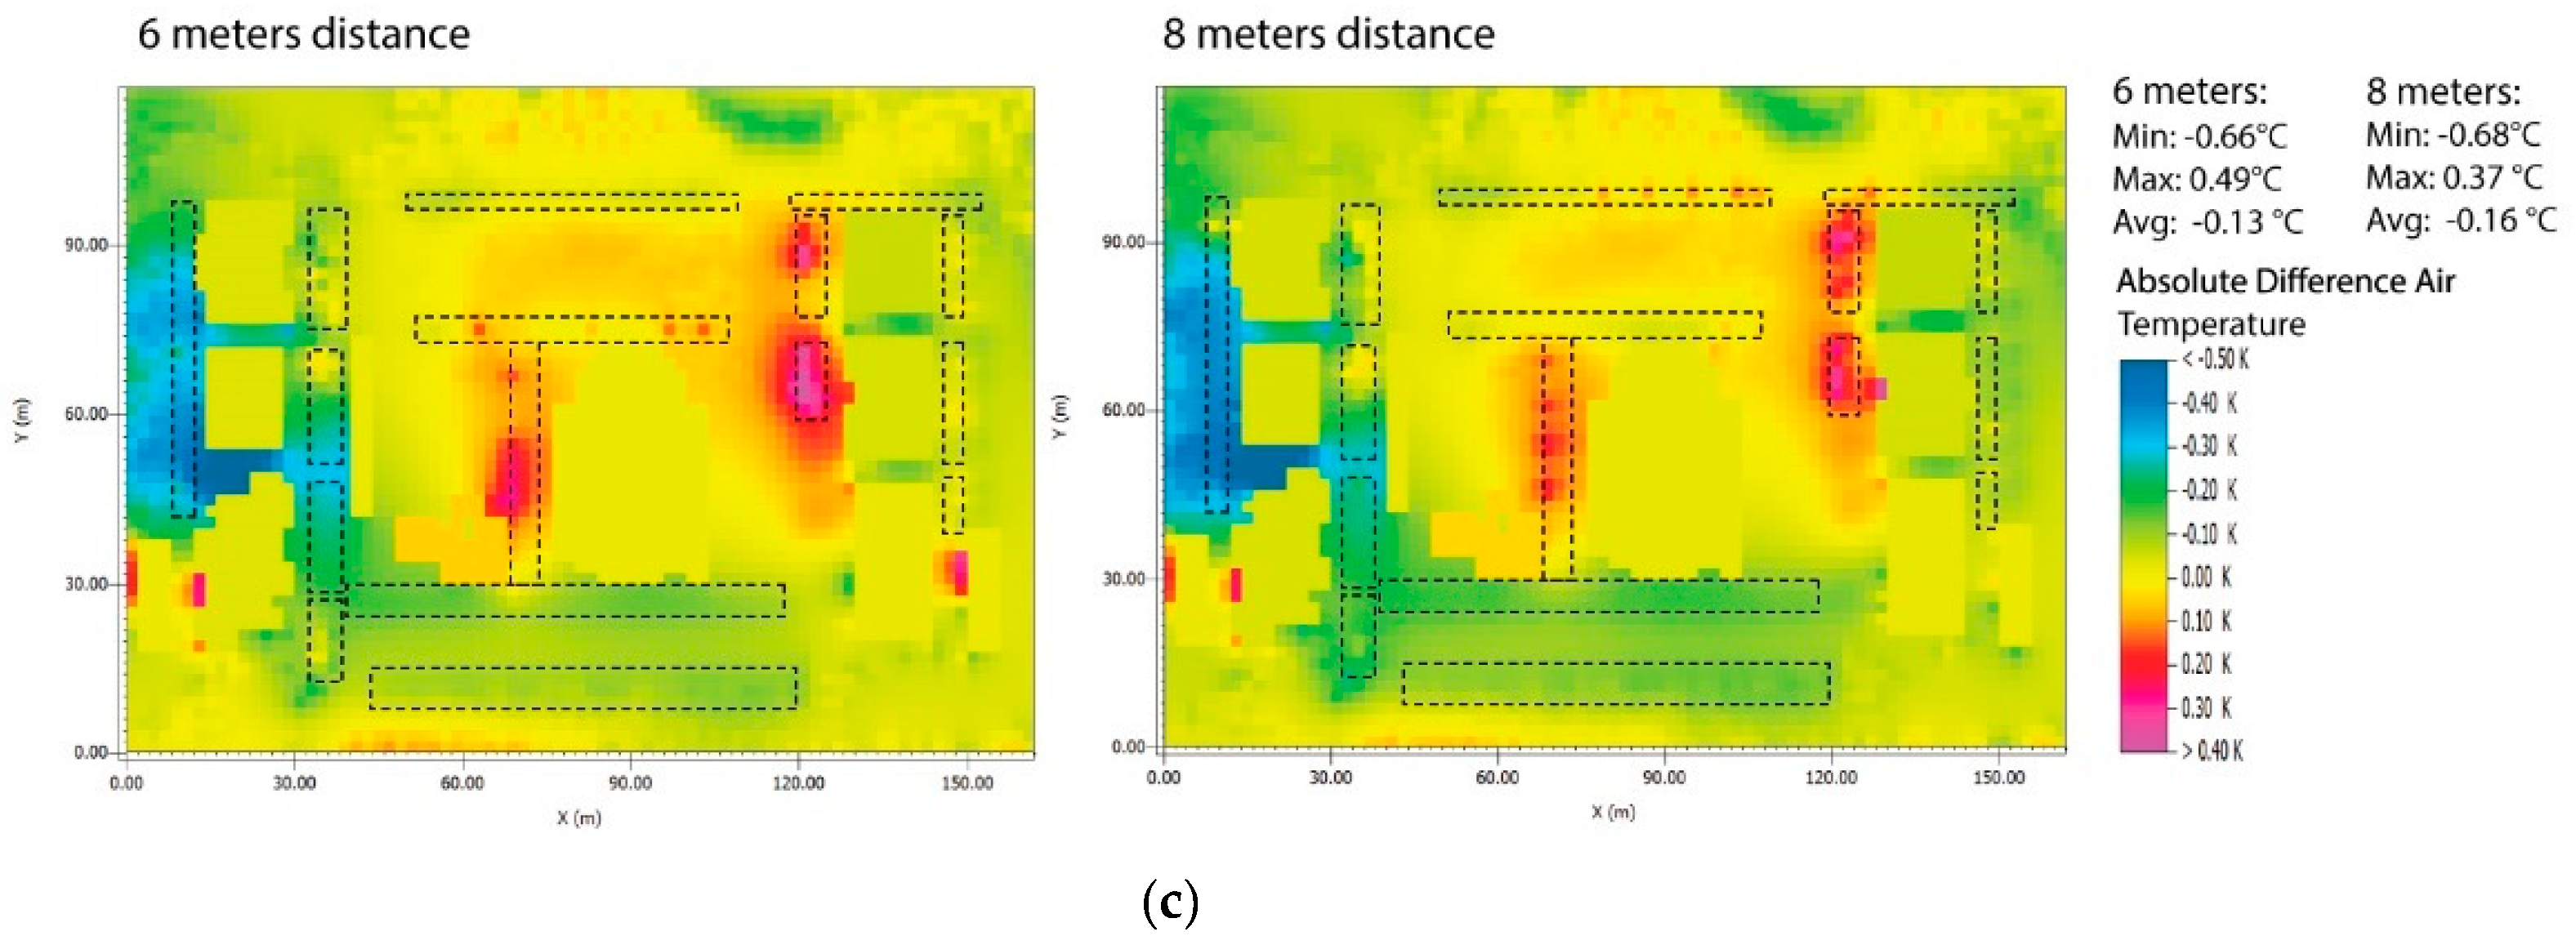
3.3.4. Site 4
4. Discussion
5. Conclusions
Author Contributions
Funding
Institutional Review Board Statement
Informed Consent Statement
Data Availability Statement
Acknowledgments
Conflicts of Interest
Appendix A

| Site 1 (6 m Spacing) | |||||
|---|---|---|---|---|---|
| sum of squares | degree of freedom | Mean square | F | Significance level | |
| Between tree species | 0.0424 | 2 | 0.02118 | 1.34 | 0.05 |
| Within a type of tree | 0.3789 | 24 | 0.01579 | ||
| Total | 0.4213 | ||||
| Site 1 (8 m Spacing) | |||||
| sum of squares | degree of freedom | mean square | F | Significance level | |
| Between tree species | 0.0361 | 2 | 0.01803 | 1.19 | 0.05 |
| Within a type of tree | 0.3626 | 24 | 0.01511 | ||
| Total | 0.3987 | ||||
| Site 2 (6 m Spacing) | |||||
| sum of squares | degree of freedom | Mean square | F | Significance level | |
| Between tree species | 0.0381 | 2 | 0.01907 | 0.37 | 0.05 |
| Within a type of tree | 1.2287 | 24 | 0.05119 | ||
| Total | 1.2668 | ||||
| Site 2 (8 m Spacing) | |||||
| sum of squares | degree of freedom | Mean square | F | Significance level | |
| Between tree species | 0.0258 | 2 | 0.01290 | 0.26 | 0.05 |
| Within a type of tree | 1.2013 | 24 | 0.05005 | ||
| Total | 1.2271 | ||||
| Site 3 (6 m Spacing) | |||||
| sum of squares | degree of freedom | Mean square | F | Significance level | |
| Between tree species | 0.1002 | 2 | 0.05008 | 0.94 | 0.05 |
| Within a type of tree | 1.2751 | 24 | 0.05313 | ||
| Total | 1.3753 | ||||
| Site 3 (8 m Spacing) | |||||
| sum of squares | degree of freedom | Mean square | F | Significance level | |
| Between tree species | 0.0381 | 2 | 0.01905 | 0.36 | 0.05 |
| Within a type of tree | 1.2562 | 24 | 0.05234 | ||
| Total | 1.2943 | ||||
| Site 4 (6 m Spacing) | |||||
| sum of squares | degree of freedom | Mean square | F | Significance level | |
| Between tree species | 0.0517 | 2 | 0.02584 | 0.66 | 0.05 |
| Within a type of tree | 0.9334 | 24 | 0.03889 | ||
| Total | 0.9851 | ||||
| Site 4 (8 m Spacing) | |||||
| sum of squares | degree of freedom | Mean square | F | Significance level | |
| Between tree species | 0.0242 | 2 | 0.01210 | 0.34 | 0.05 |
| Within a type of tree | 0.8644 | 24 | 0.03601 | ||
| Total | 0.8886 | ||||
References
- Santamouris, M. Energy and Climate in the Urban Built Environment; Routledge: London, UK, 2013. [Google Scholar]
- He, B.-J.; Zhao, Z.-Q.; Shen, L.-D.; Wang, H.-B.; Li, L.-G. An approach to examining performances of cool/hot sources in mitigating/enhancing land surface temperature under different temperature backgrounds based on landsat 8 image. Sustain. Cities Soc. 2019, 44, 416–427. [Google Scholar] [CrossRef]
- Yang, J.; Sun, J.; Ge, Q.; Li, X. Assessing the impacts of urbanization-associated green space on urban land surface temperature: A case study of Dalian, China. Urban For. Urban Green. 2017, 22, 1–10. [Google Scholar] [CrossRef]
- Yang, K.; Pan, M.; Luo, Y.; Chen, K.; Zhao, Y.; Zhou, X. A time-series analysis of urbanization-induced impervious surface area extent in the Dianchi Lake watershed from 1988–2017. Int. J. Remote Sens. 2019, 40, 573–592. [Google Scholar] [CrossRef]
- Akbari, H.; Pomerantz, M.; Taha, H. Cool surfaces and shade trees to reduce energy use and improve air quality in urban areas. Sol. Energy 2001, 70, 295–310. [Google Scholar] [CrossRef]
- Santamouris, M.; Papanikolaou, N.; Livada, I.; Koronakis, I.; Georgakis, C.; Argiriou, A.; Assimakopoulos, D. On the impact of urban climate on the energy consumption of buildings. Sol. Energy 2001, 70, 201–216. [Google Scholar] [CrossRef]
- Wong, E.; Akbari, H.; Bell, R.; Cole, D. Reducing urban heat islands: Compendium of strategies. Environ. Prot. Agency 2011, 12, 2011. [Google Scholar]
- Abaas, Z.R. Impact of development on Baghdad’s urban microclimate and human thermal comfort. Alex. Eng. J. 2020, 59, 275–290. [Google Scholar] [CrossRef]
- Chatzinikolaou, E.; Chalkias, C.; Dimopoulou, E. Urban Microclimate Improvement Using Envi-Met Climate Model. Int. Arch. Photogramm. Remote Sens. Spat. Inf. Sci. 2018, 42, 69–76. [Google Scholar] [CrossRef] [Green Version]
- Sailor, D.J. Mitigation of urban heat islands—Recent progress and future prospects. In Proceedings of the 6th Symposium on the Urban Environment and Forum on Managing our Physical and Natural Resources, Atlanta, GA, USA, 31 January 2006. [Google Scholar]
- Gago, E.J.; Roldan, J.; Pacheco-Torres, R.; Ordóñez, J. The city and urban heat islands: A review of strategies to mitigate adverse effects. Renew. Sustain. Energy Rev. 2013, 25, 749–758. [Google Scholar] [CrossRef]
- Dimoudi, A.; Nikolopoulou, M. Vegetation in the urban environment: Microclimatic analysis and benefits. Energy Build. 2003, 35, 69–76. [Google Scholar] [CrossRef] [Green Version]
- Robitu, M.; Musy, M.; Inard, C.; Groleau, D. Modeling the influence of vegetation and water pond on urban microclimate. Sol. Energy 2006, 80, 435–447. [Google Scholar] [CrossRef]
- Shashua-Bar, L.; Hoffman, M.E. Vegetation as a climatic component in the design of an urban street: An empirical model for predicting the cooling effect of urban green areas with trees. Energy Build. 2000, 31, 221–235. [Google Scholar] [CrossRef]
- Givoni, B. Urban Design in Different Climates; WMO: Geneva, Switzerland, 1989. [Google Scholar]
- Honjo, T.; Takakura, T. Simulation of thermal effects of urban green areas on their surrounding areas. Energy Build. 1990, 15, 443–446. [Google Scholar] [CrossRef]
- Aboelata, A.; Sodoudi, S. Evaluating the effect of trees on UHI mitigation and reduction of energy usage in different built up areas in Cairo. Build. Environ. 2020, 168, 106490. [Google Scholar] [CrossRef]
- Taleb, H. Effect of Adding Vegetation and Applying a Plants Buffer on Urban Community in Dubai. Spaces Flows 2016, 7, 37–49. [Google Scholar] [CrossRef]
- Radhi, H. On the Effect of Global Warming and the UAE Built Environment; Harris, S.A., Ed.; Sciyo: Rijeka, Croatia, 2010; pp. 95–110. [Google Scholar]
- Abu Dhabi Department of Planning and Municipalities. Public Realm Design Manual; District Department of Transportation: Washington, DC, USA, 2010; pp. 142–215. [Google Scholar]
- Bowler, D.; Buyung-Ali, L.; Knight, T.; Pullin, A. How effective is ‘greening’of urban areas in reducing human exposure to ground level ozone concentrations, UV exposure and the ‘urban heat island effect’. CEE Rev. 2010, 8, 3. [Google Scholar]
- Givoni, B. Impact of planted areas on urban environmental quality: A review. Atmos. Environ. Part B Urban Atmos. 1991, 25, 289–299. [Google Scholar] [CrossRef]
- Emmanuel, R.; Rosenlund, H.; Johansson, E. Urban shading—a design option for the tropics? A study in Colombo, Sri Lanka. Int. J. Climatol. 2007, 27, 1995–2004. [Google Scholar] [CrossRef] [Green Version]
- Taleb, D.; Abu-Hijleh, B. Urban heat islands: Potential effect of organic and structured urban configurations on temperature variations in Dubai, UAE. Renew. Energy 2013, 50, 747–762. [Google Scholar] [CrossRef]
- De Abreu-Harbich, L.V.; Labaki, L.C.; Matzarakis, A. Effect of tree planting design and tree species on human thermal comfort in the tropics. Landsc. Urban Plann. 2015, 138, 99–109. [Google Scholar] [CrossRef]
- Simon, H. Modeling Urban Microclimate: Development, Implementation and Evaluation of New and Improved Calculation Methods for the Urban Microclimate Model ENVI-Met; Universitätsbibliothek Mainz: Mainz, Germany, 2016. [Google Scholar]
- Sanusi, R.; Johnstone, D.; May, P.; Livesley, S.J. Microclimate benefits that different street tree species provide to sidewalk pedestrians relate to differences in Plant Area Index. Landsc. Urban Plann. 2017, 157, 502–511. [Google Scholar] [CrossRef]
- Francis, J.K.; Parresol, B.R.; de Patino, J.M. Probability of damage to sidewalks and curbs by street trees in the tropics. J. Arborculture 1996, 22, 193–197. [Google Scholar]
- Gusson, C.S.; Duarte, D.H. Effects of built density and urban morphology on urban microclimate-calibration of the model ENVI-met V4 for the subtropical Sao Paulo, Brazil. Procedia Eng. 2016, 169, 2–10. [Google Scholar] [CrossRef]
- Alobaydi, D.; Bakarman, M.A.; Obeidat, B. The impact of urban form configuration on the urban heat island: The case study of Baghdad, Iraq. Procedia Eng. 2016, 145, 820–827. [Google Scholar] [CrossRef]
- Jubran, I.K.; Hizon, D.V. Landscape Plants in the Arab Gulf Countries; Floraprint KSA & Gulf: Jeddah, Saudi Arabia, 1999. [Google Scholar]
- Spatial Networks Inc. Fulcrum App. Available online: https://www.fulcrumapp.com/ (accessed on 30 May 2019).
- Ng, E.; Chen, L.; Wang, Y.; Yuan, C. A study on the cooling effects of greening in a high-density city: An experience from Hong Kong. Build. Envrion. 2012, 47, 256–271. [Google Scholar] [CrossRef]
- Awadi, M.A. Local Environment Plants Used in Landscaping and Horticultural Beautification Projects in the Emirate of Dubai; Public Parks & Horticulture Department, Dubai Muncipalty: Dubai, United Arab Emerites, 2008. [Google Scholar]
- Yahia, M.W.; Johansson, E.; Thorsson, S.; Lindberg, F.; Rasmussen, M.I. Effect of urban design on microclimate and thermal comfort outdoors in warm-humid Dar es Salaam, Tanzania. Int. J. Biometeorol. 2018, 62, 373–385. [Google Scholar] [CrossRef] [Green Version]
- Bruse, M. Modelling and strategies for improved urban climates. In Proceedings of the International Conference on Urban Climatology & International Congress of Biometeorology, Sydney, Australia, 8 November 1999; pp. 8–12. [Google Scholar]
- Takebayashi, H.; Moriyama, M. Study on the urban heat island mitigation effect achieved by converting to grass-covered parking. Sol. Energy 2009, 83, 1211–1223. [Google Scholar] [CrossRef] [Green Version]
- Srivanit, M.; Hokao, K. Evaluating the cooling effects of greening for improving the outdoor thermal environment at an institutional campus in the summer. Build. Environ. 2013, 66, 158–172. [Google Scholar] [CrossRef]
- Ali-Toudert, F.; Mayer, H. Effects of asymmetry, galleries, overhanging facades and vegetation on thermal comfort in urban street canyons. Sol. Energy 2007, 81, 742–754. [Google Scholar] [CrossRef]
- Tan, Z.; Lau, K.K.-L.; Ng, E. Urban tree design approaches for mitigating daytime urban heat island effects in a high-density urban environment. Energy Build. 2016, 114, 265–274. [Google Scholar] [CrossRef]
- Tan, Z.; Lau, K.K.-L.; Ng, E. Planning strategies for roadside tree planting and outdoor comfort enhancement in subtropical high-density urban areas. Build. Environ. 2017, 120, 93–109. [Google Scholar] [CrossRef]
- Giridharan, R.; Lau, S.; Ganesan, S.; Givoni, B. Lowering the outdoor temperature in high-rise high-density residential developments of coastal Hong Kong: The vegetation influence. Build. Environ. 2008, 43, 1583–1595. [Google Scholar] [CrossRef]
- Wang, Y.; Berardi, U.; Akbari, H. Comparing the effects of urban heat island mitigation strategies for Toronto, Canada. Energy Build. 2016, 114, 2–19. [Google Scholar] [CrossRef]
- Onset. HOBO MX1101-Temp/RH Bluetooth Data Logger. 2020. Available online: https://www.hobodataloggers.com.au/hobo-mx1101-temprh-bluetooth-data-logger (accessed on 10 February 2019).
- Nezar Sellam Observatory. 2019. Available online: https://www.wunderground.com/weather/ae/abu-dhabi/IABUDHAB44 (accessed on 24 April 2019).
- Zhao, Q.; Sailor, D.J.; Wentz, E.A. Impact of tree locations and arrangements on outdoor microclimates and human thermal comfort in an urban residential environment. Urban For. Urban Green. 2018, 32, 81–91. [Google Scholar] [CrossRef] [Green Version]
- Zhang, G.; He, B.J.; Zhu, Z.; Dewancker, B.J. Impact of morphological characteristics of green roofs on pedestrian cooling in subtropical climates. Int. J. Environ. Res. Public Health 2019, 16, 179. [Google Scholar] [CrossRef] [Green Version]
- Wu, Z.; Kong, F.; Wang, Y.; Sun, R.; Chen, L. The impact of greenspace on thermal comfort in a residential quarter of Beijing, China. Int. J. Environ. Res. Public Health 2016, 13, 1217. [Google Scholar] [CrossRef] [Green Version]


| Input Parameter | Value(s) Used |
|---|---|
| City location | Abu Dhabi, UAE. Lat: 24.45°; Long: 54.37° |
| Simulation day | 17 June 2019 |
| Simulation duration | 24 h |
| Model resolution | 1:2, 180 × 180 × 48 m |
| Climate type | Hot arid |
| Wind speed and direction | 0.1 m/s at 270° |
| Relative humidity | 63% |
| Cloud cover | Clear sky |
| Albedo | grass = 0.2; red tiles = 0.3; light gray pavement concrete = 0.8; sand = 0.4; yellow pavement = 0.5 |
| Building surface | Default settings in ENVI-met |
| initial soil temperature | 28 °C |
| Scenario | Landscaping Description |
|---|---|
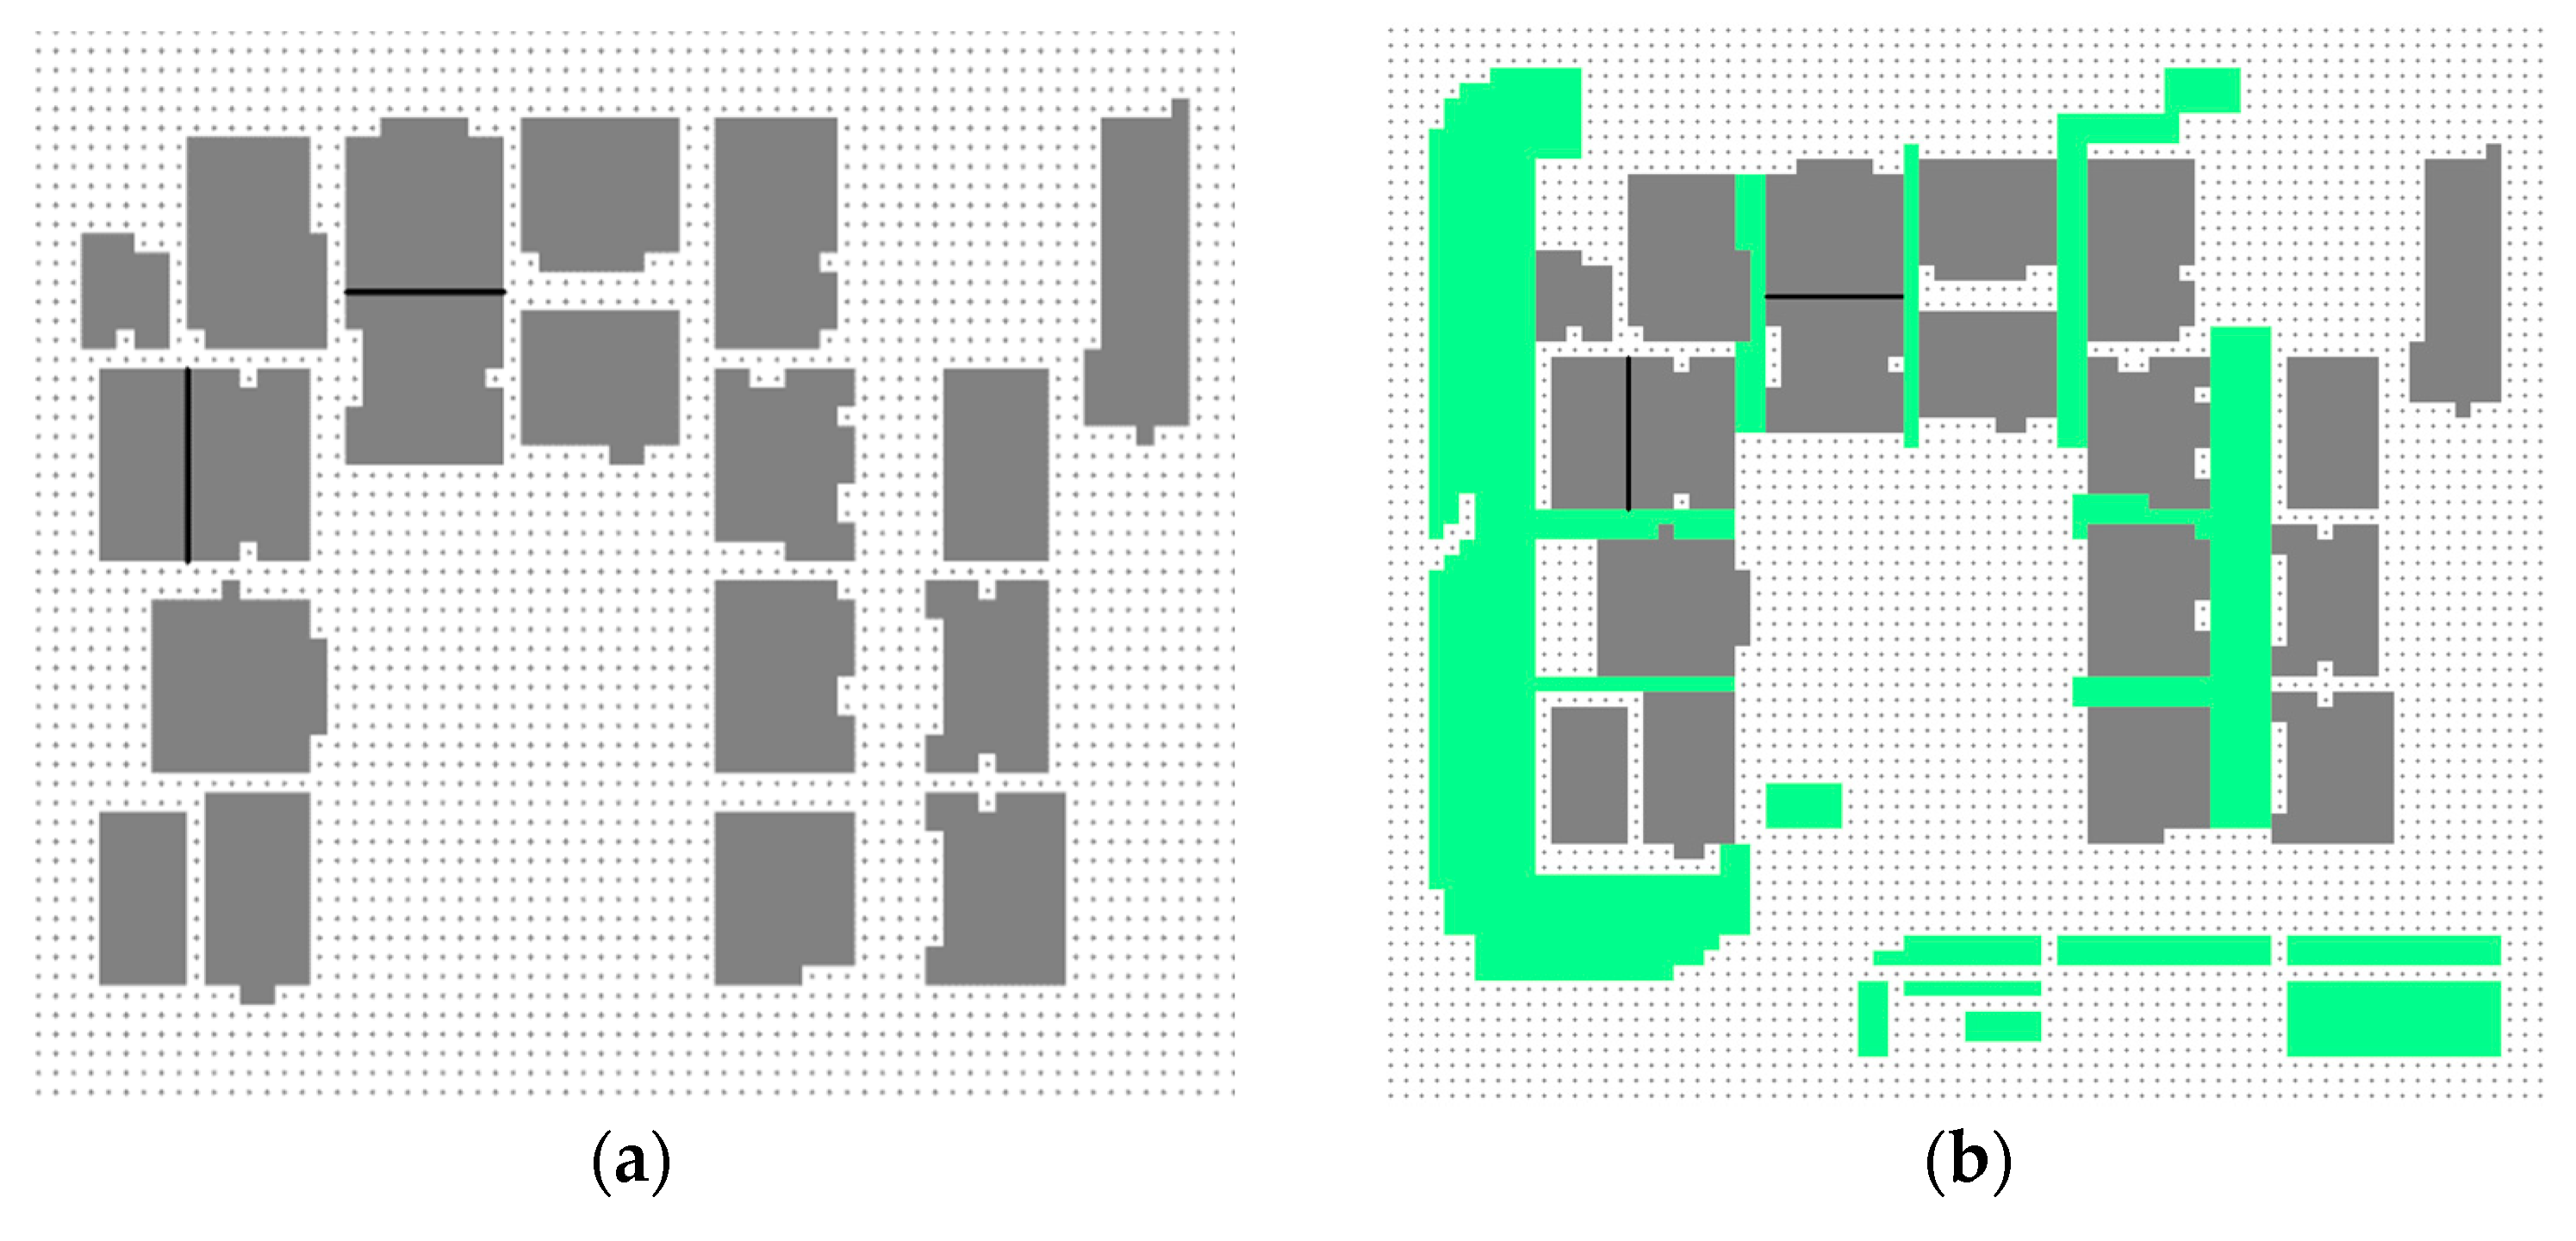
| Existing | Current vegetation conditions in the study sites consisting of various types of trees and sizes, grass, and shrubs. |
| No-vegetation | Removing all existing vegetation (trees, grass, hedges, shrubs, etc.) from the site while keeping all existing ground and surface materials. |
| Grass only | Replacing soil covered areas with grass and removing all existing trees, while keeping the existing grass. |
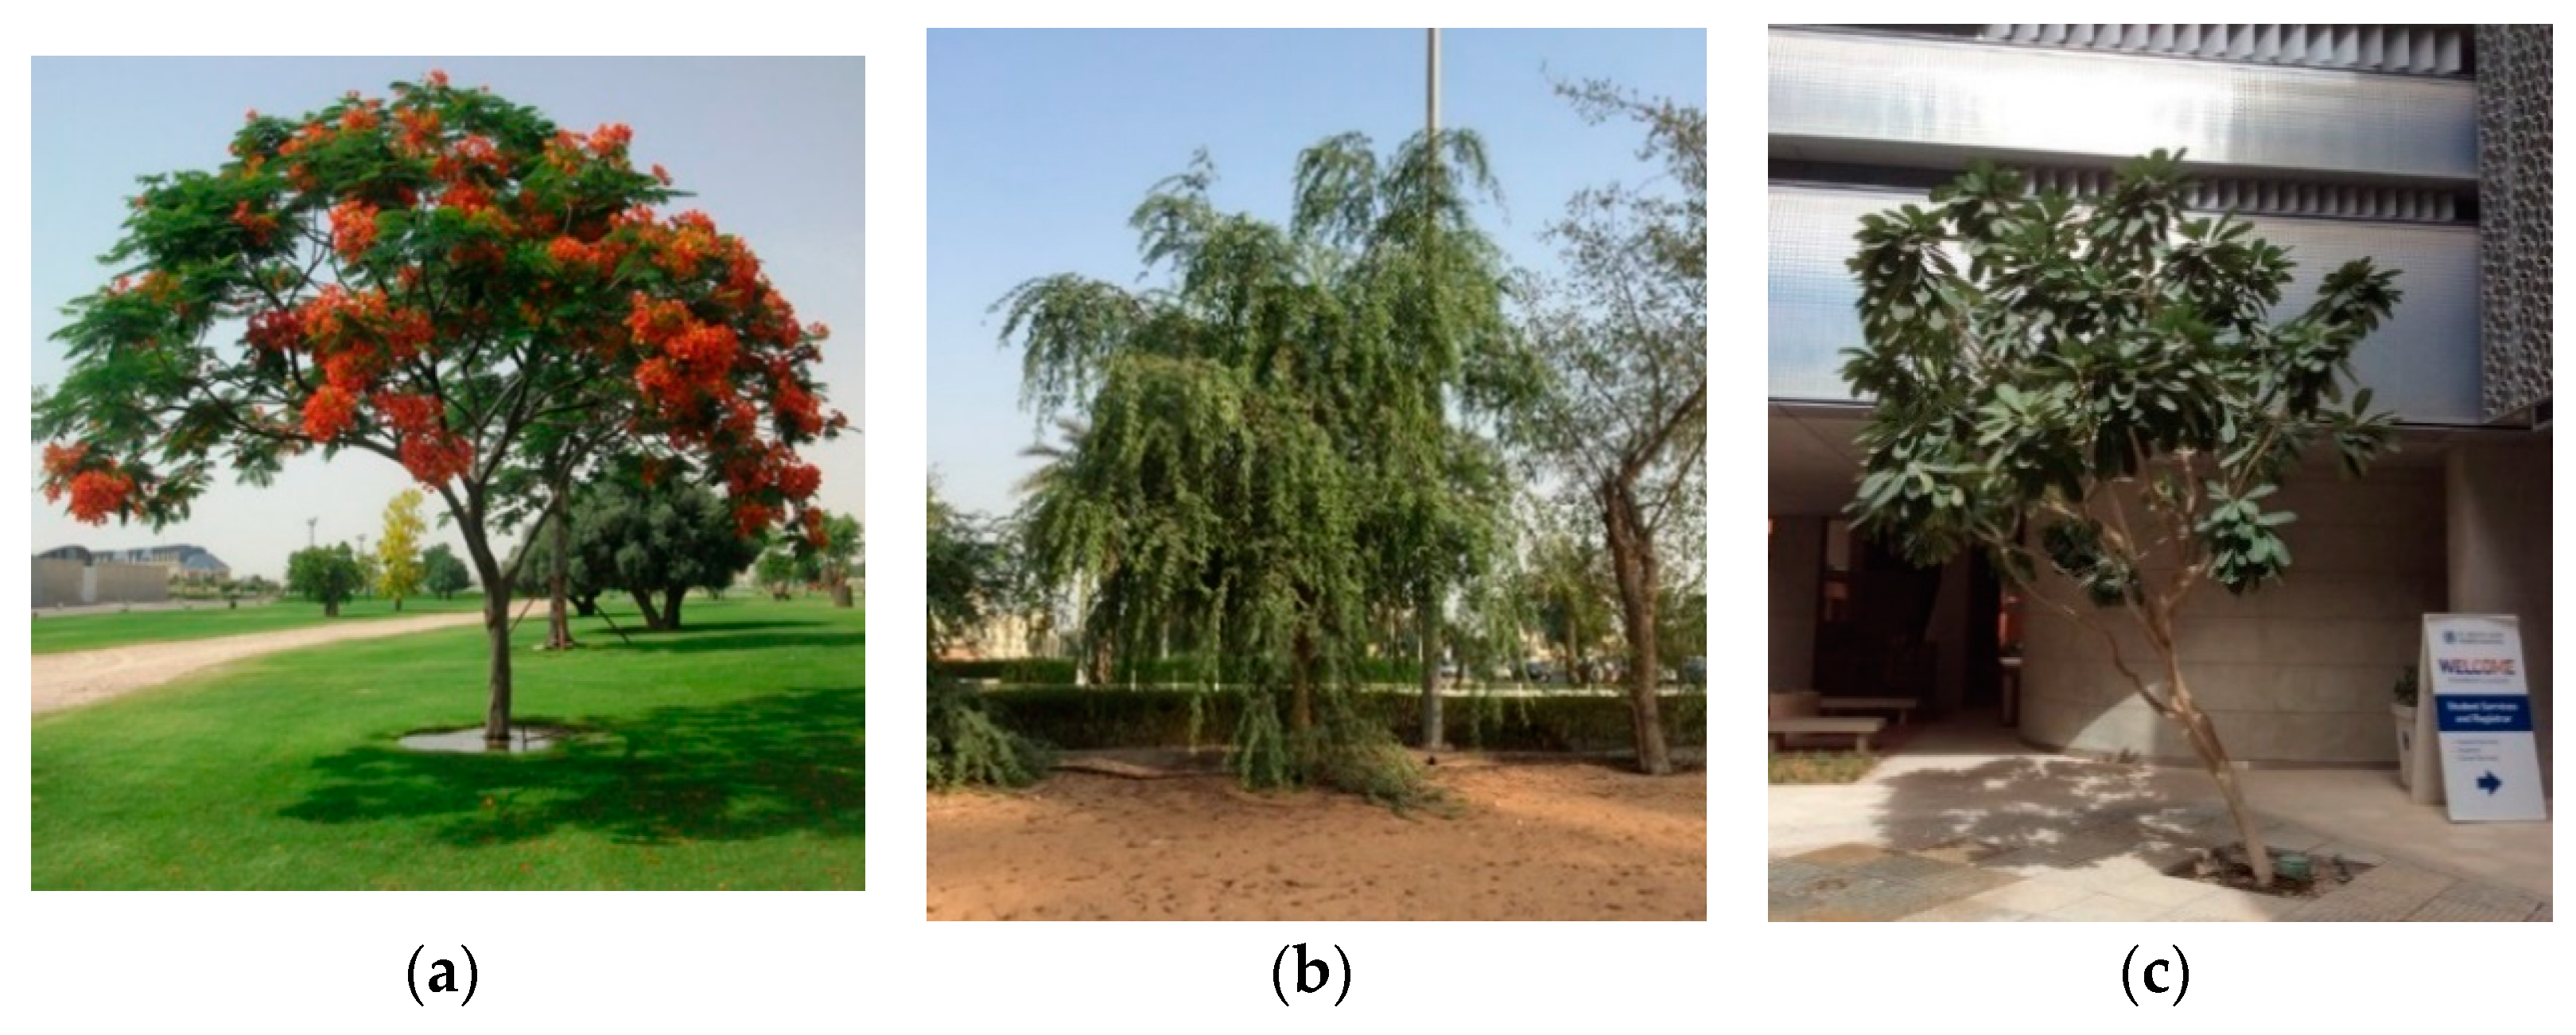
| Poinciana 6 m | Poinciana trees (7 m in height) placed 6 m apart |
| Poinciana 8 m | Poinciana trees (7 m in height) placed 8 m apart |
| Ghaf 6 m | Ghaf trees (6 m in height) placed 6 m apart |
| Ghaf 8 m | Ghaf trees (6 m in height) placed 8 m apart |
| Temple 6 m | Temple trees (5.5 m in height) placed 6 m apart |
| Temple 8 m | Temple trees (5.5 m in height) placed 8 m apart |
| Site 1 | ||||
|---|---|---|---|---|
| Scenario | Max. Temperature (°C) | Min. Temperature (°C) | Max. Temp. Difference Compared to Existing (°C) | Avg. Temp. Difference Compared to Existing (°C) |
| Existing | 42.91 | 41.68 | - | - |
| No vegetation | 42.93 | 41.69 | 0.33 | 0.02 |
| Site 2 | ||||
| Scenario | Max. Temperature (°C) | Min. Temperature (°C) | Max. Temp. Difference Compared to Existing (°C) | Avg. Temp. Difference Compared to Existing (°C) |
| Existing | 42.92 | 41.66 | - | - |
| No vegetation | 43.02 | 41.66 | 0.44 | 0.05 |
| Site 3 | ||||
| Scenario | Max. Temperature (°C) | Min. Temperature (°C) | Max. Temp. Difference Compared to Existing (°C) | Avg. Temp. Difference Compared to Existing (°C) |
| Existing | 43.60 | 42.13 | - | - |
| No vegetation | 43.65 | 42.14 | 0.41 | 0.03 |
| Site 4 | ||||
| Scenario | Max. Temperature (°C) | Min. Temperature (°C) | Max. Temp. Difference Compared to Existing (°C) | Avg. Temp. Difference Compared to Existing (°C) |
| Existing | 43.02 | 41.98 | - | - |
| No vegetation | 43.02 | 42.04 | 0.46 | 0.03 |
| Site 1 | ||||||||
|---|---|---|---|---|---|---|---|---|
| Tree Type | Max. Temperature (°C) | Min. Temperature (°C) | Max. Temp. Difference Compared to Existing (°C) | Avg. Temp. Difference Compared to Existing (°C) | ||||
| 6 m | 8 m | 6 m | 8 m | 6 m | 8 m | 6 m | 8 m | |
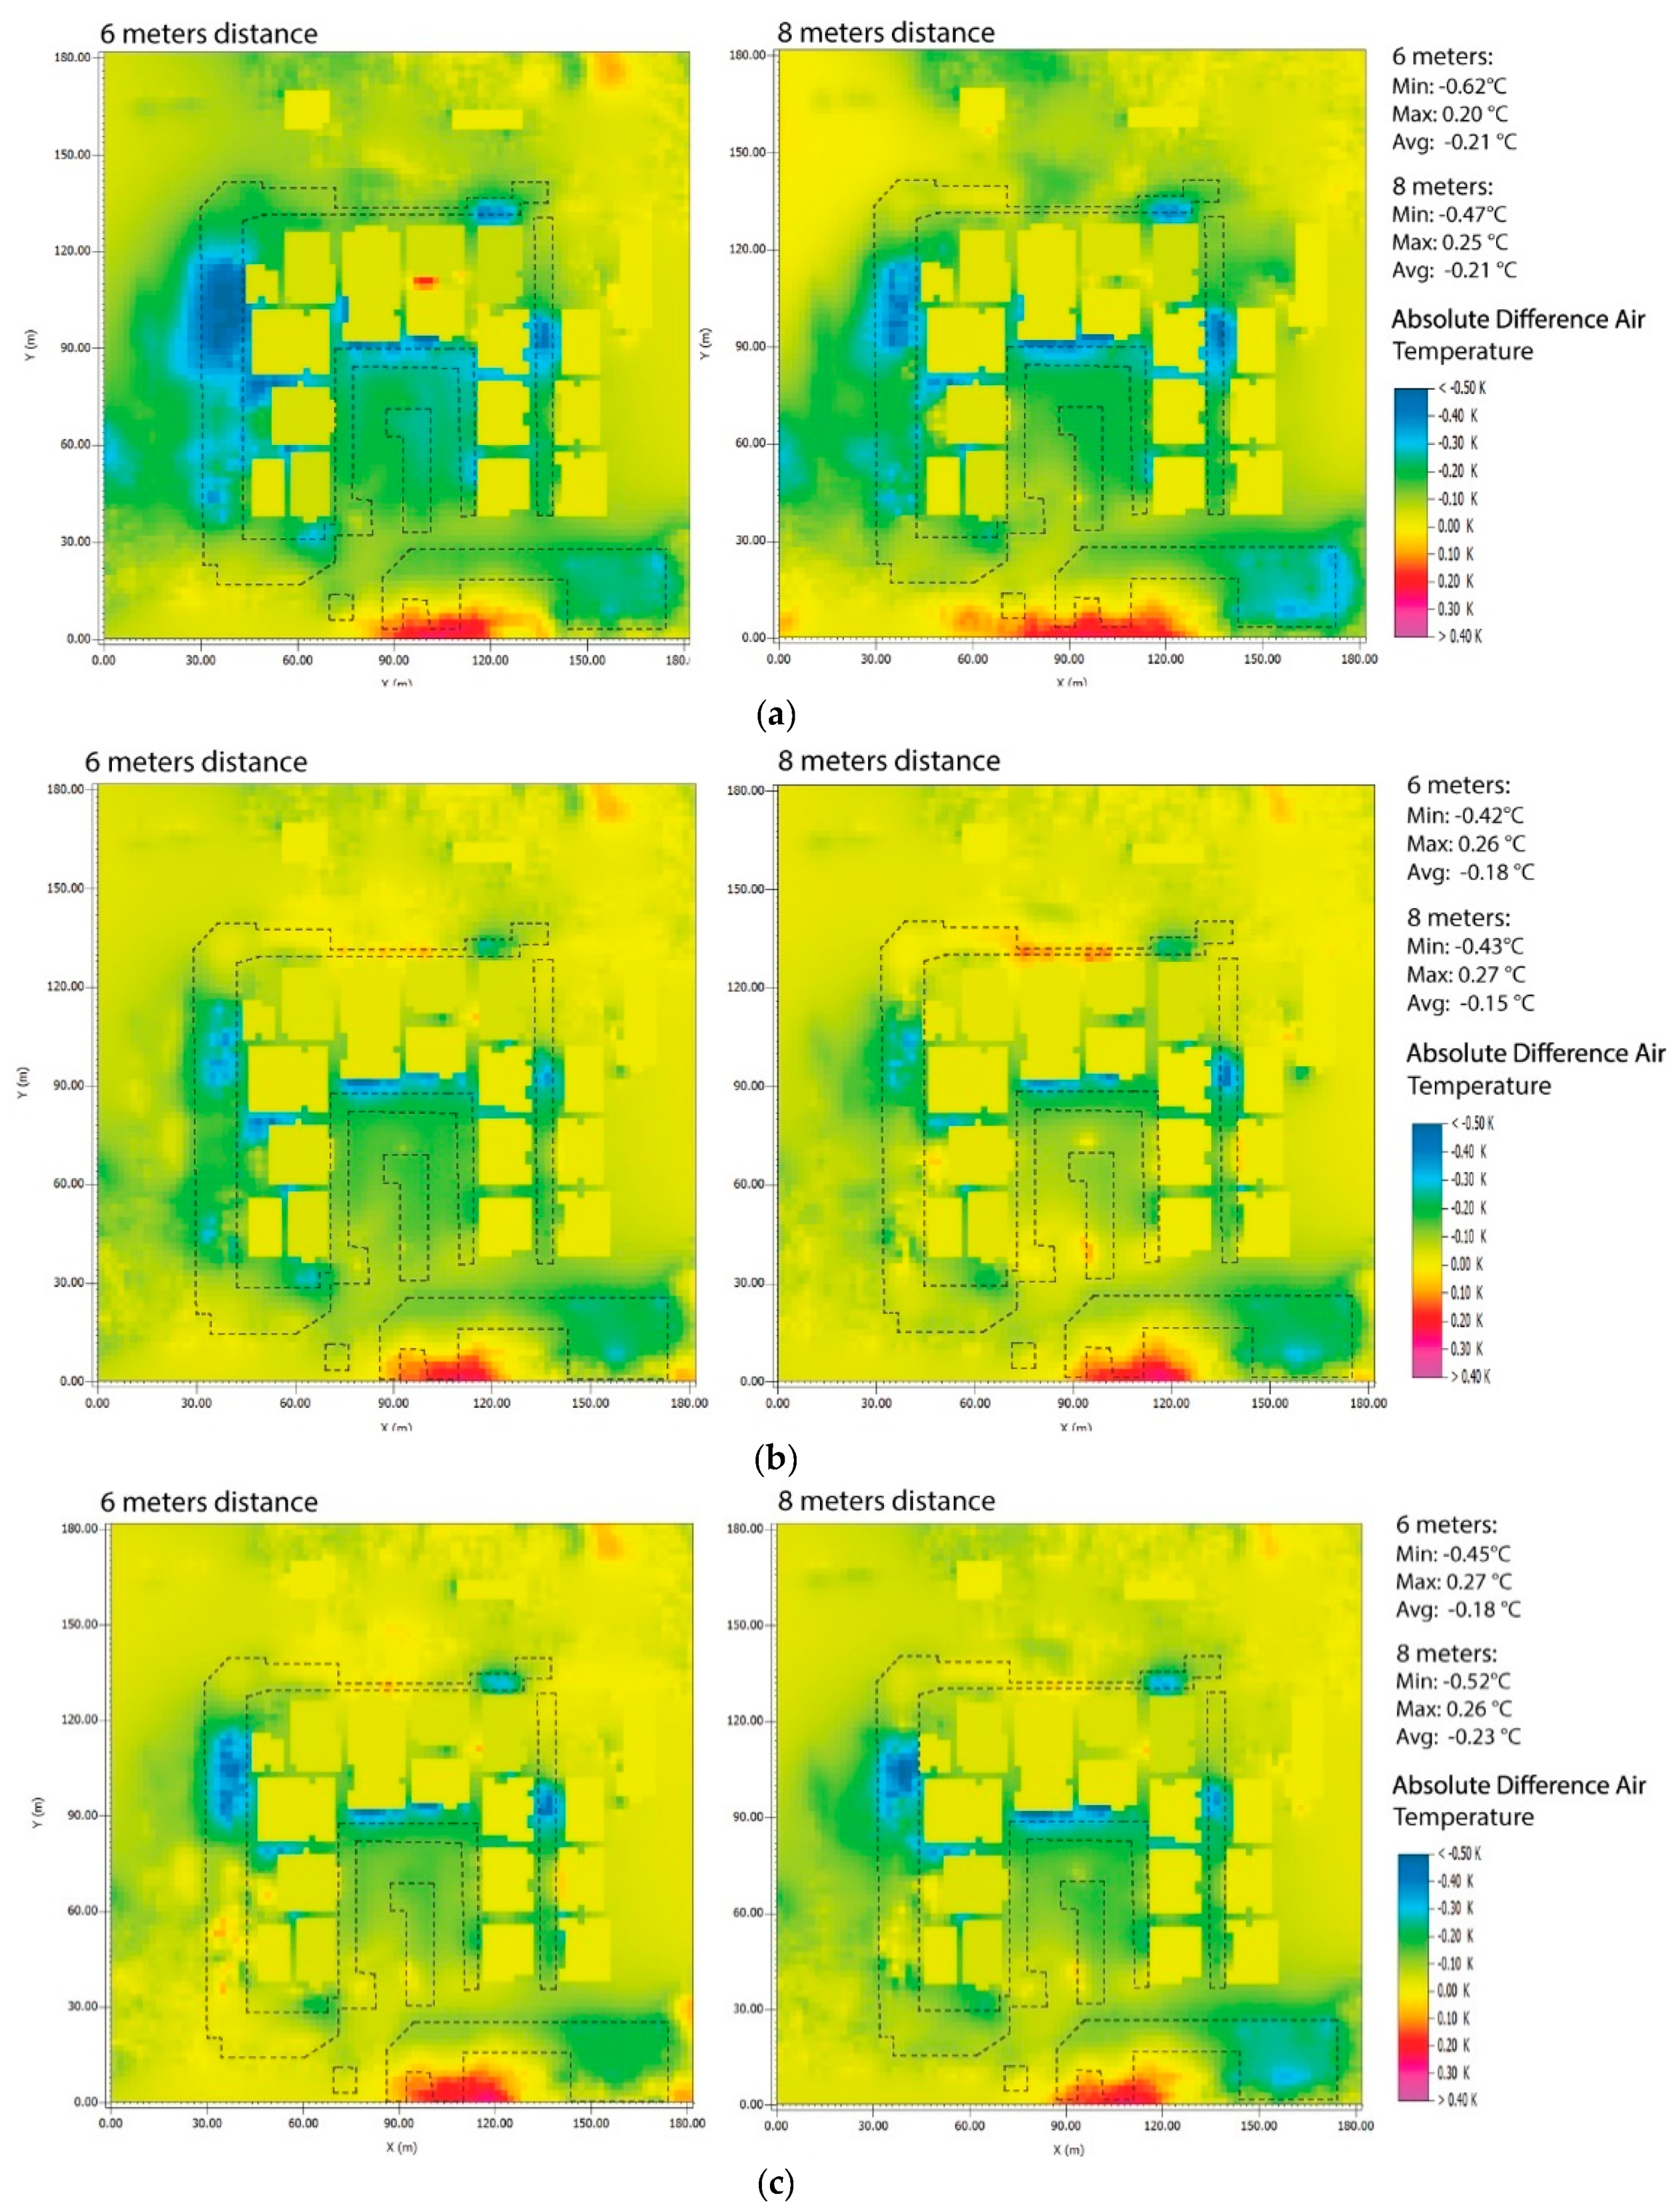
| Poinciana | 42.85 | 42.83 | 41.51 | 41.54 | −0.62 | −0.47 | −0.21 | −0.21 |
| Ghaf | 42.95 | 42.93 | 41.57 | 41.56 | −0.42 | −0.43 | −0.18 | −0.15 |
| Temple | 42.97 | 42.83 | 41.57 | 41.60 | −0.45 | −0.52 | −0.18 | −0.23 |
| Site 2 | ||||||||
| Tree Type | Max. Temperature (°C) | Min. Temperature (°C) | Max. Temp. Difference Compared to Existing (°C) | Avg. Temp. Difference Compared to Existing (°C) | ||||
| 6 m | 8 m | 6 m | 8 m | 6 m | 8 m | 6 m | 8 m | |
| Poinciana | 42.60 | 42.60 | 41.54 | 41.55 | −0.69 | −0.68 | −0.31 | −0.31 |
| Ghaf | 42.61 | 42.62 | 41.60 | 41.60 | −0.55 | −0.52 | −0.24 | −0.20 |
| Temple | 42.62 | 42.61 | 41.59 | 41.58 | −0.52 | −0.58 | −0.22 | −0.24 |
| Site 3 | ||||||||
| Tree Type | Max. Temperature (°C) | Min. Temperature (°C) | Max. Temp. Difference Compared to Existing (°C) | Avg. Temp. Difference Compared to Existing (°C) | ||||
| 6 m | 8 m | 6 m | 8 m | 6 m | 8 m | 6 m | 8 m | |
| Poinciana | 43.36 | 43.34 | 41.93 | 41.92 | −0.90 | −0.87 | −0.19 | −0.16 |
| Ghaf | 43.47 | 43.33 | 41.99 | 42.00 | −0.83 | −0.80 | −0.29 | −0.30 |
| Temple | 43.42 | 43.36 | 41.98 | 41.97 | −0.82 | −0.83 | −0.19 | −0.14 |
| Site 4 | ||||||||
| Tree Type | Max. Temperature (°C) | Min. Temperature (°C) | Max. Temp. Difference Compared to Existing (°C) | Avg. Temp. Difference Compared to Existing (°C) | ||||
| 6 m | 8 m | 6 m | 8 m | 6 m | 8 m | 6 m | 8 m | |
| Poinciana | 42.89 | 42.90 | 41.91 | 41.92 | −0.71 | 0.70 | −0.24 | −0.22 |
| Ghaf | 42.96 | 42.92 | 41.96 | 41.98 | −0.66 | 0.63 | −0.15 | −0.11 |
| Temple | 42.97 | 42.95 | 41.97 | 41.97 | −0.66 | −0.68 | −0.13 | −0.16 |
Publisher’s Note: MDPI stays neutral with regard to jurisdictional claims in published maps and institutional affiliations. |
© 2021 by the authors. Licensee MDPI, Basel, Switzerland. This article is an open access article distributed under the terms and conditions of the Creative Commons Attribution (CC BY) license (https://creativecommons.org/licenses/by/4.0/).
Share and Cite
Abu Ali, M.; Alawadi, K.; Khanal, A. The Role of Green Infrastructure in Enhancing Microclimate Conditions: A Case Study of a Low-Rise Neighborhood in Abu Dhabi. Sustainability 2021, 13, 4260. https://0-doi-org.brum.beds.ac.uk/10.3390/su13084260
Abu Ali M, Alawadi K, Khanal A. The Role of Green Infrastructure in Enhancing Microclimate Conditions: A Case Study of a Low-Rise Neighborhood in Abu Dhabi. Sustainability. 2021; 13(8):4260. https://0-doi-org.brum.beds.ac.uk/10.3390/su13084260
Chicago/Turabian StyleAbu Ali, Mahmoud, Khaled Alawadi, and Asim Khanal. 2021. "The Role of Green Infrastructure in Enhancing Microclimate Conditions: A Case Study of a Low-Rise Neighborhood in Abu Dhabi" Sustainability 13, no. 8: 4260. https://0-doi-org.brum.beds.ac.uk/10.3390/su13084260