
Influence of Anthropogenic Loads on Surface Water Status: A Case Study in Lithuania


Institute of Environment and Ecology, Faculty of Forest Science and Ecology, Vytautas Magnus University, Agriculture Academy, Studentų str., LT-53361 Akademija, Lithuania
*
Author to whom correspondence should be addressed.
Sustainability 2021, 13(8), 4341; https://0-doi-org.brum.beds.ac.uk/10.3390/su13084341
Submission received: 17 March 2021
/
Revised: 6 April 2021
/
Accepted: 9 April 2021
/
Published: 14 April 2021
Abstract
:Twenty-six water bodies and 10 ponds were selected for this research. Anthropogenic loads were assessed according to pollution sources in individual water catchment basins. It was determined that 50% of the tested water bodies had Ntotal values that did not correspond to the good and very good ecological status classes, and 20% of the tested water bodies had Ptotal values that did not correspond to the good and very good ecological status classes. The lake basins and ponds received the largest amounts of pollution from agricultural sources with total nitrogen at 1554.13 t/year and phosphorus at 1.94 t/year, and from meadows and pastures with total nitrogen at 9.50 t/year and phosphorus at 0.20 t/year. The highest annual load of total nitrogen for lake basins on average per year was from agricultural pollution from arable land (98.85%), and the highest total phosphorus load was also from agricultural pollution from arable land (60%).
1. Introduction
To protect people and ecosystems, the European Commission has adopted a zero pollution action plan to prevent air, water and soil pollution. The European Commission encourages sustainability in agriculture and rural areas across the EU through the common agricultural policy, by which agriculture is environmentally sustainable, protects natural resources and enhances biodiversity. Despite the introduction of legislation such as the EU Nitrates and Water Framework Directives [1,2], agricultural practices are often still regarded as a major influencing factor on poor water quality across many EU member states [3], and agricultural systems and activities will put pressure on freshwater resources [4]. A scientific evaluation of the suitability and cost-effectiveness of options to reduce nutrient loss from rural areas to surface waters at the catchment scale, including the feasibility of the options under different climatic and geographical conditions, was conducted in different EU countries [5]. Agricultural catchments are where farm and landscape management interact with policy and science, especially with regard to the implementation and evaluation of agro-environmental regulation [6]. The increasing rate of water resource usage results in its contamination by wastewater from domestic, industrial and agricultural sectors. The opinions of different researchers confirm that agricultural pollution poses a considerable challenge to grain security and human health, especially in economically developed areas [7]. Various studies show that the excessive use of chemical fertilizers and pesticides has caused serious nonpoint-source water pollution [8]. Diffuse water pollution and other water pollution problems are a major problem in many agroecosystems, especially in irrigated areas linked to ecosystems of high ecological value [9]. Requirements for high-quality water bodies are different, but identifying the spatiotemporal characteristics of water quality and related driving factors is essential for lake water quality management [10]. The quality of water and nature is determined for ground and surface water by first measuring their N and P contents and, for natural areas, by measuring N deposition [11]. Lakes are one of the most important water resources and are used as a source of water for human consumption, and, in general, they account for approximately 0.3% of total surface water body sources. The quality of lake water (or other surface sources) is evaluated using various physico-chemical and biological parameters selected based on the designated best use (DBU) of the water body (lake) for various purposes [12]. The quality of lake water is dependent on the geological structure of the earth and on the anthropogenic activities surrounding it, such as construction, waste disposal, agriculture and other associated activities [13]. Modern agriculture has become increasingly dependent on chemical fertilizers, especially in developing countries [14]. Fertilizers and manure applied to croplands to increase yields are often lost via surface erosion, soil leaching, and runoff, increasing nutrient loads in surface and subsurface waters and degrading water quality [15]. Mineral exploitation, chemical enterprise operation, pesticide and fertilizer application, sewage discharge and vehicle emissions are sources of pollution on agricultural land [7]. The use of large quantities of inorganic fertilizers to meet the N demand of crops, in combination with the return flow associated with irrigation, has increased NO3-concentrations in surface water bodies and the groundwater of agricultural areas in particular [16]. Phosphorus (P) loading in lakes degrades the quality and usability of water globally [17]. Dissolved reactive phosphorus losses from agricultural fields promote algal growth in water bodies and may increase the risk of harmful algal blooms [18]. High concentrations of bioavailable P have also been found in high-intensity agricultural systems [19]. Current strategies for reducing the loads and concentrations of P from agricultural land to surface waters have been presented in many studies [20]. Many studies also have indicated that submerged macrophytes play an important role in ecological restoration owing to their ecological function, which includes controlling sediment resuspension [21]. Submerged phytoremediation technology has been widely accepted by researchers and government departments to improve water quality and aquatic ecosystems. Reversing the emergence of phytoplankton-dominated lakes, returning to lakes to being dominated by submerged macrophytes, and simultaneously achieving positive circulation and self-regulation are important [22]. Various legal instruments regulate groundwater quality, and evaluating groundwater quality is the main approach to ensuring groundwater security and implementing effective management of groundwater [23]. In agriculture, it is important to reduce water scarcity problems to increase food and environmental security; to avoid direct pollution of rivers, canals, and surface water; and to conserve water and nutrients [24]. Wastewater treatment currently focuses on removing phosphorus (P) and nitrogen (N) due to their potential to cause eutrophication of water bodies, and eutrophication has become a problem in surface water [25,26]. In terms of analytical methods, it is necessary to understand the speed of pollutant diffusion processes and the concentrations of pollution sources [27]. NO3 pollution of upper groundwater occurs almost everywhere in sandy and loamy soils [28]. Nitrate (NO3-) is a ubiquitous environmental pollutant that not only occurs naturally but also is released by human activities. These activities include the production and use of fertilizers, the combustion of fossil fuels (resulting in atmospheric deposition, hereafter AD), leakage and discharge from both industrial and domestic sewage systems, and the alteration of natural vegetation with nitrogen (N)-fixing crops [29]. The identification of nitrate (NO3−) sources and biogeochemical transformations is critical for understanding the different nitrogen (N) pathways and thus, for controlling diffuse pollution in groundwater affected by livestock and agricultural activities. This approach can help a newly established in-stream constructed wetland treating diffuse agricultural pollution be efficient [30]. Diffuse agricultural pollution, especially from intensively managed agricultural land, is a major cause of eutrophication; therefore, it is important to reduce the diffuse load to surface water. Constructed wetlands (CWs) are an effective measure for improving water quality and reducing nutrient runoff from agriculture by using natural water treatment mechanisms. Diffuse pollution is transferred from agricultural land to drainage ditches and larger water bodies, which causes significant degradation of water quality in rivers and lakes [31]. Diffuse pollution causes serious problems due to its large scale and diffuse nature. Diffuse water pollution is a major problem in many agroecosystems, especially in irrigated areas linked to ecosystems of high ecological value [9]. Pollution abatement policies imply the modification of agricultural measures and are usually rejected by farmers because their impact on farm profitability in the environment is more difficult to control than point-source pollution [32]. Another opportunity in many countries to reduce surface water pollution is organic farming. For example, conventional intensive agricultural practices have led to serious nonpoint-source pollution in China and have caused severe ecological threats to agroecosystems, especially in ecologically sensitive areas [33]. Evaluating the relationship between the use of water resources and investment in environmental protection, as well as establishing a reasonable model of ecological compensation, has become an imperative issue [34]. The benefits of using more environmentally friendly practices outweigh other issues when evaluating the environmental impact [35].
The aim of this research is to evaluate the impact of anthropogenic load on indicators of the ecological status of water bodies.
2. Materials and Methods
2.1. Study Area
The ecological status of water bodies at risk was assessed in accordance with the Procedure for Assessing the Ecological Status of Surface Water Bodies [36].
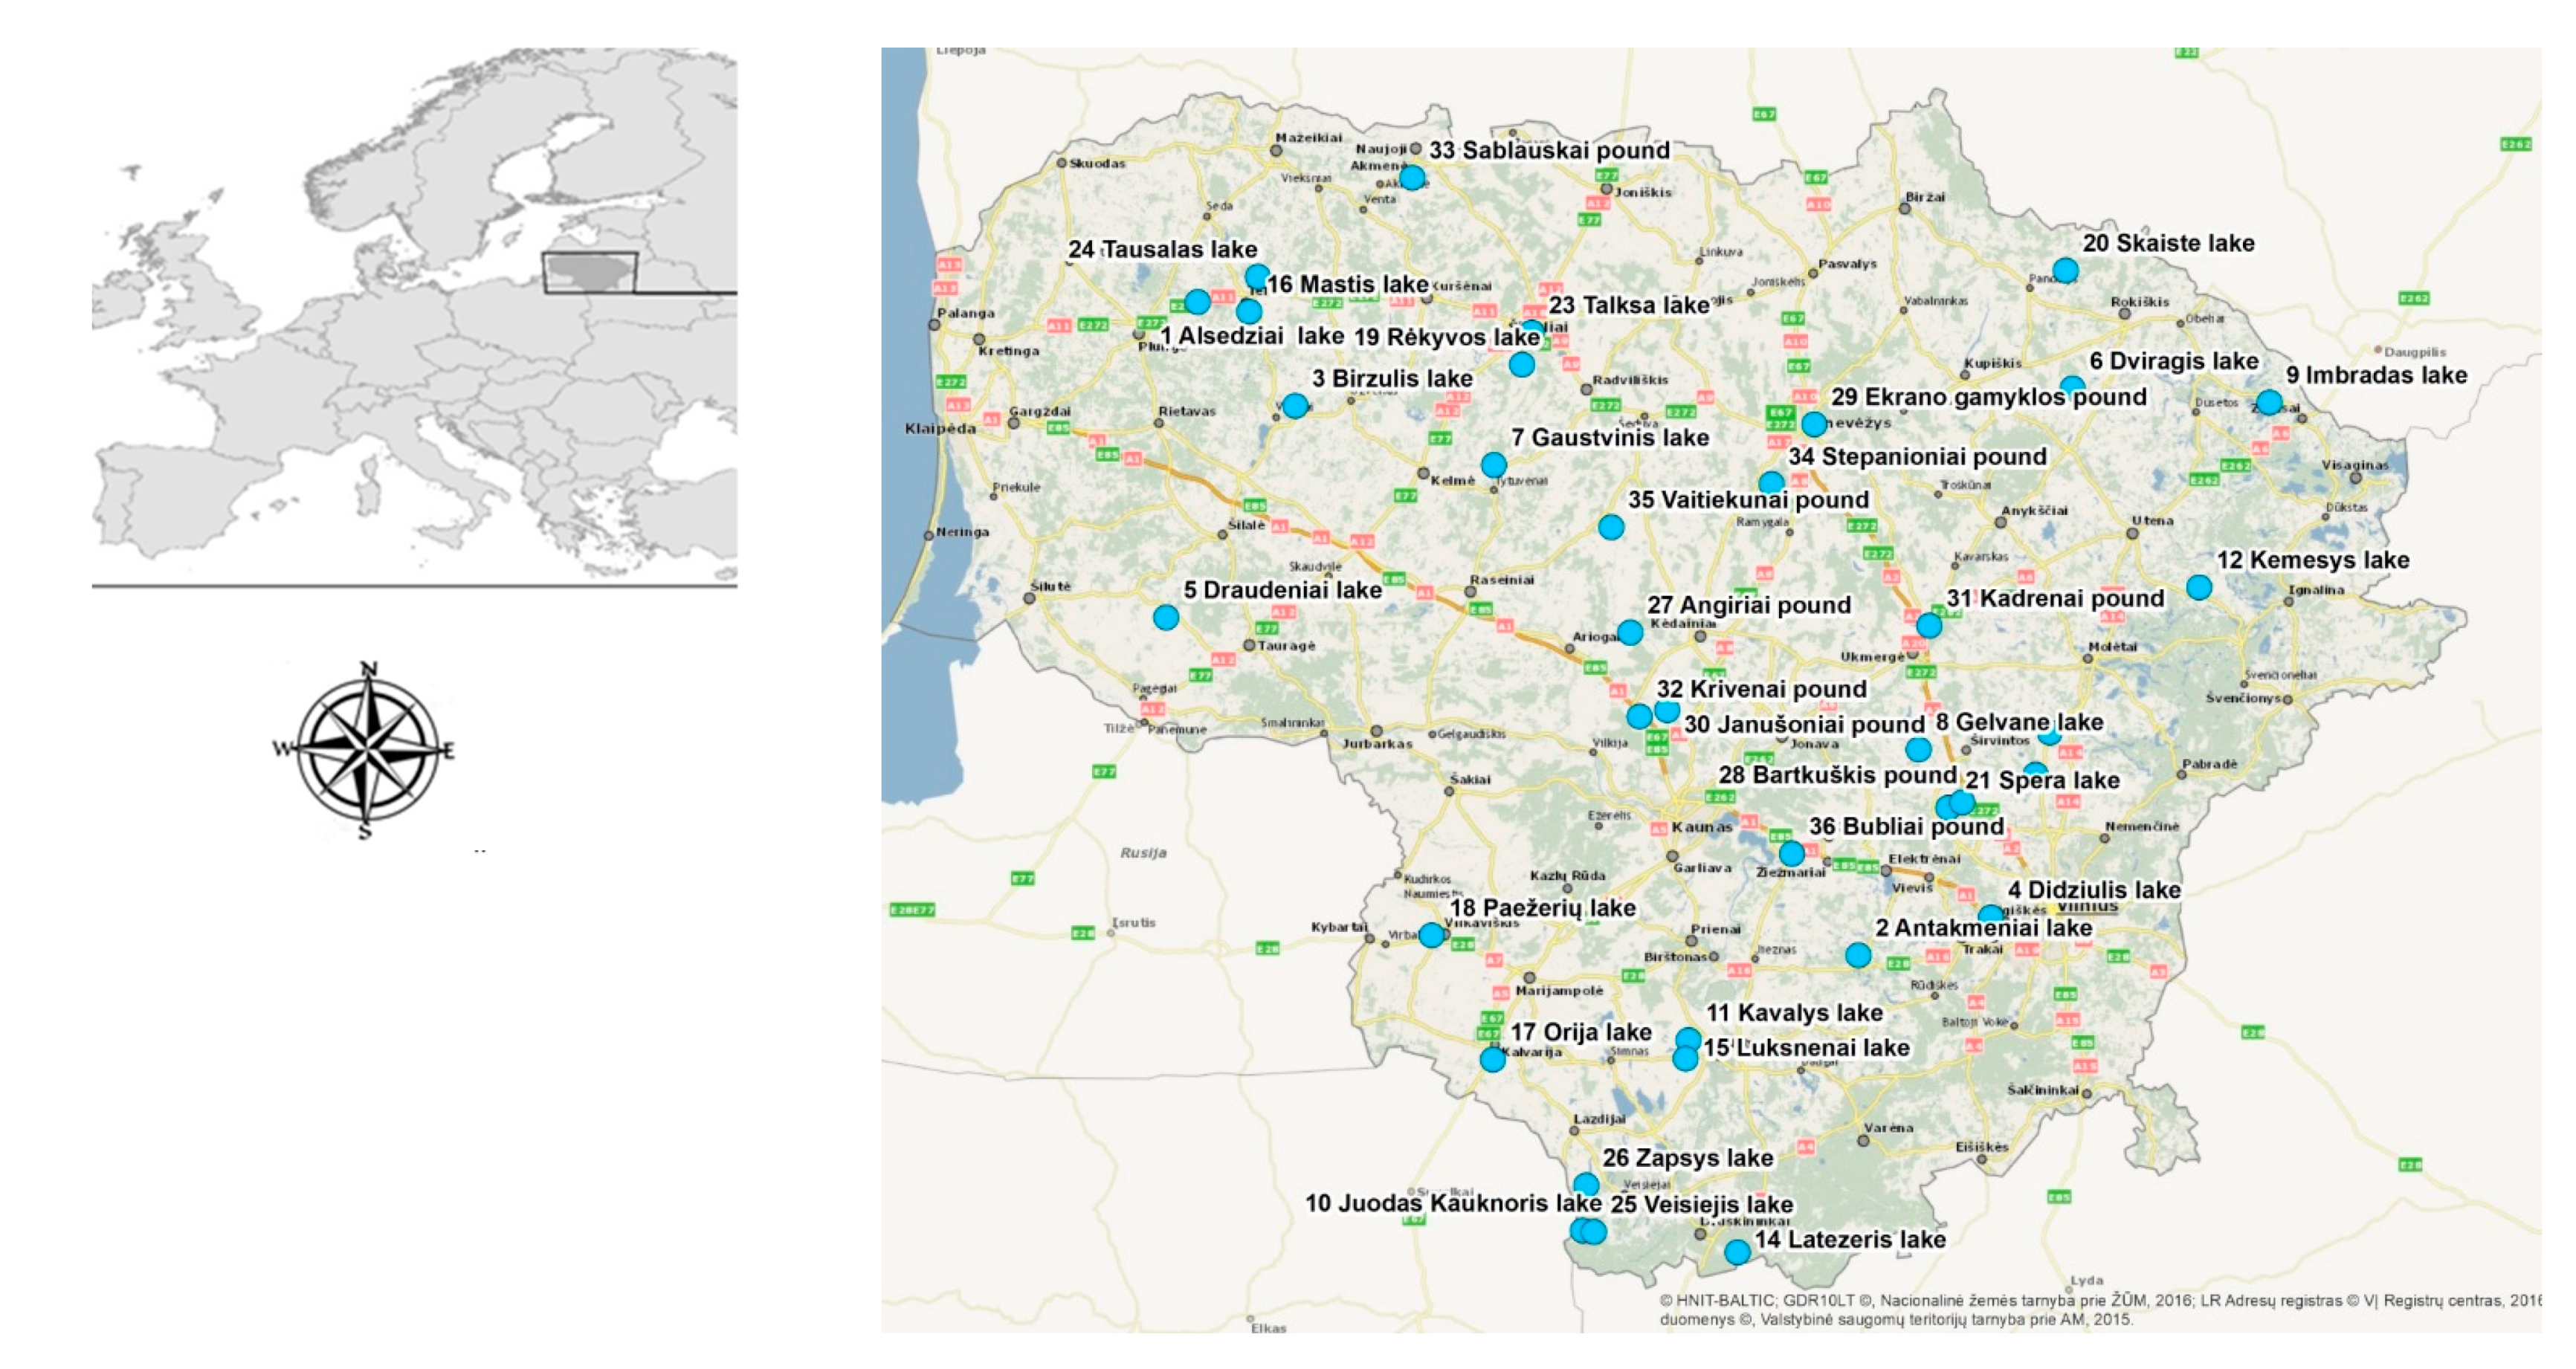
To determine the risk of water bodies in good condition not complying with water quality standards, 26 lakes and 10 ponds were studied. The investigated lakes and ponds are shown in Figure 1.
2.2. Sample Preparation (Collection)
Surveys of physicochemical quality indicators and suspended solids were performed in January–December 2015–2019, while benthic macroinvertebrate and fish studies were performed in August–September 2015–2019.
Studies on physicochemical quality elemental indicators were performed in a laboratory at Vytautas Magnus University. Water samples were taken according to EN ISO standards: LST EN ISO 5667-14:2016—water quality—Sampling—Part 14. Total nitrogen (total N) was tested according to the method of LST EN 13342-2002. The determination of nitrogen and bound nitrogen (total N) following oxidation to nitrogen oxides was determined based on EN 12260:2003. Total phosphorus (total P) analyses were performed according to LST EN ISO 6878:2004.
Benthic macroinvertebrate research was carried out in accordance with the 2003 Regulations of the Minister of Environment of the Republic of Lithuania (24 December by order no. 708, approved methodology LAND 57-2003, “Benthic macroinvertebrates research methodology in surface water bodies”).
The fish research was carried out in accordance with order no. D1-501 from the Minister of Environment of the Republic of Lithuania 20 October, approved by the Research Method of Fish Resources and the Minister of Environment of the Republic of Lithuania on 4 April 2007, by order no. D1-197. The Lithuanian environmental protection normative document, LAND 85-2007, “Methodology for calculating the Lithuanian fish index” (approved by D1-197), was used to evaluate the species composition, abundance, biomass and age structures of the fish.
Chlorophyll “a” was determined by the spectrophotometric method (LAND 69-2005). The EQR (ecological quality ratio) for chlorophyll “a” was calculated in accordance with the environmental protection normative document of the Republic of Lithuania approved by the Minister of Environment of the Republic of Lithuania on 28 December 2005 by order no. D1-648 (2006, No. 53-123).
2.3. Assessment of Pollution Sources
Sources of diffuse pollution include loads of manure and mineral fertilizers generated in agriculture and loads from the residents whose households are not connected to sewage collection systems.
Sources of concentrated pollution include discharges from cities, settlements, industrial enterprises and surface water, as well as from storm water runoff from urban areas.
Concentrated pollution can enter water bodies directly or through tributaries.
The following factors were assessed:
- Domestic and industrial wastewater dischargers and their pollution loads and the impacts on the status of the water body and the average total N and total P values of wastewater discharged in 2015–2019. Environmental Protection Agency (EPA) data on wastewater dischargers, measured pollutant concentrations and annual wastewater volumes are assessed by dividing their values into the feeding basins of the water bodies.
- Number of people connected to the sewage collection systems and sewage management (i.e., central, individual or no management (statistics)). The contamination loads in the environment released by the residents whose wastewater was not collected were assessed according to HELCOM recommendations, which specified that one resident generates 4.4 kg according to total Nt and 0.9 kg according to total P.
- Current number of organic farms, percent; current area of organic farms, ha; we used data from the national ecological agricultural production certification body, ECOAGROS.
- To determine the nutrient loads from residential and commercial areas, SWAT (soil and water assessment tool) model data were used to calculate pollution loads. The SWAT model is a basin-scale, continuous time model that operates on a daily time step and evaluates the impact of management practices on water, sediment and agricultural chemical yields in ungauged basins [37]. The model includes weather, hydrology, erosion, soil temperature, plant growth, nutrients, land management, channels and reservoir routing.
- To determine the effect of the transformation of biogenic materials in soil and water body contamination, a SWAT model was used to calculate the average total nitrogen (total N) and total phosphorus (total P) washout.
2.4. Statistical Analyses
To assess statistically significant impacts on quality factors related to the ecological status of water bodies, the impacts of anthropogenic load indicators (P and N from arable land, t/year; P and N from meadows, t/year; P and N from cities, t/year; P and N from forests, t/year; P and N from households not connected to sewage networks, t/year; P and N from municipal wastewater, t/year; P and N from surface wastewater t/year; P and N from organic farms, t/year; current number of organic farms, percent; current area of organic farms, ha; basin area, ha; conditional number of livestock; agricultural land, ha; arable land area, ha; and number of farms in the basin, units) on water quality indicators (Y) for the water in lakes and ponds were determined. The multiple linear regression model was as follows:
Y = a + b1x1 + b2x2 +…+ bkxk
The coefficient bj shows how much the value of Y increases (decreases) by one unit as xj increases when the remaining xk are fixed. t is the Student’s criterion, according to which we determine whether the coefficients bj differ statistically significantly from zero, and according to this, we decide whether the predicted values depend on xj. The standardized coefficients beta are used to determine the relative influence of independent variables on the predicted Y. In absolute terms, a higher Beta coefficient indicates a greater dependence of Y on xj.
The regression model is appropriate because:
- The Levene test was used for endogeneity test; R code was used to generate the analyses in this section, R2 ≥ 0.20.
- ANOVA p < 0.05.
- Significance shows t tests p < 0.05.
- All variance inflation factors (VIF) ≤ 4 (no multicollinearity problems).
- All Cook measure values ≤ 1.
3. Results
3.1. Lake and Pond Condition Evaluation According to Total Nitrogen and Total Phosphorus Values
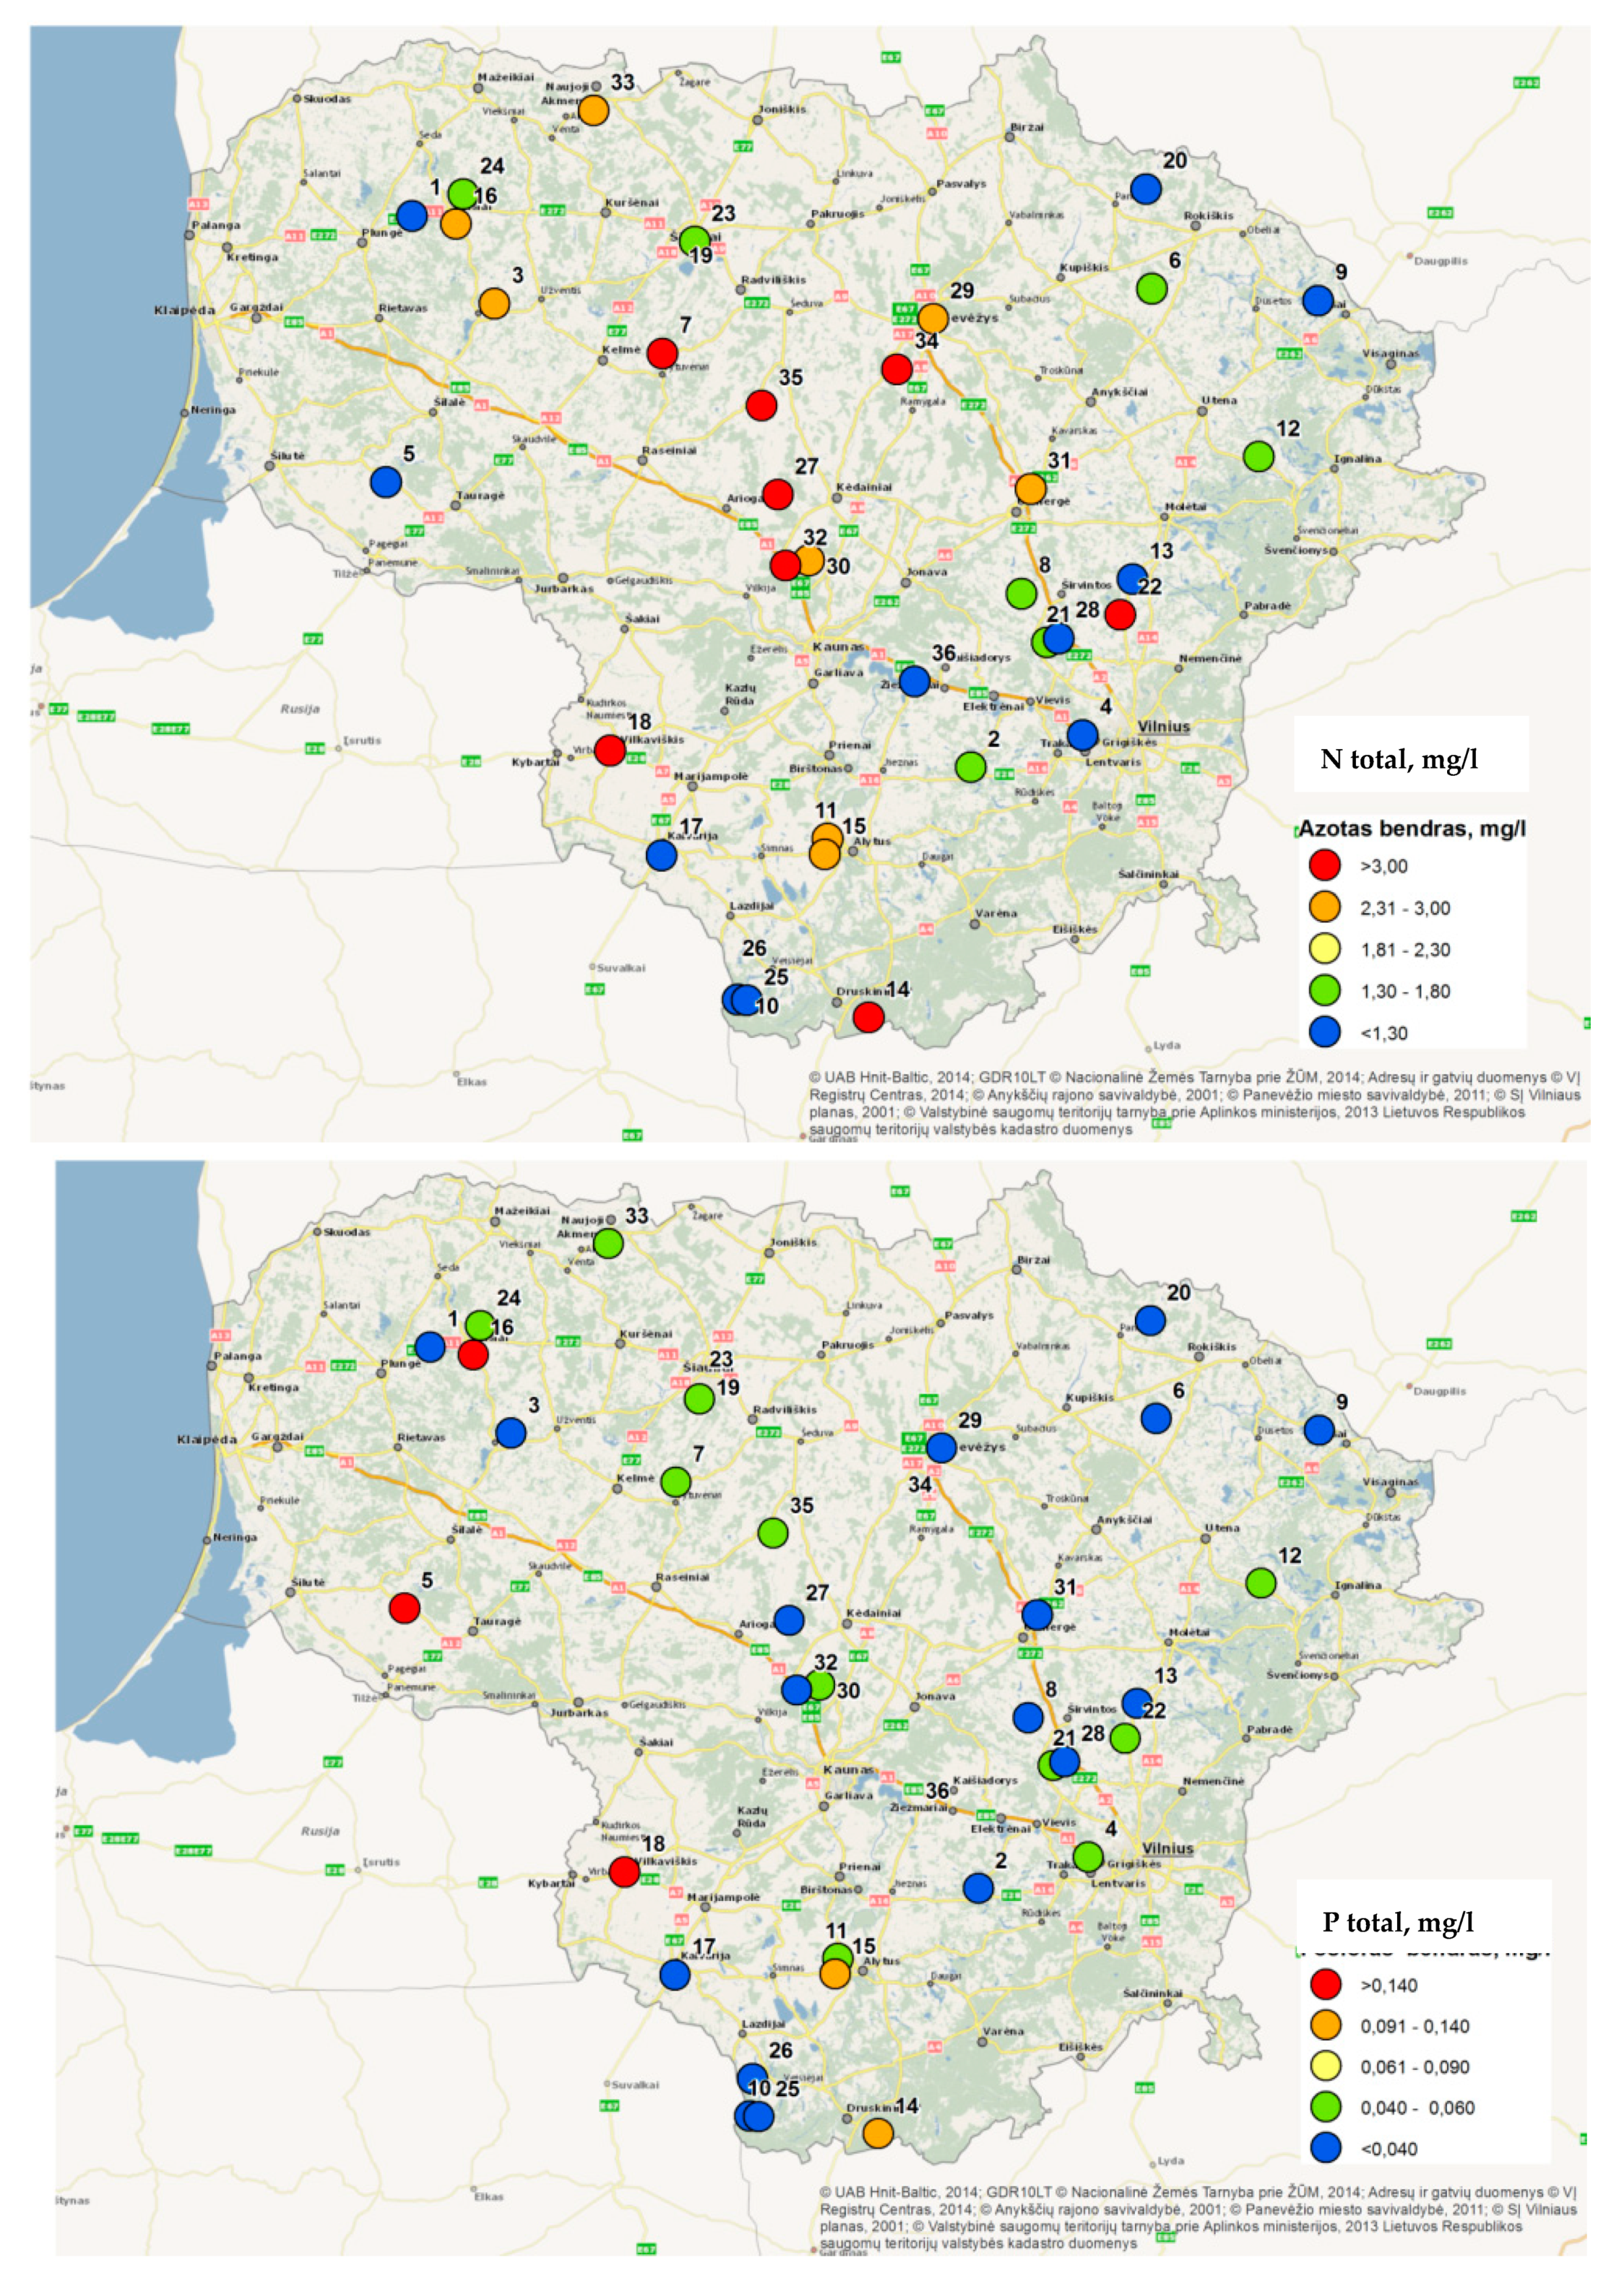
Nitrogen (N) pollution from agriculture is considered a major issue and will remain an issue for the foreseeable future [38]. Concentrations of total nitrogen (total N) and phosphorus (total P) in lakes and ponds are shown in Figure 2.
It was found that the total N values in 50% of the surveyed water bodies did not correspond to the good and very good ecological status class values: 7.5% corresponded to the moderate ecological status class value, 22.5% to the poor status class value and 17.5% to the very poor status class value. Twenty percent of the tested water bodies had Ptotal values that did not correspond to the good and very good ecological status class values. Of these, 7.5% corresponded to the moderate ecological status class value, 5% to the poor status class value and 7.5% to the very poor status class value.
3.2. Assessment of Nutrient Loads in Lakes and Ponds
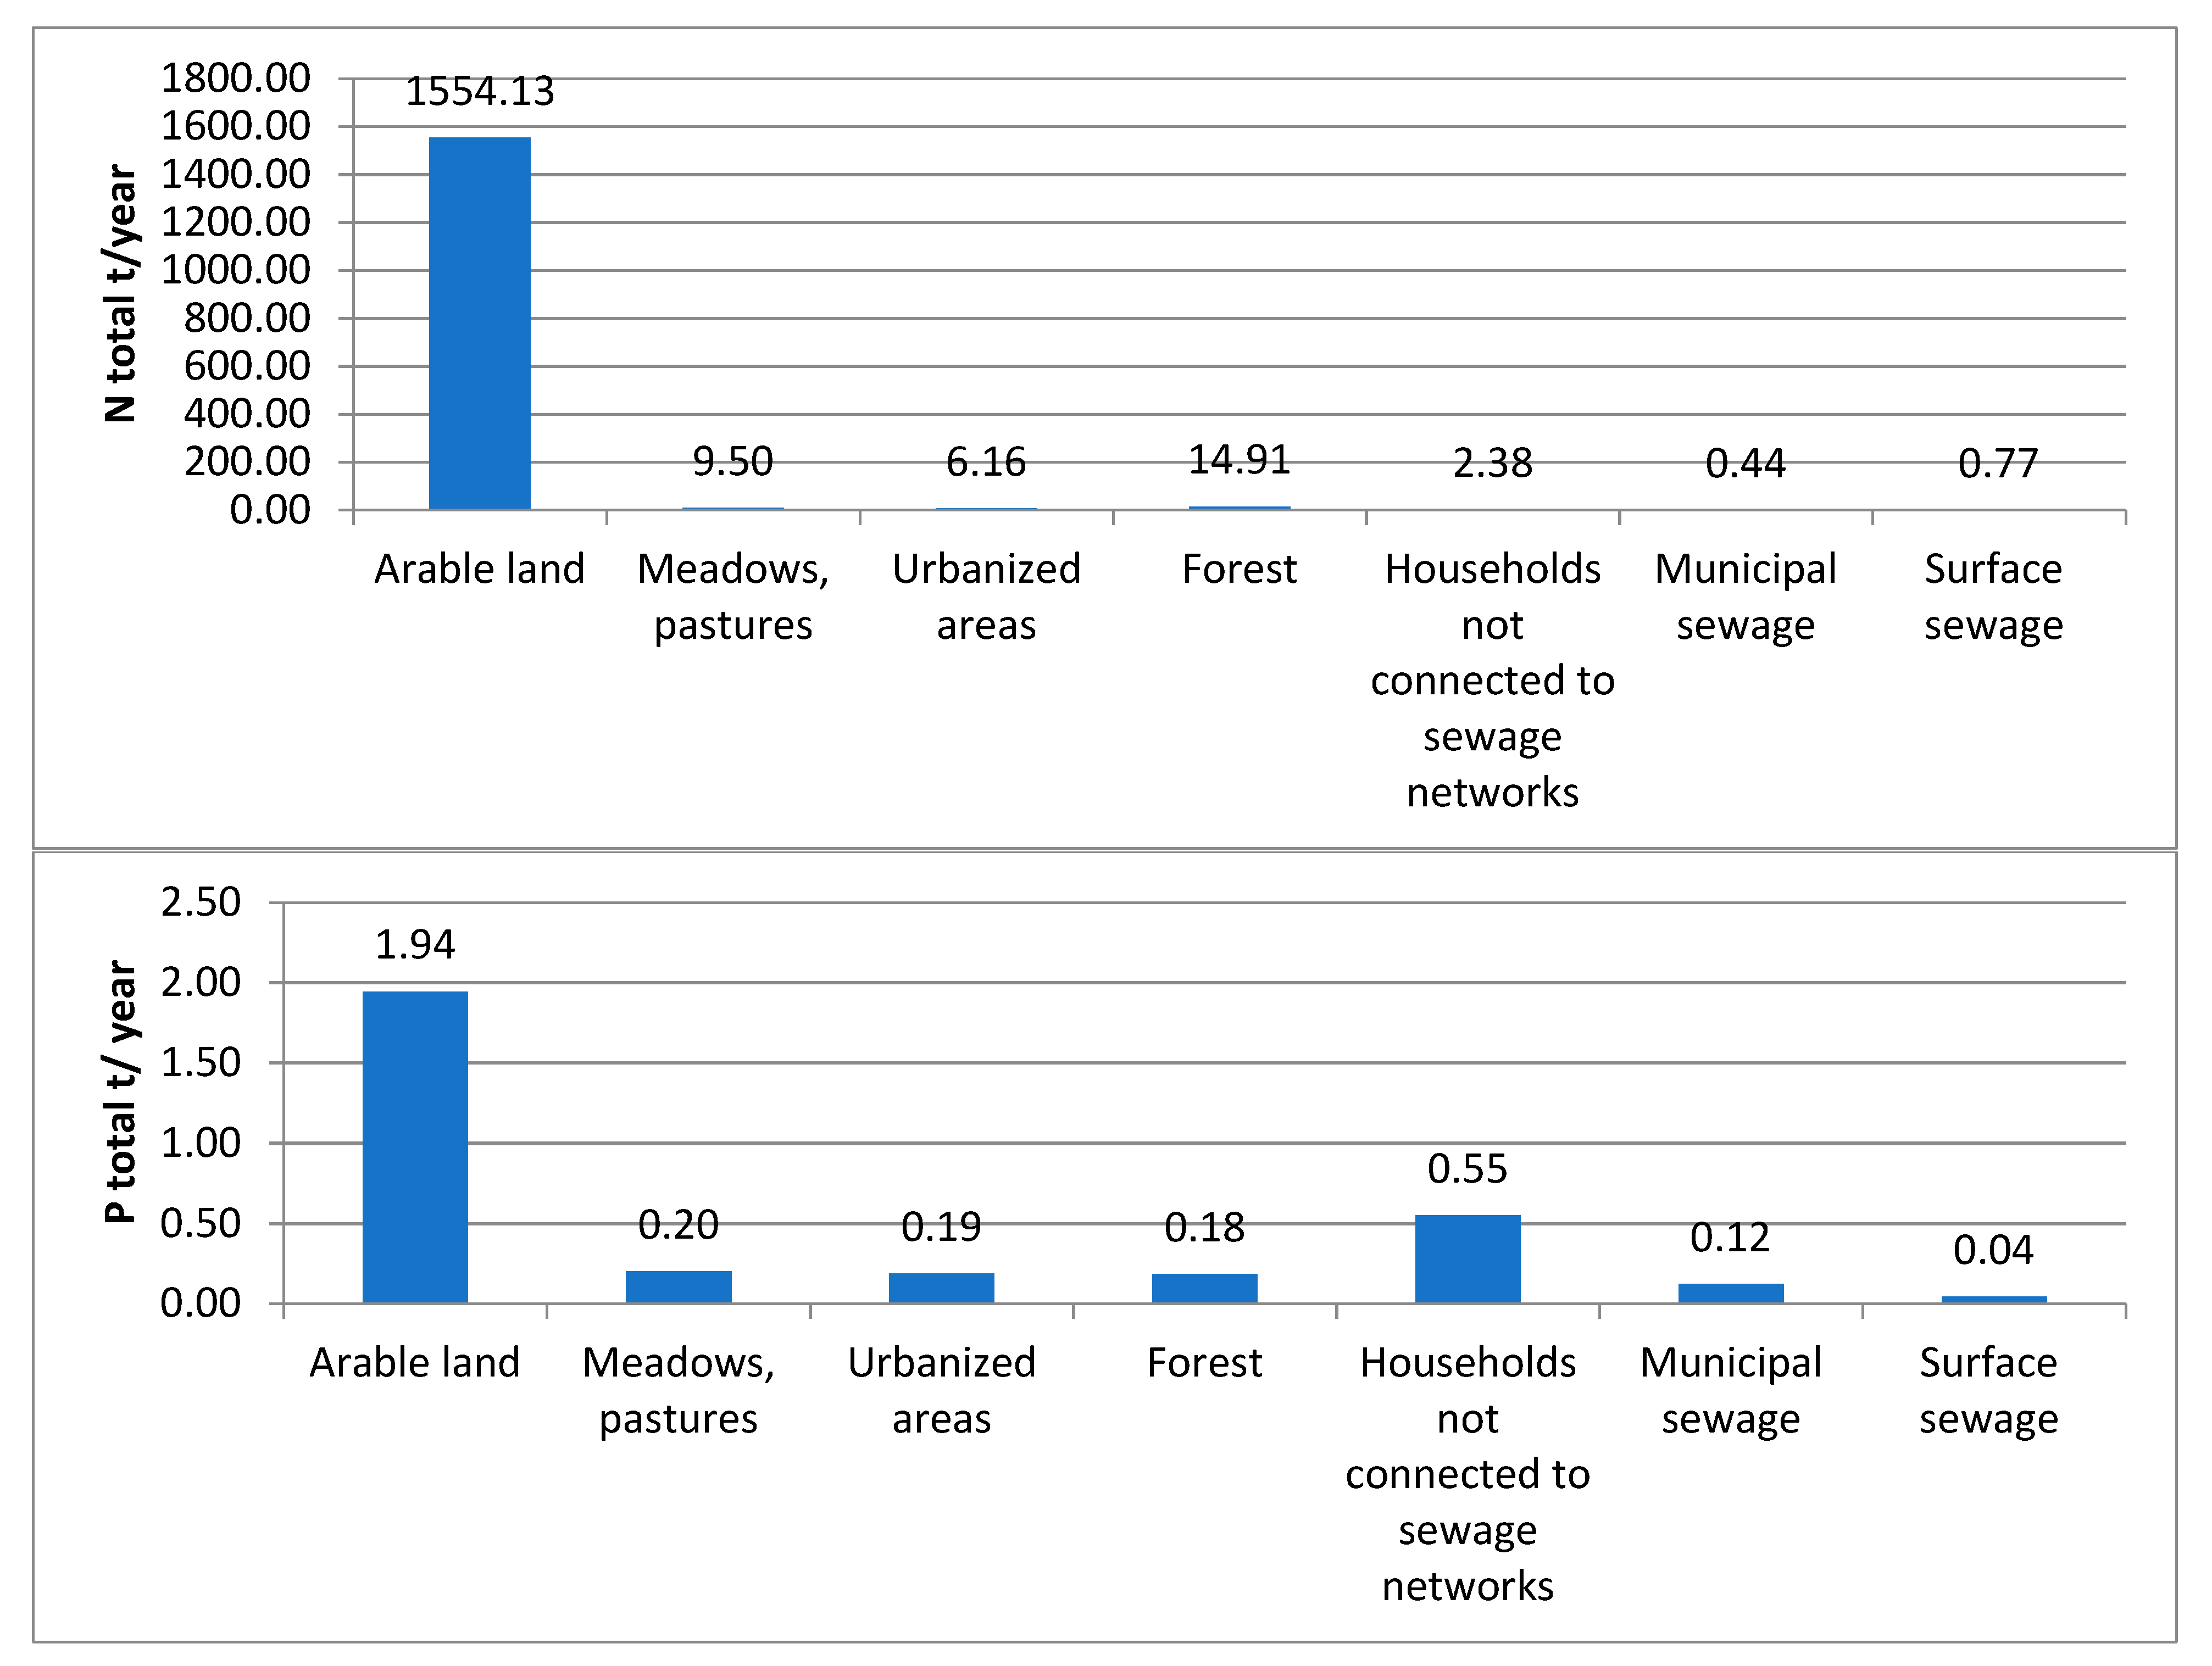
Nutrient loads in lake and pond basins were calculated using SWAT model data. Calculations were performed in tonnes per year for the inflows into the lakes for total nitrogen and for total phosphorus. Total nitrogen and phosphorus loads in lake basins (t/year) are presented in Figure 3.
Lake and pond basins received the largest amounts of pollution from agricultural sources: arable land-total nitrogen 1554.13 t/year and 1.94 t/year phosphorus and grassland pastures-total nitrogen 9.50 t/year and 0.20 t/year phosphorus. Residents whose sewage was not discharged into sewage treatment systems generated 2.38 t/year of total nitrogen and 0.55/year of phosphorus.
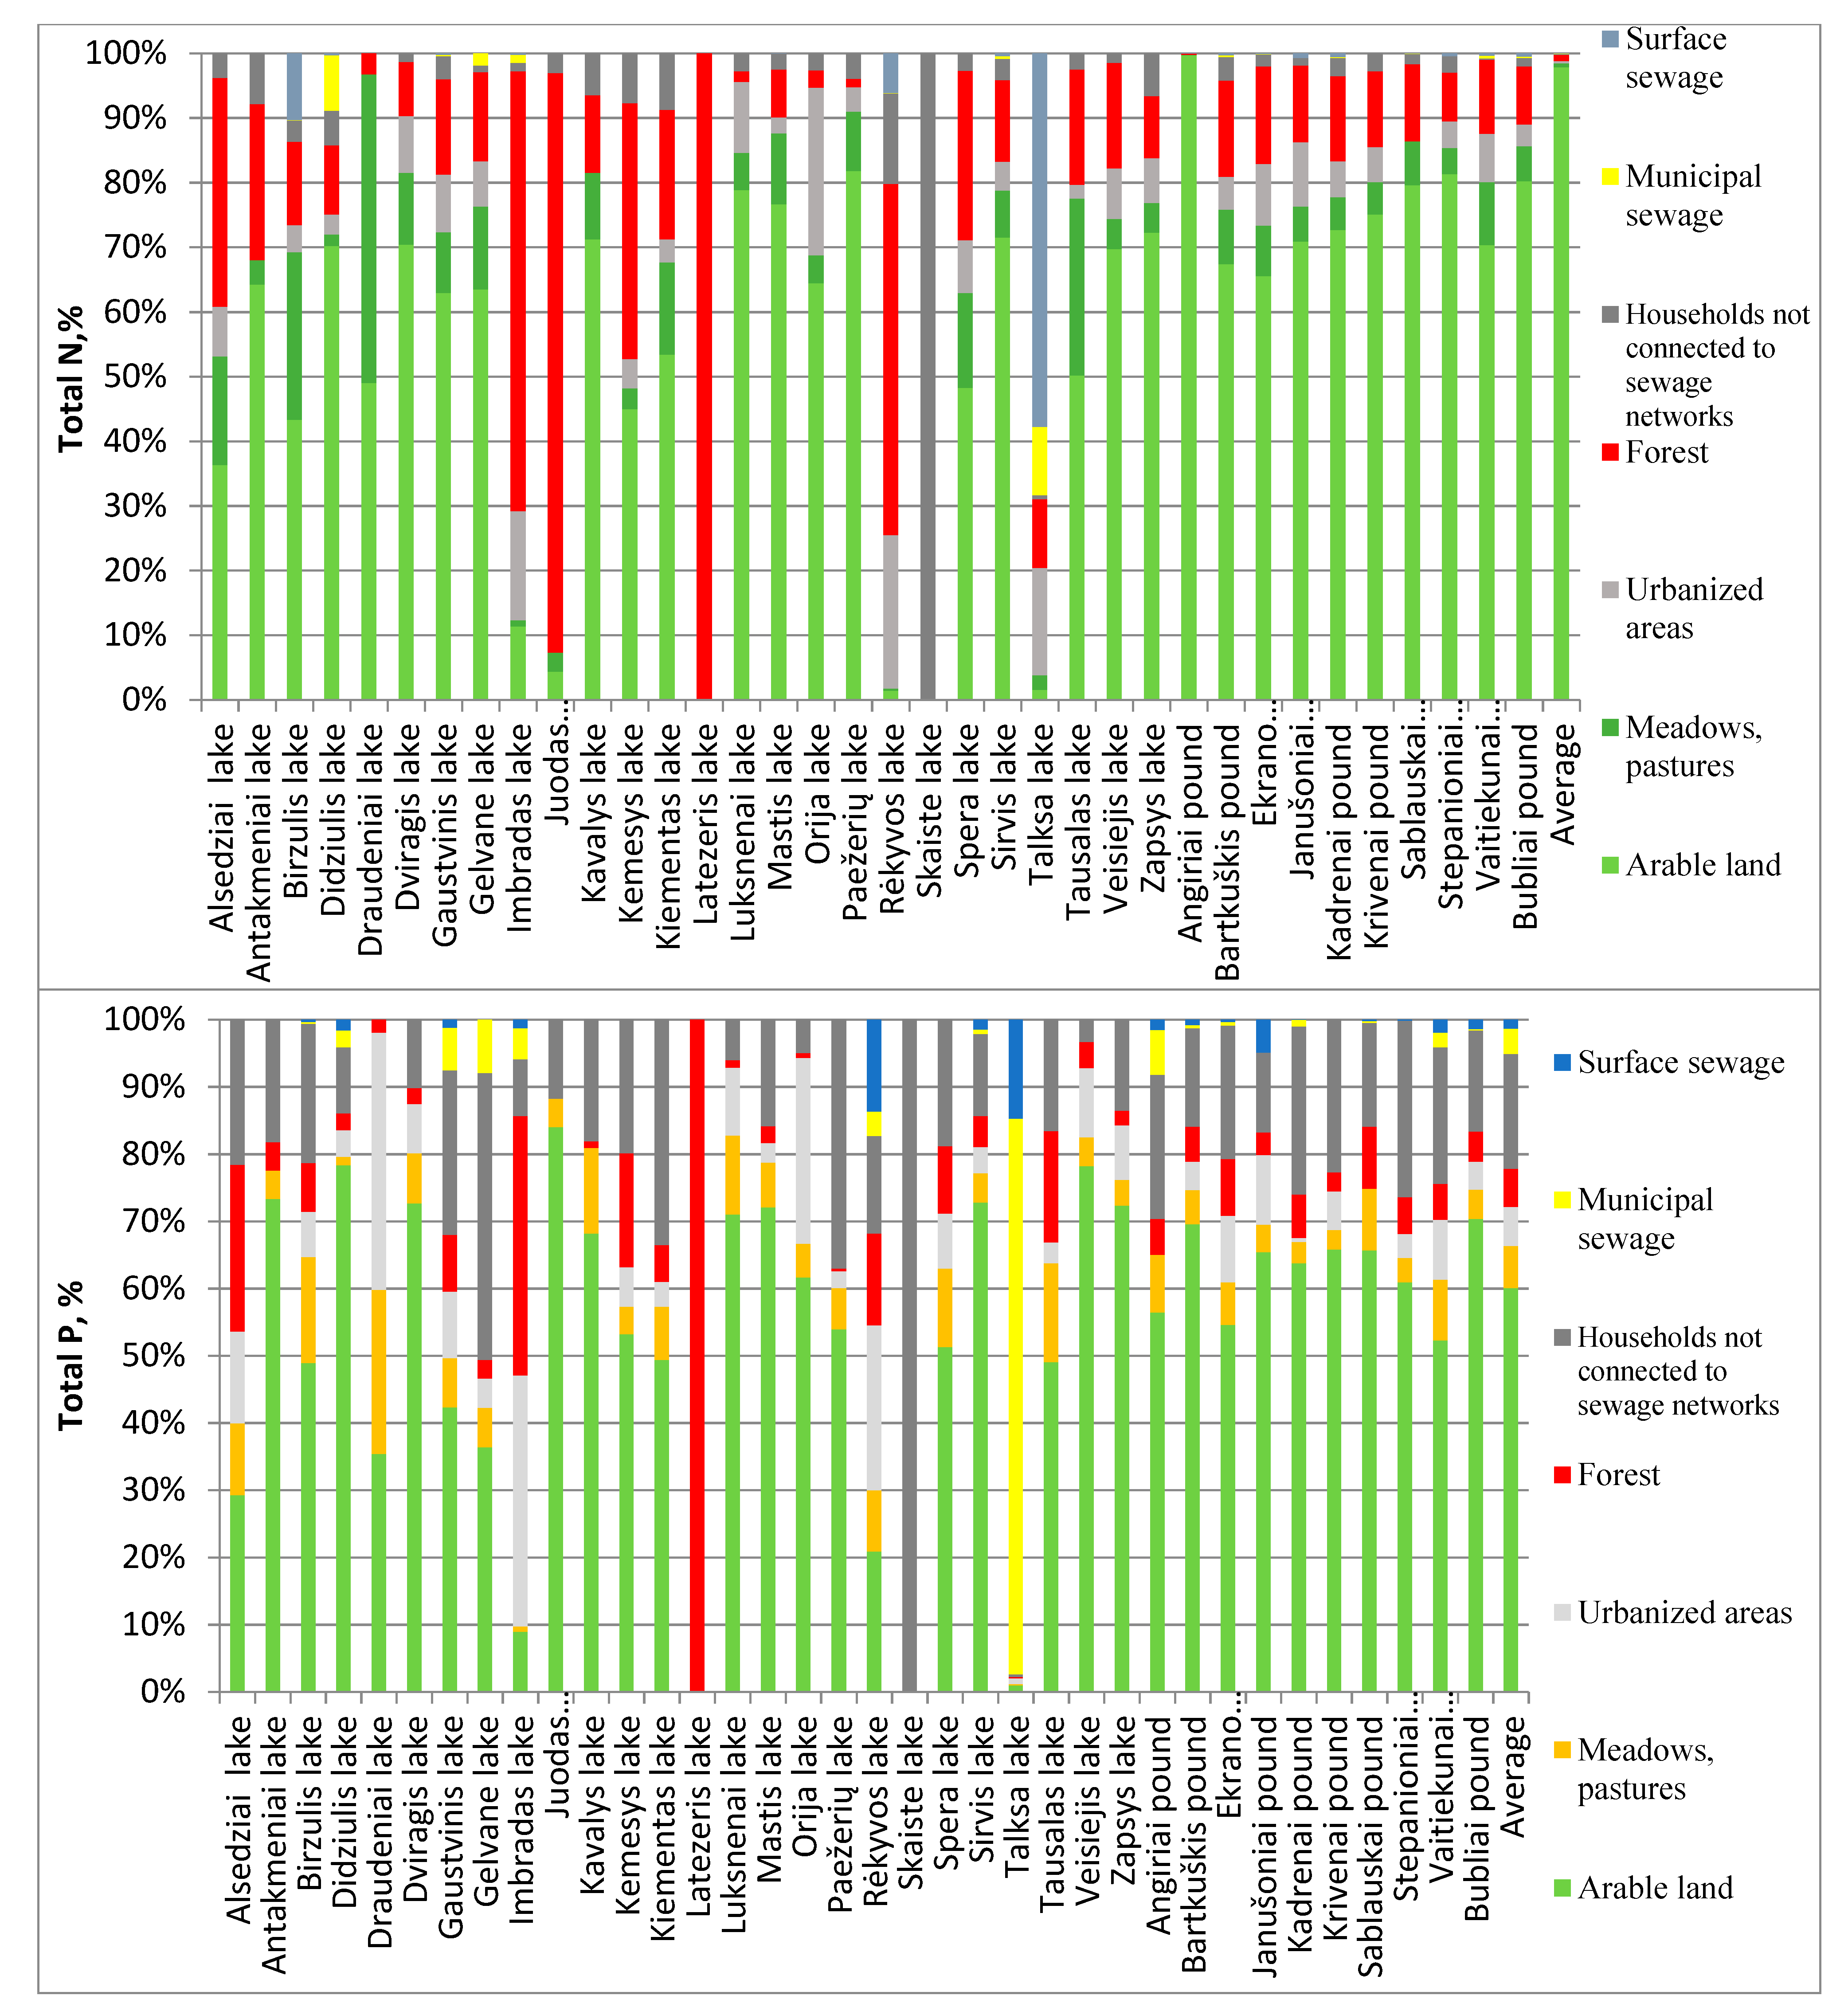
Percentage distribution of total nitrogen and phosphorus loads in lake basins (t/year) are presented in Figure 4.
The highest annual total nitrogen load for lake basins on average per year was from agricultural pollution from arable land (98.85%), background pollution from forests (0.94%), background pollution from urban areas (0.39%), pollution from meadows and pastures (60%), pollution from residents who were not connected to sewage systems (0.15%), surface water (0.05%) and municipal wastewater (0.03%).
The highest annual load of total phosphorus in lake basins was from agricultural pollution from arable land (60%), populations not connected to sewage networks (17.04%), agricultural pollution from meadows and pastures (6.26%), background pollution from urban areas (5.81%), background pollution from forests (5.67%), municipal wastewater (3.78%) and surface wastewater (1.33%).
3.3. Effects of Anthropogenic Loading on Total Phosphorus, Total Nitrogen Concentration, Chlorophyll “a” EQS Values, Taxonomic Composition and the Abundance of Macrophytes, Zoobenthos and Ichthyofauna
The effect of anthropogenic loading on total phosphorus concentration total P (Y) was calculated by multiple regression analysis. The results are presented in Table 1.
A multiple regression analysis of the influence of anthropogenic loads in basins on the concentration of total phosphorus in the water showed that the total P value was influenced by the discharge of municipal and surface wastewater and the existing area of organic farms (p < 0.05). The higher the total P concentration in municipal and surface wastewater was, the higher the total P value was in the water (positive function), and the larger the area of organic farms in the lake feeding basins was, the lower the total P concentration was in the water (negative function). No statistically significant effect of other studied factors on total phosphorus concentration in water was found.
The effect of anthropogenic loads on the total nitrogen concentration, total N (Y), was calculated by multiple regression analysis. The results are presented in Table 2.
Multiple regression analysis of the influence of anthropogenic loads on the total nitrogen concentration in the water showed that the total N value was affected by agricultural land, and that the total N amount was generated from arable land and meadows, households that were not connected to sewage networks, discharged municipal wastewater, water body feeding area and the existing area of organic farms (p < 0.05). The higher the concentration of total N from arable land not connected to the sewerage network, households and municipal wastewater and the larger the areas of the water body basin and agricultural land were, the higher the value of total N in the water (positive function), and the higher the total N concentration from grassland pastures and the larger the area of organic farms in feeding basins were, the lower the total N concentration in the water (negative function).
The effect of anthropogenic loads on the EQR (Y) values of chlorophyll “a” was calculated by multiple regression analysis. The results are presented in Table 3.
A multiple regression analysis of the influence of anthropogenic loads in basins on the EQS values of chlorophyll “a” in the water showed that the EQF values were influenced by the relative number of animals in the basin (p < 0.05). The higher the relative number of animals in the basin was, the lower the EQS value of chlorophyll “a” in the water and the worse the water status (negative function).
The effect of anthropogenic loading on macrophyte taxonomic composition and abundance, MEI (Y), was calculated by multiple regression analysis. The results are presented in Table 4.
Multiple regression analysis of the influence of anthropogenic loads in basins on the taxonomic composition and abundance of macrophytes, MEI, in the water showed that MEI values were influenced by the relative number of animals and the area of agricultural land in the basin (p < 0.05). The higher the relative number of animals was, the larger the area of agricultural land in the basin. When the taxonomic composition and abundance of macrophytes in the water were lower, the water status was worse (negative function).
The effect of anthropogenic loads on the taxonomic composition, abundance and age of ichthyofauna, LFI (lake fish index) (Y), was calculated by multiple regression analysis. The results are presented in Table 5.
A multiple regression analysis of the influence of anthropogenic loads in basins on the taxonomic composition, abundance and age of ichthyofauna, LFI, in the water showed that the LFI values were affected by the current percentage of organic farms in the basin (p < 0.05). The higher the percentage of organic farms in the basin was, the higher the taxonomic composition, abundance and age of ichthyofauna in the water and the better the water status (positive function).
The effect of anthropogenic loads on the taxonomic composition and abundance (Y) of zoo benthos was calculated by multiple regression analysis. The results are presented in Table 6.
Multiple regression analysis of the influence of anthropogenic loads in basins on the taxonomic composition and abundance of zoo benthos in the water showed that the zoo benthos values were influenced by the current percentage of organic farms in the basin, basin area and arable land area (p < 0.05). The higher the percentage of organic farms in the basin was, the higher the taxonomic composition and abundance values of zoobenthos in the water and the better the water status (positive function). The greater the basin area and the arable land area in the basin were, the lower the taxonomic composition and abundance values of zoobenthos in the water and the poorer the water status (negative function).
4. Discussion
With the relatively high discharges of N and P from agriculture, industry and wastewater treatment plants, this study found that 50% of the water bodies surveyed did not meet the good and very good ecological status values for total N, and 20% of the studied water bodies did not meet the good and very good ecological status values for total P [38]. Agricultural nitrogen flows in a reservoir watershed have implications for water pollution mitigation [39]. The study found that the highest total nitrogen load in lake basins per year on average is from agricultural pollution from arable land (98.85%), and the highest total phosphorus load is also from agricultural pollution from arable land (60%). Similar results were obtained during the simulation. It was established that, on average, 90% of all nitrogen got to the Mūša subcatchment from the scattered pollution sources. It included 87% of the arable land and just a little more than 3% of the forest territory and pastures. 10% of all nitrogen of the subcatchment came from the point-pollution sources. The highest amounts of all phosphor of the Mūša subcatchment got to the subcatchment from the point-pollution sources (about 49%), ploughed 18 land –(36%) and just a little more than 15% from the forestall territory and pastures [40].
Pollution loads are divided into groups according to their sources: diffuse pollution from agricultural lands (arable land, meadows and pastures); minimal pollution from organic farms [41]; background pollution from natural habitats (forests) not connected to the sewage system; and pollution from household wastewater, urban wastewater [42], municipal and industrial wastewater [43,44] and surface (rain) wastewater that are not connected to treatment plants. Climate change might have profound effects on nitrogen (N) dynamics in the cultivated landscape as well as on N transport in streams and the eutrophication of lakes [45].
A multiple regression analysis of the influence of anthropogenic loads in basins on the concentration of total phosphorus in water showed that the total P value was influenced by the discharge of municipal and surface wastewater and the existing area of organic farms. This result is consistent with the results obtained by another author [46,47]. The decrease in total phosphorus and nitrogen concentrations in the water was due to the increase in the area of organic farms using nitrogen (N), phosphorus (P) and potassium (K) preparations [48]. Multiple regression analysis of the influence of anthropogenic loads in basins on the taxonomic composition, abundance and age of ichthyofauna, LFI, in the water showed that the LFI values were influenced by the current percentage of organic farms in the basin, and such trends have been evaluated by other researchers [49]. It should be noted that this variable is also influenced by seasonality, water body structure [50] and anaerobic substances [51]. Research shows that organic farming can improve surface water quality [33].
5. Conclusions
- The total N values did not correspond to the good and very good ecological status classes in 50% of the tested water bodies, and the total P values did not correspond to the good and very good ecological status classes in 20% of the tested water bodies.
- Lakes and pond basins generate the largest amounts of pollution from agricultural sources: arable land-total nitrogen 1554.13 t/year and 1.94 t/year phosphorus and meadow pastures-total nitrogen 9.50 t/year and 0.20 t/year phosphorus.
- The highest total nitrogen load in lake basins per year on average is from agricultural pollution from arable land (98.85%), and the highest total phosphorus load is also from agricultural pollution from arable land (60%).
- Multiple regression analysis of the influence of anthropogenic loads in basins on the total phosphorus concentration in the water showed that the higher the total P concentration in municipal and surface wastewater was, the higher the total P value in the water, and the larger the area of organic farms in lake feeding basins was, the lower the total P value in the water (p < 0.05). The higher the concentrations of total N from arable land not connected to the sewerage network, households and municipal wastewater and the larger the area of the water body basin and area of agricultural land were, the higher the value of the total N in the water (p < 0.05). The higher the total N concentration from meadow pastures and the larger the area of organic farms in the lakes feeding the basins were, the lower the total N concentration in the water (p < 0.05). The higher the relative number of animals in the basin and the larger the area of agricultural land in the basin were, the higher the chlorophyll “a” LFI value (p < 0.05). The lower the macrophyte taxonomic composition and abundance MEI values and the lower the taxonomic composition and abundance values of zoobenthos in the water were, the poorer the water status (p < 0.05). The higher the percentage of organic farms in the basin; the higher the taxonomic composition, abundance and age of the ichthyofauna in the water; and the higher the taxonomic composition and abundance values of the zoobenthos in the water were, the better the water status (p < 0.05).
Author Contributions
L.Č. (Laima Česonienė) designed the study and performed the experiments; L.Č. (Laima Česonienė), D.Š., V.M. and Laura Č. (Laura Čiteikė) performed the experiments, analyzed the data, and wrote the manuscript. All authors have read and agreed to the published version of the manuscript.
Funding
This research was funded by the “Research Council of Lithuania” (Project BioRes No. S-LJB-20-3).
Institutional Review Board Statement
Not applicable.
Informed Consent Statement
Not applicable.
Data Availability Statement
Data available in a publicly accessible repository.
Conflicts of Interest
The authors declare no conflict of interest.
References
- OJEC. Council Directive 91/676/EEC of 12 December 1991 Concerning the Protection of Waters Against Pollution Caused by Nitrates From Agricultural Sources; OJEC: Aberdeen, UK, 1991. [Google Scholar]
- OJEC. Establishing a Framework for Community Action in the Field of Water Policy (Water Framework Directive), 2000/60/EC, L327; OJEC: Aberdeen, UK, 2000. [Google Scholar]
- Harrison, S.; McAree, C.; Mulville, W.; Sullivan, T. The problem of agricultural ‘diffuse’ pollution: Getting to the point. Sci. Total Environ. 2019, 677, 700–717. [Google Scholar] [CrossRef]
- Lahlou, F.-Z.; Mackey, H.R.; Al-Ansari, T. Wastewater reuse for livestock feed irrigation as a sustainable practice: A socio-environmental-economic review. J. Clean. Prod. 2021, 294, 126331. [Google Scholar] [CrossRef]
- Schoumans, O.F.; Chardon, W.J.; Bechmann, M.E.; Gascuel-Odoux, C.; Hofman, G.; Kronvang, B.; Rubæk, G.H.; Ulén, B.; Dorioz, J.M. Mitigation options to reduce phosphorus losses from the agricultural sector and improve surface water quality: A review. Sci. Total Environ. 2014, 468–469, 1255–1266. [Google Scholar] [CrossRef] [PubMed]
- Wall, D.; Jordan, P.; Melland, A.R.; Mellander, P.E.; Buckley, C.; Reaney, S.M.; Shortle, G. Using the nutrient transfer continuum concept to evaluate the European union nitrates directive National action programme. Environ. Sci. Policy 2011, 14, 664–674. [Google Scholar] [CrossRef]
- Jiang, Y.; Chen, S.; Hu, B.; Zhou, Y.; Liang, Z.; Jia, X.; Huang, M.; Wei, J.; Shi, Z. A comprehensive framework for assessing the impact of potential agricultural pollution on grain security and human health in economically developed areas. Environ. Pollut. 2020, 263, 114653. [Google Scholar] [CrossRef]
- Xiao, L.; Liu, J.; Ge, J. Dynamic game in agriculture and industry cross-sectoral water pollution governance in developing countries. Agric. Water Manag. 2021, 243, 106417. [Google Scholar] [CrossRef]
- Alcon, F.; de-Miguel, M.D.; Martínez-Paz, J.M. Assessment of real and perceived cost-effectiveness to inform agricultural diffuse pollution mitigation policies. Land Use Policy 2020, 104561. [Google Scholar] [CrossRef]
- Geng, M.; Wang, K.; Yang, N.; Li, F.; Zou, Y.; Chen, X.; Deng, Z.; Xie, Y. Spatiotemporal water quality variations and their relationship with hydrological conditions in Dongting lake after the operation of the Three Gorges Dam, China. J. Clean. Prod. 2020, 283, 124644. [Google Scholar] [CrossRef]
- Bouma, J. The importance of validated ecological indicators for manure regulations in the Netherlands. Ecol. Indic. 2016, 66, 301–305. [Google Scholar] [CrossRef]
- Vasistha, P.; Ganguly, R. Water quality assessment of natural lakes and its importance: An overview. Mater. Today Proc. 2020, 32, 544–552. [Google Scholar] [CrossRef]
- Mahananda, M.R.; Mohanty, B.P.; Behera, N.R. Physico-chemical analysis of surface and ground water of bargarh district, Orissa, India. Int. J. Res. Rev. Appl. Sci. 2010, 2, 284–295. [Google Scholar]
- FAOSTAT. Fertilizers Indicators. Available online: http://www.fao.org/faostat/en/#data/EF (accessed on 29 January 2021).
- Waller, D.M.; Meyer, A.G.; Raff, Z.; Apfelbaum, S.I. Shifts in precipitation and agricultural intensity increase phosphorus concentrations and loads in an agricultural watershed. J. Environ. Manag. 2021, 284, 112019. [Google Scholar] [CrossRef]
- Merchán, D.; Sanz, L.; Alfaro, A.; Pérez, I.; Goñi, M.; Solsona, F.; Hernández-García, I.; Pérez, C.; Casalí, J. Irrigation implementation promotes increases in salinity and nitrate concentration in the lower reaches of the Cidacos river (Navarre, Spain). Sci. Total Environ. 2020, 706, 135701. [Google Scholar] [CrossRef] [PubMed]
- Hanson, P.C.; Stillman, A.B.; Jia, X.; Karpatne, A.; Dugan, H.A.; Carey, C.C.; Stachelek, J.; Ward, N.K.; Zhang, Y.; Read, J.S.; et al. Predicting lake surface water phosphorus dynamics using process-guided machine learning. Ecol. Model. 2020, 430, 109136. [Google Scholar] [CrossRef]
- Ni, X.; Yuan, Y.; Liu, W. Impact factors and mechanisms of dissolved reactive phosphorus (DRP) losses from agricultural fields: A review and synthesis study in the lake Erie basin. Sci. Total Environ. 2020, 714, 136624. [Google Scholar] [CrossRef] [PubMed]
- Palmer-Felgate, E.J.; Jarvie, H.P.; Withers, P.J.A.; Mortimer, R.J.G.; Krom, M.D. Stream-bed phosphorus in paired catchments with different agricultural land use intensity. Agric. Ecosyst. Environ. 2009, 134, 53–66. [Google Scholar] [CrossRef]
- Sharpley, A.; Foy, B.; Withers, P. Practical and innovative measures for the control of agricultural phosphorus losses to water: An overview. J. Environ. Qual. 2000, 29, 1–9. [Google Scholar] [CrossRef]
- Rolland, D.C.; Haury, J.; Marmonier, P.; Lagadeuc, Y. Effect of macrophytes on flow conditions and deposition of suspended particles in small streams: An experimental study using artificial vegetation. J. Water Sci. 2015, 28, 231–245. [Google Scholar] [CrossRef] [Green Version]
- Bai, G.; Zhang, Y.; Yan, P.; Yan, W.; Kong, L.; Wang, L.; Wang, C.; Liu, Z.; Liu, B.; Ma, J.; et al. Spatial and seasonal variation of water parameters, sediment properties, and submerged macrophytes after ecological restoration in a long-term (6 year) study in Hangzhou west lake in China: Submerged macrophyte distribution influenced by environmental variables. Water Res. 2020, 186, 116379. [Google Scholar] [CrossRef]
- Chen, R.; Teng, Y.; Chen, H.; Hu, B.; Yue, W. Groundwater pollution and risk assessment based on source apportionment in a typical cold agricultural region in Northeastern China. Sci. Total Environ. 2019, 696, 133972. [Google Scholar] [CrossRef]
- Sathaiah, M.; Chandrasekaran, M. A bio-physical and socio-economic impact analysis of using industrial treated wastewater in agriculture in Tamil Nadu, India. Agric. Water Manag. 2020, 241, 106394. [Google Scholar] [CrossRef]
- Robles-Rodriguez, C.E.; Ben-Ayed, A.; Bernier, J.; Rocher, V.; Dochain, D. Management of an integrated network of wastewater treatment plants for improving water quality in a river basin. IFAC PapersOnLine 2021, 52, 358–363. [Google Scholar] [CrossRef]
- Sena, M.; Seib, M.; Noguera, D.R.; Hicks, A. Environmental impacts of phosphorus recovery through struvite precipitation in wastewater treatment. J. Clean. Prod. 2021, 280, 124222. [Google Scholar] [CrossRef]
- Alapati, S.; Kabala, Z.J. Recovering the History of a Groundwater Contaminant Plume: Method of Quasi-Reversibility. Hydrol. Process. 2015, 14, 1003–101615. [Google Scholar] [CrossRef]
- Drecht, G.V. Modelling of regional scale nitrate leaching from agricultural soils, the Netherlands. Appl. Geochem. 1993, 8, 175–178. [Google Scholar] [CrossRef]
- Gutiérrez, M.; Biagioni, R.N.; Alarcón-Herrera, M.T.; Rivas-Lucero, B.A. An overview of nitrate sources and operating processes in arid and semiarid aquifer systems. Sci. Total Environ. 2018, 624, 1513–1522. [Google Scholar] [CrossRef] [PubMed]
- Gajewska, M.; Skrzypiec, K.; Jóźwiakowski, K.; Bugajski, P. Kinetics of pollutants removal in hybrid treatment wetlands—Case study comparison. Ecol. Eng. 2018, 120, 222–229. [Google Scholar] [CrossRef]
- Blankenberg, A.G.B.; Haarstad, K.; Søvik, A.K. Nitrogen retention in constructed wetland filters treating diffuse agriculture pollution. Desalination 2008, 226, 114–120. [Google Scholar] [CrossRef]
- Withers, P.; Neal, C.; Jarvie, H.; Doody, D. Agriculture and eutrophication: Where do we go from here? Sustainability 2014, 6, 5853–5875. [Google Scholar] [CrossRef] [Green Version]
- Feng, D.; Zhao, G. Footprint assessments on organic farming to improve ecological safety in the water source areas of the south-to-north water diversion project. J. Clean. Prod. 2020, 254, 120130. [Google Scholar] [CrossRef]
- Geng, Y.; Rui, Q.I.; Zhang, P. A water footprint based model on river basin eco-compensation. China Popul. Resour. Environ. 2009, 19, 11–16. [Google Scholar]
- Boone, L.; Roldán-Ruiz, I.; Van Linden, V.; Muylle, H.; Dewulf, J. Environmental sustainability of conventional and organic farming: Accounting for ecosystem services in life cycle assessment. Sci. Total Environ. 2019, 695, 133841. [Google Scholar] [CrossRef] [PubMed]
- Approval of the Description of the Procedure for Assessing the Ecological Status of Surface Water Bodies; Order of the Minister of the Environment of the Republic of Lithuania: 12 April 2007 No. D1-210. Lietuvos Respublikos Aplinkos Ministro Įsakymas dėl Paviršinių Vandens Telkinių Būklės Nustatymo Metodikos Patvirtinimo 2007m. Balandžio 12 d. Nr. D1. Available online: https://e-seimas.lrs.lt/portal/legalAct/lt/TAD/TAIS.296626/asr (accessed on 12 April 2021).
- Arnold, J.G.; Srinisvan, R.; Muttiah, R.S.; Williams, J.R. Large area hydrologic modeling and assessment. Part I: Model development. J. Am. Water Resour. Assoc. 1998, 34, 73–89. [Google Scholar] [CrossRef]
- Serra, J.; Cordovil, C.M.D.S.; Cruz, S.; Cameira, M.R.; Hutchings, N.J. Challenges and solutions in identifying agricultural pollution hotspots using gross nitrogen balances. Agric. Ecosyst. Environ. 2019, 283, 106568. [Google Scholar] [CrossRef]
- Oenema, O.; van Liere, L.; Schoumans, O. Effects of lowering nitrogen and phosphorus surpluses in agriculture on the quality of groundwater and surface water in the Netherlands. J. Hydrol. 2005, 304, 289–301. [Google Scholar] [CrossRef]
- Stankevičienė, R. Research and Evaluation of the Anthropogenic Activity Impact on the River Runoff and Water Quality; Summary of Doctoral Dissertation; Vilnius Technica: Vilnius, Lithuania, 2010; Available online: https://talpykla.elaba.lt/elaba-fedora/objects/elaba:1862147/datastreams/MAIN/content (accessed on 12 April 2021).
- Sajadian, M.; Khoshbakht, K.; Liaghati, H.; Veisi, H.; Damghani, A.M. Developing and quantifying indicators of organic farming using analytic hierarchy process. Ecol. Indic. 2017, 83, 103–111. [Google Scholar] [CrossRef]
- Kumar, V.; Jaiswal, K.; Verma, M.; Vlaskin, M.S.; Nanda, M.; Chauhan, P.K.; Ajay Singh, A.; Kim, H. Algae-based sustainable approach for simultaneous removal of micropollutants, and bacteria from urban wastewater and its real-time reuse for aquaculture. Sci. Total Environ. 2021, 774, 145556. [Google Scholar] [CrossRef]
- Dalecka, B.; Strods, M.; Juhna, T.; Rajarao, G.K. Removal of total phosphorus, ammonia nitrogen and organic carbon from non-sterile municipal wastewater with trametes versicolor and Aspergillus luchuensis. Microbiol. Res. 2020, 241, 126586. [Google Scholar] [CrossRef]
- Mantis, I.; Voutsa, D.; Samara, C. Assessment of the environmental hazard from municipal and industrial wastewater treatment sludge by employing chemical and biological methods. Ecotoxicol. Environ. Saf. 2005, 62, 397–407. [Google Scholar] [CrossRef]
- Xu, R.; Cai, Y.; Wang, X.; Li, C.; Liu, Q.; Yang, Z. Agricultural nitrogen flow in a reservoir watershed and its implications for water pollution mitigation. J. Clean. Prod. 2020, 267, 122034. [Google Scholar] [CrossRef]
- Wu, Y.; Kerr, P.G.; Hu, Z.; Yang, L. Eco-restoration: Simultaneous nutrient removal from soil and water in a complex residential–cropland area. Environ. Pollut. 2010, 158, 2472–2477. [Google Scholar] [CrossRef]
- De Wit, M.; Behrendt, H. Nitrogen and phosphorus emissions from soil to surface water in the rhine and elbe basins. Water Sci. Technol. 1999, 39, 109–116. [Google Scholar] [CrossRef]
- Nowak, B.; Nesme, T.; David, C.; Pellerin, S. Nutrient recycling in organic farming is related to diversity in farm types at the local level. Agric. Ecosyst. Environ. 2015, 204, 17–26. [Google Scholar] [CrossRef]
- Han, H.; Chen, C.; Bai, M.; Xu, T.; Yang, H.; Shi, A.; Ding, G.C.; Li, J. Abundance and diversity of denitrifying bacterial communities associated with N2O emission under long-term organic farming. Eur. J. Soil Biol. 2020, 97, 103153. [Google Scholar] [CrossRef]
- Meena, D.K.; Lianthuamluaia, L.; Mishal, P.; Swain, H.S.; Naskar, B.K.; Saha, S.; Sandhya, K.M.; Kumari, S.; Tayung, T.; Sarkar, U.K.; et al. Assemblage patterns and community structure of macro-zoobenthos and temporal dynamics of eco-physiological indices of two wetlands, in lower gangetic plains under varying ecological regimes: A tool for wetland management. Ecol. Eng. 2019, 130, 1–10. [Google Scholar] [CrossRef]
- Foschi, J.; Turolla, A.; Antonelli, M. Soft sensor predictor of E. coli concentration based on conventional monitoring parameters for wastewater disinfection control. Water Res. 2021, 191, 116806. [Google Scholar] [CrossRef] [PubMed]
Figure 1.
Research locations.

Figure 2.
Total concentrations of nitrogen and phosphorus in lakes and ponds, 2015–2019.

Figure 3.
Total nitrogen and phosphorus load in lake basins (t/year).

Figure 4.
Percentage distribution of total nitrogen and phosphorus loads in lake basins (t/year).


Table 1.
The influence of anthropogenic loads in basins on the total phosphorus concentration in the water.
Table 1.
The influence of anthropogenic loads in basins on the total phosphorus concentration in the water.
| Environmental Factor | Unstandardized Coefficients | Standardized Coefficients | t | Significance Level p < 0.05 | |
|---|---|---|---|---|---|
| B | Std. Error | Beta | |||
| Constant | 0.076 | 0.016 | 4.625 | 0.000 | |
| P from arable land, t/years | 0.016 | 0.024 | 0.908 | 0.663 | 0.515 |
| P from meadows, t/year | 0.208 | 0.174 | 1.565 | 1.200 | 0.245 |
| P from cities, t/year | 0.063 | 0.071 | 0.459 | 0.896 | 0.381 |
| P from forest, t/year | −0.094 | 0.268 | −0.595 | −0.352 | 0.729 |
| P from households not connected to sewage networks, t/year | 0.074 | 0.113 | 1.444 | 0.659 | 0.518 |
| * P from municipal wastewater, t/year | 0.133 | 0.085 | 1.248 | 1.561 | 0.035 |
| * P from surface wastewater t/year | 0.179 | 0.128 | 1.163 | 1.352 | 0.045 |
| P from organic farms, t/year | 1.184 × 10⁻⁵ | 0.000 | 0.169 | 0.338 | 0.739 |
| Current number of organic farms, % | −0.006 | 0.007 | −0.247 | −0.959 | 0.350 |
| * Current area of organic farms, ha | −0.149 | 0.098 | −1.800 | −1.523 | 0.044 |
| Basin area, ha | 0.001 | 0.001 | 2.995 | 0.741 | 0.468 |
| Conditional number of livestock | 2.426 × 10⁻⁵ | 0.000 | 2.238 | 1.286 | 0.214 |
| Agricultural land, ha | 1.299 × 10⁻⁵ | 0.000 | 3.036 | 0.403 | 0.692 |
| Arable land area, ha | 2.518 × 10⁻⁵ | 0.000 | 4.983 | 0.868 | 0.396 |
| Number of farms in the basin, units | 0.000 | 0.000 | 2.910 | 0.852 | 0.405 |
Dependent Variable: total P. * Significance factor, p < 0.05.
Table 2.
The influence of anthropogenic loads in basins on the total nitrogen concentration in the water.
Table 2.
The influence of anthropogenic loads in basins on the total nitrogen concentration in the water.
| Environmental Factor | Unstandardized Coefficients | Standardized Coefficients | t | Significance Level p < 0.05 | |
|---|---|---|---|---|---|
| B | Std. Error | Beta | |||
| Constant | 2.251 | 0.282 | 7.988 | 0.000 | |
| * N from arable land, t/year | 0.300 | 0.080 | 2.628 | 2.171 | 0.046 |
| * N from meadows, t/year | −0.307 | 0.081 | −3.438 | −3.806 | 0.001 |
| N from cities, t/year | 0.074 | 0.066 | 0.705 | 1.121 | 0.276 |
| N from forest, t/years | −0.063 | 0.124 | −1.073 | −0.511 | 0.615 |
| * N from households not connected to sewage networks, t/year | 0.886 | 0.212 | 2.256 | 4.174 | 0.001 |
| * N from municipal wastewater, t/year | 0.541 | 0.220 | 0.384 | 2.455 | 0.024 |
| N from surface wastewater t/year | 0.140 | 0.120 | 0.180 | 1.166 | 0.258 |
| N from organic farms, t/year | 0.001 | 0.014 | 0.223 | 0.092 | 0.927 |
| Current number of organic farms, % | 0.000 | 0.001 | −0.131 | −0.315 | 0.756 |
| * Current area of organic farms, ha | −1.158 | 0.122 | −1.181 | −2.295 | 0.011 |
| * Basin area, ha | 0.001 | 0.000 | 2.865 | 2.656 | 0.016 |
| Conditional number of livestock | 0.001 | 0.001 | 3.865 | 0.847 | 0.408 |
| * Agricultural land, ha | 0.001 | 0.001 | 4.718 | 1.476 | 0.046 |
| Arable land area, ha | 0.002 | 0.005 | 0.767 | 0.470 | 0.644 |
| Number of farms in the basin, units | 0.001 | 0.003 | 0.564 | 0.834 | 0.584 |
a. Dependent Variable: total N; * Significance factor, p < 0.05.
Table 3.
Influence of anthropogenic loads in basins on the EQR (ecological quality ratio) values of chlorophyll “a” in the water.
Table 3.
Influence of anthropogenic loads in basins on the EQR (ecological quality ratio) values of chlorophyll “a” in the water.
| Environmental Factor | Unstandardized Coefficients | Standardized Coefficients | t | Significance Level p < 0.05 | |
|---|---|---|---|---|---|
| B | Std. Error | Beta | |||
| Constant | 0.186 | 0.037 | 5.078 | 0.000 | |
| Current number of organic farms, % | 0.015 | 0.013 | 0.234 | 1.163 | 0.261 |
| Current area of organic farms, ha | 6.595 × 10⁻⁵ | 0.000 | 0.097 | 0.342 | 0.736 |
| Basin area, ha | 0.001 | 0.001 | 0.372 | 0.642 | 0.529 |
| * Conditional number of livestock | −0.000 | 0.000 | −1.244 | −2.365 | 0.030 |
| Agricultural land area, ha | −4.660 × 10⁻⁵ | 0.000 | −0.604 | −0.461 | 0.651 |
| Arable land area, ha | −4.970 × 10⁻⁵ | 0.000 | −0.397 | −0.777 | 0.448 |
| Number of farms in the basin, units | 0.000 | 0.001 | −0.220 | −0.283 | 0.781 |
a. Dependent Variable: EQR; * Significance factor, p < 0.05.
Table 4.
Influence of anthropogenic loads in basins on the taxonomic composition and abundance of macrophytes, MEI, in the water.
Table 4.
Influence of anthropogenic loads in basins on the taxonomic composition and abundance of macrophytes, MEI, in the water.
| Environmental Factor | Unstandardized Coefficients | Standardized Coefficients | t | Significance Level p < 0.05 | |
|---|---|---|---|---|---|
| B | Std. Error | Beta | |||
| Constant | 0.414 | 0.056 | 7.431 | 0.000 | |
| Current number of organic farms, % | 0.004 | 0.020 | 0.047 | 0.195 | 0.847 |
| Current area of organic farms, ha | 0.000 | 0.000 | 0.220 | 0.664 | 0.515 |
| Basin area, ha | −0.002 | 0.002 | −0.611 | −0.999 | 0.331 |
| * Conditional number of livestock | −0.000 | 0.000 | −1.084 | −1.944 | 0.068 |
| * Agricultural land area, ha | −0.000 | 0.000 | −2.281 | −1.533 | 0.043 |
| Arable land area, ha | −3.838 × 10⁻⁵ | 0.000 | −0.237 | −0.395 | 0.697 |
| Number of farms in the basin, units | −0.001 | 0.001 | −0.583 | −0.618 | 0.545 |
a. Dependent Variable: Macrophytes; * Significance factor, p < 0.05.
Table 5.
Influence of anthropogenic loads in basins on the taxonomic composition, abundance and age of ichthyofauna, LFI (lake fish index), in the water.
Table 5.
Influence of anthropogenic loads in basins on the taxonomic composition, abundance and age of ichthyofauna, LFI (lake fish index), in the water.
| Environmental Factor | Unstandardized Coefficients | Standardized Coefficients | t | Significance Level p < 0.05 | |
|---|---|---|---|---|---|
| B | Std. Error | Beta | |||
| Constant | 0.540 | 0.056 | 9.586 | 0.000 | |
| * Current number of organic farms % | 0.044 | 0.020 | 0.531 | 2.250 | 0.047 |
| Current area of organic farms, ha | 0.000 | 0.000 | 0.317 | 0.979 | 0.341 |
| Basin area, ha | 0.002 | 0.002 | 0.676 | 1.130 | 0.273 |
| Conditional number of livestock | −1.558 × 10⁻⁵ | 0.000 | −0.093 | −0.171 | 0.867 |
| Agricultural land area, ha | −3.697 × 10⁻⁵ | −0.000 | −0.362 | −0.248 | 0.807 |
| Arable land area, ha | −8.631 × 10⁻⁵ | 0.000 | −0.052 | −0.088 | 0.931 |
| Number of farms in the basin, units | 0.000 | 0.001 | 0.094 | 0.101 | 0.920 |
a. Dependent Variable: LFI (lake fish index); * Significance factor, p < 0.05.
Table 6.
Influence of anthropogenic loads in basins on taxonomic composition and abundance of EPT (Ephemeroptera (mayflies), Plecoptera (stoneflies) and Trichoptera (caddisflies) taxa in the water.
Table 6.
Influence of anthropogenic loads in basins on taxonomic composition and abundance of EPT (Ephemeroptera (mayflies), Plecoptera (stoneflies) and Trichoptera (caddisflies) taxa in the water.
| Environmental Factor | Unstandardized Coefficients | Standardized Coefficients | t | Significance Level p < 0.05 | |
|---|---|---|---|---|---|
| B | Std. Error | Beta | |||
| Constant | 0.514 | 0.047 | 10.959 | 0.000 | |
| * Current number of organic farms, % | 0.032 | 0.016 | 0.492 | 1.998 | 0.043 |
| Current area of organic farms, ha | −4.159 × 10⁻⁵ | 0.000 | −0.098 | −0.260 | 0.804 |
| * Basin area, ha | −0.006 | 0.003 | −2.346 | −2.211 | 0.048 |
| Conditional number of livestock | 0.000 | 0.000 | 1.118 | 1.255 | 0.256 |
| Agricultural land area, ha | 0.000 | 0.000 | 1.685 | 1.050 | 0.334 |
| * Arable land area, ha | −0.000 | 0.000 | −1.242 | −2.098 | 0.049 |
| Number of farms in the basin, units | 0.001 | 0.001 | 0.785 | 0.508 | 0.630 |
a. Dependent Variable: Zoobenthos; * Significance factor, p < 0.05.
Publisher’s Note: MDPI stays neutral with regard to jurisdictional claims in published maps and institutional affiliations. |
© 2021 by the authors. Licensee MDPI, Basel, Switzerland. This article is an open access article distributed under the terms and conditions of the Creative Commons Attribution (CC BY) license (https://creativecommons.org/licenses/by/4.0/).
Share and Cite
MDPI and ACS Style
Česonienė, L.; Šileikienė, D.; Marozas, V.; Čiteikė, L. Influence of Anthropogenic Loads on Surface Water Status: A Case Study in Lithuania. Sustainability 2021, 13, 4341. https://0-doi-org.brum.beds.ac.uk/10.3390/su13084341
AMA Style
Česonienė L, Šileikienė D, Marozas V, Čiteikė L. Influence of Anthropogenic Loads on Surface Water Status: A Case Study in Lithuania. Sustainability. 2021; 13(8):4341. https://0-doi-org.brum.beds.ac.uk/10.3390/su13084341
Chicago/Turabian StyleČesonienė, Laima, Daiva Šileikienė, Vitas Marozas, and Laura Čiteikė. 2021. "Influence of Anthropogenic Loads on Surface Water Status: A Case Study in Lithuania" Sustainability 13, no. 8: 4341. https://0-doi-org.brum.beds.ac.uk/10.3390/su13084341
Note that from the first issue of 2016, this journal uses article numbers instead of page numbers. See further details here.