
Rasch Model for Assessing Propensity to Entomophagy
by
 , , , ,
Luca Iseppi
1 ,
,
Marcella Rizzo
2,*,
Enrico Gori
3,
Federico Nassivera
1,
Ivana Bassi
1 and
Alessandro Scuderi
4
1
Department of Agricultural, Food, Environmental and Animal Sciences, University of Udine, 33100 Udine, Italy
2
Department of Economics and Business, University of Catania, 95131 Catania, Italy
3
Department of Economic Science, University of Udine, 33100 Udine, Italy
4
Department of Agriculture, Food and Environmental, University of Catania, 95131 Catania, Italy
*
Author to whom correspondence should be addressed.
Sustainability 2021, 13(8), 4346; https://0-doi-org.brum.beds.ac.uk/10.3390/su13084346
Submission received: 5 March 2021
/
Revised: 29 March 2021
/
Accepted: 3 April 2021
/
Published: 14 April 2021
(This article belongs to the Special Issue The Value Generation of Social Farming)
Abstract
:The Food and Agriculture Organization of the United Nations supports the production of edible insects as a promising and sustainable source of nutrients to meet the increasing demand for animal-derived products by the growing world population. Even if insects are part of the diet of more than two billion people worldwide, the practice of eating insects (entomophagy) raises challenging questions for Western countries where this is not a habit. The research applied the Rasch models and showed that, in the case of hunger or need, 70.8% of the sample declared that they would be willing to eat insects. The willingness to habitually consume and pay for insect food is very low, but the percentages are higher than people who had actually had insect tasting experiences. This demonstrates that a communication process is necessary that aims to overcome psychological/cultural barriers. Only in this way will it be possible to increase the propensity to consume insects.
1. Introduction
The Food and Agriculture Organization (FAO) forecasts a 2.7% annual increase in meat production in the coming years, primarily driven by population growth in developing countries [1]. It is widely accepted that by 2050 there will be nine billion people in the world [1,2,3]. To cope with this number, current food production will need to almost double. This increase, along with the limited land area available, may pose a challenge for the meat industry worldwide, and alternative protein sources will most likely be needed to feed a growing population. We need to find new ways of growing food [2,3,4]. Current production techniques, in particular animal breeding for protein production, cause greenhouse gas emissions (GHGs), require high water inputs and generate considerable amounts of waste. Insect production is generally considered to be more sustainable from an environmental point of view [5,6]. The deficit in the production of protein has become one of the most important problems in Europe, as underlined by the European Parliament; in fact, about 80% of European protein crop requirements are imported from non-EU countries [7,8]. In particular, the development and exploitation of new sources of sustainable food ingredients is one of the new frontiers in the EU when it comes to radical innovation [9,10].
Meat production and consumption are considered one of the most relevant sources of environmental degradation as well as health costs related to diabetes, cardiovascular disease and obesity, mainly due to over-consumption [9,11,12,13].
Considering these premises, insects can become a sustainable production for several reasons such as: (a) high conversion ratios: the production of 1 kg of insects requires only 2 kg of food [2,14]; (b) breeding produces fewer pollutants and GHGs [15]; (c) possible biological breeding [16]; (d) reduced use of soil and water compared to livestock farms [17]; and (e) less transmissibility to humans and animals of pathogens. The latter point however needs to be more carefully verified. Entomophagy, or eating insects, is a very common practice in Asia, Africa, and Latin America. It is estimated that insects form part of the traditional diets of at least two billion people. More than 2100 species have reportedly been used as food [18].
In Western countries, although several studies demonstrate the benefits of using insect flours [19,20,21], arthropod consumption is not part of traditional eating habits and very often causes reactions of disgust. Indeed, accepting or rejecting the food is linked to various reasons: (a) the characteristics of the food; (b) cultural motivations; (c) individual preferences. Insects are an unfamiliar food source for most European consumers, and sources that deviate from cultural norms can attract consumers who constantly sample new and unusual foods while potentially alienating others who are less adventurous [22,23,24,25]. The latter tendency is commonly denoted as food neophobia, a personal characteristic that accounts for the wide variability among consumers in terms of their attitudes towards novel foods [26,27,28]. Several studies have been conducted to understand the reasons for insect consumption (or their derivatives), and what can the factors may be that can lead to a change in eating habits [29,30,31,32].
Among the key aspects of helping people overcome their reluctance to eat insects is the role of information [25]. Communication of information on contents positively influences the evaluation of foods containing insects. Information on the positive effects of edible insects, sustainability and environmental perspectives increases consumers’ willingness to consume insect products [27]. An active role for public health institutions is crucial for expanding consumption [33].
Focusing on processed insect products is shown to be the most promising strategy to implement entomophagy, as an essential barrier to consumption is the visibility of the insects [34], the willingness to eat insect food depends on the form in which the products are presented [35].
Furthermore, food culture and perceived social norms have substantial explanatory roles when it comes to eating strange and perhaps disgusting foods such as insects [36].
Lack of practice in the preparation is a serious obstacle to consumption that could be overcome by proposing recipes, preparation methods or new consumption opportunities. Curiosity and environmental benefits are the most important factors for motivating insect consumption in the future [37].
It is interesting to note that both unprocessed and processed insect products generate more positive perceptions after tasting than expected [24].
People who have grown up and live in a strong and widespread food culture may be less likely to try new and different products than people who live in a rapidly changing food culture [38].
The research aims to validate a questionnaire of propensity for entomopahgy, composed of 32 survey items to measure the willingness of respondents to accept insects and/or insect-based products in their diet. The methodology applied here, for the first time in this area, is that of Rasch models [39].
2. Materials and Methods
2.1. The Philosophy of Rasch Model Analysis
Validity is often defined as the degree to which an instrument measures what it purports to measure, requiring the reliability instruments [40]. Meanwhile, reliability reflects the resulting consistency when the instrument is used for other appropriate studies. Therefore, a good reliability factor indicates consistent instrument validity [41], whereby content validation will ensure that the outlined objectives can be achieved [41,42]. Based on previous studies on the reliability and validity of instruments such as questionnaires, Crobanch’s Alpha coefficient and correlation/factor analysis values are the common methods used by most researchers to measure the reliability of a questionnaire. Not many, however, have applied Rasch Model Analysis to measure the reliability and validity of their instruments especially questionnaires [43]. Therefore, in this study, we decided to apply Rasch Model Analysis on the Propensity to Entomophagy to investigate its reliability and validity. Rasch Model Analysis is a formal testing for an outcome scale which was introduced by Danish mathematician G. Rasch [44]. Rasch Model Analysis provides the opportunity to examine how far the responses from a scale approach the pattern necessary to satisfy the construct measurement [39,45]. Rasch Model Analysis it is as a strategic method for instrument measurement [40,41,42,43,44,45,46] as it can reveal the quality of the items used concomitantly [47]. The steps that must be taken to validate the questionnaire and its items using Rasch Model Analysis are recalled later, and they are summarized by Azrilah et al. [47], moreover extensive explanation may be found from www.rasch.org (accessed on 22 March 2021).
One point must be made clear, before to go on. The philosophy of Rasch Model Analysis is completely different from that of Statistics: in Statistics, generally, we look for the best model that fits the data; here the model is well defined, if we want to validate a questionnaire of items whose aim is to measure some latent quantity, such as the Propensity to Entomophagy (as is this the case), therefore in Rasch Model Analysis we look for the items and persons that fit the Rasch Model, excluding the ones that do not fit the model. This does not mean that “results are manipulated to make them convenient and confirm the intended goal” but that only items and persons that fit the Rasch Models can satisfy the theoretical conditions that allow to produce valid and objective measures [39,45]. We want to make two very simple examples to explain this: let’s think to a math test, and suppose we had insert in the test the following question “How many heights as a triangle?” Possible answers: (1) “it depends on the kind of the triangle”, (2) “it always has three heights.” Right answer (for the teacher): (2), most of the good students answered (1). Why so many good students answered incorrectly? Indeed, the Rasch Model index of fit, that we will consider later, highlights this as a problem: the item do not fit the Rasch model! The reason is that the item is badly formulated. The teacher thought to the “heights” of the triangle as “segments (connecting vertices with the bases)”, instead some good student interpreted the “heights” as the “measure” of the segments, and in this case an equilateral triangle as only one height (measure). The item, therefore, must be excluded from the bunch of items whose aim is to measure math ability of the students. Regarding the exclusion of the persons, using the same example, often it happens that students answer randomly to the items. They do not apply their ability, that we want to measure, to give the answers, but some other ability (the chance: i.e., that represents something different from what we want to measure): in this case the indices of fit tell us that the student “do not fit the model”, and that we cannot measure the ability of the student using his answers “because they do not represent what we want to measure” (here the question of the validity is clear). Therefore, the student that do not fit are excluded from the set of observations on which the estimation of the model is based. This doesn’t mean to manipulate the results, but to recognize that some item may be badly conceived, and some persons do not answer to the questionnaire reading the meaning of the questions. In practice Rasch Models Analysis look for data of good quality, before to get the final estimate of the model! Another reason why some item and person may be excluded from the estimation of the model is that of “perfect score” or “extreme score”. Always taking the example of math test, it happens that some question is so difficult (easy) that no one (every one) can answer correctly, or some student is so good (bad) that he answer correctly (incorrectly) to every item: in this case is intuitive that some empirical probability p in the model is one or zero, and because the estimation process of the Rasch Models is based on the logit of p, i.e., ln(p/(1 − p)), for these extreme items or persons, such entities goes to infinity and must be excluded from the estimation process (although using Bayesian arguments we may, after, get an estimate). In this case the Rasch Analysis tells to us that we formulated to easy or to hard questions with respect to the abilities of the students we want to measure, and that, in the future would be the case to reformulate the questionnaire adding or removing items that are too easy or too difficult from the questionnaire. If we think to the measure of a height this mean that if we want to measure tall or small persons we must use adequate instruments (items), although the instrument (items) items used may be good to measure the majority of persons.
A second crucial point is that of the kind of sample is needed to estimate a Rasch Model and to validate, therefore, a questionnaire with this approach. From the previous discussion we saw that the sample must be manipulated before the final estimation process of the model, excluding items and persons that do not fit the model. Therefore, it can be observed that, also if the initial sample is a probabilistic sample (a random sample), the final set selected would not be so. This is true, but the point is that to estimate a Rasch Model, if we wish mainly to validate a questionnaire, we do not need a random sample because the Rasch Models enjoys the Specific Objective property [48]. This property states that the parameters of the model that are mainly two: the difficulties of the items (how difficult is to endorse a question such as “Would you eat a Grasshopper?”), does not depends on the set of persons used to estimate the model. This means that the difficulty of an item estimated from any sample, in any part of the world (if the item and person used satisfy the Rasch Model!) is the same (apart from variability inherent the probabilistic nature of the model); meanwhile, the abilities of the persons (in this case their Propensity to Entomophagy), does not depends on the set of items used to estimate the model, that is, if we use another set of items (obviously related to the same dimension) we would obtain the same estimate for the ability of the persons (apart from variability inherent the probabilistic nature of the model). This property leads to the interesting characteristics of Rasch Models of “Sample-free Test Calibration and Person Measurement” (https://www.rasch.org/memo1.htm (accessed on 22 March 2021)). Therefore, using, as in this case, a convenience sample is not a problem. The main attention we must have in the selection of the sample is to select persons with a variability of abilities (Propensity to Entomophagy) big enough to calibrate the items of the model (we already said that items too easy or too difficult cannot be calibrated), and for this reason we choose mainly Italian persons but also persons from country where the Propensity to Entomophagy is probably much higher. The Sample-free Test Calibration and Person Measurement therefore doesn’t require that the sample should be representative of the populations from which has been drawn. Obviously, given the nonrandom nature of the sample, although the inference for the calibration of the model and the validation of the questionnaire is valid being inherent to the probabilistic nature model, once the measure of persons abilities are estimated they are good measure of the Propensity for Entomophagy of each single persons (as we would measure the height of a person with a good meter: the item validated with the Rasch model in this case), but any other summary measure, such as means and difference between means, must be recognized that are not estimate of the population counterpart (because the sample is not random), but they are estimate for these entities in the sample, affected by errors due to the probabilistic nature of the model. Therefore, results such as analysis of variance must be taken more as a descriptive measure of the convenience sample used, more than an inference on the population from which is it drawn.
2.2. Questionnaire and Data Collection
The study of eating habits, and their evolution, becomes crucial to rethink the organization of sustainable food chains in relation to the introduction of insect-based ingredients. This research applies the Rasch model for assessing the willingness of respondents to accept insects and/or insect-based products in their diet. The ability to measure individual propensity for entomophagy represents an interesting and important result, especially if there are correlations between this variable and others characterizing the opinions and habits of individuals, both in general and on that of consumer decisions. The Rasch model allows us to understand which steps can be taken to increase the consumption of insects by consumers. In order to investigate the propensity of consumers for entomophagy an on-line multilingual survey was prepared. The questionnaire was divided in two sections: (a) the first section (five items) covers consumer background (age, gender, education, country of origin, personal eating habits); (b) the second is focused on attitudes to entomophagy (32 specific items: 31 closed questions, 1 open). In this section the items were selected considering the current literature concerning the use of insects for food. In addition, an item included on the appreciation of more unusual foodstuffs (squid, octopus, offal, etc.) was inserted to check for food neophobia [49,50,51]. Most of these issues have also been surveyed by the Food and Agriculture Organization [1,2].
The answers to the questions were coded according to the Likert scale (0, 1, 2, …) that associates the lowest scores to the lowest level of “propensity for entomophagy”, whereas the highest scores to those responses denote the highest degree of “propensity for entomophagy”. The goodness of the codes adopted, also from the theoretical point of view, was verified through an analysis of the correlation between the encodings and measures estimated (which must be positive), and the good ordering of Andrich’s thresholds [52], in the case of polytomic encodings. In addition to each question, some indices and characteristic plots were performed representing the goodness of model fitness.
The methodology was applied for the descriptive statistics required for characterization of the sample. The correlation indices were also calculated between the demographic characteristics of the sample and the various items indicating the propensity of respondents to consume insects [51]. Application of the Rasch Model, specifically the Generalized Rating Scale Model because the answers to some questions were dichotomous while for others polithomic, allowed a summary of the various items to be obtained to measure the propensity of the sample for insect consumption. The questionnaire was administered via the CASI (Computer Assisted Self Interviewing) method.
2.3. Rasch Models as Basis for Fundamental Measurement
The property of “specific objectivity” of Rasch methods allowed us to use convenience sampling for data collecting. This property does not require probabilistic sampling in order to make inference on the items in the questionnaire and to establish the unidimensionality of the latent variable under study [48,49,50,51,52,53]. Furthermore, this sampling method is reasonable when the objective of the research (aim) is to analyze a still unexplored field [54]. Finally, data collection from students is often able to well represent the point of view of a larger community [55,56,57].
Rasch models [49,58,59] are measurement models that use dichotomous or ordinal data to construct a measure of the latent variable of interest (in this case, the propensity to consume insects). These statistical models derive from the need to convert a test result into a measurement. The first problem to be addressed concerns the concept of measurement, which does not simply mean specifying a procedure for assigning a number to an object. Campbell [60] proposed a system of axioms that must be satisfied by a fundamental µ measurement. One of these axioms requires that there is a concatenation operation between measurable objects such that µ(AB) = µ(A) + µ(B). In the social sciences there are no fundamental measures because there is no possibility to define the operation of concatenation. If the fundamental measures do not exist, the derived measures cannot exist, but implicit measures can. This is the case, for example, when measuring the difficulty of an item and the respondent’s ability to respond [39]. These are therefore implicit measures that are not directly observable.
In order to estimate the measurements, a probabilistic model that links the observable effect to the latent variables must necessarily be hypothesized [61,62]. If the hypothesized model agrees with the data then it is possible to construct a qualitative scale for the latent variables that enjoys the properties of the Campbell scale for the fundamental measurements [39].
A theory that allows the measurement of latent variables is the Item Response Theory (IRT) of which the Rasch models represent a particular case [63]. The theory and related models try to measure one or more latent quantitative variables on a metric scale [64]. The properties of the scale are: sufficiency, separability, objectivity, specificity and latent additivity. IRTs are then determined by assigning the probability that a respondent will respond correctly to an item based on a number of latent variables. This function is defined as a response function and fully characterizes the model.
The Rasch model can be defined using the response function:
where β is the ability of the respondent and δ is the difficulty of the items. These parameters are measured on the same scale. Since the response functions of the IRT models depend on the difference between β and δ, the parameters are not uniquely determined by the data but can be set arbitrarily by imposing a value, for example on the difficulty. Once the difficulty is set, the response function depends only on the skill and is called the characteristic curve of the item.
As mentioned above, the main problem with this type of analysis is to identify the model that best fits the data. For this reason, there is not just one model but as many as there are variables considered [53].
For two ordered categories, the Dichotomous Rasch model is provided [44], while for higher ordered categories the Rating Scale model [52] and the Partial Credit model [65] can be used. These models can be summarized as follows:
Dichotomous Rasch model:
where Xij is the response of person I to item j, ai is the ability of the person (level of the latent trait), and βj is the difficulty of the item (expressed on the same scale as the latent trait). Rasch discovered that the minimally sufficient statistics from which to estimate person and item measures were simply the unweighted sums of right answers for persons and items, which is the score. The Rasch model for dichotomously scored items may be extended to response formats with more than two ordered categories [52,65]:
Rating Scale model:
where is a “threshold” that measure the difficulty to reach category k, identical for every item.
Partial Credit model:
where is a threshold that measure the difficulty to reach category k for the item j.
The latent variable whose existence can be hypothesized in relation to some of the items proposed in Table 1 is “the propensity to consume insects”. Giving a high score to these items denotes a high level of the latent variable. All responses provided by each respondent for each item will be “summarized by a measure” and the person with a higher value of the measure will be associated with a higher propensity to consume insects.
It is obvious that the measurement process can be affected by errors that are taken into account by calculating the standard deviation. The standard deviation is not usually calculated in traditional measurement methods, and this can create a distortion in the result obtained, especially if the constructed variable is used as the explanatory variable in regression models. Thus, the Rasch models are of fundamental importance as they offset the drawbacks of the traditional methods by providing a way to correct the bias [66].
Application of the Rasch model requires: (a) compatibility of the data with the model; (b) fulfillment of the assumptions provided by the model. To satisfy point (a) we must look at the correlation coefficient between the items observed and the estimated Rasch measure in order to assess how well the responses to the items are correlated with the results obtained. In this way coding errors or items with negative or zero correlation are detected. Indeed, this could be an indication that items do not agree with the latent variables, in which case those items must be removed from the analysis or need their coding to be reversed [53]. Using the Rating Scale model for continuous variables, another step in the analysis is to understand if the categories created assuming a value of 0, 1, 2, 3, etc., have an actual meaning and can therefore be interpreted. The indicator used to understand if the measures obtained are ordered or disordered is the Andrich Threshold [52]: if it turns out to be disordered, the solution is usually to reduce the number of categories [67].
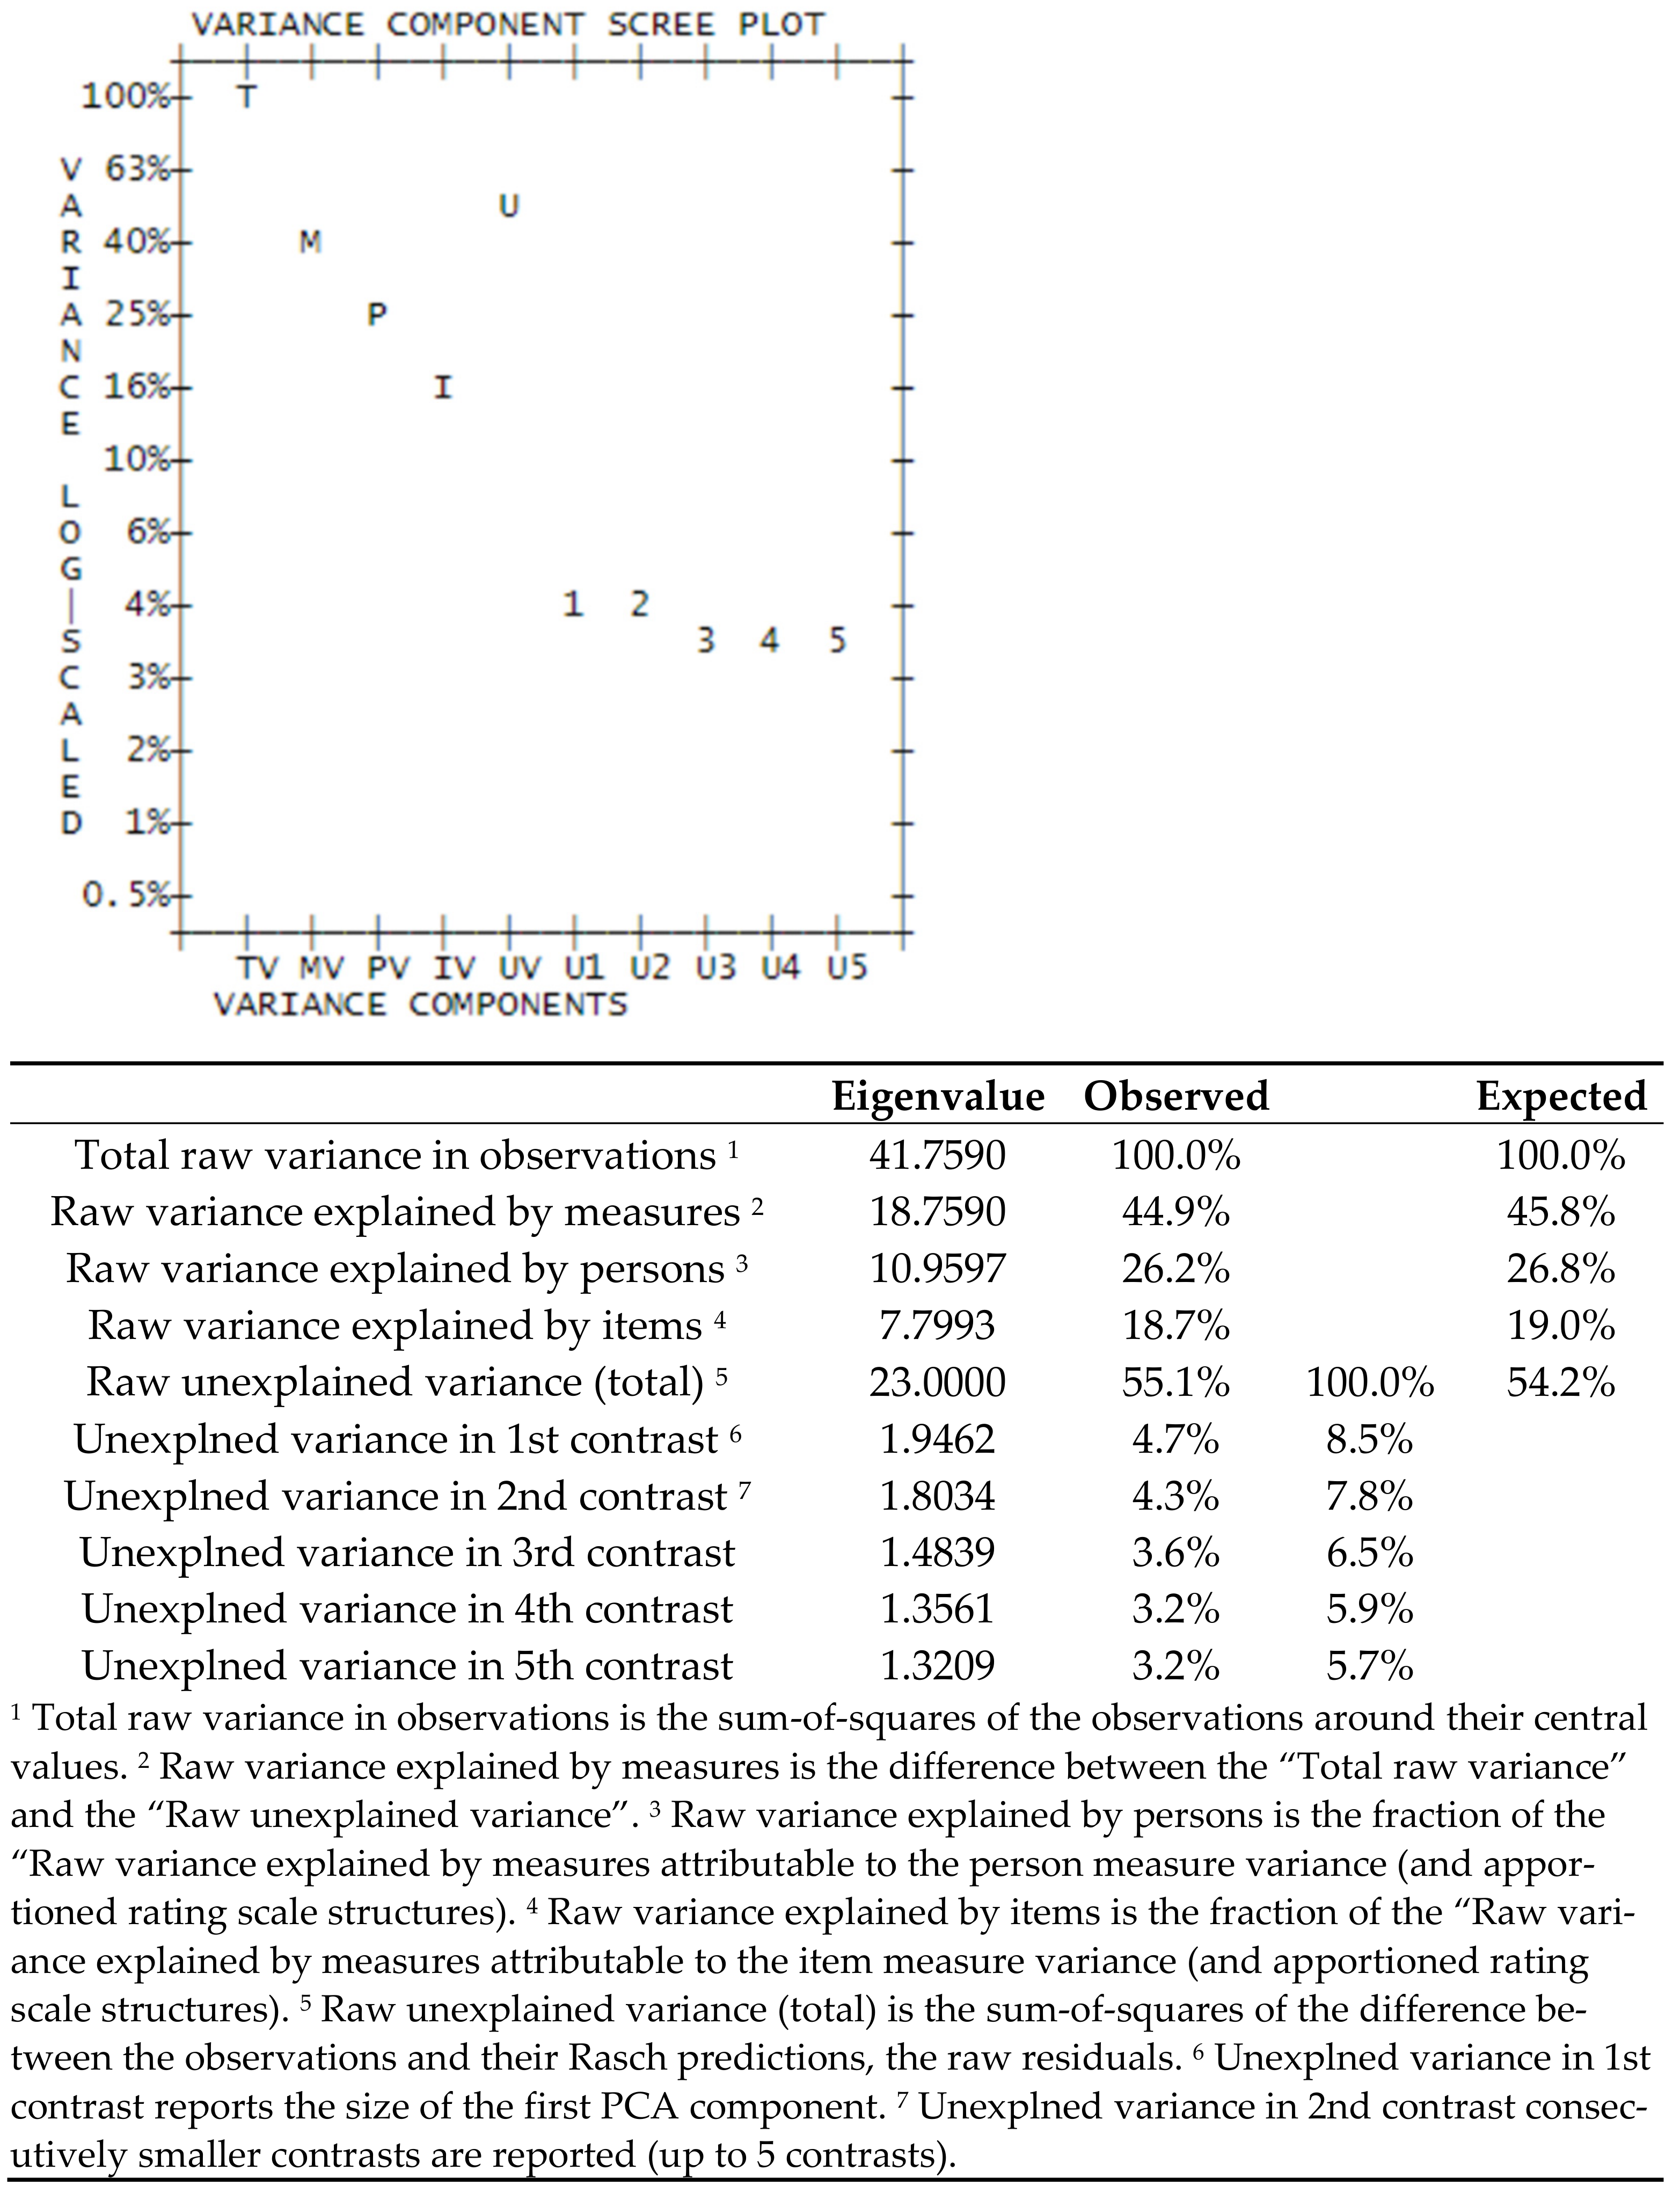
Two further problems that may arise are violation of the local independence hypothesis [68] and multidimensionality [69]. Regarding the former, using Winsteps [69], one of the best-known software applications for Rasch Analysis [70], we can look at the correlation of standardized residuals: if this is low (<0.70) we can conclude that the local independence hypothesis is not violated. Regarding the latter, in a dataset fitting the Rasch model there is variability due to the model, and residual variability due to randomness [64]. The Rasch “Principal Component Analysis (PCA) of residuals” looks for patterns in the part of the data due to randomness. Such a pattern is the “unexpected” part of the data that may be due, among other reasons, to the presence of multiple dimensions in the data [70,71]. In the Rasch PCA of residuals, we are looking for groups of items that share the same patterns of unexpectedness. In particular, the matrix of item correlations based on residuals is decomposed to identify possible “contrasts” (principal components) that may be affecting response patterns [53]. Usually the contrast needs to have the strength (eigenvalue) of at least two items to be above the noise level: if the highest eigenvalue of PCA is around 2 or less then the latent measure under investigation may be considered unidimensional.
Once these issues have been investigated and eventually resolved, we can look at the fit statistics, which are an estimation of the degree to which persons and items respond to our expectations based on the model. In this study, the fit statistic we used is the square mean deviation, which can assume a value between zero and infinity. The fit statistics are divided into two categories, one weighted called “infit”, and the other unweighted called ‘outfit’. Values of around 1 can be deemed acceptable (for suggestions regarding good practice interval, see [70]). The items and persons that do not fit will be removed from the model to increase the validity of the results obtained.
Rasch models are therefore not only statistical tools for the representation and synthesis of reality, but a discovery guide of the reference systems useful to measure particular aspects of phenomena that are dependent on the context and chance.
3. Results and Discussion
The questionnaire aimed to measure the propensity to eat insects (entomophagy) was administered via the CASI (Computer Assisted Self Interviewing) method. Academic staff and students of a center Italian University were invited to participate in the survey. Data collection from students is often able to well represent the point of view of a larger community [55,56,57].
The sample of 506 individuals is composed by 59.5% of females, the most represented age group is 20–30 (43.9%), 55.3% of the sample are graduates, 85.4% are of Italian nationality and 91.3% are omnivorous. (Table 2).
In response to the item “How often do you eat an insect-based meal? (D9), 82.8% of the sample declared never, 10.5% consumed insects once or twice at most and the remainder (7%) consumed insects more or less regularly. Considering the two countries most represented in the survey (Italy and Mexico) it is found that 91% of Italians have never consumed insects, while this happens only for 20% of Mexicans. This clearly shows that entomophagy has a fundamentally cultural basis. In response to the item “In case of hunger or need, would you eat insects?” (D12) 7.3% of the sample declared “absolutely no”, while 70.8% of the sample were possibilist in this regard. In response to the item “Which insect(s) would you consider eating among the ones listed below?” (D22) the highest percentage (39.3%) was observed for cricket followed by grasshopper (36.6%), last in the ranking (5.1%) beetle. In response to the item “How much would you be willing to pay for 10 g of ready-to-eat insects?” (D15), 41.9% of the sample would paid nothing, but the rest (58.1%) would paid the equivalent of a hamburger or almost.
These are higher percentages than people who had real insect tasting experiences. This demonstrates that a communication process is necessary that aims to overcome psychological/cultural barriers [72]. Only in this way will it be possible to increase the propensity to consume insects.
Most of the items had the task of assessing consumer behavior, from complete disagreement to complete agreement, with respect to entomophagy issues. For that purpose, each response was coded by the Likert scale (0, 1, 2 …) so that the smallest value corresponded to low levels of propensity for entomophagy and the highest value corresponded to the maximum propensity for entomophagy. Items that did not fit the model were then deleted. Subsequently, people who did not fit the model and who evidently tended to answer the questionnaire at random or inconsistently with the scale were also eliminated. Table 3 shows the reliability indices for items and people.
The items selected for analysis are therefore 23, all not extreme and with a reliability index of 0.99 (Table 3). The average measurement level of the items is conventionally set to zero. The range of Infit indexes of the items vary between 0.64 and 1.49, and the outfit indexes vary between 0.27 and 1.41, within the limits provided for the good adaptation of a Rating Scale model [70]. The indexes, for items and people, have very high values that highlight the goodness of the scale used. Cronbach’s Alfa is also quite high and equal to 0.90. The average level of all non-extreme and extreme people (the latter answered all items of the questionnaire with minimum or maximum values on the scale), is −2.04, which is lower than the previous one and indicates that most extreme people answered all items with the lowest mode on the scale therefore very low propensity to consume insects (Table 4). In Table 4 the values of Infit and Outfit are equal to 0, in this case the model also considers extreme data (people who answered with the maximum or minimum to all items). These indices are not calculated since these people are excluded as the logarithm of the ratio p/(1 − p), at the basis of the model estimate, diverges [73]. The average level of the measurements of non-extreme persons, i.e., those who did not respond to all items with the minimum or maximum value on the scale is −1.26. The reliability index in this case is 0.87. As shown in Table 5, 69 people (17.2%) are extreme at the lowest levels, i.e., they responded with the lowest levels on the scale to all items. These people, representing 13.6% of the sample, were eliminated from the analysis because they had a bad adaptation index to the test (outfit or infit greater than 2.0).
Table 6 shows the model adaptation indexes for each item in more detail. It should be noted that all the point-measure correlations observed are close to those expected, plus the characteristic curves of the items ensure the optimal adaptation of the data and selected persons (item-persons) to the model. The items characteristic curves (in Figure 1 the item characteristic curve—D11) allowed the suitability of the individual items to be tested to measure the propensity for entomophagy of each person. If the distance between the estimated curve and associated empirical curve is small, the capacity of the item to describe the phenomenon is greater.
The Rasch PCA of residuals looks for patterns in the part of the data due to randomness. Such a pattern is the “unexpected” part of the data that may be due, among other things, to the presence of multiple dimensions in the data [71]. In the Rasch PCA of residuals, we are looking for groups of items sharing the same patterns of unexpectedness. In particular, the matrix of item correlations based on residuals is decomposed to identify possible “contrasts” (principal components) that may be affecting response patterns [53]. Usually the contrast needs to have the strength (eigenvalue) of at least two items to be above the noise level: if the highest eigenvalue of PCA is around 2 or less the latent measure under investigation can be considered unidimensional. In this case, because the highest eigenvalue is 1.9462, we may conclude in favour of the uniqueness of the dimension investigated (Figure 2).
In order to understand how to increase the propensity for insect consumption, it is useful to analyze Table 7 where items are classified according to the degree of “difficulty”. The most “difficult” items are those that respondents have more difficulty in fully agreeing with. The items are: “Which insect(s) would you consider eating among the ones listed below” (D22.4—eat a beetle) with a maximum entomophagy propensity measurement of 2.77; “For which reasons would you decide to eat insects?” (D11.4), with a value of 2.27; “What feeling does this picture provoke in you? (Locusts with chocolate) (D31) with a value of 1.37. About item “How much would you be willing to pay for 10 g of ready-to-eat insects?” (D15M) for males this has a value of 1.17 which is higher than females (D15F) with value of 0.33. This means that for the same amount of insects (e.g., 1 hamburger) males have a higher propensity for entomophagy than females. This show that the propensity for entomophagy in males is much higher than that of females. This is in agreement with previous studies reporting that Italian females [74,75] and other European women in Belgium [51,76], The Netherlands [77], Germany [78], Hungary and Switzerland [79] were less amenable to eating insect or insect-based food. This aspect will be further analyzed below. The easiest items on which to make a judgment of full agreement are respectively: “Are you interested in receiving more information about it?” (D20) with a measure of propensity for entomophagy at −3.60, answering “yes” to this question is the first step towards a growth of entomophagy. This is followed by “Would you be more willing to eat insects if you had a better understanding of the practice of entomophagy?” (D21) with a value of −2.70: answering “yes” to this question indicates a propensity for entomophagy higher than the item D20. According to previous study the growth of knowledge of a wide range of stimuli, including food, which entails a lower level of food neophobia [80]. This shows that if a consumer is given enough information about a new food, such as insects, it increases the likelihood that they will consume it [81,82].
It is very interesting to analyze the item “Which insect(s) would you consider eating among the ones listed below? (D22: cricket 22.1; grasshopper 22.2; mealworm 22.3; beetle 22.4; silkworm 22.5; locust 22.6; ant 22.7; none 22.8). The willingness to consume one of the insects proposed by the item highlights the level of propensity for entomophagy of the respondent. Those who are inclined to consume a beetle (D22.4) showed a maximum propensity for entomophagy of 2.77, followed by the consumption of locusts (D22.6) with a score 0.88 lower than the previous one. This highlights the degree of exceptionality of item D22.4. The propensity scores for other insects are: 0.57 and 0.53 for mealworm (D22.3) and silkworm (D22.5) respectively. At a lower propensity score (−0.31) is the consumption of ants (D22.7), while the absolutely lowest propensity score (−1), which therefore indirectly indicates a greater consumption, is for crickets (D22.1) and grasshoppers around −1 (D22.2). The lower the value of the propensity score is, the greater is consumption.
The same considerations can be made for insect-based food products where there is a greater consumption for bakery products based on flour of (D24.1/2) with a propensity level of −1.55. The lowest propensity for insect food products is for protein powder, with a value of 0.40. The intake of insects in the form of bakery products greatly facilitates consumption because the insect is transformed into something “culturally” accepted while in the case of protein powder the cultural filter cannot be applied. cultural factors are known to influence food choices. Biological, psychological and socio-cultural factors are known to determine food choices. Culture, in particular, influences what is considered edible. Many people in Western countries rejecting the idea of entomophagy mainly for cultural reasons [83].
The ranking of the items suggests the way that could be taken to lead an individual from the lowest level of the propensity for entomophagy scale (item D20) to the highest level (item D22.4: eating a beetle). Therefore, the steps to be taken are: (a) provide information to increase the propensity to consume; (b) stimulate the consumption of insect bakery products based on cricket or grasshopper flours; (c) include, in the human diet, insects that generally generate disgust, such as beetle. Despite the widely demonstrated benefits of using insects in human nutrition, the practice remains largely unacceptable in Western culture [2,84]. This lack of acceptance and consumption is attributed to the emotion of disgust associated with insect ingestion [85]. Therefore, disgust drives the rejection of entomophagy. Several studies highlight that disgust emerges as the most common response, and represents the greatest barrier, to entomophagy [75,86,87]. If a consumer does not have adequate information on the possibility that insects can be an integral part of his diet, he will be extremely wary and unlikely to consume them. It’s fundamental to proceed with an information campaign on the possible uses and positive effects of this new food behavior. Once the information is consolidated, the consumer will be invited to consume bakery products made with insect flours. In this way, there will be a positive association between the consumption of a traditional food, such as bread and cakes, produced using an innovative ingredient (insect flour). Once these positive experiences are consolidated, the last step can be taken as the direct consumption of insects.
Figure 3 allows a better understanding of the sequence of the various steps. On the right side are shown the items ordered according to the level of propensity for entomophagy. At the bottom are those showing a low propensity for entomophagy and at the top those showing a high propensity. At the bottom (and top), on a scale between −5 and +7 (values estimated by the program) the propensity for entomophagy is measured. The values (negative or positive) showed the level propensity for entomophagy. For example, the lowest level of propensity for entomophagy is for item D20 “Are you interested in receiving more information about it? and the answered is 0 (NO), and for item D21 “Would you be more willing to eat insects if you had a better understanding of the practice of entomophagy?” and the answered 0 (NO). The highest propensity level is for persons answering item D15 “How much would you be willing to pay for 10 g of ready-to-eat insects?” the equivalent of 2–3 hamburgers; to item D22 “Which insect(s) would you consider eating among the ones …?” “Beetle” is answered, and item D31 “What feeling does this picture provoke in you? (Locusts with chocolate)” answered “Appetite”.
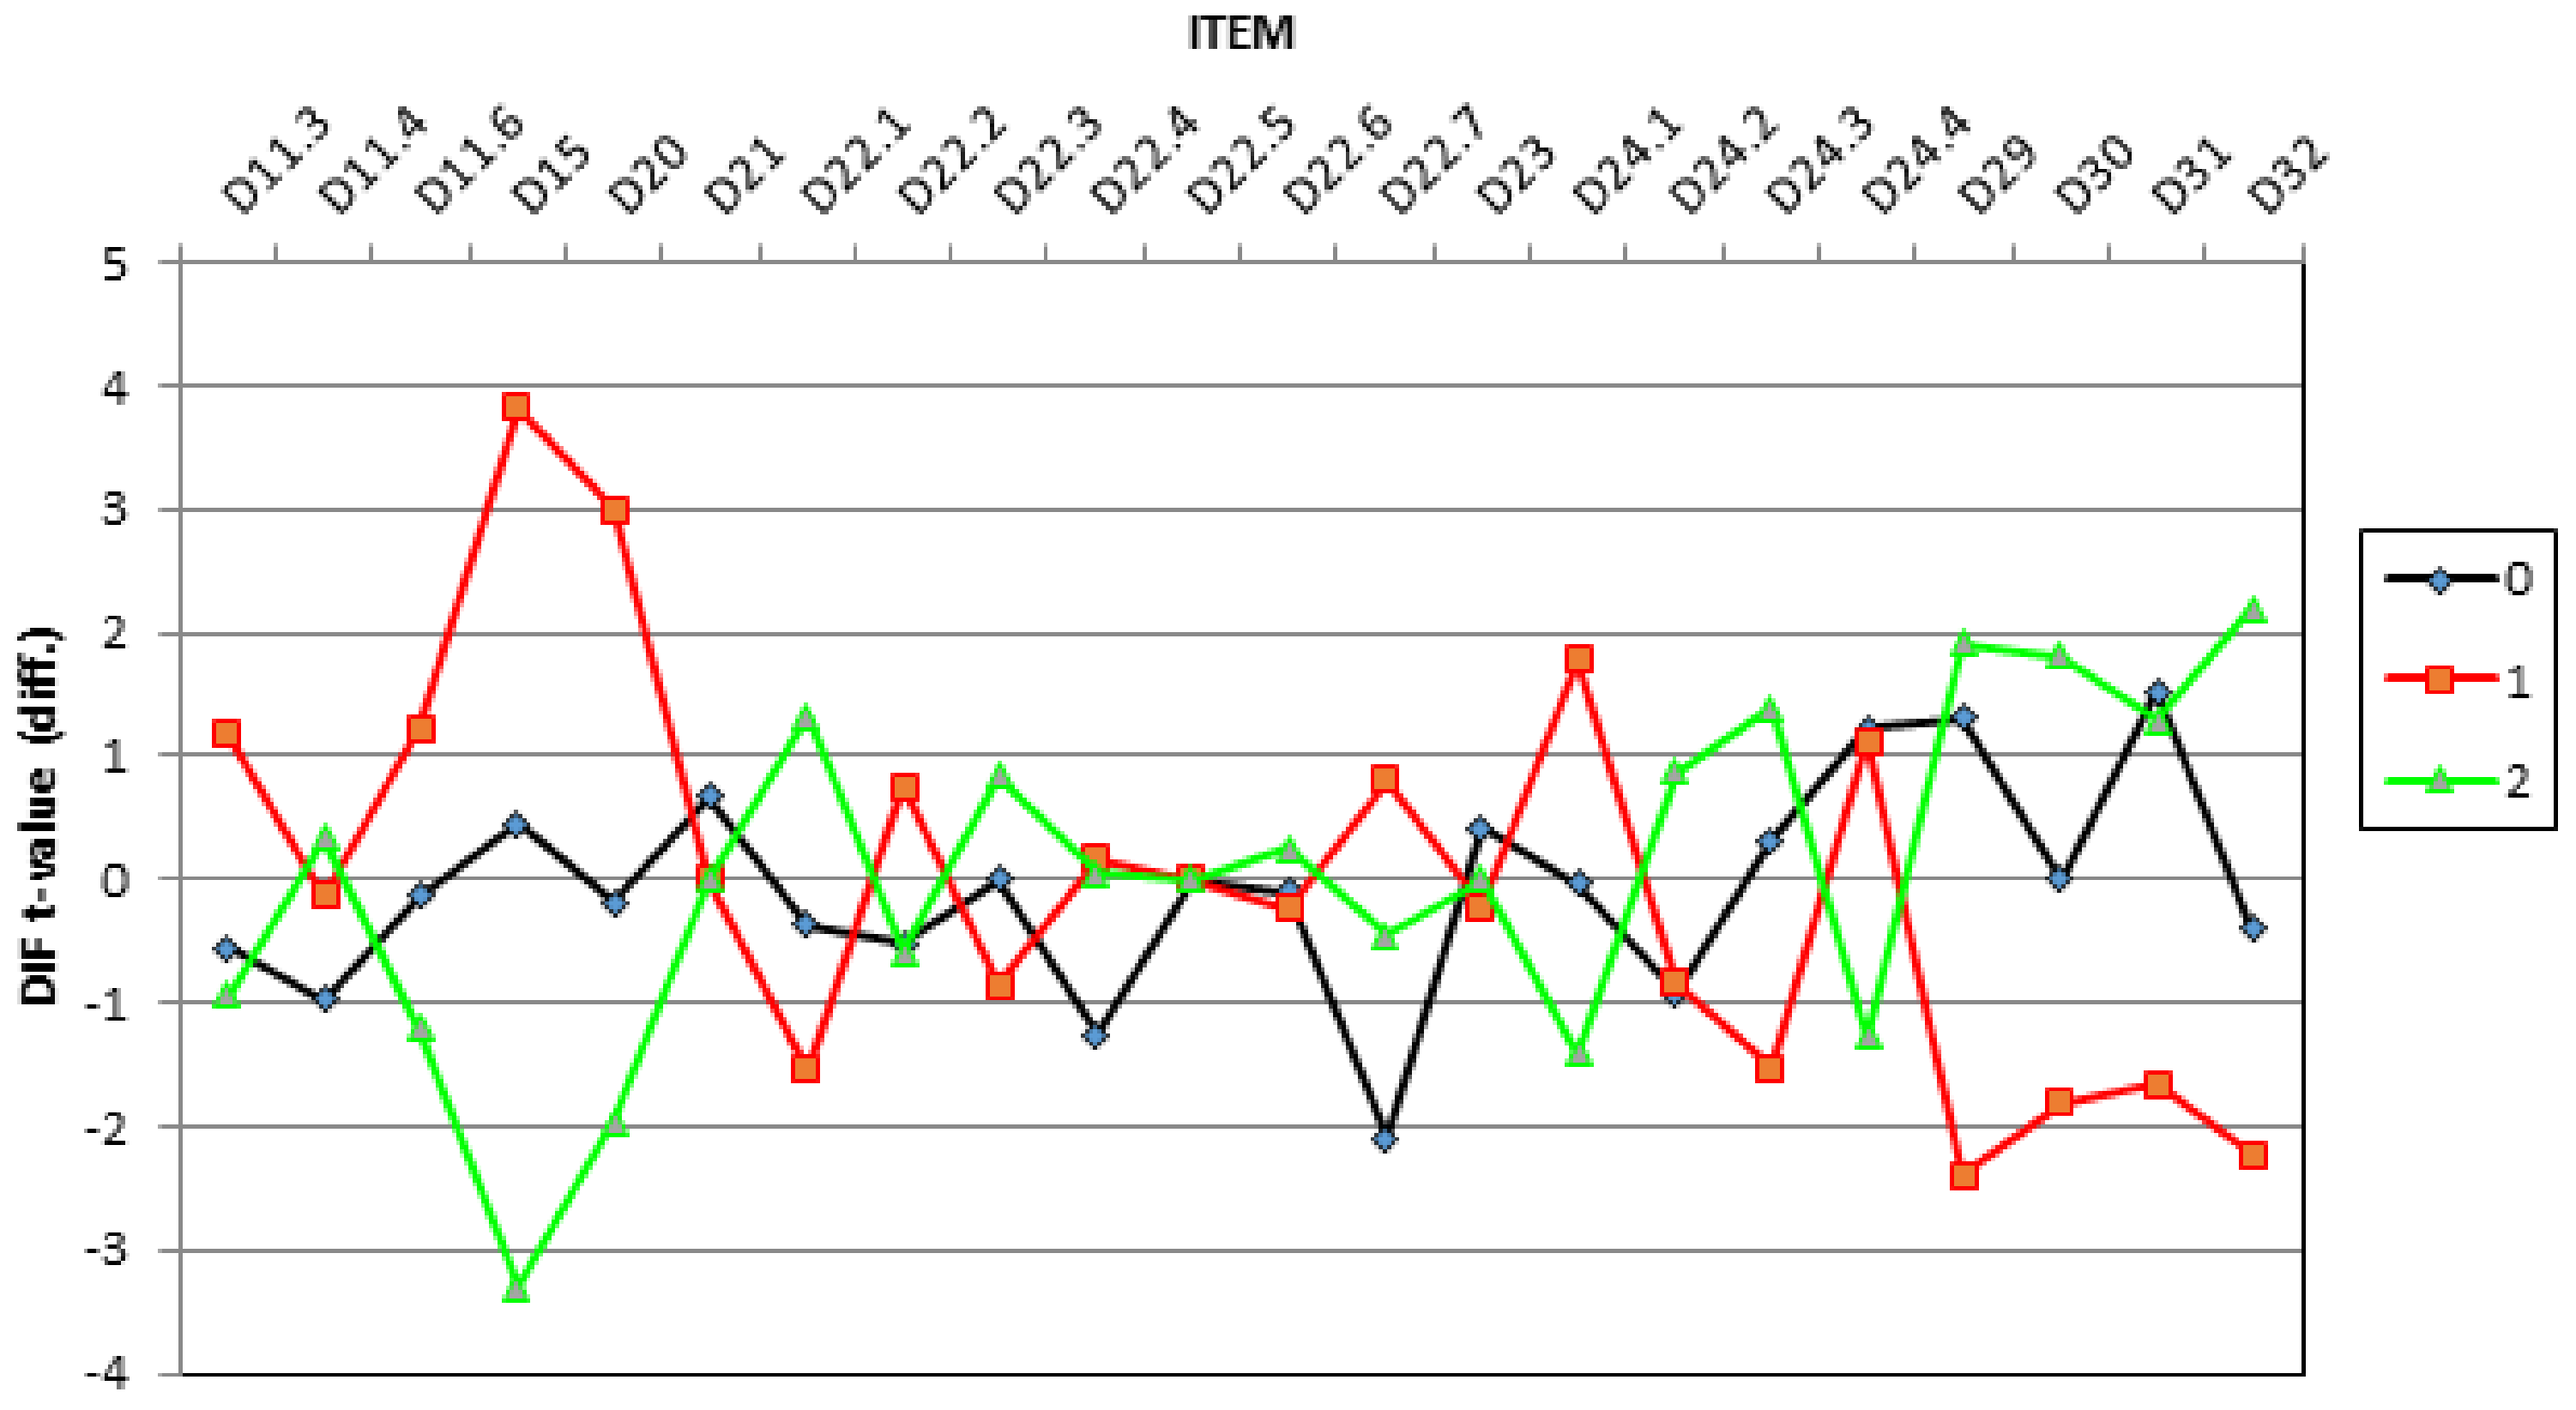
Differential Item Functioning (DIF) analysis can be used to determine whether different subgroups respond differently to items, in particular whether gender deter-mines a greater or lesser difficulty items response. Easy items correspond to high propensity for entomophagy. In this survey the DIF analysis for males and females does not show anything relevant (test t is within the limits −2.58, +2.58) in fact gender does not affect the perceived difficulty level of each item. However, there is an exception for the item “How much would you be willing to pay for 10 g of ready-to-eat insects? (D15) where the propensity to consume insects seems higher for males than females. Therefore, with the same response, males showed a higher propensity for entomophagy. For this reason, item D15 was treated as two separate items, one for males and the other for females (Figure 4). As shown by several authors [51,88,89] males, compared with females, were found to be more positive towards insects, less influenced by the species and level of processing of insects and more willing to eat insects for reasons of taste.
A further analysis dealt with the statistically significant correlations, in the sample, between the propensity for entomophagy, estimated with the model, with variables such sex, age, education and items that do not contribute to the estimation of the propensity to consume insects. The results of this analysis are shown in Table 8 and following comments. This analysis confirmed the validity of the scale built by the items selected with the Rasch model, at least in the selected sample.
Again, specifying that the following results should be interpreted as descriptive measure of what observed in this convenience sample, and that the extension to the overall population would require further studies with random selected samples, the propensity level of females (coded as 2) is −2.61, below the sample average (−1.92) while that of males (coded as 1) is −0.89, above the average. Analysis of variance indicates that this difference is statistically significant with a p-value of 0.000. The analysis of variance between the different age groups and education of the sample does not show significant differences in propensity for entomophagy. The educational level is not a determinant variable in the propensity to consume insects as evidenced by Petersen et al. (2020). Instead, what is important is the positive experiences with insect food items that highlight the benefits of insect production and reduce the novelty of entomophagy are needed. The majority of respondents are Italian with an average propensity level of −2.20. The other nationalities are not present in a significant number to provide reliable information. In fact, the aim of this research is to validate the questionnaire and not describe the populations involved for which no representative samples are available. With regard to eating habits, it should be noted that vegetarians have a very low propensity for entomophagy (−3.13), while in omnivores the value is −1.95. The growth of vegan and vegetarian habits could therefore lead to a reduction in the propensity to accept insects as a food alternative.
Item D13 “Which of the foods below do you not eat (raw or cooked)?” concerns the consumption of various foods. Table 9 shows the average propensity level to entomophagy of respondents who claim to consume and not consume such foods, with the p-value of the F-test of the difference between the two averages. This means that the consumption of certain foods is tested as a proxy for entomophagy propensity. It is noted that respondents who declared to consume one of these foods (with the exception of offal) showed a higher average propensity for entomophagy than those who declared not to eat them. The biggest difference in the average propensity for entomophagy between those who claim to eat a food and those who do not is found for clams. Regarding the consumption of offal there is no statistically significant difference in the propensity for entomophagy between respondents who declared they eat offal and those who do not. This particularity could be linked to the characteristics of offal considered by most consumers as an “extreme” food and consumed by few.
For item D16 “Which nutritional component do you think is the most present in insects?”, the differences are significant, compared to people who responded “protein” (first choice). This can be explained by people who claim to be vegetarian/vegan and are fundamentally opposed to any protein food that is not of vegetable origin. Answering item D27 “Would you eat animal products (meat, milk, etc.) produced by livestock fed with insects?” with “0—I do not consume animal products” has a very low average propensity to consume of −3.21. This confirmed that vegans and vegetarians tend to exclude insects from their diet. Therefore, the possible spread of vegan and vegetarian eating habits will be one of the main obstacles to the consumption of insects. The answer “1 = NO” has similarly a very low propensity equal to −3.45, while the answer “2 = YES” a propensity of −1.70. The differences are statistically significant. All the results of the one-way analysis of variance, that resulted significant, was related to 2 groups comparisons (sex and dichotomies “I eat/I do not eat” related to some kind of food), while analysis of variance for multiple groups variables, such as age and education, didn’t resulted significant and therefore there was not need of post-hoc tests or the so-called contrast analysis. In any case, as already underlined, the aim of this research was to validate the questionnaire and not describe the populations involved for which no representative samples are available.
4. Conclusions
In this research, the Rasch model was used, for the first time, to investigate the propensity to entomophagy by means of a questionnaire comprising 32 items designed to measure the respondents’ willingness to accept insects and/or insect-based products in their diet.
The value of the infit/outfit indices provided by the model ensure a good fit of the Rating Scale model. The indices, for both items and persons, have very high values that highlight the goodness of the scale used The research involved a large sample, among the largest in literature, although not representative of the Italian population. Despite this limitation, common to most papers dealing with entomophagy, the model provided useful information for a better understanding of the propensity for entomophagy.
However, the model provided other useful information for a better understanding the propensity for entomophagy. Indeed, the propensity is much higher in males than in females. This is in line with previous studies reporting that females were less likely to eat insect or insect-based food.
The analysis confirmed that entomophagy has mainly cultural bases and does not correlate with the level of education [90]. This result suggests that the first step in increasing consumer confidence is to disseminate the positive effects of eating insect-based foods. Several studies showed that the barrier to consume food made with insects is essentially represented by Western culture, which does not consider insects as a possible form of food [32,91]. However, overcoming attitudinal barriers, such as negative taste expectations and neophobic reactions, through familiarity enhancement and taste education is paramount to establishing insects as a food source [78]. The process leading the consumer to accept this new source of food through an insect product with the addition of traditional products (meat, chocolate, etc.), can increase people’s willingness to eat insects. This is the first step needed to make this new source of food a part of consumer’s food culture.
This process, present in Western societies, could be eliminated by creating greater familiarity with insect-based food and demonstrating the nutritional and health benefits that could break down the barrier to consumption and market development. The future will therefore depend on consumer reactions and socio-cultural characteristics, perception of risk to health and production technologies [82].
The Food and Agriculture Organization of United Nations supports the production of edible insects as a promising more sustainable source of nutrients for the increasing demand for animal-derived products by the growing world population than traditional animal products. Even if insects are part of the diet of more than two billion people worldwide, the practice of eating insects (entomophagy) raises challenging questions for the Western countries where this practice is not a habit.
Finally, we argue that the Rasch model allowed us to better understand the steps that should be taken to improve the consumption of insects-based foods in Western countries.
Author Contributions
Conceptualization, L.I. and I.B.; methodology, E.G., L.I. and F.N.; validation, L.I., M.R., A.S. and I.B.; writing—original draft preparation, L.I. and M.R.; writing—review and editing, L.I., I.B. and A.S. All authors have read and agreed to the published version of the manuscript.
Funding
This research received no external funding.
Institutional Review Board Statement
Not applicable.
Informed Consent Statement
Not applicable.
Data Availability Statement
The data presented in this study are available on request from the corresponding author.
Conflicts of Interest
The authors declare no conflict of interest.
References
- FAO. The Future of Food and Agriculture–Trends and Challenges; Food and Agriculture Organization of the United Nations: Rome, Italy, 2017. [Google Scholar]
- FAO. Edible Insects Future Prospects for Food and Feed Security; Food and Agriculture Organization of the United Nations: Rome, Italy, 2013. [Google Scholar]
- Borrello, M.; Caracciolo, F.; Lombardi, A.; Pascucci, S.; Cembalo, L. Consumers perspective on circular economy strategy for reducing food waste. Sustde 2017, 9, 141. [Google Scholar] [CrossRef] [Green Version]
- Henkion, M.; Hayes, M.; Mullen, A.M.; Fenelon, M.; Tiwari, B. Future protein supply and demand: Strategies and factors influencing a sustainable equilibrium. Foods 2017, 6, 53. [Google Scholar] [CrossRef] [PubMed] [Green Version]
- Arena, E.; Mazzaglia, A.; Selvaggi, R.; Pecorino, B.; Fallico, B.; Serranò, M.; Pappalardo, G. Exploring Consumer’s Propensity to Consume Insect-Based Foods. Empirical Evidence from a Study in Southern Italy. Appl. Syst. Innov. 2020, 3, 38. [Google Scholar] [CrossRef]
- Hartmann, C.; Siegrist, M. Consumer perception and behaviour regarding sustainable protein consumption: A systematic review. Trends Food Sci. Technol. 2017, 61, 11–25. [Google Scholar] [CrossRef]
- Van Huis, A. Insects as food and feed, a new emerging agricultural sector: A review. J. Insects Food Feed 2020, 6, 27–44. [Google Scholar] [CrossRef] [Green Version]
- Deppermann, A.; Havlík, P.; Valin, H.; Boere, E.; Herrero, M.; Vervoort, J.; Mathijs, E. The market impacts of shortening feed supply chains in Europe. Food Sec. 2018, 10, 1401–1410. [Google Scholar] [CrossRef] [Green Version]
- Hoek, A.C.; Elzerman, J.E.; Hageman, R.; Kok, F.J.; Luning, P.A.; de Graaf, C. Are meat substitutes liked better over time? A repeated in-home use test with meat substitutes or meat in meals. Food Qual. Prefer. 2013, 28, 253–263. [Google Scholar] [CrossRef]
- Raheem, D.; Carrascosa, C.; Oluwole, O.B.; Nieuwland, M.; Saraiva, A.; Millán, R.; Raposo, A. Traditional consumption of and rearing edible insects in Africa, Asia and Europe. Crit. Rev. Food Sci. Nutr. 2019, 59, 2169–2188. [Google Scholar] [CrossRef]
- Van der Weele, C.; Feindt, P.; van der Goot, A.J.; Mierlo, B.; Boekel, M. Meat alternatives: An integrative comparison. Trends Food Sci. Technol. 2019, 88, 505–512. [Google Scholar] [CrossRef]
- Sanchez-Sabate, R.; Sabaté, J. Consumer attitudes towards environmental concerns of meat consumption: A systematic review. Int. J. Environ. Res. Public Health 2019, 16, 1220. [Google Scholar] [CrossRef] [Green Version]
- Oonincx, D.G.; de Boer, I.J. Environmental impact of the production of mealworms as a protein source for humans a life cycle assessment. PLoS ONE 2012, 7, e51145. [Google Scholar] [CrossRef] [Green Version]
- Smetana, S.; Palanisamy, M.; VolkerHeinz, A.M. Sustainability of insect use for feed and food: Life Cycle Assessment perspective. J. Clean. Prod. 2016, 137, 741–751. [Google Scholar] [CrossRef]
- Adegbeyea, M.J.; Ravi Kanth Reddyb, P.; Obaisi, A.I.; Elghandourd, M.M.M.Y.; Oyebamiji, K.J.; AZM Salem, O.T.; Morakinyo-Fasipe, M.; Cipriano-Salazar, M.; Camacho-Díaz, L.M.. Sustainable agriculture options for production, greenhouse gasses and pollution alleviation, and nutrient recycling in emerging and transitional nations - An overview. J. Clean. Prod. 2020, 242, 118319. [Google Scholar] [CrossRef]
- Jensen, K.; Kristensen, T.N.; Heckmann, L.H.; Sørensen, J.G. Breeding and maintaining high-quality insects. In Insects as Food and Feed; Wageningen Academic Publishers: Wageningen, The Netherlands, 2017; pp. 174–198. [Google Scholar]
- Van Huis, A.; Oonincx, D.G. The environmental sustainability of insects as food and feed. A review. Agron. Sustain. Dev. 2017, 37, 43. [Google Scholar] [CrossRef] [Green Version]
- Deroy, O.; Reade, B.; Spence, C. The insectivore’s dilemma and how to take the West out of it. Food Qual. Prefer 2015, 44, 44–55. [Google Scholar] [CrossRef] [Green Version]
- Rumpold, B.A.; Schluter, O.K. Nutritional composition and safety aspects of edible insects. Mol. Nutr. Food Res. 2013, 57, 802–823. [Google Scholar] [CrossRef]
- Halloran, A.; Vantomme, P.; Hanboonsong, Y.; Ekesi, S. Regulating edible insects: The challenge of addressing food security, nature conservation, and the erosion of traditional food culture. J. Food Secur. 2015, 7, 739–746. [Google Scholar] [CrossRef]
- Gravel, A.; Doyen, A. The use of edible insect proteins in food: Challenges and issues related to their functional properties. Innov. Food Sci. Emerg. Technol. 2020, 59, 102272. [Google Scholar] [CrossRef]
- Hartmann, C.; Siegrist, M. Becoming an insectivore: Results of an experiment. Food Qual. Prefer 2016, 51, 118–122. [Google Scholar] [CrossRef]
- Martins, Y.; Pliner, P. “Ugh! That’s disgusting!”: Identification of the characteristics of foods underlying rejections based on disgust. Appetite 2006, 46, 75–85. [Google Scholar] [CrossRef]
- Sogari, G. Entomophagy and Italian consumers: An exploratory analysis. Prog. Nutr. 2015, 17, 311–316. [Google Scholar]
- Lombardi, A.; Vecchio, R.; Borrello, M.; Caracciolo, F.; Cembalo, L. Willingness to pay for insect-based food: The role of information and carrier. Food Qual. Prefer. 2019, 72, 177–187. [Google Scholar] [CrossRef]
- Pliner, P.; Hobden, K.L. Development of a scale to measure the trait of food neophobia in humans. Appetite 1992, 19, 105–120. [Google Scholar] [CrossRef]
- Laureati, M.; Proserpio, C.; Jucker, C.; Savoldelli, S. New sustainable protein sources: Consumers’ willingness to adopt insects as feed and food. Ital. J. Food Sci. 2016, 28, 652–668. [Google Scholar]
- Piha, S.; Pohjanheimo, T.; Lähteenmäki-Uutela, A.; Křečková, Z.; Otterbring, T. The effects of consumer knowledge on the willingness to buy insect food: An exploratory cross-regional study in Northern and Central Europe. Food Qual. Prefer. 2018, 70, 1–10. [Google Scholar] [CrossRef]
- Elorinne, A.-L.; Niva, M.; Vartiainen, O.; Väisänen, P. Insect Consumption Attitudes among Vegans, Non-Vegan Vegetarians, and Omnivores. Nutrients 2019, 11, 292. [Google Scholar] [CrossRef] [Green Version]
- House, J. Consumer acceptance of insect-based foods in the Netherlands: Academic and commercial implications. Appetite 2016, 107, 47–58. [Google Scholar] [CrossRef] [Green Version]
- Pernille, N.; Videbæka, K.; Grunerta, G. Disgusting or delicious? Examining attitudinal ambivalence towards entomophagy among Danish consumers. Food Qual. Prefer. 2020, 83, 103913. [Google Scholar]
- Batat, W.; Peter, P. The healthy and sustainable bugs appetite: Factors affecting entomophagy acceptance and adoption in Western food cultures. J. Consum. Mark. 2020, 37, 291–303. [Google Scholar] [CrossRef]
- Balzan, S.; Fasolato, L.; Maniero, S.; Novelli, E. Edible insects and young adults in a north-east Italian city an exploratory study. Br. Food J. 2016, 118, 318–326. [Google Scholar] [CrossRef]
- Orsi, L.; Voege, L.L.; Stranieri, S. Eating edible insects as sustainable food? Exploring the determinants of consumer acceptance in Germany. Food Res. Int. 2019, 125, 108573. [Google Scholar] [CrossRef]
- La Barbera, F.; Verneau, F.; Videbæk, P.N.; Amato, M.; Grunert, K.G. A self-report measure of attitudes toward the eating of insects: Construction and validation of the Entomophagy Attitude Questionnaire. Food Qual. Prefer. 2020, 79, 103757. [Google Scholar] [CrossRef]
- Jensen, N.H.; Lieberoth, A. We will eat disgusting foods together–Evidence of the normative basis of Western entomophagy-disgust from an insect tasting. Food Qual Prefer. 2019, 72, 109–115. [Google Scholar] [CrossRef] [Green Version]
- Sogari, G.; Menozzi, D.; Mora, C. Sensory-liking expectations and perceptions of processed and unprocessed insect products. Int. J. Food Syst. Dyn. 2018, 9, 314–320. [Google Scholar]
- Verneau, F.; La Barbera, F.; Kolle, S.; Amato, M.; Del Giudice, T.; Grunert, K. The effect of communication and implicit associations on consuming insects: An experiment in Denmark and Italy. Appetite 2016, 106, 30–36. [Google Scholar] [CrossRef]
- Bond, T.G.; Fox, C.M. Applying the Rasch Model: Fundamental Measurement in the Human Sciences, 3rd ed.; Routledge: New York, NY, USA; London, UK, 2015. [Google Scholar]
- Kimberlin, C.L.; Winterstein, A.G. Validity and reliability of measurement instruments used in research. Am. J. Health Pharm. 2008, 65, 2276–2284. [Google Scholar] [CrossRef]
- Yasin, R.M.; Yunus, F.A.N.; Rus, R.C.; Ahmad, A.; Rahim, M.B. Validity and Reliability Learning Transfer Item Using Rasch Measurement Model. Procedia Soc. Behav. Sci. 2015, 204, 212–217. [Google Scholar] [CrossRef] [Green Version]
- Gay, D. Airasian, The Rating Scale Model. In Handbook of Modern Item Response Theory; Linden, W.J., Hambleton, R.K., Eds.; Springer: New York, NY, USA, 2003; Chapter 4; pp. 67–148. [Google Scholar]
- Hagquist, C.; Bruce, M.B.; Gustavsson, J.P. Using the Rasch model in nursing research: An introduction and illustrative example. Int. J. Nurs. Stud. 2009, 46, 380–393. [Google Scholar] [CrossRef]
- Rasch, G. Probabilistic Models for Some Intelligence and Attainment Tests; University of Chicago Press: Chicago, IL, USA, 1960. [Google Scholar]
- Tennant, A.; Conaghan, P.G. The Rasch measurement model in rheumatology: What is it and why use it? When should it be applied, and what should one look for in a Rasch paper? Arthritis Rheum. 2007, 57, 1358–1362. [Google Scholar] [CrossRef]
- Hanafi, N.M.; Rahman, A.A.; Mukhtar, M.I.; Ahmad, J.; Warman, S. Validity and Reliability of Competency Assessment Implementation (CAI) Instrument Using Rasch Model. Int. J. Soc. Educ. Econ. Manag. Eng. 2014, 8, 162–167. [Google Scholar]
- Azrilah, A.A. Rasch Model Fundamentals: Scale Construct and Measurement Structure; Integrated Advance Planning Sdn Bhd.: Kuala Lumpur, Malaysia, 2011. [Google Scholar]
- Wright, B.D. Sample-free test calibration and person measurement. In Proceedings of the ETS Invitational Conference on Testing Problems; MESA Research Memorandum; ETS: Princeton, NJ, USA, 1968. [Google Scholar]
- Foti, V.T.; Scuderi, A.; Stella, G.; Timpanaro, G. Consumer purchasing behaviour for “biodiversity-friendly” vegetable products: Increasing importance of informal relationships. Agric. Econ. 2019, 65, 404–414. [Google Scholar] [CrossRef] [Green Version]
- Gere, A.; Székely, G.; Kovács, S.; Kókai, Z.; Sipos, L. Readiness to adopt insects in Hungary: A case study. Food Qual. Prefer. 2017, 59, 81–86. [Google Scholar] [CrossRef]
- Verbeke, W. Profiling consumers who are ready to adopt insects as a meat substitute in a Western society. Food Qual. Prefer. 2015, 39, 147–155. [Google Scholar] [CrossRef]
- Andrich, D. A rating formulation for ordered response categories. Psychometrika 1978, 43, 561–573. [Google Scholar] [CrossRef]
- Bassi, I.; Gori, E.; Iseppi, L. Assessing environmental awareness towards protection of the Alps: A case study. Land Use Policy 2019, 87, 104028. [Google Scholar] [CrossRef]
- Boyle, K. Contingent valuation in practice. In A Primer on Nonmarket Valuation; Champ, P.A., Boyle, K., Brown, T.C., Eds.; Springer: Berlin/Heidelberg, Germany, 2017. [Google Scholar]
- Ashraf, R.; Merunka, D. The use and misuse of student samples: An empirical investigation of European marketing research. J. Consum. Behav. 2017, 16, 295–308. [Google Scholar] [CrossRef]
- Depositario, D.P.T.; Nayga, R.M., Jr.; Wu, X.; Laude, T.P. Should students be used as subjects in experimental auctions? Econ. Lett. 2009, 102, 122–124. [Google Scholar] [CrossRef]
- Mjelde, J.W.; Israel Schwarzlose, A.A.; Dudensing, R.M.; Jin, Y.; Cherrington, L.K.; Chen, J. Subject pool effects among the general population and students: A choice experiment example. Appl. Econ. Lett. 2016, 23, 1018–1021. [Google Scholar] [CrossRef]
- Rasch, G. On general laws and the meaning of measurement in psychology. In Proceedings of the Fourth Berkeley Symposium on Mathematical Statistics and Theory of Probability, Davis, CA, USA, 20 June–30 July 1960; Volume IV, pp. 321–333. [Google Scholar]
- Rasch, G. On Specific Objectivity: An attempt at formalizing the request for generality and validity of scientific statements. Dan. Yearb. Philos. 1977, 14, 58–94. [Google Scholar]
- Campbell, N.R. An Account of the Principles of Measurement and Calculation; Longmans, Green & Co: London, UK, 1928. [Google Scholar]
- Engelhard, G., Jr. Invariant Measurement: Using Rasch Models in the Social, Behavioral, and Health Sciences, 1st ed.; Routledge: New York, NY, USA; London, UK, 2013. [Google Scholar]
- Cembalo, L.; Karabatsos, G. Axiomatic measurement theory as a basis for model selection in item-response theory. In Proceedings of the 32th Annual Conference for the Society for Mathematical Psychology, Santa Cruz, CA, USA, 23 June 1999. [Google Scholar]
- Hambleton, R.K.; Swaminathan, H. Item Response Theory: Principles and Applications; Kluwer-Nijho: Boston, MA, USA, 1985. [Google Scholar]
- Allen, M.J.; Yen, W.M. Introduction to Measurement Theory; Waveland Press: Long Grove, IL, USA, 2002. [Google Scholar]
- Wright, B.D.; Masters, G.N. Rating Scale Analysis. Rasch Measurement; MESA Press: Chicago, CA, USA, 1982. [Google Scholar]
- Battauz, M.; Bellio, R.; Gori, E. Covariate Measurement Error Adjustment for Multilevel Models with Application to Educational Data. J. Educ. Behav. Stat. 2011, 36, 283–306. [Google Scholar] [CrossRef]
- Linacre, J.M. Category, step and threshold: Definitions & disordering. Rasch Meas. Trans. 2001, 15, 794. [Google Scholar]
- Lord, F.M.; Novick, M.R. Statistical Theories of Mental Test Scores; Addison-Wesley Publishing Company: Boston, MA, USA, 1968. [Google Scholar]
- Linacre, J.M. WINSTEPS, MESA Press: Chicago, IL, USA, 2002.
- Bond, T.G.; Fox, C.M. Applying the Rasch Model: Fundamental Measurement in the Human Sciences; Routledge: Oxon, UK, 2007. [Google Scholar]
- Smith, E.V., Jr. Understanding Rasch measurement: Detecting and evaluating the impact of multidimenstionality using item fit statistics and principal component analysis of residuals. J. Appl. Meas. 2002, 3, 205–231. [Google Scholar]
- Sogari, G.; Bogueva, D.; Marinova, D. Australian Consumers’ Response to Insects as Food. Agriculture 2019, 9, 108. [Google Scholar] [CrossRef] [Green Version]
- Linacre, J.M. Rasch model estimation: Further topics. J. Appl. Meas. 2004, 5, 95–110. [Google Scholar]
- Palmieri, N.; Perito, M.A.; Macrì, M.C.; Lupi, C. Exploring consumers’ willingness to eat insects in Italy. Br. Food J. 2019, 121, 2937–2950. [Google Scholar] [CrossRef]
- Sogari, G.; Menozzi, D.; Mora, C. Exploring young foodies׳ knowledge and attitude regarding entomophagy: A qualitative study in Italy. Int. J. Gastron. Food Sci. 2017, 7, 16–19. [Google Scholar] [CrossRef]
- Megido, R.C.; Gierts, C.; Bleckerb, C.; Brostaux, Y.; Haubrugea, É.; Alabia, T.; Francisa, F. Consumer acceptance of insect-based alternative meat products in Western countries. Food Qual. Prefer. 2016, 52, 237–243. [Google Scholar] [CrossRef]
- Tan, H.S.G.; van den Berg, E.; Stieger, M. The influence of product preparation, familiarity and individual traits on the consumer acceptance of insects as food. Food Qual. Prefer. 2016, 52, 222–231. [Google Scholar] [CrossRef]
- Hartmann, C.; Shi, J.; Giusto, A.; Siegrist, M. The psychology of eating insects: A cross-cultural comparison between Germany and China. Food Qual. Prefer. 2015, 44, 148–156. [Google Scholar] [CrossRef]
- Schlup, Y.; Brunner, T. Prospects for insects as food in Switzerland: A tobit regression. Food Qual. Prefer. 2018, 64, 37–46. [Google Scholar] [CrossRef]
- Flight, I.; Leppard, P.; Cox, D.N. Food neophobia and associations with cultural diversity and socio-economic status amongst rural and urban Australian adolescents. Appetite 2003, 41, 51–59. [Google Scholar] [CrossRef]
- Galati, A.; Tulone, A.; Moavero, P.; Crescimanno, M. Consumer interest in information regarding novel food technologies in Italy: The case of irradiated foods. Food Res. Int. 2019, 119, 291–296. [Google Scholar] [CrossRef] [PubMed]
- Roma, R.; Ottomano Palmisano, G.; De Boni, A. Insects as novel food: A consumer attitude analysis through the dominance-based rough set approach. Foods 2020, 9, 387. [Google Scholar] [CrossRef] [Green Version]
- Toti, E.; Massaro, L.; Kais, A.; Aiello, P.; Palmery, M.; Peluso, I. Entomophagy: A Narrative Review on Nutritional Value, Safety, Cultural Acceptance and A Focus on the Role of Food Neophobia in Italy. Eur. J. Investig. Health Psychol. Educ. 2020, 10, 46. [Google Scholar] [CrossRef]
- Van Huis, A. Edible insects are the future? Proc. Nutr. Soc. 2016, 75, 294–305. [Google Scholar] [CrossRef] [PubMed] [Green Version]
- Onwezena, M.C.; van den Puttelaara, J.; Veraina, M.C.D.; Veldkamp, T. Consumer acceptance of insects as food and feed: The relevance of affective factors. Food Qual. Prefer. 2019, 77, 51–63. [Google Scholar] [CrossRef]
- Cicatiello, C.; De Rosa, B.; Franco, S.; Lacetera, N. Consumer approach to insects as food: Barriers and potential for consumption in Italy. Br. Food J. 2016, 118, 2271–2286. [Google Scholar] [CrossRef]
- Ruby, M.B.; Rozin, P.; Chan, C. Determinants of willingness to eat insects in the USA and India. J. Insects Food Feed 2015, 1, 215–225. [Google Scholar] [CrossRef]
- Tuccillo, F.; Marino, M.G.; Torri, L. Italian consumers’ attitudes towards entomophagy: Influence of human factors and properties of insects and insect-based food. Food Res. Int. 2020, 137, 109619. [Google Scholar] [CrossRef]
- Torri, L.; Tuccillo, F.; Bonelli, S.; Piraino, S.; Leoned, A. The attitudes of Italian consumers towards jellyfish as novel food. Food Qual. Prefer. 2020, 79, 103782. [Google Scholar] [CrossRef]
- Petersen, M.; Olson, O.; Rao, S. University Student Perspectives of Entomophagy: Positive Attitudes Lead to Observability and Education Opportunities. J. Insect Sci. 2020, 20, 1–6. [Google Scholar] [CrossRef]
- La Barbera, F.; Verneau, F.; Amato, M.; Grunert, K. Understanding Westerners’ disgust for the eating of insects: The role of food neophobia and implicit associations. Food Qual. Prefer. 2018, 64, 120–125. [Google Scholar] [CrossRef]
Figure 1.
Characteristic curve for Item 11. The empirical curve is in red, the estimated curves in blue and black.
Figure 1.
Characteristic curve for Item 11. The empirical curve is in red, the estimated curves in blue and black.

Figure 2.
Standardized residual variance in eingenvalue units.

Figure 3.
Item ranking in relation to the difficulty in answering and expected scores (“:” half-point measures).
Figure 3.
Item ranking in relation to the difficulty in answering and expected scores (“:” half-point measures).

Figure 4.
DIF for gender. Legend: 1 = male; 2 = female; 0 = missing.


Table 1.
Items on attitudes to enthomophagy and codes.
| Items | Codes |
|---|---|
| Country of origin | D1 |
| Personal eating habits (omnivore, vegetarian, vegan, other) | D2 |
| Have you ever heard about ”Entomophagy” (the practice of eating insects)? | D3 |
| Are you aware that in some parts of the world insects are considered a delicacy? | D4 |
| Do you know how many species of insects are edible? | D5 |
| Have you ever eaten insects? | D6 |
| What type of insect-based products have you tried? | D7 |
| Are you aware that we frequently eat insects without being aware of it? | D8 |
| How often do you eat an insect-based meal? | D9 |
| How do insects fit into your diet? | D10 |
| For which reasons would you decide to eat insects? | D11 |
| In case of hunger or need, would you eat insects? | D12 |
| Which of the foods below do you not eat (raw or cooked)? | D13 |
| How difficult do you think it is to find these edible insects? | D14 |
| How much would you be willing to pay for 10 g of ready-to-eat insects? | D15 |
| Which nutritional component do you think is the most present in insects? | D16 |
| Which are in your opinion the pros of eating insects? | D17 |
| In your opinion, what are the cons of eating insects? | D18 |
| Which age group would you think is most interested in eating insects? | D19 |
| Are you interested in receiving more information about it? | D20 |
| Would you be more willing to eat insects if you had a better understanding of the practice of entomophagy? | D21 |
| Which insect(s) would you consider eating among the ones listed below? | D22 |
| Would you prefer to eat local or exotic species of insects? | D23 |
| What type of insect-based products would you try? | D24 |
| Where do you expect to find insect-based products on sale? | D25 |
| In your opinion, who is responsible for the safety of insect-based products for human consumption? | D26 |
| Would you eat animal products (meat, milk, etc.) produced by livestock fed with insects? | D27 |
| Would you add an insect-based product to the diet of your pet? | D28 |
| What feeling does this picture provoke in you? (Giant wasps) | D29 |
| What feeling does this picture provoke in you? (Mealworms) | D30 |
| What feeling does this picture provoke in you? (Locusts with chocolate) | D31 |
| What feeling does this picture provoke in you? (Insect mix) | D32 |
Table 2.
Characteristics of the sample.
| Characteristics | Classes | % |
|---|---|---|
| Gender | Female | 59.5 |
| Age | 20–30 | 43.9 |
| Education | Graduates High school | 55.3 21.3 |
| Country | Italy | 85.4 |
| Eating habits | Omnivorous | 91.3 |
Table 3.
Reliability indices for items (our elaboration on Winsteps’ table output).
| Summary of 23 Measured (Non-Extreme) Item | ||||||||
|---|---|---|---|---|---|---|---|---|
| Total Score | Count | Measure | Model S.E. 5 | Infit 1 | Outfit 2 | |||
| MNSQ 3 | ZSTD 4 | MNSQ | ZSTD | |||||
| Mean | 230.2 | 411.0 | 0.00 | 0.15 | 1.02 | 0.05 | 0.90 | −0.42 |
| SEM | 42.2 | 13.7 | 0.32 | 0.01 | 0.04 | 0.51 | 0.07 | 0.35 |
| P. SD | 198.9 | 64.3 | 1.48 | 0.03 | 0.020 | 2.38 | 0.31 | 1.63 |
| S.SD | 203.4 | 65.7 | 1.51 | 0.03 | 0.21 | 2.44 | 0.32 | 1.67 |
| Max. | 675.0 | 437.0 | 2.77 | 0.26 | 1.49 | 4.49 | 1.41 | 2.81 |
| Min. | 19.0 | 164.0 | −3.60 | 0.11 | 0.64 | −5.14 | 0.27 | −3.86 |
| Item reliability | 0.99 | |||||||
1 Infit means inlier-sensitive or information-weighted fit. This is more sensitive to the pattern of responses to items targeted on the person, and vice-versa. 2 Outfit means outlier-sensitive fit. This is more sensitive to responses to items with difficulty far from a person, and vice-versa. 3 Mean-square fit statistics (MNSQ) show the size of the randomness.1.0 is their expected values. Values less than 1.0 indicate observations are too predictable (redundancy, data overfit the model). Values greater than 1.0 indicate unpredictability (unmodeled noise, data underfit the model). 4 Standardized fit statistics (ZSTD) are t-tests of the hypothesis “Do the data fit the model (perfectly)?” They show the improbability of the data, i.e., its significance, if the data actually did fit the model. 0.0 are their expected values. Less than 0.0 indicates too predictable. More than 0.0 indicates lack of predictability. 5 Model “Ideal” Standard Error = Real S.E./Maximum [1.0, sqrt(INFIT mean-square)].
Table 4.
Reliability indices for extreme and non-extreme people (our elaboration on Winsteps’ table output).
Table 4.
Reliability indices for extreme and non-extreme people (our elaboration on Winsteps’ table output).
| Summary of 437 Measured (Extreme and Non-Extreme) Person | ||||||||
|---|---|---|---|---|---|---|---|---|
| Total Score | Count | Measure | Model S.E. | Infit | Outfit | |||
| MNSQ | ZSTD | MNSQ | ZSTD | |||||
| Mean | 12.1 | 21.6 | −2.04 | 0.84 | n.c. | n.c. | n.c. | n.c. |
| SEM | 0.3 | 0.0 | 0.11 | 0.02 | n.c. | n.c. | n.c. | n.c. |
| P. SD | 6.2 | 0.8 | 2.38 | 0.50 | n.c. | n.c. | n.c. | n.c. |
| S.SD | 6.2 | 0.8 | 2.38 | 0.50 | n.c. | n.c. | n.c. | n.c. |
| Max. | 29.0 | 22.0 | 3.43 | 1.88 | n.c. | n.c. | n.c. | n.c. |
| Min. | 1.0 | 18.0 | −5.83 | 0.49 | n.c. | n.c. | n.c. | n.c. |
| Person reliability | 0.83 | |||||||
Cronbach alpha person raw score test reliability: 0.90.
Table 5.
Reliability indices for non-extreme people (our elaboration on Winsteps’ table output).
| Summary of 362 Measured (Non-Extreme) Person | ||||||||
|---|---|---|---|---|---|---|---|---|
| Total Score | Count | Measure | Model S.E. | Infit | Outfit | |||
| MNSQ | ZSTD | MNSQ | ZSTD | |||||
| Mean | 13.6 | 21.6 | −1.26 | 0.62 | 1.00 | 0.07 | 0.88 | 0.02 |
| SEM | 0.3 | 0.0 | 0.10 | 0.01 | 0.02 | 0.05 | 0.03 | 0.04 |
| P. SD | 5.8 | 0.8 | 1.82 | 0.19 | 0.32 | 1.00 | 0.51 | 0.71 |
| S.SD | 5.8 | 0.8 | 1.82 | 0.19 | 0.32 | 1.00 | 0.51 | 0.71 |
| Max. | 29.0 | 22.0 | 3.43 | 1.10 | 2.19 | 3.25 | 2.89 | 2.24 |
| Min. | 2.0 | 18.0 | −4.51 | 0.49 | 0.44 | −2.63 | 0.13 | −1.74 |
| Person reliability | 0.87 | |||||||
Minimum extreme score: 75 person 17.2%. deleted: 69 person.
Table 6.
Model adaptation indices for each item (our elaboration on Winsteps’ table output).
| Item | Total Score | Measure | Model S.E. | Infit | Outfit | Exact Match | |||
|---|---|---|---|---|---|---|---|---|---|
| MNSQ | ZSTD | MNSQ | ZSTD | OBS% | EXP% | ||||
| D20 | 295 | −3.60 | 0.17 | 1.49 | 4.49 | 1.41 | 1.35 | 78.5 | 86.3 |
| D24.4 | 94 | 0.40 | 0.14 | 1.25 | 3.41 | 1.39 | 1.48 | 76.8 | 79.9 |
| D15M | 132 | 1.17 | 0.16 | 1.38 | 2.69 | 1.34 | 2.29 | 60.7 | 67.9 |
| D15F | 197 | 0.33 | 0.13 | 1.31 | 3.07 | 1.29 | 2.81 | 57.8 | 65.4 |
| D22.7 | 132 | −0.31 | 0.13 | 1.17 | 2.72 | 1.16 | 0.92 | 70.2 | 76.9 |
| D30 | 430 | 0.57 | 0.16 | 1.12 | 1.46 | 1.15 | 0.56 | 77.5 | 81.4 |
| D24.1 | 202 | −1.55 | 0.14 | 1.14 | 2.01 | 1.04 | 0.36 | 72.9 | 78.3 |
| D11.3 | 158 | −0.77 | 0.13 | 1.09 | 1.50 | 1.12 | 0.86 | 71.3 | 76.2 |
| D11.6 | 68 | 0.98 | 0.16 | 1.12 | 1.43 | 0.98 | 0.06 | 82.0 | 83.9 |
| D24.2 | 129 | −0.26 | 0.13 | 1.05 | 0.88 | 1.03 | 0.23 | 75.7 | 77.1 |
| D31 | 637 | 0.18 | 0.11 | 1.00 | 0.07 | 1.03 | 0.32 | 71.3 | 70.2 |
| D22.2 | 159 | −0.79 | 0.13 | 1.00 | 0.05 | 0.85 | −1.07 | 74.9 | 76.3 |
| D22.5 | 88 | 0.53 | 0.14 | 0.96 | −0.48 | 0.94 | −.14 | 82.0 | 80.7 |
| D11.4 | 28 | 2.27 | 0.22 | 0.88 | −0.77 | 0.45 | −1.53 | 93.1 | 92.7 |
| D22.3 | 86 | 0.57 | 0.15 | 0.88 | −1.74 | 0.65 | −1.40 | 83.7 | 81.0 |
| D21 | 259 | −2.70 | 0.15 | 0.87 | −1.61 | 0.73 | −1.42 | 85.1 | 83.2 |
| D22.6 | 72 | 0.88 | 0.15 | 0.87 | −1.68 | 0.58 | −1.47 | 84.8 | 83.2 |
| D32 | 549 | 1.37 | 0.13 | 0.84 | −2.07 | 0.82 | −1.05 | 77.2 | 74.8 |
| D22.1 | 172 | −1.02 | 0.13 | 0.83 | −2.94 | 0.66 | −2.78 | 81.5 | 76.5 |
| D22.4 | 19 | 2.77 | 0.26 | 0.83 | −0.90 | 0.27 | −2.29 | 95.0 | 94.9 |
| D24.3 | 105 | 0.19 | 0.14 | 0.82 | −2.88 | 0.63 | −1.87 | 83.7 | 78.7 |
| D29 | 608 | 1.06 | 0.13 | 0.82 | −2.39 | 0.79 | −1.98 | 80.5 | 77.4 |
| D23 | 675 | −2.25 | 0.14 | 0.64 | −5.14 | 0.48 | −3.86 | 89.2 | 81.3 |
| Mean | 230.2 | 0.00 | 0.15 | 1.02 | 0.10 | 0.90 | -0.4 | 78.5 | 79.3 |
| P. SD | 198.9 | 1.48 | 0.03 | 0.20 | 2.40 | 0.31 | 1.6 | 8.7 | 6.6 |
Table 7.
Ranking of items according to their degree of difficulty (our elaboration on Winsteps’ table output).
Table 7.
Ranking of items according to their degree of difficulty (our elaboration on Winsteps’ table output).
| Item | Total Score | Measure | Model S.E. | Infit | Outfit | Exact Match | |||
|---|---|---|---|---|---|---|---|---|---|
| MNSQ | ZSTD | MNSQ | ZSTD | OBS% | EXP% | ||||
| D22.4 | 19 | 2.77 | 0.26 | 0.83 | −0.90 | 0.27 | −2.29 | 95.0 | 94.9 |
| D11.4 | 28 | 2.27 | 0.22 | 0.88 | −0.77 | 0.45 | −1.53 | 93.1 | 92.7 |
| D32 | 549 | 1.37 | 0.13 | 0.84 | −2.07 | 0.82 | −1.05 | 77.2 | 74.8 |
| D15M | 132 | 1.17 | 0.16 | 1.38 | 2.69 | 1.34 | 2.29 | 60.7 | 67.9 |
| D29 | 608 | 1.06 | 0.13 | 0.82 | −2.39 | 0.79 | −1.98 | 80.5 | 77.4 |
| D11.6 | 68 | 0.98 | 0.16 | 1.12 | 1.43 | 0.98 | 0.06 | 82.0 | 83.9 |
| D22.6 | 72 | 0.88 | 0.15 | 0.87 | −1.68 | 0.58 | −1.47 | 84.8 | 83.2 |
| D30 | 430 | 0.57 | 0.16 | 1.12 | 1.46 | 1.15 | 0.56 | 77.5 | 81.4 |
| D22.3 | 86 | 0.57 | 0.15 | 0.88 | −1.74 | 0.65 | −1.40 | 83.7 | 81.0 |
| D22.5 | 88 | 0.53 | 0.14 | 0.96 | −0.48 | 0.94 | −0.14 | 82.0 | 80.7 |
| D24.4 | 94 | 0.40 | 0.14 | 1.25 | 3.41 | 1.39 | 1.48 | 76.8 | 79.9 |
| D15F | 197 | 0.33 | 0.13 | 1.31 | 3.07 | 1.29 | 2.81 | 57.8 | 65.4 |
| D24.3 | 105 | 0.19 | 0.14 | 0.82 | −2.88 | 0.63 | −1.87 | 83.7 | 78.7 |
| D31 | 637 | 0.18 | 0.11 | 1.00 | 0.07 | 1.03 | 0.32 | 71.3 | 70.2 |
| D24.2 | 129 | −0.26 | 0.13 | 1.05 | 0.88 | 1.03 | 0.23 | 75.7 | 77.1 |
| D22.7 | 132 | −0.31 | 0.13 | 1.17 | 2.72 | 1.16 | 0.92 | 70.2 | 76.9 |
| D11.3 | 158 | −0.77 | 0.13 | 1.09 | 1.50 | 1.12 | 0.86 | 71.3 | 76.2 |
| D22.2 | 159 | −0.79 | 0.13 | 1.00 | 0.05 | 0.85 | −1.07 | 74.9 | 76.3 |
| D22.1 | 172 | −1.02 | 0.13 | 0.83 | −2.94 | 0.66 | −2.78 | 81.5 | 76.5 |
| D24.1 | 202 | −1.55 | 0.14 | 1.14 | 2.01 | 1.04 | 0.36 | 72.9 | 78.3 |
| D23 | 675 | −2.25 | 0.14 | 0.64 | −5.14 | 0.48 | −3.86 | 89.2 | 81.3 |
| D21 | 259 | −2.70 | 0.15 | 0.87 | −1.61 | 0.73 | −1.42 | 85.1 | 83.2 |
| D20 | 295 | −3.60 | 0.17 | 1.49 | 4.49 | 1.41 | 1.35 | 78.5 | 86.3 |
| Mean | 230.2 | 0.00 | 0.15 | 1.02 | 0.1 | 0.90 | −0.4 | 78.5 | 79.3 |
| P. SD | 198.9 | 1.48 | 0.03 | 0.20 | 2.4 | 0.31 | 1.6 | 8.7 | 6.6 |
Table 8.
Analysis of variance of propensity for entomophagy by gender (our elaboration on Winsteps’ table output).
Table 8.
Analysis of variance of propensity for entomophagy by gender (our elaboration on Winsteps’ table output).
| Person Count | Mean Measure | S.E. Mean | P. SD | S. SD | Median | Model Separation | Model Reliability | RMSE | True SD | Code |
|---|---|---|---|---|---|---|---|---|---|---|
| 430 | −1.92 | 0.16 | 3.37 | 3.38 | −0.99 | 2.47 | 0.86 | 1.27 | 3.12 | * |
| 172 | −0.89 | 0.24 | 3.10 | 3.10 | −0.04 | 2.59 | 0.87 | 1.11 | 2.89 | 1 |
| 258 | −2.61 | 0.21 | 3.37 | 3.38 | −1.87 | 2.27 | 0.84 | 1.36 | 3.09 | 2 |
| Person Code | Code | Mean Measure | Difference S.E. | t | welch-2 sided | |||||
| d.f. | Prob. | |||||||||
| 1 | 2 | 1.73 | 0.32 | 5.45 | 387 | 0.000 | ||||
| ANOVA—Person | ||||||||||
| Source | Sum of Squares | d.f. | Mean Squares | F-test | Prob > F | |||||
| Gender | 307.38 | 1 | 307.38 | 27.72 | 0.0000 | |||||
| Error | 4580.96 | 428 | 10.70 | |||||||
| Total | 4888.34 | 429 | 11.39 | |||||||
Fixed Effects χ2 29.7051 with 1 d.f.
Table 9.
Average entomophagy propensity of respondents and F-test p-Values (our elaboration on Winsteps’ table output).
Table 9.
Average entomophagy propensity of respondents and F-test p-Values (our elaboration on Winsteps’ table output).
| Food Consumed | Medium Propensity—Yes | Medium Propensity—No | F Test p-Value |
|---|---|---|---|
| 13.1 Shrimps | −1.57 | −2.67 | 0.0000 |
| 13.2 Squid | −1.58 | −2.67 | 0.0000 |
| 13.3 Octopus | −1.60 | −2.68 | 0.0000 |
| 13.4 Mussels | −1.67 | −2.60 | 0.0000 |
| 13.5 Clams | −1.57 | −2.73 | 0.0000 |
| 13.6 Oysters | −1.84 | −2.55 | 0.0046 |
| 13.7 Offal | −2.02 | −2.19 | 0.6665 |
| 13.8 Fish eggs | −1.78 | −2.59 | 0.0013 |
| 13.9 Game | −1.70 | −2.63 | 0.0002 |
Publisher’s Note: MDPI stays neutral with regard to jurisdictional claims in published maps and institutional affiliations. |
© 2021 by the authors. Licensee MDPI, Basel, Switzerland. This article is an open access article distributed under the terms and conditions of the Creative Commons Attribution (CC BY) license (https://creativecommons.org/licenses/by/4.0/).
Share and Cite
MDPI and ACS Style
Iseppi, L.; Rizzo, M.; Gori, E.; Nassivera, F.; Bassi, I.; Scuderi, A. Rasch Model for Assessing Propensity to Entomophagy. Sustainability 2021, 13, 4346. https://0-doi-org.brum.beds.ac.uk/10.3390/su13084346
AMA Style
Iseppi L, Rizzo M, Gori E, Nassivera F, Bassi I, Scuderi A. Rasch Model for Assessing Propensity to Entomophagy. Sustainability. 2021; 13(8):4346. https://0-doi-org.brum.beds.ac.uk/10.3390/su13084346
Chicago/Turabian StyleIseppi, Luca, Marcella Rizzo, Enrico Gori, Federico Nassivera, Ivana Bassi, and Alessandro Scuderi. 2021. "Rasch Model for Assessing Propensity to Entomophagy" Sustainability 13, no. 8: 4346. https://0-doi-org.brum.beds.ac.uk/10.3390/su13084346
Note that from the first issue of 2016, this journal uses article numbers instead of page numbers. See further details here.