
Success Factors in Sustainable Management of IT Service Projects: Exploratory Factor Analysis


Faculty of Computer Science and Management, Wrocław University of Science and Technology, 50-370 Wrocław, Poland
*
Author to whom correspondence should be addressed.
Sustainability 2021, 13(8), 4457; https://0-doi-org.brum.beds.ac.uk/10.3390/su13084457
Submission received: 4 March 2021
/
Revised: 12 April 2021
/
Accepted: 13 April 2021
/
Published: 16 April 2021
(This article belongs to the Special Issue Stakeholders in Sustainable Project Management)
Abstract
:Management of successful IT projects in a sustainable manner is influenced by numerous factors. Organizational awareness of the necessity of engaging all project stakeholders is an important issue that helps in meeting project sustainable development goals. While there are many studies on the success factors of IT software projects, there is still little coherent research on the success factors of IT service projects. The purpose of this article is to contribute in filling this gap by attempting to identify success factors of the IT services project involving both traditional and agile approaches and considering sustainable development, specifically in terms of the stakeholders’ role in project management. We conducted questionnaire-based research involving 155 IT service project managers. The results of the study were subjected to exploratory factor analysis. As a result, we presented and thoroughly formally examined the factorial model of success components in the IT service industry. We distinguished four factors: (1) agile techniques and change management, (2) organization and people, (3) stakeholders and risk analysis, and (4) work environment. The results were compared with analogous studies found in the literature. The research showed that both traditional and agile management approaches coexist, meet sustainable development goals, and are significant for the successful management in IT service projects where all stakeholders play an important role.
1. Introduction
Sustainability can be summarized as taking care of people and the world, without forgetting economic criteria with a wide participation of stakeholders and with a profound consideration of stakeholder values, opinions, feelings, and needs [1]. Successful management of IT projects in a sustainable manner is influenced by numerous factors. Even though a considerable amount of research was focused on these aspects, it is still a challenge for companies to apply appropriate measures for ensuring high quality and timeliness of services while taking into account the stakeholders and all their diversified expectations and attitudes.
Despite the rapid development of the IT industry and increasing experience in sustainable project management, many ventures are not fully successful. Failures concern delays, deviations from original assumptions and requirements, changes in scope and functionality, and, finally, project interruption [2,3]. All these negative outcomes, naturally, decrease the effectiveness and efficiency of the project management process, adversely affect the internal and external stakeholders, and may have destructive impact on the possibility of achieving project goals. On the other hand, they may be a consequence of insufficient emphasis attached to project stakeholders.
Nowadays, more and more large and complex organizations transform their IT services by means of multiple different techniques and methods aligning their activities with sustainability goals. They try to maintain specific resources at an appropriate level in the global ecosystem [4] and are increasingly more aware of the importance of engaging all project stakeholders in meeting sustainable development goals [5].
Although there are many studies on the success factors of IT software projects, there is still little coherent and comprehensive research on the success factors in projects involving specifically IT services. Thus, the purpose of this article is to identify success factors of the IT service projects by taking into account both traditional and agile approaches. We performed exploratory factor analysis based on a questionnaire filled in by IT service project managers. The analysis was conducted in the context of sustainable development goals and managerial aspects related to project stakeholders.
The rest of the paper is organized as follows. First, we extensively review the literature on sustainable management in IT projects with a specific focus on the role of stakeholders. Section 2 includes also background works concerned with success factors in IT systems, software, and services. The next section presents information on the questionnaire development and administration, sample characteristics and statistical tools applied. In Section 4, we demonstrate the initial six-factor model involving all 45 questions extracted from the literature review. The model is then refined and reduced to the four-factor solution with 16 variables. The final proposal is thoroughly examined in terms of its statistical quality with a strong emphasis on reliability and validity. We proposed the names for the identified factors and interpreted. Discussion and comparisons with other models obtained in this area were provided in Section 6. Finally, the conclusion section finishes the paper.
2. Literature Review
2.1. Successful Sustainable Management of IT Projects—The Role of Stakeholders
At the end of the 20th century organizational awareness of homeostasis with the surrounding world began to increase. Many authors presented and analyzed the concepts related to sustainability (e.g., [6]), sustainable development (e.g., [7]), sustainable project management in general [8], and focused specifically on project stakeholders (e.g., [9,10]). The Oxford English Dictionary defines sustainability as the ability to continue over time [11]. The other definition says that sustainability is the “capability of being maintained at a certain rate or level” [4]. The World Commission on Environment and Development defined sustainable development from the perspective of present needs, technology, and social organization limitations [12] with a special focus on a balance between social, environment and economic goals, known as three pillars [13]. Recently, another pillar was included. It concerns human being aspects [14].
Allen and Hoekstra [6] consider sustainability as an evolutionary process involving collaboration between its components and nature. The sustainability notion evolved to the sustainable development which is seen as a strategy of managing all assets [15]. In such a context, the project management impacts social, environment and economy goals. In consequence, the sustainability aspect of project management started being adapted to business organizations. As a response to current market challenges and changing environment, organizations such as Project Management Institute (PMI) and International Project Management Association (IPMA) also incorporated sustainability into the project management process, linking it with agile principles [16]. Both principles work directly to achieve positive economic, human, socio and environmental capital leading to successful projects. What is more, one of the Agile Manifesto principles is directly related to sustainable development, namely, “Agile processes promote sustainable development” [17]. The studies on sustainability in proactive stakeholder management have been provided, for example, by [18]. The research in this regard, generally suggest that it is desired to engage stakeholders with all their interests in project management activities (compare specifically [10]). It is beneficial to all stakeholders to mutually cooperate in building and managing solutions to create a coherent and well-functioning system.
Usually, the project definition is clear-cut. We consider a project as a temporary enterprise with start and completion dates specified, which is undertaken to deliver a unique product or service [19]. When it comes to the project success term, the literature is more ambiguous. The concept of success in IT projects may relate the project success and the project management success. The project success refers to project objectives that constitute the most appropriate success criteria. For example, in the research of Cooke-Davies [20], which included the analysis of mainly European projects, the success factors involved the project management success, individual project success and consistently successful projects. Another approach was proposed by de Wit [21], who considered the project as successful if it met the following conditions: technical performance criteria, mission, and satisfaction of key stakeholders including both the provider and customer. In this context, the project is considered successful when the long-term perspective is taken into account—even 10–15 years after the project completion. The project management success, in turn, has a short-term nature [22] and concerns traditional performance measures such as time, cost and quality [23]. These are also called objective measures. They can be supplemented by subjective ones regarding the satisfaction of all project stakeholders [24,25,26].
Until 2015, large-scale studies on factors influencing the project success performed regularly by the Standish Group did not consider subjective measures of stakeholders. However, in later investigations, the satisfaction criteria was already included [2]. This change was probably caused by results showing that the success of project management based only on the costs and time does not guarantee the overall project success [2,27]. Some research even suggests to change the primary success measures (time, cost and quality) into the success perception criteria [28]. In this paper, we adopted the project success perspective including both approaches, that is, project scope, quality, time, cost, and stakeholders’ satisfaction.
While analyzing the elements having a potential impact on the project success, we can distinguish critical success factors (CSF) [29]. They represent key areas, where “things must go right” to achieve objectives and goals by individuals or organizations [30]. For the purpose of this study, it was assumed that project success components include all management system input data which may directly or indirectly lead to the project success [21]. The potential variables impacting project success can be found in multiple studies and were subject to analysis in diverse industries. The number of success elements varies not only across industries but also within them. We can find both categorized and ungrouped lists of success components depending on the context of research. For instance, Pinto and Slevin [31] asked managers to provide a list of improvements in successful project implementation. The responses were grouped into 10 success factors and classified as strategic and tactical.
The following subsections contain a brief review of research on project success factors related with the IT sector. We present and discuss separately studies related to IT services, IT software manufacturing enterprises, and IT system industry which is not dedicated specifically to IT software development or IT services.
The IT system is understood here in a broad sense (e.g., [32]) and includes all communication and computer components within an organization. More specifically, the IT system comprises all software, hardware, and various other components that connect these individual pieces together into a functional and operating structure in an organization. IT software development regards creation, changing or maintaining computer applications that involves their designing, programming, testing, as well as installation and training (e.g., [33]). IT services, in turn, are related to the use of knowledge from management and computer technology to support organizations in creating, maintaining, and improving business processes along with managing information resources. They may be focused on business processes, or IT infrastructure (e.g., [34]).
The three areas have some common aspects and differences. All of them pertain to computer science technology and information processing. Although these spheres are mutually related to each other, there are also significant discrepancies among them. For instance, IT services may cover, extend, make use of, or create IT system components in some situations, but they do not fully overlap as some IT services may not involve the IT system existing in a given organization. Providing IT services may require using some software components, but not creating the software, which is the part of the IT software development. IT software development itself may be focused on computer applications that are not part of the IT system in an organization, e.g., computer games or some mobile phone software.
2.2. Success Factors in IT Systems
In this section we focus on research in the IT system industry which is not dedicated specifically to IT software development or IT services. Besner and Hobbs [35,36] focused on exploring the value of project management practices in improving project performance. They concentrated on tools and techniques used by project managers. The investigation involved a large number of 753 global project management practitioners. They were asked about a list of 70 tools and techniques taken from the Project Management Book of Knowledge (PMBoK) that could have positive impact on the project success. Similar tools and techniques are used regardless of the origin of the projects. However, nearly 60% of the respondents were IT and telecommunication practitioners. The findings show that only about a third of the examined tools and techniques are regularly used by project managers.
Doherty [37] applied the Q methodology mixed design to analyze subjective insights about the important project success factors. The author surveyed 60 IT project managers and identified two critical success factors: a sustained commitment of the upper management to the given project and clear and measurable project goals and objectives. He additionally distinguished the importance of people–project interactions, stakeholders’ involvement, and traditional project management activities. However, Doherty did not identify the agile management and principles of organizational or coordination theories as significant components of the project success.
Baker [38] based on the literature review distinguished 23 critical success factors. Subsequently, he used the factor analysis and the multiple linear regression analysis, based on 113 surveys, to examine relationships between the computer technology project success and selected critical success factors. As a result of these analyses, all variables were grouped into three factors: process and methods (including such variables as architecture and design, quality and risk management, product development life-cycle), relationship management (represented by variables like organization culture, management support, stakeholders’ involvement), and project management (with schedule, plan, scope, and requirements management elements).
Within Enterprise Resource Planning (ERP) systems, Nah et al. [39] identified initial success factors using the literature review and then submitted the survey to Chief Information Officers (CIOs) of Fortune 1000 companies. They received 54 responses and using descriptive statistical analysis provided the success factors ranking. The most important factors involved management support, project champion, and teamwork and composition.
White and Fortune [40] submitted their questionnaire to 995 active project managers (with approximately 24% response rate). They discovered critical practices of project managers, mainly in information technology. The tool included both closed (one choice, multiple choice, scale) and open questions. The authors applied descriptive statistics and recognized 22 success components including, among others, clear goals and objectives, management support, adequate funds and resources.
2.3. Success Factors in IT Software Development
In this subsection, exemplary studies focused directly on success factors in software development projects are characterized. For instance, Berntsson-Svensson and Aurum [41] asked software practitioners and managers from Swedish and Australian companies to participate in the survey which consisted of 33 questions. They randomly chose software producing companies that received the survey. The participants were developing software for three different industries—financial, consulting, and telecommunications. The authors received a total of 27 survey responses and provided only descriptive statistics. The common success components for studied industries are concerned with complete and accurate requirements and enough time for gathering the requirements.
Chow and Cao [42] based on the literature review compiled a list of potential success factors and studied the critical success factors in agile software projects by means of factor and regression analyses. Overall, 109 participants from 25 countries completed the survey. They identified 12 possible critical success factors that were transformed into 12 main hypotheses. Using the multiple regression analysis, they determined that six success factors out of those 12 can be considered as important enough. The list of significant factors contained: delivery strategy, agile software engineering techniques, team capability, project management process, team environment, and customer involvement.
A similar study was conducted by Stankovic et al. [43]. It involved 23 respondents from former Yugoslavia IT companies. They aimed at classifying the critical success factors by using the same survey tool as Chow and Cao [42], however the new results did not confirm the exploratory factor analysis structure provided by Chow and Cao [42]. Despite that, Stankovic et al. [43] did also the corresponding regression analysis with all 12 factors received by Chow and Ciao [42]. They received three more significant factors that could potentially be considered as critical success factors in terms of timeliness and cost. The authors confirmed that strong executive support and project type has no influence on the success of agile project which was in line with the previous study. They found that the organization environment factor does not strongly influence the success of agile projects, which is consistent with the former research as well.
Another study based on Chow’s and Cao’s [42] research has been conducted by Brown [44] who performed multiple regression analysis to check how various factors are related to the four success dimensions (quality, scope, timeliness, and cost) and how they contribute to the agile project success. The agile project members were chosen randomly from companies located in the United States of America. Brown [44] found that six out of the 12 factors were significant: project type, project schedule, project nature, management commitment, project definition process, and delivery strategy.
Stanberry [45] also based her research on the results of Chow and Cao [42]. She surveyed 132 practitioners from USA-based global companies, who used scrum methodology. The respondents acted in such roles as the scrum master, product owner, software developer, business analyst, and tester. The purpose of the research was to examine relations between 12 success factors using regression techniques. She found that all 12 success factors had a meaningful impact on the success of agile software development projects where the scrum methodology was applied.
Large-scale studies regarding the IT software sector are performed by the Standish Group [2,46,47]. This organization explores the state of IT application development sector on a yearly basis. Among other things, the organization provides a summary report including the top 10 project success factors known as the CHAOS summary report [48]. Executives included in the survey represent large, medium, and small project sizes from all major industry sectors with a heavier concentration on the United States. The respondents are IT executives not project managers which can lead to the lack of more detailed potential success variables. In CHAOS report 2015, the new attribute criteria have been added. Instead of traditional success criteria (on time, on budget and on target) the modern six individual attributes of success (on time, on budget, on target, on goal, value, and satisfaction) have been implemented.
Williams [49] conducted an analysis on managers’ software development approach and its relation to the project success. He surveyed 281 IT project managers. Based on the obtained results he recommends that agile and hybrid methods should be the preferred in software development for most projects and that more experienced IT managers should be sought.
Furthermore, Aldahmash et al. [50] researched the critical success factors of agile software development projects. Based on the literature review, they initially selected eight potential success factors. Next, they designed a web-based questionnaire in which they ask agile practitioners about factors that help to successfully complete the project. The authors used the principal component analysis to identify a structure with two components: (1) organizational and people aspects involving organizational culture, customer involvement, top management support, team capability and training, and communication, and (2) technical and project management components related to project management process, delivery strategy, and agile software techniques.
2.4. Success Factors in IT Service
Finally, this section refers to the research on project success factors referring directly to IT services. It seems that in this specific area, the number of studies is considerably the smallest in relation to the IT sector fields described in previous subsections. Among a few studies that focus on success components concerned specifically with IT services there are works of Hochstein et al. [51,52] who conducted several studies of European companies specializing in IT services. They indicated the following significant elements of success: management process, acceptance and attention in organization, high quality project management, process understanding, and success verification.
The studies on Information Technology Infrastructure Library (ITIL) implementations as a transformation IT service management in Australian companies has been conducted by Cater-Steel et al. [53]. Their qualitative approach findings showed key success factors related to the engagement of the personnel, support from the top management, communication of results, marketing campaigns in terms of acceptance and understanding, training and personnel development paths.
Critical success factors in this area were identified also for Lean IT implementations [54]. The research was based on the series of interviews with experts who determined which factors may be critical or noncritical. The authors started from the set of 30 components and ended up with 16 factors. The five highest ranked items are as follows: management leadership, measuring operational performance of the IT outsourcing relationship, financial compensation mechanism that stimulates improvement, utilization of Lean tools or techniques, and rewarding performance on a team-level basis.
3. Methods
3.1. Exploratory Factor Analysis
Since project success determinants in IT services received comparatively small scientific attention, we decided to employ the exploratory factor analysis (EFA) for examining this issue and try to provide a consistent framework for future studies. All EFA procedures aimed at obtaining the factor loading structure used PCA extraction and that was followed by the orthogonal Varimax rotation with Kaiser normalization. This type of statistical procedure aims at identifying and associating the examined set of variables to more general factors or categories. Technically, it allows to reduce the matrix of correlations between variables whereas practically, it facilitates better understanding of the investigated subject by revealing the hidden structure of relations between these variables.
3.2. Questionnaire Development
In this study a web-based questionnaire was developed. The scope and selection of questions in the questionnaire considers both traditional and agile approaches, and is based on the literature review analysis. In the face of sparse works dealing directly with IT services, we extended our search by studies from other fields focused on project success factors. Specifically, we searched Scopus and Web of Science Core Collection databases for publications using expressions: “project success”, “project management success”, “project success factors”, “project management success factors” along with additional keywords “IT”, “IT service”, “IT systems”, and “software”. Some additional references were obtained by examining references from publications identified in searched databases. As a result, we analyzed 169 articles involving project success factors. The extensive and detailed list of research sources from all the areas that were used to collect possible candidates for critical success components and included in the exploratory factor analysis, are put together in Appendix A, Table A1. It should be mentioned that some of the potential success factors examined in the literature and taken advantage of in this study were based either on a small sample of respondents or provided only descriptive arguments that were not backed up by quantitative justifications involving statistical methods.
While choosing variables for our questionnaire we focused on such components that were the most common and the most relevant to the IT service area. As a result, an initial list of potential questions was methodically evaluated by 15 experts. They were psychologists and sociologists skilled in creating questionnaires and analyzing this type of data, as well as project management scientists, IT project managers and heads of project management departments. The grammatical, stylistic and semantic correctness, question types, scales, detail, structure, and logical consistency were verified.
During the preparation phase the questionnaire tool was tested and reviewed in a preliminary study [55]. Fifteen IT project managers answered all questions of the survey. After reviews and discussions with subject matter experts and results of preliminary survey received from respondents, the series of improvements was implemented. To improve readability and firstly to focus on the success factors area, the section sequences were changed, a new (success perception) section was added, and accordingly names of the sections were updated. Within the success factors section, the two changes regarding noncompliance with Likert scale was conducted (question related risk management was extended to the three questions on risk subject, and question related to the tools used was moved to the project profile section). In consequence, the total number of potential success factors was extended from 44 to 45. In terms of grammatical and stylistic the minor correctness of 18 questions were performed.
3.3. Sample and Data Collection
The survey was anonymous and was carried out in 2019 from February to June in an international company operating worldwide in the IT service area. Overall, 155 fully completed web-based questionnaires were collected. The tool included questions about project success rated on the 7-point Likert scale (1—strongly disagree; 2—disagree; 3—somewhat disagree; 4—neither agree nor disagree; 5—somewhat agree; 6—agree; 7—strongly agree). The survey was filled in by project managers, who were asked about project critical success factors. They were instructed to refer to the project finished recently (either successful or not) which was the most relevant or most telling with regard to critical success factors. The research tool consisted of five sections. The first part contained elements potentially influencing the project success. The second section included questions on respondents’ perception of the project success. Next, the criteria for success in the project were included. The fourth part regarded information about the project and the project manager. In the last section subjects had the possibility to provide additional comments. Taking into account the specifics of the IT sector, the sample can be regarded as balanced in relation to the gender. Among the project managers involved in the study, there was as much as 43% of females. The overall experience of the respondents in the IT sector was significant with an average of over 10 years and standard deviation of S = 8.1. Almost 60% of them had at least six years of such experience. Their mean experience as project managers in the IT sector equaled over seven years (S = 6.2) with nearly 70% having more than four years of experience in project management. The details are provided in Table 1.
The respondents took part in projects from multiple countries mostly located in Europe. There were more than 20 projects from Germany, France, United Kingdom, more than 10 from Italy, Benelux and Nordic countries. There were also some projects from Switzerland, Japan, and the USA. The respondents participated in projects that lasted on average 15 months (S = 18.2). The vast majority of projects (88%) were carried out for external clients, and only 12% for internal recipients. Approximately half of the projects were focused on developing a new service or system, the rest involved either extension or maintenance of the existing IT solutions. More information about projects’ characteristics is given in Table 2.
3.4. Data Analysis
The gathered data were, generally, analyzed in IBM Statistical Package for the Social Sciences (SPSS Statistics, version 26). Specifically, the following procedures from this software were employed: exploratory factor analysis, Cronbach’s alphas in the reliability analysis, variance inflation factors from the collinearity diagnostics, descriptive analysis (means, standard deviations, skewness, kurtosis). Parallel analysis was conducted by means of eigenvalues produced by SPSS for our model and random eigenvalues generated by web software available at [56]. Average variance extracted along with composite reliability were computed in Microsoft Excel.
4. Initial Factor Model
The input data to the statistical model are represented by 45 variables resulting from the literature review. Each of the components along with their literature origin are described in Table A1 placed in Appendix A. As it was presented in the literature review, in previous studies on project management success components, the identified number of factors in exploratory analysis varied considerably from 2 [50] to even 12 [42]. Based on the extensive and detailed analysis of these studies, it was difficult to propose the most suitable number of factors. The investigations were very different in terms of the specific scope, participants’ characteristics, comprehensiveness of the literature review, and formal criteria used in the exploratory factor analysis. Therefore, we decided to start the analysis with six factors that were obtained in our preliminary study. Overall, they explained 52.8% of the total variance. Eigenvalues above 1 and variance explained for such a factor analysis are provided in Table A3 of Appendix B. The factor loading results of this initial step involving all 45 questions are presented in Table A2 in Appendix B. The resulting structure is far from being of good quality, especially in terms of convergent and discriminant validity. Although there is a substantial number of factor loadings above 0.35 (bolded) which should not be neglected, in many cases significant, and multiple cross loadings exist, e.g., Q05, Q11, Q12, Q14, Q37, Q43 (underlined). Moreover, for some variables, none of the factor loadings exceeded the value of 0.4, e.g., Q17, Q22, Q27, Q33 (in italics). It may also be noted that factors 5 and 6 have a relatively small number of high-valued correlations with variables. On the other hand, the first factor has as many as 16 factor loadings above 0.35. Given these problems, we adopted some criteria facilitating the selection of the appropriate number of factors and performed a series of simulations with various configurations of variables. Finally, we managed to specify a more parsimonious model with four factors and 16 variables, which is presented and comprehensively analyzed in Section 5 of this paper.
5. Final Factor Model
The initial six-factor model involving all 45 variables was subjected to a series of modifications to improve its quality. Generally, we confined it to only four factors. Variables that weakly correlated with all factors or highly correlated with two or more factors were eliminated. Variables were excluded from the model one by one taking also into account their substantive suitability. The exploratory factor analysis was repeated after each such activity using the same approach. In total, more than 30 iterations were performed. As a result of this gradual elimination and taking into consideration of other model quality measures, the final factor structure consists of four factors and 16 variables. The refined model accounts for as much as 61% of the total variance, which is meaningfully higher than our initial proposal of six factors (52.8%). In the next subsections, details on the whole procedure are presented, the variables included in the model are grouped according to the distinguished factors which are then interpreted.
5.1. Common Method Bias
Taking advantage of the Harman’s single factor test [57], we verified to which extent a single factor may be sufficient to explain the whole variance related to all variables in our model. The biggest unrotated factor associated with the largest eigenvalue (5.2) amounted to barely 32.5% (see Table 3), which is considerably smaller than the recommended threshold of less than 50%. It means that common method bias does not affect meaningfully the present research model.
5.2. Factors Extraction
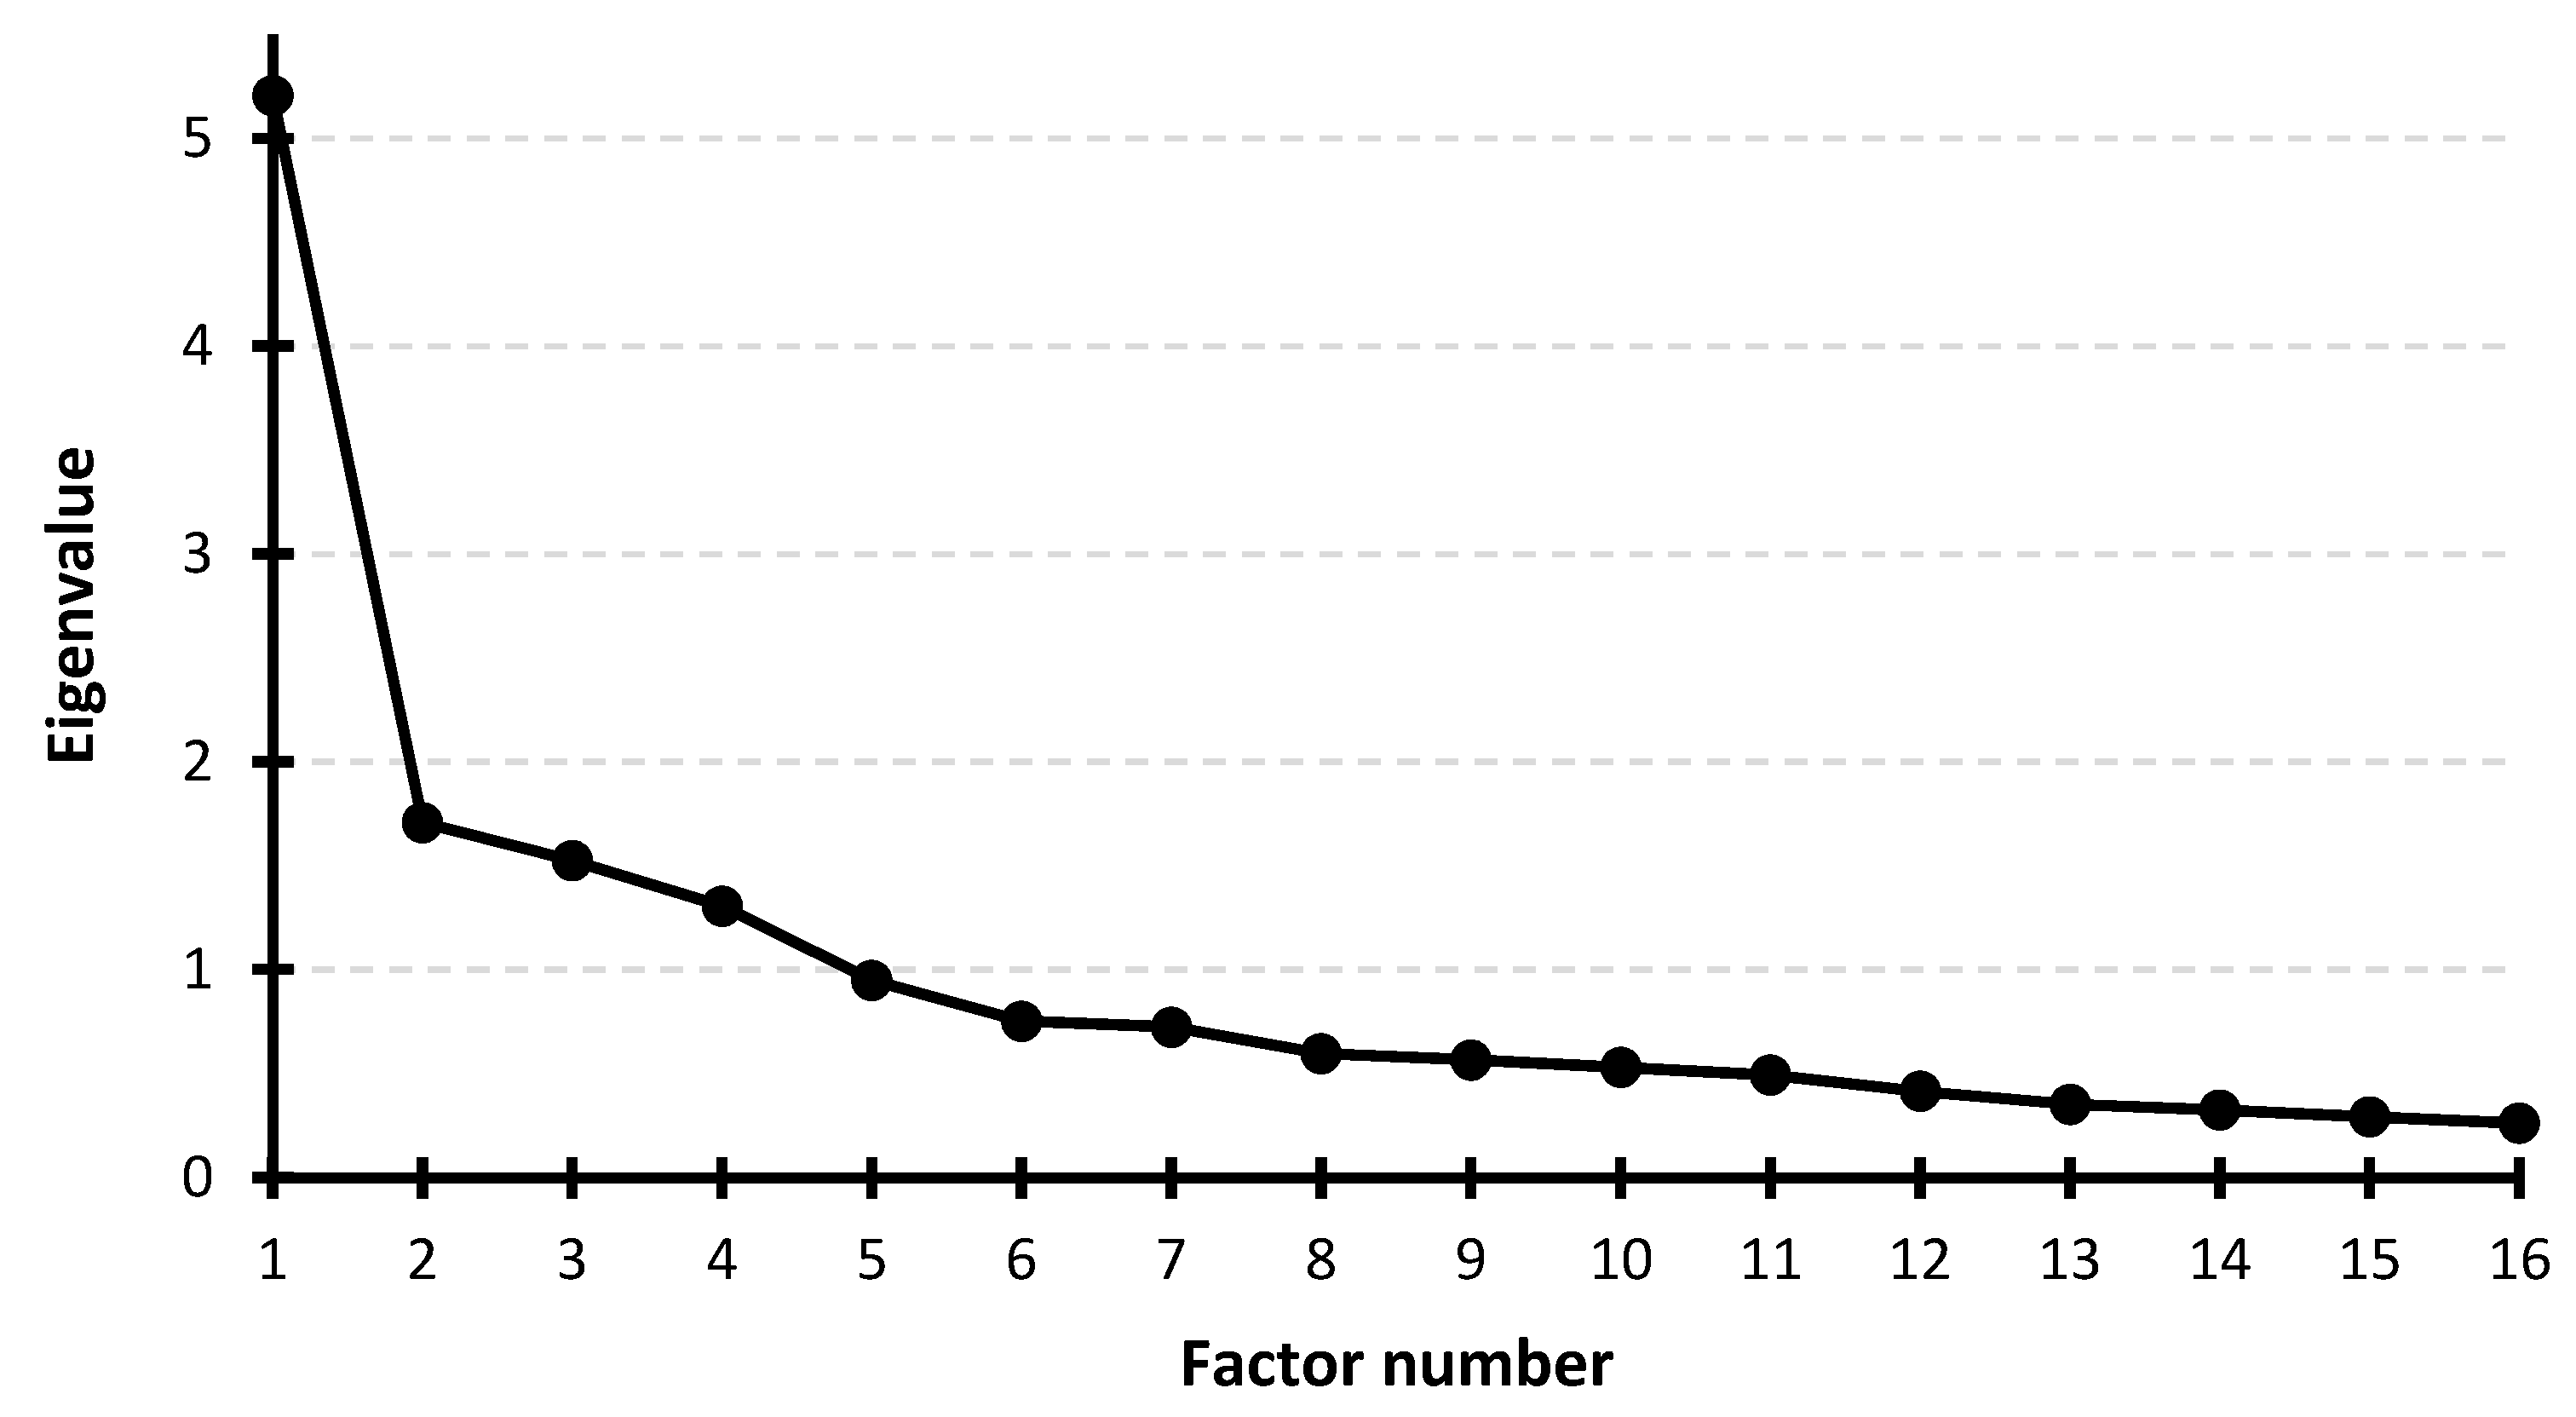
The Harman’s approach showed that one factor is definitely not enough to account for all the variance, therefore various criteria were utilized to determine the appropriate number of factors in the final model. According to the Kaiser’s criterion one should include in the model all factors with the eigenvalues greater than one [58]. For 16 variables left in the model, this approach suggests retaining four factors. Their eigenvalues are put together in Table 3. All 16 eigenvalues are given in Table A4 of Appendix C and graphically illustrated in Figure 1. This scree plot can be used for determining the number of factors [59]. The curve bending also indicates four factors to be incorporated in the model which is consistent with the Kaiser’s criterion.
The Horn’s parallel analysis [60] is a more formal tool for specifying the number of factors. The idea is based on calculating eigenvalues from randomly generated correlation matrices for the specific number of variables and subjects and then comparing the results with eigenvalues from the given factor analysis. For our study, according to the software available at [56], there were four eigenvalues bigger than the corresponding random values (software parameters: number of variables = 16, sample size = 155, type of analysis = PCA, number of random correlation matrices to generate = 100). Thus, the procedure recommends taking into account four factors, which is in full concordance with two other methods described above. These four extracted factors account for 60.9% of the whole variance. After Varimax orthogonal rotation with Kaiser’s normalization, the first three factors explain a similar proportion of the variance (between 16% and 17%) whereas the last factor slightly less—about 11% (see Table 3). In general, the value of total variance explained should be 50% or higher [61]. Thus, the obtained proportion is fully acceptable.
5.3. Basic Statistics of the Final Four-Factors Model
Basic statistics of final exploratory model with four factors are provided in Table 4. Mean scores for variables, measured on a seven-point Likert scale, range from 2.74 to 5.45. Standard deviations were similar for these items with the minimum equal to 1.25 and maximum of 1.93. Skewness parameters varied from –1.23 to 0.67 while kurtoses were between –1.41 and 1.35. These values are far below the threshold proposed by Lei and Lomax [62] which, in absolute values, should not be bigger than 2.3. The statistics do not preclude the collected data to come from normal distributions.
The Kaiser–Meyer–Olkin measure of sampling adequacy for our four-factorial final exploratory model amounts to 0.832, which is considered meritorious [63,64]. The parameter ranges from 0 to 1 and values below 0.5 indicate that data are not suitable for the factor analysis. Additionally, Bartlett’s test of sphericity [65] designed for checking if the correlation matrix is significantly different from an identity matrix, was statistically meaningful (χ2 = 862, df = 120, p < 0.0001). This shows that the data are suitable for the factorial structure search.
The correlation matrix determinant value being very close to zero may cause computational problems or even prevent from finding the inverse matrix and, as a consequence, factor loadings [66]. Moreover, very small values of the determinant may indicate the existence of considerable intercorrelations between groups of variables. In the present study the determinant was equal 0.003 which is much bigger than recommended value of 0.00001 [67,68].
When the data is based on a sample smaller than 300, which is the case in the present research, it is advised to check the mean communality. The communality shows to what extent the specific variable correlates with all other variables. In our four-factor model, the average value for communalities is equal to 0.609 which is above the recommended minimum for sample sizes range from 100 to 200 [69]. The communalities for individual variables are given in the seventh column of Table 4. In the final model, they vary from 0.42 to 0.78. Thus, all values are well above the minimum of 0.2 score, below which the given item should be removed [70].
The measures of sampling adequacy for all variables from the final four-factor model are presented in the eighth column of Table 4. The data demonstrate high values for these parameters (min = 0.68, max = 0.93) confirming the correctness of the model. They can be further compared with the anti-image correlations between all variables which are put together in Table A5 in Appendix C along with measures of sampling adequacy placed on the diagonal. The anti-image correlations outside the main diagonal are generally low with the mean of their absolute values amounting to 0.196. That signifies that there is no need for excluding any variable from the revised four-factor model.
The last column of Table 4 contains values of variance inflation factors (VIF). High values of this parameter may suggest excessive multicollinearity between variables. Usually, VIFs below 10 are considered acceptable [71]. More restrictive recommendations imply values lower than 5 or even 3. In our study even the most severe limits are not exceeded by any variable. The VIFs range from 1.33 to 2.48 with a mean of 1.81.
5.4. Factor Loading Structure
The factor loading structure of the final model after the exploratory analysis is presented in Table 5. The model consists of four factors that include 16 variables. The factors were labeled and described as F1—Agile techniques and change management (five questions: Q24, Q25, Q30, Q31, Q32), F2—Organization and people (four questions: Q01, Q03, Q08, Q09), F3—Stakeholders and risk analysis (four questions: Q34 Q41 Q42 Q44), and F4—Work environment (questions: Q06, Q07, Q38). The full texts of questions used in the questionnaire are also provided in Table 5. In our analyses, we applied the principal component (PCA) as the factor extraction method followed by Varimax orthogonal rotation with Kaiser normalization. The model converged in five iterations.
5.5. Model Structure Quality
The final full factor loading table is given in Table A6 of Appendix C. According to [72], factor loading bigger than 0.4 may be deemed stable. We suppressed all values smaller than 0.35, and variables with all factor loading smaller than this threshold were excluded in the process of developing the model [67]. Hair et al. [73] suggest that the remaining factor loadings should be at least 0.45 for sample sizes between 150 and 200. This recommendation is met in our model since the smallest factor loading amounts to 0.572 for F1, Q25. The mean loadings for variables grouped in factors equal MF1 = 0.669, MF2 = 0.763, MF3 = 0.747, MF4 = 0.723, with the overall mean of 0.722.
To formally verify the convergence validity, we employed the value of the average variance extracted (AVE) [74]. The AVEs are provided in Table 5 near factor descriptions, and they range from 0.493 to 0.584 with the mean of 0.544. It is recommended for AVE to be larger than 0.5 [75], because it means that the measurement error-related variance is smaller than the variance explained by the given factor [76]. In the present model, only for one factor the value is slightly smaller (by 0.07) than this limit. Furthermore, if AVE is smaller than 0.5, but composite reliability is higher than 0.6, which is the case here (CR = 0.795), the factor’s convergent validity is satisfactory [76]. Thus, all the above-mentioned results are acceptable and indicate adequate level of convergent validity. Values from Table A6 (Appendix C) do not present any considerable cross-loadings between factors and there are at least three variables loading on each extracted factor. This indicates decent discriminant validity. Generally, the model presents a clean structure with good both convergent and discriminant validity.
The variable reliability refers to the consistency of the items loading on the given factor. To verify this concept, we used Cronbach’s alpha (CA) [77] and composite reliability (CR) [78,79] measures. Values of CA and CR are placed next to the factor labels and descriptions in Table 5. The CA measures vary from 0.614 (for F4) to 0.824 (for F2) with the mean of 0.752. According to [80] CAs should be bigger than 0.7, however, values between 0.6 and 0.7 are also acceptable [74,81]. In turn, CR values are between 0.770 and 0.849 with the average of 0.813 and also conform to the recommendation of being higher than 0.6 [76] or 0.7 [71]. In light of these measures, the reliability of the variables used to construct the identified factors are sufficiently reliable.
5.6. Factors’ Names Proposal and Interpretation
As a result of the analysis, we extracted four main factors. The individual groups of variables’ names proposals are as follows:
- F1
- Agile techniques and change management. Details of the first factor are related to the agile documentation which should not be too focused on producing elaborate documentation as milestones, agile training for project managers, reduction of work in progress, focus on the results, but not simple utilization of them, and change management process. This factor is strongly described by agile variables which proves the validity of our approach.
- F2
- Organization and people. This second factor involves executive support and team motivation, high competencies, knowledge and expertise, hierarchy and responsibilities regarding organization culture with clear divisions. This component shows significant relation to the human sustainability pillar. Highly motivated and skilled teams, supported by senior management, are very valuable stakeholders’ assets in successful projects.
- F3
- Stakeholders and risk analysis. The third factor includes the risk analysis and stakeholders in the project along with the delivery strategy. A stakeholder in the project is either an individual or an entire organization that can influence or can be influenced by activities related to the project. In particular, taking into account the IT service projects, we can distinguish the following stakeholders: project manager, program manager, executive, project sponsor, delivery manager, functional manager, architect, (business, system, delivery) analyst, technical teams, project management office, resource manager, user, and corresponding roles from the customer side. This factor shows that there exists an important relation between stakeholders and risk management that may influence the project success. Thus, conducting the risk analysis, every stakeholder should be involved in each change and in all control points of the project.
- F4
- Work environment. The fourth factor is associated with the location and dependency of the teams, as well as with the agile facility of the work environment like an open space, communal area, ample wall spaces for postings, etc. A friendly work environment, both physical and virtual, is another potential factor increasing the effectiveness of projects and constitutes the environmental sustainability pillar.
6. Discussion
Based on the series of exploratory factor analyses, we finally proposed a model that includes four main success factors of IT service projects that are defined by 16 specific variables. A comparison of our findings with the outcomes of similar research conducted worldwide by means of the factor analysis shows considerable differences both quantitative and qualitative. As far as the factor structure is concerned, there are huge discrepancies in the literature. For instance, in [42] as many as 12 factors were extracted from overall 39 variables. The same research framework and questionnaire used by authors of [43] in different environments yielded only seven factors. In [50], barely two factors were identified for eight variables, whereas the study [38] presents three factors for 23 items. In other than IT sectors, the number of factors and variables also differed substantially. For example, in the field of banking [82] five factors covering 41 items were identified, and in the construction area the work [83] presents six factors and 26 variables, and authors of the study [84] revealed six factors for 29 items. In comparisons with all these studies, our model is rather parsimonious. It utilizes four clearly identified factors with 16 items distributed more or less evenly with the smallest number of variables equal to three and the biggest one amounting to five variables. Additionally, the formal and statistical quality of the model appears, generally, to be among the highest obtained in the project management area. Furthermore, the proposed factor loading structure exhibits a very good validity and reliability, which is not very common in this type of exploratory study.
Comparing our factors from the substantive point of view with other investigations, we found a number of similarities. For example, our organization and people factor is coherent with the management commitment and the team capability factors identified by [42]. Likewise, the work environment factor from this study is consistent with the team and organizational environment factors identified by those authors. Works [43,44,45], that employed the same survey as [42] showed the significance of the team capability factor [45] and management commitment factor [44] which corresponds to our organization and people factor. Twenty variables of the first factor distinguished in [43] are, in general, coherent with three of our factors represented by the following variables: team motivation (Q09), project manager trained in agile methodology (Q24), agile documentation (Q32), agile facility (Q07), and team location (Q06).
Our organization and people factor was consistent with the people and organization component in terms of management commitment, competence and knowledge, and team motivation examined by [50]. Regarding the research carried out by [38], our organization and people factor corresponded partially with the relationship management factor that included management support, organizational culture, competencies and knowledge variables. The risk analysis variables from this study occurred to be consistent with our stakeholder and risk analysis factor. We found similar consistency with the same factor in [82]. In the study of [83], their team power and skill, and organization capacity factors were in line with our organization and people factor described by competencies and knowledge, team motivation, and management commitment elements. Likewise, the competencies and knowledge showed the same consistency with the research presented in [84]. In our preliminary study [55] we extracted six factors. Naturally, we found a number of similarities. For instance, the organization and people factor correlated with team engagement and project management support factors. Overall, as many as 14 out of 16 variables extracted by the current exploratory factor analysis are substantially consistent with the results of the initial study.
The above analysis shows similarities and differences between our factorial structure obtained for IT service projects and results presented by various researchers in other IT areas. The discrepancies concern both the number of factors and the number and range of variables that define these factors. In general, our organization and people and work environment factors were, to some degree, similar to the results from the software development area, however, the risk analysis and stakeholders factor was inconsistent. In comparison to IT systems project success factors, our organization and people component exhibited the biggest coherence whereas the other three factors were considerably different.
The abovementioned inconsistencies may also result from the variety of project types in which the interviewed managers participated. The size and characteristics of the research sample may also be important. Effects such as experience, age, knowledge, and proficiency in using various project management methodologies could have had a significant impact on the obtained results. Presumably, the environment in which project managers functioned, for example, the existing organizational culture or internal procedures, may have had an impact on the final factorial structure. Future studies may focus on testing if the presented model can be verified by the confirmatory factor analysis and search for relations between the project success factors and other characteristics related to project management using, e.g., structural equation modeling.
From the agile approach point of view, we identified significant success components, which are in line with sustainable development goals. Within the agile techniques and change management factor, there is project manager’s agile training, effectiveness, outcomes, and agile documentation variables. In the organization and people factor, we extracted competencies and knowledge, and team’s motivation elements. Our stakeholders and risk analysis factor is consistent with risk management issues strongly linked with the idea of sustainability [85]. Within the sustainable development framework, the risk management is used to limit the harming within four sustainability pillars. Similarly, in our case, the risk analysis at each change (Q41) and control points (Q42) allow to systematically monitor the IT service project process and correct it when necessary to successfully achieve project and sustainability goals. Furthermore, the stakeholders and risk analysis factor drive the attention towards the significant role of stakeholders in achieving success in project management. Additionally, the work environment factor included the agile facility variable.
All four factors show strong relation to the sustainability approach which is especially focused on human and world issues. In particular, the organization and people factor is associated with the human sustainability pillar, whereas the work environment factor corresponds to the environmental sustainability pillar. The following variables are included in the factor loading structure: access to knowledge through training, balanced participation in the projects among men and women, reducing work in progress, removing bottlenecks, creating facilities to work, which are friendly to interpersonal contacts are good examples of embedding sustainable development concepts into the framework of components deciding about the project success. Human sustainable development in IT project management concerns any stakeholders that have an impact on the project and its products. The abovementioned components confirm that agility and sustainability concepts are interrelated and complementary one to another.
7. Conclusions
The presented study is among few that deal specifically with IT service project success factors. It is based on a substantial sample of as many as 155 projects managers working in this field within one international company and being involved in various types of projects for customers from many countries. The paper presents the exploratory factor analysis, which was thoroughly formally examined and the resulting factor loading structure exhibits a high level of validity and reliability.
The conducted research and outcomes of the exploratory factor analysis presented in this study distinguished four main factors influencing the IT service project success. They involved (1) agile techniques and change management, (2) organization and people, (3) stakeholders and risk analysis, and (4) work environment. The results were compared with analogous studies found in the international literature. The detailed analysis provided evidence that our IT service project success factors model is not fully coherent with approaches proposed for other IT areas. Despite some similarities, the differences are considerable and pertain to the number and characteristic features of factors as well as factor components.
The research showed that both traditional and agile management approaches coexist, meet sustainable development goals, and are significant for the successful management in IT service projects where all stakeholders play an important role. It will be beneficial to all stakeholders to engage in developing and managing project solutions that do not harm natural resources and sustain in homeostasis with the surrounding world. Taking into account that any project is temporary in nature, it is important to take sustainable development decisions on an organizational strategic level and to ensure they are transmitted through portfolios, and programs to all projects.
This paper findings fits well into a new trend of thought in project management where sustainability plays a substantial role and project stakeholder interests are taken into account. It occurs that our IT service project success factors and their components cover and overlap with multiple sustainability aspects associated with removing bottlenecks, creating friendly work environments, limiting gender barriers, and extending training opportunities or risk management. Details of this connection were presented in the discussion section. On a more general level, the organization identified here and people factor can be directly connected with the social dimension whereas the stakeholders and risk analysis factor refers to participation, transparency, risk reduction, and political sustainability dimensions.
Author Contributions
Conceptualization, methodology, formal analysis, investigation, resources, data curation, writing—original draft preparation, writing—review and editing, visualization, project administration, R.M. and S.Z; survey building and administering, S.Z.; supervision, funding acquisition, R.M. All authors have read and agreed to the published version of the manuscript.
Funding
This work was partially supported by Ministry of Science and Higher Education (MNiSW, Poland).
Institutional Review Board Statement
Not applicable.
Informed Consent Statement
Informed consent was obtained from all survey participants involved in the study.
Data Availability Statement
The data presented in this study are available upon reasonable request from the corresponding author.
Acknowledgments
We thank three anonymous reviewers for their valuable comments and suggestions that helped to improve the presentation of our research.
Conflicts of Interest
The authors declare no conflict of interest.
Appendix A

Table A1.
Project management success factors investigated in the literature with a specific focus on publications related to the IT industry.
Table A1.
Project management success factors investigated in the literature with a specific focus on publications related to the IT industry.
| No. | All Industries 1 | IT Systems 2 | IT Software 3 | IT Services 4 |
| Q01 | The project received strong executive support (by the Board of Directors or CEO, CFO, CIO, etc.) that was influenced the decision making | |||
| [22,31,40,47,48,86,87,88,89,90,91,92,93,94,95,96,97,98,99,100,101,102,103,104,105,106,107,108,109,110,111,112,113,114,115,116,117,118,119,120] | [39,121,122,123,124,125,126] | [42,44,127,128,129,130] | [51,53,54,131,132,133,134,135,136,137,138] | |
| Q02 | In the project, a cooperative culture which fosters ad-hoc teams driven by the needs of the job at hand was used | |||
| [93,100,109,116,139,140,141,142] | [124,143,144] | [17,42,145] | ||
| Q03 | In the project, a hierarchal culture which has clear divisions of responsibility and authority was employed | |||
| [19,93,100,109,116,139,140,141] | [124,143,144] | [42,146] | ||
| Q04 | In the project, a high value was placed on fluid, face-to-face communication style | |||
| [142,145] | [17,42,43,145] | |||
| Q05 | Agile methodology or its elements were allowed in the project | |||
| [142,145] | [17,42,145] | |||
| Q06 | All team members worked in the same location for ease of communication and casual, constant contact | |||
| [142,145,147,148] | [17,42,145,147,148,149] | |||
| Q07 | The project team worked in a facility with a work environment like one of these: an open space, communal area, ample wall spaces for postings, etc. | |||
| [142,145] | [42,145] | |||
| Q08 | The selected project team members had high technical competence and expertise (problem solving, subject matter) | |||
| [31,89,91,94,95,96,98,100,101,105,108,109,110,113,115,150,151,152] | [121,123,144] | [2,42,45,153,154] | ||
| Q09 | Project team members had great motivation and were committed to executing the project the in best possible way | |||
| [19,31,89,91,94,96,98,100,101,105,108,109,110,115,120,150,155] | [121,144] | [17,42,45,153,154] | [51,53,156,157] | |
| Q10 | Project management was knowledgeable in agile principles and processes | |||
| [142,145] | [2,17,42,45,145] | |||
| Q11 | Project encouraged creative, flexible working environment while taking advantage of mutual interactions among the project’s various parts and steering them toward continuous learning and adaptation | |||
| [93,100,109,116,140,141,142,145] | [124,143,144,158] | [17,42,145] | ||
| Q12 | The project team worked in a coherent, self-organizing teamwork manner, i.e., relying on the collective ability of an autonomous team to solve problems and adapt to changing conditions | |||
| [142,145] | [17,42,145] | |||
| Q13 | Project management had a good relationship with the customer | |||
| [87,145] | [17,42,145] | |||
| Q14 | The project scope and objectives were well-defined | |||
| [22,31,44,46,86,90,91,93,94,95,96,97,99,105,106,108,110,111,113,114,115,116,120,150,152,159,160,161,162,163,164,165,166,167] | [124] | [41,42,43,44,45,128,130,154] | [132] | |
| Q15 | In the project, the initial requirements specification was followed at a very high level, leaving much room for interpretation and adaptation as the project progressed | |||
| [142,145] | [17,42,43,145] | |||
| Q16 | In the project, plans were generally not documented in great detail. Deviations and changes were readily accepted and incorporated into the project plan | |||
| [95,104,113,145,150] | [17,42,145] | |||
| Q17 | The project manager used progress tracking mechanism, e.g., using flexible time-boxing or rapid-pace progress measurement techniques instead of documented milestones or work breakdown structure | |||
| [95,142,145] | [17,42,43,145] | |||
| Q18 | There were instant communication channels between team members in the project | |||
| [31,86,88,92,93,94,95,97,98,101,105,108,109,114,116,120,140,161,163,165,166,167,168] | [121,122,126,158] | [42,128,130,153] | [169] | |
| Q19 | There were instant communication channels between the team and management in the project | |||
| [31,86,88,90,92,93,94,95,97,98,101,105,109,118,120,137,140,161,163,165,166,167,168] | [121,126,158] | [42,130,153] | [160] | |
| Q20 | There were instant communication channels between the team and the customer in the project | |||
| [31,86,87,88,92,93,94,95,97,98,101,105,107,108,109,117,118,120,137,140,161,163,165,166,167,168] | [121,126,158] | [17,42,128,130,153,170] | [54,169] | |
| Q21 | There was a regular working schedule in the project, i.e., 40-h work week, no overtime | |||
| [142,145] | [42,43,145,149] | |||
| Q22 | The customer representative (counterpart) in the project had full authority and knowledge to make decisions, such as approving, disapproving and prioritizing project requirements and changes | |||
| [22,31,89,91,94,96,98,101,102,105,108,109,118,119,120,159,160,166,167] | [125,126] | [42,153] | ||
| Q23 | Project team received the appropriate training, including training on subject matter and agile processes, elements or tools | |||
| [92,94,98,102,107] | [125] | [42] | [51,53,131,134,135,136,156,169] | |
| Q24 | The project manager underwent training in agile methodology | |||
| [94,98,102,107,145] | [125] | [42] | ||
| Q25 | The work in progress was limited and bottlenecks removed for faster throughput | |||
| [142,145,171,172] | [145,173,174] | |||
| Q26 | Continual improvement was implemented, i.e., continuous improvement of project management, service management processes and practices through learning from experience | |||
| [20,87,138,142,145] | [17,145] | [51,53,54,131,133,135,138] | ||
| Q27 | The product owner was determined to ensure that work is prioritized appropriately, and nothing gets overlooked. The product owner is the one who takes the role of the leader, commissions the work of the team, is responsible end-to-end for the determined deliverable or part of the deliverable | |||
| [142,145,147,148] | [17,145,147,148,149] | |||
| Q28 | The equivalent of scrum master was determined as in charge. He or she is the one who supports the product owner and technical teams in delivering the outcomes of the project | |||
| [142,145,147,148] | [17,145,148,149] | |||
| Q29 | The teams worked as cross-functional teams of empowered individuals, involving people from different disciplines, i.e., Unix, Linux, database administrators, storage, mid-range engineers, PM, etc. | |||
| [101,142,145,147,148] | [17,145,147,148,149] | |||
| Q30 | The project focused on the work which was delivered (outcomes) instead of how busy people were (utilization) to increase the throughput and flow | |||
| [87,142,145,147,148,172] | [17,145,147,148,149] | |||
| Q31 | The Change request process was used in the project (i.e., recording, planning, documenting, testing, accepting, categorizing, assessing, authorizing, implementing and reviewing in a controlled manner) | |||
| [19,20,31,90,104] | [158,175] | |||
| Q32 | Throughout the project, a right amount of documentation was maintained, not too focused on producing elaborate documentation as milestones but not ignoring documentation altogether either | |||
| [142,145] | [17,42,145] | |||
| Q33 | In the project working products/deliverables were delivered regularly within short periods of time | |||
| [142,145] | [17,42,45,145,149] | |||
| Q34 | From the customer point of view, the most important features/outcomes were delivered first in the project | |||
| [142,145,147,148] | [17,42,45,145,148,149] | |||
| Q35 | The project type was of variable scope with changing requirements | |||
| [142,145,147,148] | [17,42,44,145,148,149] | |||
| Q36 | The project schedule often changed | |||
| [142,145,147,148,176] | [17,42,43,145,147,148,149] | |||
| Q37 | The project had a controlled schedule | |||
| [92,94,95,97,101,105,106,107,108,111,115,120,151] | [126,158] | [42,43,130,154] | ||
| Q38 | In the project, no multiple, independent teams were working together | |||
| [142,145,147,148,176] | [17,42,145,148,149] | |||
| Q39 | In the project, up-front, detailed cost evaluation was performed and approved | |||
| [44,145,151] | [42,43,44,45] | |||
| Q40 | In the project, risk analysis was evaluated only before the project start | |||
| [19,20,36,40,90,94,105,106,111,159,177] | [126] | |||
| Q41 | In the project, risk analysis was evaluated at each change | |||
| [19,20,36,40,90,94,105,106,111,159,177] | [126] | [129,130] | ||
| Q42 | In the project, risk analysis was evaluated at control points | |||
| [19,20,36,40,90,94,105,106,111,159,177] | [126] | [129,130] | ||
| Q43 | The roles and responsibilities in the project were determined | |||
| [19,20,36,95] | ||||
| Q44 | The impact of stakeholders on the project was analyzed | |||
| [19,24,31,104,105,165,178,179,180] | [26,158,181] | [179] | [133] | |
| Q45 | The internal team/s (provider) and external team/s (customer) worked each other and organized regular and periodic review meetings | |||
| [19,31,95,105,142,145,151] | [17,42,145] | |||
1 Includes all industries without IT, 2 includes IT industry without IT software and IT services, 3 includes IT software, 4 includes IT services.
Appendix B
Table A2.
Factor loadings for initial model with six factors. (PCA, Varimax with Kaiser norm.).
| Variable | Initial Factor Loadings Structure | |||||
|---|---|---|---|---|---|---|
| F1 | F2 | F3 | F4 | F5 | F6 | |
| Q01 | −0.121 | 0.771 | 0.167 | 0.156 | −0.088 | 0.005 |
| Q02 | 0.416 | 0.566 | −0.041 | 0.211 | 0.126 | 0.013 |
| Q03 | 0.220 | 0.670 | 0.039 | 0.074 | 0.161 | 0.102 |
| Q04 | 0.183 | 0.453 | 0.339 | 0.359 | −0.085 | 0.017 |
| Q05 | 0.406 | 0.361 | 0.112 | 0.459 | −0.222 | 0.087 |
| Q06 | −0.050 | 0.215 | 0.029 | 0.708 | 0.160 | −0.050 |
| Q07 | 0.165 | 0.061 | 0.160 | 0.636 | 0.094 | 0.028 |
| Q08 | 0.223 | 0.687 | 0.161 | 0.160 | 0.119 | −0.021 |
| Q09 | 0.255 | 0.765 | 0.122 | 0.146 | 0.117 | −0.184 |
| Q10 | 0.601 | 0.257 | 0.132 | 0.518 | 0.047 | 0.075 |
| Q11 | 0.411 | 0.408 | 0.247 | 0.466 | −0.017 | 0.144 |
| Q12 | 0.367 | 0.470 | 0.186 | 0.410 | −0.022 | 0.086 |
| Q13 | 0.256 | 0.472 | 0.461 | −0.013 | 0.173 | 0.003 |
| Q14 | 0.276 | 0.452 | 0.365 | 0.037 | 0.385 | −0.287 |
| Q15 | 0.180 | −0.088 | 0.174 | 0.360 | 0.091 | 0.449 |
| Q16 | 0.240 | 0.059 | −0.085 | −0.073 | 0.133 | 0.637 |
| Q17 | 0.336 | 0.129 | 0.192 | 0.352 | 0.213 | 0.344 |
| Q18 | 0.454 | 0.373 | 0.272 | −0.124 | 0.100 | 0.247 |
| Q19 | 0.442 | 0.466 | 0.308 | −0.141 | 0.087 | 0.189 |
| Q20 | 0.264 | 0.240 | 0.500 | −0.050 | 0.100 | 0.119 |
| Q21 | 0.119 | 0.169 | −0.074 | 0.046 | 0.647 | 0.026 |
| Q22 | 0.102 | 0.381 | 0.340 | −0.009 | 0.271 | 0.116 |
| Q23 | 0.498 | 0.408 | 0.097 | 0.307 | 0.128 | −0.043 |
| Q24 | 0.729 | −0.092 | 0.109 | 0.100 | 0.013 | 0.068 |
| Q25 | 0.528 | 0.211 | 0.341 | 0.120 | 0.271 | −0.014 |
| Q26 | 0.548 | 0.348 | 0.184 | 0.248 | 0.015 | −0.096 |
| Q27 | 0.360 | 0.209 | 0.311 | 0.284 | 0.154 | 0.040 |
| Q28 | 0.439 | 0.183 | 0.232 | 0.468 | 0.207 | 0.041 |
| Q29 | 0.356 | 0.161 | 0.543 | −0.020 | −0.061 | −0.009 |
| Q30 | 0.476 | 0.285 | 0.073 | −0.011 | 0.282 | 0.093 |
| Q31 | 0.512 | 0.249 | 0.266 | −0.014 | 0.110 | −0.061 |
| Q32 | 0.794 | 0.217 | 0.181 | 0.099 | 0.054 | −0.104 |
| Q33 | 0.247 | 0.351 | 0.183 | 0.171 | 0.335 | 0.153 |
| Q34 | 0.194 | 0.186 | 0.564 | 0.131 | 0.168 | 0.140 |
| Q35 | −0.150 | 0.017 | 0.012 | 0.209 | −0.115 | 0.692 |
| Q36 | −0.231 | −0.249 | −0.174 | −0.169 | −0.139 | 0.554 |
| Q37 | 0.354 | 0.218 | 0.438 | 0.050 | 0.485 | −0.253 |
| Q38 | 0.085 | 0.089 | 0.129 | 0.360 | 0.463 | 0.111 |
| Q39 | 0.160 | 0.070 | 0.253 | 0.204 | 0.524 | −0.194 |
| Q40 | −0.266 | −0.136 | −0.077 | 0.122 | 0.492 | 0.137 |
| Q41 | 0.108 | 0.060 | 0.763 | 0.163 | −0.196 | −0.012 |
| Q42 | 0.120 | 0.081 | 0.766 | 0.198 | 0.056 | −0.039 |
| Q43 | 0.477 | 0.381 | 0.355 | 0.037 | 0.210 | −0.210 |
| Q44 | 0.112 | 0.138 | 0.711 | 0.099 | 0.224 | −0.083 |
| Q45 | 0.125 | 0.330 | 0.533 | −0.060 | 0.104 | 0.012 |
Table A3.
Eigenvalues and variance explained for initial exploratory model including six factors. (PCA, Varimax rotation with Kaiser normalization).
Table A3.
Eigenvalues and variance explained for initial exploratory model including six factors. (PCA, Varimax rotation with Kaiser normalization).
| FactorNo | Eigenvalue | Cumulative Eigenvalue | Variance Explained | Cumulative Variance Explained |
|---|---|---|---|---|
| 1 | 13.8 | 13.8 | 30.7% | 30.7% |
| 2 | 2.5 | 16.4 | 5.7% | 36.3% |
| 3 | 2.1 | 18.5 | 4.7% | 41.0% |
| 4 | 1.9 | 20.3 | 4.1% | 45.2% |
| 5 | 1.8 | 22.1 | 3.9% | 49.1% |
| 6 | 1.7 | 23.7 | 3.7% | 52.8% |
Appendix C
Table A4.
Eigenvalues and variance explained for final, refined exploratory model including four factors. (PCA as the extraction method, Varimax rotation with Kaiser normalization).
Table A4.
Eigenvalues and variance explained for final, refined exploratory model including four factors. (PCA as the extraction method, Varimax rotation with Kaiser normalization).
| Factor | Eigenvalue | Cumulative Eigenvalue | Variance Explained | Cumulative Variance Explained |
|---|---|---|---|---|
| F1 | 5.206 | 5.21 | 32.54% | 32.5% |
| F2 | 1.708 | 6.91 | 10.67% | 43.2% |
| F3 | 1.525 | 8.44 | 9.53% | 52.7% |
| F4 | 1.305 | 9.74 | 8.16% | 60.9% |
| F5 | 0.949 | 10.69 | 5.93% | 66.8% |
| F6 | 0.753 | 11.45 | 4.71% | 71.5% |
| F7 | 0.723 | 12.17 | 4.52% | 76.1% |
| F8 | 0.596 | 12.77 | 3.73% | 79.8% |
| F9 | 0.566 | 13.33 | 3.54% | 83.3% |
| F10 | 0.530 | 13.86 | 3.31% | 86.6% |
| F11 | 0.493 | 14.35 | 3.08% | 89.7% |
| F12 | 0.415 | 14.77 | 2.59% | 92.3% |
| F13 | 0.352 | 15.12 | 2.20% | 94.5% |
| F14 | 0.325 | 15.45 | 2.03% | 96.5% |
| F15 | 0.292 | 15.74 | 1.83% | 98.4% |
| F16 | 0.261 | 16.00 | 1.63% | 100% |
Table A5.
Anti-image correlation matrix with measures of sampling adequacy for all variables placed on the diagonal for the final, refined exploratory model including four factors. (PCA, Varimax rotation with Kaiser normalization).
Table A5.
Anti-image correlation matrix with measures of sampling adequacy for all variables placed on the diagonal for the final, refined exploratory model including four factors. (PCA, Varimax rotation with Kaiser normalization).
| Q24 | Q25 | Q30 | Q31 | Q32 | Q01 | Q03 | Q08 | Q09 | Q34 | Q41 | Q42 | Q44 | Q06 | Q07 | Q38 | |
|---|---|---|---|---|---|---|---|---|---|---|---|---|---|---|---|---|
| Q24 | 0.81 | |||||||||||||||
| Q25 | −0.12 | 0.91 | ||||||||||||||
| Q30 | −0.13 | −0.05 | 0.85 | |||||||||||||
| Q31 | −0.05 | 0.00 | −0.24 | 0.86 | ||||||||||||
| Q32 | −0.26 | −0.29 | −0.10 | −0.28 | 0.86 | |||||||||||
| Q01 | 0.09 | −0.01 | −0.01 | 0.01 | 0.15 | 0.83 | ||||||||||
| Q03 | −0.11 | −0.01 | 0.13 | −0.10 | −0.07 | −0.30 | 0.83 | |||||||||
| Q08 | 0.09 | −0.01 | −0.19 | −0.08 | 0.01 | −0.10 | −0.15 | 0.85 | ||||||||
| Q09 | 0.01 | −0.09 | −0.10 | 0.05 | −0.15 | −0.26 | −0.25 | −0.40 | 0.84 | |||||||
| Q34 | 0.01 | −0.17 | −0.09 | 0.01 | −0.04 | 0.01 | −0.06 | −0.06 | 0.01 | 0.93 | ||||||
| Q41 | −0.19 | 0.06 | 0.14 | −0.16 | 0.01 | −0.09 | 0.09 | −0.17 | 0.09 | −0.13 | 0.77 | |||||
| Q42 | 0.05 | −0.11 | 0.09 | 0.03 | −0.03 | −0.03 | 0.05 | −0.05 | 0.00 | −0.14 | −0.43 | 0.80 | ||||
| Q44 | 0.08 | −0.08 | −0.13 | −0.07 | 0.01 | −0.07 | 0.00 | 0.21 | −0.13 | −0.09 | −0.13 | −0.39 | 0.83 | |||
| Q06 | 0.12 | −0.01 | 0.04 | −0.08 | 0.01 | −0.15 | 0.18 | −0.06 | −0.10 | 0.02 | 0.02 | −0.01 | 0.04 | 0.68 | ||
| Q07 | −0.11 | −0.10 | 0.02 | 0.16 | −0.07 | 0.06 | −0.14 | −0.09 | 0.09 | −0.05 | −0.09 | 0.03 | −0.04 | −0.43 | 0.74 | |
| Q38 | −0.08 | −0.08 | −0.09 | −0.05 | 0.05 | 0.04 | −0.10 | −0.10 | 0.10 | 0.07 | 0.14 | −0.11 | −0.15 | −0.26 | −0.01 | 0.79 |
Table A6.
Final, refined exploratory model including four factors. (PCA, Varimax rotation with Kaiser normalization).
Table A6.
Final, refined exploratory model including four factors. (PCA, Varimax rotation with Kaiser normalization).
| Variable | Refined Factor Loadings Structure | |||
|---|---|---|---|---|
| F1 | F2 | F3 | F4 | |
| Q24 | 0.728 | −0.068 | 0.111 | 0.065 |
| Q25 | 0.572 | 0.190 | 0.340 | 0.255 |
| Q30 | 0.633 | 0.285 | 0.018 | 0.084 |
| Q31 | 0.631 | 0.232 | 0.210 | 0.021 |
| Q32 | 0.783 | 0.158 | 0.179 | 0.112 |
| Q01 | −0.118 | 0.798 | 0.210 | 0.098 |
| Q03 | 0.268 | 0.729 | 0.046 | 0.064 |
| Q08 | 0.263 | 0.724 | 0.141 | 0.223 |
| Q09 | 0.271 | 0.802 | 0.129 | 0.114 |
| Q34 | 0.289 | 0.194 | 0.581 | 0.066 |
| Q41 | 0.117 | 0.076 | 0.801 | 0.046 |
| Q42 | 0.092 | 0.093 | 0.862 | 0.136 |
| Q44 | 0.150 | 0.123 | 0.743 | 0.132 |
| Q06 | −0.061 | 0.189 | 0.061 | 0.828 |
| Q07 | 0.130 | 0.076 | 0.141 | 0.746 |
| Q38 | 0.219 | 0.082 | 0.097 | 0.595 |
References
- Silvius, G. Sustainability as a New School of Thought in Project Management. J. Clean. Prod. 2017, 166, 1479–1493. [Google Scholar] [CrossRef]
- The Standish Group. CHAOS Report 2015; The Standish Group International, Inc.: Boston, MA, USA, 2015. [Google Scholar]
- Varajão, J.; Magalhães, L.; Freitas, L.; Ribeiro, P.; Ramos, J. Implementing Success Management in an IT Project. Procedia Comput. Sci. 2018, 138, 891–898. [Google Scholar] [CrossRef]
- Gruen, R.L.; Elliott, J.H.; Nolan, M.L.; Lawton, P.D.; Parkhill, A.; McLaren, C.J.; Lavis, J.N. Sustainability Science: An Integrated Approach for Health-Programme Planning. Lancet 2008, 372, 1579–1589. [Google Scholar] [CrossRef] [Green Version]
- Silvius, A.J.G.; Schipper, R.P.J. Sustainability in Project Management: A Literature Review and Impact Analysis. Soc. Bus. 2014, 4, 63–96. [Google Scholar] [CrossRef]
- Allen, T.F.H.; Hoekstra, T.W. Toward a Definition of Sustainability; United States Department of Agriculture: Flagstaff, AZ, USA, 12 June 1993; p. 10.
- Gareis, R.; Huemann, M.; Martinuzzi, A. Project Management & Sustainable Development Principles; Project Management Institute: Newton Square, PA, USA, 2013. [Google Scholar]
- Martens, M.L.; Carvalho, M.M. Sustainability and Success Variables in the Project Management Context: An Expert Panel. Proj. Manag. J. 2016, 47, 24–43. [Google Scholar] [CrossRef]
- Lock, I.; Seele, P. Theorizing Stakeholders of Sustainability in the Digital Age. Sustain. Sci. 2017, 12, 235–245. [Google Scholar] [CrossRef]
- Eskerod, P.; Huemann, M. Sustainable Development and Project Stakeholder Management: What Standards Say. Int. J. Manag. Proj. Bus. 2013, 6, 36–50. [Google Scholar] [CrossRef]
- Soanes, C. (Ed.) Oxford English Dictionary; Oxford University Press: New York, USA, 2002. [Google Scholar]
- WCED. Report of the World Commission on Environment and Development: Our Common Future; World Commission on Environment and Development: Oslo, Norway, 1987. [Google Scholar]
- Aarseth, W.; Ahola, T.; Aaltonen, K.; Økland, A.; Andersen, B. Project Sustainability Strategies: A Systematic Literature Review. Int. J. Proj. Manag. 2017, 35, 1071–1083. [Google Scholar] [CrossRef]
- Goodland, R. Sustainability: Human, Social, Economic and Environmental. Soc. Sci. 2002, 6, 220–225. [Google Scholar]
- Repetto, R. (Ed.) The Global Possible. Resources, Development, and the New Century; Yale University Press: New Haven, CT, USA, 1985; ISBN 978-0-300-03505-6. [Google Scholar]
- Obradovic, V.; Todorovic, M.; Bushuyev, S. Sustainability and Agility in Project Management: Contradictory or Complementary? In Proceedings of the IEEE 13th International Scientific and Technical Conference on Computer Science and Information Technologies, CSIT 2018, Lviv, Ukraine, 11–14 September 2018; Volume 2, pp. 1–5. [Google Scholar]
- Beck, K.; Beedle, M.; van Bennekum, A.; Cockburn, A.; Fowler, M.; Grenning, J.; Highsmith, J.; Hunt, A.; Jeffries, R.; Kern, J.; et al. Manifesto for Agile Software Development. Available online: http://agilemanifesto.org/ (accessed on 30 December 2020).
- Keeys, L.A.; Huemann, M. Project Benefits Co-Creation: Shaping Sustainable Development Benefits. Int. J. Proj. Manag. 2017, 35, 1196–1212. [Google Scholar] [CrossRef]
- PMI. PMBOK® Guide, 6th ed.; Project Management Institute: Newtown Square, PA, USA, 2017. [Google Scholar]
- Cooke-Davies, T. The “Real” Success Factors on Projects. Int. J. Proj. Manag. 2002, 20. [Google Scholar] [CrossRef]
- De Wit, A. Measurement of Project Success. Int. J. Proj. Manag. 1988, 6, 164–170. [Google Scholar] [CrossRef]
- Munns, A.; Bjeirmi, B. The Role of Project Management in Achieving Project Success. Int. J. Proj. Manag. 1996, 14, 81–87. [Google Scholar] [CrossRef]
- Ika, L.A. Project Success as a Topic in Project Management Journals. Proj. Manag. J. 2009, 40, 6–19. [Google Scholar] [CrossRef]
- Davis, K. An Empirical Investigation into Different Stakeholder Groups Perception of Project Success. Int. J. Proj. Manag. 2017, 35, 604–617. [Google Scholar] [CrossRef] [Green Version]
- Gładysz, B.; Kuchta, D. Stakeholder Communication Impact on the Success of IT Project—Fuzzy Approach. In Proceedings of the Intelligent and Fuzzy Techniques in Big Data Analytics and Decision Making, Istanbul, Turkey, 23–25 July 2019; Springer International Publishing: Cham, Switzerland, 2020; pp. 583–588. [Google Scholar]
- Gładysz, B.; Kuchta, D. Dependency Beetween IT Project Success and the Communication with Project Stakeholders—Intuitionistic Fuzzy Sets Approach. J. Intell. Fuzzy Syst. 2020, 39, 6377–6389. [Google Scholar] [CrossRef]
- Skalik, J.; Strzelczyk, A. Key success factors in the management of IT project (in Polish: Kluczowe czynniki sukcesu w zarządzaniu projektami informatycznymi). Zarządzanie Finanse 2013, 11, 265–276. [Google Scholar]
- Baker, B.N.; Murphy, D.C.; Fisher, D. Factors Affecting Project Success. In Project Management Handbook; Cleland, D.I., King, W., Eds.; van Nostrand Reinhold: New York, NY, USA, 1974; pp. 902–919. [Google Scholar]
- Rockart, J.F. Chief Executives Define Their Own Data Needs. Harv. Bus. Rev. 1979, 57, 81–93. [Google Scholar] [PubMed]
- Bullen, C.V.; Rockart, J.F. A Primer on the Critical Success Factors; CISR: Cambridge, MA, USA, 1981; p. 75. [Google Scholar]
- Pinto, J.K.; Slevin, D.P. Critical Factors in Successful Project Implementation. IEEE Trans. Eng. Manag. 1987, EM-34, 22–27. [Google Scholar] [CrossRef]
- Law Insider. Definition of IT System. Available online: https://www.lawinsider.com/dictionary/it-system (accessed on 3 April 2021).
- Gartner Information Technology Glossary. Definition of Software Development. Available online: https://www.gartner.com/en/information-technology/glossary/software-development (accessed on 3 April 2021).
- Gartner Information Technology Glossary. Definition of IT Services. Available online: https://www.gartner.com/en/information-technology/glossary/it-services (accessed on 3 April 2021).
- Besner, C.; Hobbs, J.B. An Empirical Investigation of Project Management Practice: In Reality, Which Tools do Practitioners Use? In Proceedings of the PMI® Research Conference, Innovations, London, UK, 11–14 July 2004; Project Management Institute: Newtown Square, PA, USA, 2004. [Google Scholar]
- Besner, C.; Hobbs, B. The Perceived Value and Potential Contribution of Project Management Practices to Project Success. (Author Abstract). Proj. Manag. J. 2006, 37, 37–48. [Google Scholar] [CrossRef] [Green Version]
- Doherty, M. Using Organizational, Coordination, and Contingency Theories to Examine Project Manager Insights on Agile and Traditional Success Factors for Information Technology Projects. Ph.D. Thesis, Walden University, Minneapolis, MI, USA, 2011. [Google Scholar]
- Baker, R. A Synthesis and Survey of Critical Success Factors for Computer Technology Projects. Ph.D. Thesis, Walden University, Minneapolis, MI, USA, 2012. [Google Scholar]
- Nah, F.F.-H.; Zuckweiler, K.M.; Lee-Shang Lau, J. ERP Implementation: Chief Information Officers’ Perceptions of Critical Success Factors. Int. J. Hum.-Comput. Interact. 2003, 16, 5–22. [Google Scholar] [CrossRef]
- White, D.; Fortune, J. Current Practice in Project Management—An Empirical Study. Int. J. Proj. Manag. 2002, 20, 1–11. [Google Scholar] [CrossRef]
- Berntsson-Svensson, R.; Aurum, A. Successful Software Project and Products: An Empirical Investigation; ACM: New York, NY, USA, 2006; Volume 2006, pp. 144–153. [Google Scholar]
- Chow, T.; Cao, D.-B. A Survey Study of Critical Success Factors in Agile Software Projects. J. Syst. Softw. 2008, 81, 961–971. [Google Scholar] [CrossRef]
- Stankovic, D.; Nikolic, V.; Djordjevic, M.; Cao, D.-B. A Survey Study of Critical Success Factors in Agile Software Projects in Former Yugoslavia IT Companies. J. Syst. Softw. 2013, 86, 1663–1678. [Google Scholar] [CrossRef]
- Brown, G. An Examination of Critical Success Factors of an Agile Project. Ph.D. Thesis, Capella University, Minneapolis, MI, USA, 2015. [Google Scholar]
- Stanberry, L. Critical Success Factors for Large and Distributed Agile Software Development Projects Using Scrum in U.S.-Based Global Companies. Ph.D. Thesis, Capella University, Minneapolis, MI, USA, 2018. [Google Scholar]
- Carroll, C.F. IT Success and Failure—the Standish Group CHAOS Report Success Factors. Available online: https://www.cafe-encounter.net/p1183/it-success-and-failure-the-chaos-report-factors (accessed on 20 February 2021).
- The Standish Group. CHAOS Report 1994; The Standish Group International, Inc.: Boston, MA, USA, 1995. [Google Scholar]
- The Standish Group. CHAOS Summary 2009; The 10 Laws of CHAOS; The Standish Group International, Inc.: Boston, MA, USA, 2009. [Google Scholar]
- Williams, C.; Ness, L.; Lind, M.; Dutfield, S. A Quantitative Comparative and Correlational Study of Critical Success Factors for Information Technology Projects. Ph.D. Thesis, Capella University, Minneapolis, MI, USA, 2013. [Google Scholar]
- Aldahmash, A.; Gravell, A.; Howard, Y. Using Factor Analysis to Study the Critical Success Factors of Agile Software Development. J. Softw. 2017, 12, 957–963. [Google Scholar] [CrossRef] [Green Version]
- Hochstein, A.; Brenner, W. Implementation of Service-Oriented IT Management: An Empirical Study on Swiss IT Organizations. In Proceedings of the International Conference on Service Systems and Service Management, Troyes, France, 25–27 October 2006; Volume 1, pp. 91–97. [Google Scholar]
- Hochstein, A.; Tamm, G.; Brenner, W. Service Oriented IT Management: Benefit, Cost and Success Factors. In Proceedings of the 13th European Conference on Information Systems, Information Systems in a Rapidly Changing Economy, ECIS 2005, Regensburg, Germany, 26–28 May 2005; p. 12. [Google Scholar]
- Cater-Steel, A.; Toleman, M.; Tan, W.G. Transforming IT Service Management—The ITIL Impact. In Proceedings of the ACIS 2006, 17th Australasian Conference on Information Systems, Adelaide, Australia, 3–5 December 2006. [Google Scholar]
- Blijleven, V.; Gong, Y.; Mehrsai, A.; Koelemeijer, K. Critical Success Factors for Lean Implementation in IT Outsourcing Relationships: A Multiple Case Study. Inf. Technol. People 2019, 32, 715–730. [Google Scholar] [CrossRef]
- Zaleski, S.; Michalski, R. Success factors of managing IT services projects (in Polish: Czynniki sukcesu zarządzania projektami usług IT). Przegląd Organ. 2020, 8, 29–36. [Google Scholar] [CrossRef]
- Patil, V.H.; Singh, S.N.; Mishra, S.; Donavan, D.T. Parallel Analysis Engine to Aid in Determining Number of Factors to Retain Using R; Instruction and Research Server, University of Kansas: Lawrence, KS, USA, 2007. [Google Scholar]
- Podsakoff, P.; MacKenzie, S.; Lee, J.-Y.; Podsakoff, N. Common Method Biases in Behavioral Research: A Critical Review of the Literature and Recommended Remedies. J. Appl. Psychol. 2003, 88, 879–903. [Google Scholar] [CrossRef] [PubMed]
- Kaiser, H.F. The Application of Electronic Computers to Factor Analysis. Educ. Psychol. Meas. 1960, 20, 141–151. [Google Scholar] [CrossRef]
- Cattell, R.B. The Scree Test for The Number Of Factors. Multivar. Behav. Res. 1966, 1, 245–276. [Google Scholar] [CrossRef]
- Horn, J.L. A Rationale and Test for the Number of Factors in Factor Analysis. Psychometrika 1965, 30, 179–185. [Google Scholar] [CrossRef] [PubMed]
- Streiner, D.L. Figuring Out Factors: The Use and Misuse of Factor Analysis. Can. J. Psychiatry 1994, 39, 135–140. [Google Scholar] [CrossRef]
- Lei, M.; Lomax, R.G. The Effect of Varying Degrees of Nonnormality in Structural Equation Modeling. Struct. Equ. Model. Multidiscip. J. 2005, 12, 1–27. [Google Scholar] [CrossRef]
- Kaiser, H.F. A Second Generation Little Jiffy. Psychometrika 1970, 35, 401–415. [Google Scholar] [CrossRef]
- Kaiser, H.F.; Rice, J. Little Jiffy, Mark Iv. Educ. Psychol. Meas. 1974, 34, 111–117. [Google Scholar] [CrossRef]
- Bartlett, M.S. The Effect of Standardization on a Χ2 Approximation in Factor Analysis. Biometrika 1951, 38, 337–344. [Google Scholar] [CrossRef]
- Tabachnick, B.G.; Fidell, L.S. Using Multivariate Statistics, 4th ed.; Allyn & Bacon: Boston, MA, USA, 2000; ISBN 978-0-321-05677-1. [Google Scholar]
- Field, A. Discovering Statistics Using IBM SPSS Statistics, 4th ed.; SAGE Publications Ltd.: Thousand Oaks, CA, USA, 2013; ISBN 978-93-5150-082-7. [Google Scholar]
- Field, A. Discovering Statistics Using IBM SPSS Statistics: North. American Edition, 5th ed.; SAGE Publications Ltd.: Thousand Oaks, CA, USA, 2017; ISBN 978-1-5264-3656-6. [Google Scholar]
- MacCallum, R.C.; Widaman, K.F.; Zhang, S.; Hong, S. Sample Size in Factor Analysis. Psychol. Methods 1999, 4, 84–99. [Google Scholar] [CrossRef]
- Child, D. The Essentials of Factor Analysis; A&C Black: Edinburgh, UK, 2006; ISBN 978-0-8264-8000-2. [Google Scholar]
- Hair, J.F.; Tatham, R.L.; Anderson, R.E.; Black, W. Multivariate Data Analysis, 5th ed.; Prentice Hall: Upper Saddle River, NJ, USA, 1998; ISBN 978-0-13-894858-0. [Google Scholar]
- Guadagnoli, E.; Velicer, W.F. Relation of Sample Size to the Stability of Component Patterns. Psychol. Bull. 1988, 103, 265–275. [Google Scholar] [CrossRef] [PubMed]
- Hair, J.; Black, W.; Babin, B.; Anderson, R. Multivariate Data Analysis; Prentice Hall: London, UK, 2009. [Google Scholar]
- Hair, J.F.; Anderson, R.E.; Tatham, R.L.; Black, W.C. Multivariate Data Analysis: With Readings, 4th ed.; Pearson College Div: Englewood Cliffs, NJ, USA, 1995; ISBN 978-0-13-913310-7. [Google Scholar]
- Yoo, Y.; Alavi, M. Media and Group Cohesion: Relative Influences on Social Presence, Task Participation, and Group Consensus. MIS Q. 2001, 25, 371–390. [Google Scholar] [CrossRef]
- Fornell, C.; Larcker, D.F. Evaluating Structural Equation Models with Unobservable Variables and Measurement Error. J. Mark. Res. 1981, 18, 39–50. [Google Scholar] [CrossRef]
- Cronbach, L.J. Coefficient Alpha and the Internal Structure of Tests. Psychometrika 1951, 16, 297–334. [Google Scholar] [CrossRef] [Green Version]
- Jöreskog, K.G. Statistical Analysis of Sets of Congeneric Tests. Psychometrika 1971, 36, 109–133. [Google Scholar] [CrossRef]
- Werts, C.E.; Linn, R.L.; Jöreskog, K.G. Intraclass Reliability Estimates: Testing Structural Assumptions. Educ. Psychol. Meas. 1974, 34, 25–33. [Google Scholar] [CrossRef]
- Chin, W.W. The partial least squares approach for structural equation modeling. In Modern Methods for Business Research; Methodology for Business and Management; Lawrence Erlbaum Associates Publishers: Mahwah, NJ, USA, 1998; pp. 295–336. ISBN 978-0-8058-2677-7. [Google Scholar]
- Kline, P. A Handbook of Test Construction: Introduction to Psychometric Design; Methuen: London, UK, 1986; ISBN 978-0-416-39430-6. [Google Scholar]
- Ika, L.A.; Diallo, A.; Thuillier, D. Critical Success Factors for World Bank Projects: An Empirical Investigation. Int. J. Proj. Manag. 2012, 30, 105–116. [Google Scholar] [CrossRef]
- Alashwal, A.M.; Fareed, N.F.; Al-Obaidi, K.M. Determining Success Criteria and Success Factors for International Construction Projects for Malaysian Contractors. Constr. Econ. Build. 2017, 17, 62–80. [Google Scholar] [CrossRef] [Green Version]
- Xu, P.; Chan, E.H.-W.; Qian, Q.K. Success Factors of Energy Performance Contracting (EPC) for Sustainable Building Energy Efficiency Retrofit (BEER) of Hotel Buildings in China. Energy Policy 2011, 39, 7389–7398. [Google Scholar] [CrossRef]
- Schulte, J.; Hallstedt, S.I. Company Risk Management in Light of the Sustainability Transition. Sustainability 2018, 10, 4137. [Google Scholar] [CrossRef] [Green Version]
- Andersen, E.S.; Dyrhaug, Q.X.; Jessen, S.A. Evaluation of Chinese Projects and Comparison with Norwegian Projects. Int. J. Proj. Manag. 2002, 20. [Google Scholar] [CrossRef]
- Appelbaum, S.H.; Steed, A.J. The Critical Success Factors in the Client-Consulting Relationship. J. Manag. Dev. 2005, 24, 68–93. [Google Scholar] [CrossRef]
- Avots, I. Why Does Project Management Fail? Calif. Manage. Rev. 1969, 12, 77–82. [Google Scholar] [CrossRef]
- Belassi, W.; Tukel, O.I. A New Framework for Determining Critical Success/Failure Factors in Projects. Int. J. Proj. Manag. 1996, 14. [Google Scholar] [CrossRef]
- Boadle, M. Project Management 1 Assignment One Project Failure and Success Factors. Available online: http://citeseerx.ist.psu.edu/viewdoc/download?doi=10.1.1.199.5692&rep=rep1&type=pdf (accessed on 28 October 2020).
- Caldeira, M.M.; Ward, J.M. Understanding the Successful Adoption and Use of IS/IT in SMEs: An Explanation from Portuguese Manufacturing Industries. Inf. Syst. J. 2002, 12, 121–152. [Google Scholar] [CrossRef]
- Cleland, D.I.; Cleland, D.L.; King, W.R. Systems Analysis and Project Management; McGraw-Hill: New York, NY, USA, 1983. [Google Scholar]
- Couillard, J. The Role of Project Risk in Determining Project Management Approach. Proj. Manag. J. 1995, 26, 3–15. [Google Scholar]
- Dvir, D.; Lipovetsky, S.; Shenhar, A.; Tishler, A. In Search of Project Classification: A Non-Universal Approach to Project Success Factors. Res. Policy 1998, 27, 915–935. [Google Scholar] [CrossRef]
- Frese, R.; Sauter, V. Project Success and Failure: What is Success, What is Failure, and How Can You Improve Your Odds for Success? Available online: http://www.umsl.edu/~sauterv/analysis/6840_f03_papers/frese/ (accessed on 30 December 2020).
- Jang, Y.; Lee, J. Factors Influencing the Success of Management Consulting Projects. Int. J. Proj. Manag. 1998, 16, 67–72. [Google Scholar] [CrossRef]
- Kasser, J.E.; Williams, V.R. What Do You Mean You Can’t Tell Me If My Project Is in Trouble? In Proceedings of the First European Conference on Software Metrics (FESMA 98), Antwerp, Belgium, 6–8 May 1998. [Google Scholar]
- Magal, S.R.; Carr, H.H.; Watson, H.J. Critical Success Factors for Information Center Managers. MIS Q. Manag. Inf. Syst. 1988, 12, 413–425. [Google Scholar] [CrossRef] [Green Version]
- Martin, C.C. Project Management: How to Make It Work: By Charles C. Martin AMACOM, 1976. Bus. Horiz. 1977, 20, 93–95. [Google Scholar] [CrossRef]
- Martinez, E.V. Avoiding Large-Scale Information Systems Project Failure: The Importance of Fundamentals. Proj. Manag. J. 1994, 25. [Google Scholar]
- McComb, D.; Smith, J.Y. System Project Failure: The Heuristics of Risk. J. Inf. Syst. Manag. 1991, 8, 25–34. [Google Scholar] [CrossRef]
- McCormack, S. The Lemon Factor. The Engineer, 22–24 June 1997. [Google Scholar]
- McGolpin, P.; Ward, J. Factors Influencing the Success of Strategic Information Systems. In Information Systems: An Emerging Discipline? Mingers, J., Stowell, F., Eds.; McGraw-Hill: London, UK, 1997; pp. 287–327. [Google Scholar]
- Mengesha, W. Performances for Public Construction Projects in Developing Countries: Federal Road & Educational Building Projects in Ethiopia. Ph.D. Thesis, Norwegian University of Science and Technology, Trondheim, Norway, 2004. [Google Scholar]
- Morris, P. Preconditions of Success and Failure in Major Projects; Templeton College Oxford Centre for Management Studies: Oxford, UK, 1986; ISBN 978-0-9503569-3-8. [Google Scholar]
- Morris, P.W.G.; Hough, G.H. The Anatomy of Major Projects: A Study of the Reality of Project Management; John Wiley and Sons: Hoboken, NJ, USA, 1987. [Google Scholar]
- Pinto, J.K.; Kharbanda, O.P. How to Fail in Project Management (without Really Trying). Bus. Horiz. 1996, 39, 45–53. [Google Scholar] [CrossRef]
- Pinto, J.K.; Mantel, S.J. The Causes of Project Failure. IEEE Trans. Eng. Manag. 1990, 37, 269–276. [Google Scholar] [CrossRef] [Green Version]
- Pollalis, Y.A.; Frieze, I.H. A New Look at Critical Success Factors in IT. (Information Technology). Inf. Strategy Exec. J. 1993, 10, 24. [Google Scholar]
- Poon, P.; Wagner, C. Critical Success Factors Revisited: Success and Failure Cases of Information Systems for Senior Executives. Decis. Support. Syst. 2001, 30, 393–418. [Google Scholar] [CrossRef]
- Selin, G.; Selin, M. Reasons for Project Management Success and Failure in Multiproject Environment. In Proceedings of the INTERNET World Congress, Oslo, Norway, 22–25 July 1994; pp. 513–519. [Google Scholar]
- Stoddart-Stones, R. Development of Project Management Systems for Major Projects. Int. J. Proj. Manag. 1988, 6, 34–38. [Google Scholar] [CrossRef]
- Sturdivant, J. The CNSI Requirement Analysis Process. Available online: https://www.cns-inc.com (accessed on 6 May 2006).
- Tan, R.R. Success Criteria and Success Factors for External Technology Transfer Projects. Proj. Manag. J. 1996, 27, 45–56. [Google Scholar]
- Tennant, D.V. Avoiding Failure in Project Management, Advances in Instrumentation and Control; American Technical Publishers Ltd.: Orland Park, IL, USA, 1993; pp. 675–686. [Google Scholar]
- Thite, M. Leadership Styles in Information Technology Projects. Int. J. Proj. Manag. 2000, 18, 235–241. [Google Scholar] [CrossRef]
- Tukel, O.I.; Rom, W.O. Analysis of the Characteristics of Projects in Diverse Industries. J. Oper. Manag. 1998, 16, 43–61. [Google Scholar] [CrossRef]
- Turner, R. Handbook of Project-Based Management, 2nd ed.; McGraw-Hill Education: London, UK, 1999. [Google Scholar]
- Wastell, D.; Newman, M. Information System Design, Stress and Organisational Change in the Ambulance Services: A Tale of Two Cities. Account. Manag. Inf. Technol. 1996, 6, 283–300. [Google Scholar] [CrossRef]
- Westerveld, E. The Project Excellence Model®: Linking Success Criteria and Critical Success Factors. Int. J. Proj. Manag. 2003, 21, 411–418. [Google Scholar] [CrossRef]
- Cash, C.; Fox, R. Elements of Successful Project Management. J. Syst. Manag. 1992, 43, 10. [Google Scholar]
- Gingnell, L.; Franke, U.; Lagerström, R.; Ericsson, E.; Lilliesköld, J. Quantifying Success Factors for IT Projects-An Expert-Based Bayesian Model. Inf. Syst. Manag. 2014, 31, 21–36. [Google Scholar] [CrossRef]
- Pecherskaya, E.P.; Kamaletdinov, Y.A.; Zhabin, A.P.; Grishina, P.Y. Key Success Factors Analysis in the Context of Enterprise Resourcesplanning Systems Projects Implementation. Mod. Appl. Sci. 2015, 9, p133. [Google Scholar] [CrossRef] [Green Version]
- Taylor, A. IT Projects: Sink or Swim. Comput. Bull. 2000, 42. [Google Scholar] [CrossRef]
- Yap, C.; Soh, C.; Raman, K. Information Systems Success Factors in Small Business. Omega 1992, 20, 597–609. [Google Scholar] [CrossRef]
- Yeo, K.T. Critical Failure Factors in Information System Projects. Int. J. Proj. Manag. 2002, 20, 241–246. [Google Scholar] [CrossRef]
- Chiyangwa, T.B.; Mnkandla, E. Modelling the Critical Success Factors of Agile Software Development Projects in South Africa. SA J. Inf. Manag. 2017, 19. [Google Scholar] [CrossRef] [Green Version]
- Turner, J.R. Managing Web Projects: The Management of Large Projects and Programmes for Web-Space Delivery; Gower Pub Co.: Aldershot, UK; Burlington, VT, USA, 2004; ISBN 978-0-566-08567-3. [Google Scholar]
- Whittaker, B. What Went Wrong? Unsuccessful Information Technology Projects. Inf. Manag. Comput. Secur. 1999, 7, 23–30. [Google Scholar] [CrossRef]
- Williams, B.R. Why Do Software Projects Fail? GEC J. Res. 1995, 12, 13–16. [Google Scholar]
- Diirr, T.; Santos, G. Improvement of IT Service Processes: A Study of Critical Success Factors. J. Softw. Eng. Res. Dev. 2014, 2, 1–21. [Google Scholar] [CrossRef] [Green Version]
- Fjermestad, J.; Saitta, J.A. A Strategic Management Framework for IT Outsourcing: A Review of the Literature and the Development of a Success Factors Model. J. Inf. Technol. Cases Appl. 2005, 7, 42–60. [Google Scholar] [CrossRef]
- Huang, S.-J.; Wu, M.-S.; Chen, L.-W. Critical Success Factors in Aligning IT and Business Objectives: A Delphi Study. Total Qual. Manag. Bus. Excell. 2013, 24, 1219–1240. [Google Scholar] [CrossRef]
- Iden, J.; Eikebrokk, T.R. Implementing IT Service Management: A Systematic Literature Review. Int. J. Inf. Manag. 2013, 33, 512–523. [Google Scholar] [CrossRef] [Green Version]
- Mohammadi, M.M.; Ravasan, A.Z.; Hamidi, H. Investigating Critical Success Factors in Implementing ITIL Framework: The Case of a Developing Country. Int. J. Stand. Res. 2015, 13, 74–91. [Google Scholar] [CrossRef]
- Pollard, C.; Cater-Steel, A. Justifications, Strategies, and Critical Success Factors in Successful ITIL Implementations in U.S. and Australian Companies: An Exploratory Study. Inf. Syst. Manag. 2009, 26, 164–175. [Google Scholar] [CrossRef] [Green Version]
- Tan, W.-G.; Cater-Steel, A.; Toleman, M. Implementing It Service Management: A Case Study Focussing on Critical Success Factors. J. Comput. Inf. Syst. 2009, 50, 1–12. [Google Scholar]
- Zhang, Y.; Zhang, J.; Chen, J. Critical Success Factors in IT Service Management Implementation: People, Process, and Technology Perspectives. In Proceedings of the International Conference on Service Sciences (ICSS), Shenzhen, China, 11–13 April 2013; pp. 64–68. [Google Scholar]
- Drobietz, M.; Poth, A. A New Approach: Not Agile vs. Traditional QM but Applying the Best of Both [in:] Systems, Software and Services Process Improvement. In Proceedings of the 24th European Conference, EuroSPI 2017, Ostrava, Czech Republic, 6–8 September 2017; Springer International Publishing: Cham, Switzerland, 2017; Volume 748, pp. 486–494. [Google Scholar]
- Gowan, J.A.; Mathieu, R.G. Critical Factors in Information System Development for a Flexible Manufacturing System. Comput. Ind. 1996, 28, 173–183. [Google Scholar] [CrossRef]
- Hougham, M. London Ambulance Service Computer-Aided Despatch System. Int. J. Proj. Manag. 1996, 14, 103–110. [Google Scholar] [CrossRef]
- Lankhorst, M. (Ed.) Agile Service Development: Combining Adaptive Methods and Flexible Solutions; The Enterprise Engineering Series; Springer: Berlin/Heidelberg, Germany, 2012; ISBN 978-3-642-28187-7. [Google Scholar]
- Cannon, J.A. Why IT Applications Succeed or Fail: The Interaction of Technical and Organizational Factors. Ind. Commer. Train. 1994, 26, 10–15. [Google Scholar] [CrossRef]
- Willcocks, L.; Griffiths, C. Predicting Risk of Failure in Large-Scale Information Technology Projects. Technol. Forecast. Soc. Change 1994, 47, 205–228. [Google Scholar] [CrossRef]
- PMI Agile. PMI Agile Practice Guide, 6th ed.; Project Management Institute: Newtown Square, PA, USA, 2017. [Google Scholar]
- Davis, B. Agile Practices for Waterfall Projects: Shifting Processes for Competitive Advantage; JRoss Publishing: Plantation, FL, USA, 2012; ISBN 978-1-60427-083-9. [Google Scholar]
- SAFe Scaled Agile Framework 5.0. Available online: https://www.scaledagileframework.com/ (accessed on 30 December 2020).
- Agile Alliance. Scrum of Scrums; Agile Alliance: Corryton, TN, USA, 2015. [Google Scholar]
- Schwaber, K.; Sutherland, J. Scrum Guide the Definitive Guide to Scrum: The Rules of the Game. 2020. Available online: https://www.scrumguides.org (accessed on 15 October 2020).
- Baker, B.N.; Murphy, D.C.; Fisher, D. Factors Affecting Project Success. In Project Management Handbook; John Wiley & Sons, Ltd.: Hoboken, NJ, USA, 1997; pp. 902–919. ISBN 978-0-470-17235-3. [Google Scholar]
- CERF. Independent Research Assessment of Project Management Factors Affecting Department of Energy Project Success; Final Report; Office of Engineering and Construction Management, U.S. Department of Energy: Washington, DC, USA, 2004.
- Procaccino, J.D.; Verner, J.M.; Shelfer, K.M.; Gefen, D. What Do Software Practitioners Really Think about Project Success: An Exploratory Study. J. Syst. Softw. 2005, 78, 194–203. [Google Scholar] [CrossRef]
- Curtis, B.; Krasner, H.; Iscoe, N. A Field Study of the Software Design Process for Large Systems. Commun. ACM 1988, 31. [Google Scholar] [CrossRef]
- Glass, R.L. Software Runaways: Lessons Learned from Massive Software Project Failures; Prentice Hall PTR: Upper Saddle River, NJ, USA, 1998; ISBN 978-0-13-673443-7. [Google Scholar]
- Sayles, L.R.; Chandler, M.K. (Eds.) Managing Large Systems: Organization for the Future; Harper & Row: New York, NY, USA, 1971. [Google Scholar]
- Iden, J. Implementing IT Service Management. Lessons from a University IT Department; IGI Global: Hershey, PE, USA, 2009; ISBN 978-1-60566-008-0. [Google Scholar]
- Wan, J.; Zhu, S.; Wang, Y. Empirical Analysis on Risk Factors of IT Service Management Project Implementation. In Proceedings of the IEEE 4th International Conference on Wireless Communications, Networking and Mobile Computing, Dalian, China, 12–14 October 2008; pp. 1–4. [Google Scholar]
- Kanter, J.; Walsh, J.J. Toward More Successful Project Management. Inf. Syst. Manag. 2004, 21, 16–21. [Google Scholar] [CrossRef]
- Bear, D. Risk Management in Information Systems Development-a Case Study. Eng. Manag. J. 1995, 5, 63–65. [Google Scholar] [CrossRef]
- Cicmil, S.J. Critical Factors of Effective Project Management. TQM Mag. 1997, 9, 390–396. [Google Scholar] [CrossRef]
- Clarke, A. A Practical Use of Key Success Factors to Improve the Effectiveness of Project Management. Int. J. Proj. Manag. 1999, 17, 139–145. [Google Scholar] [CrossRef]
- Harding, J.S. Crash Course in Project Engineering. Chem. Eng. N.Y. 1995, 102, 118. [Google Scholar]
- Hughes, M.W. Why Projects Fail: The Effects of Ignoring Obvious Management Principles. Ind. Eng. 1986, 18, 14–18. [Google Scholar]
- Loo, R. Working towards Best Practices in Project Management: A Canadian Study. Int. J. Proj. Manag. 2002, 6, 93–98. [Google Scholar] [CrossRef]
- Loo, R. A Multi-Level Causal Model for Best Practices in Project Management. Benchmarking Int. J. 2003, 10, 29–36. [Google Scholar] [CrossRef] [Green Version]
- Spinelli, D. Keys to Success in Management Projects. Netw. World 1997, 4, 14. [Google Scholar]
- Wateridge, J. IT Projects: A Basis for Success. Int. J. Proj. Manag. 1995, 13, 169–172. [Google Scholar] [CrossRef]
- Hildebrand, C. Loud and Clear. CIO 1996, 9, 56. [Google Scholar]
- Bairi, J.; Murali Manohar, B. Critical Success Factors in Gaining User Customer Satisfaction in Outsourced IT Services. J. Enterp. Inf. Manag. 2011, 24, 475–493. [Google Scholar] [CrossRef]
- Deutsch, M.S. An Exploratory Analysis Relating the Software Project Management Process to Project Success. IEEE Trans. Eng. Manag. 1991, 38, 365–375. [Google Scholar] [CrossRef]
- Charron, R.; Harrington, H.J.; Voehl, F.; Wiggin, H. The Lean Management Systems Handbook; CRC Press: Boca Raton, FL, USA, 2014; ISBN 978-1-4665-6435-0. [Google Scholar]
- Martinez-Jurado, P.J.; Moyano-Fuentes, J. Lean Management, Supply Chain Management and Sustainability: A Literature Review. J. Clean. Prod. 2014, 85, 134–150. [Google Scholar] [CrossRef]
- Senapathi, M.; Drury-Grogan, M.L. Systems Thinking Approach to Implementing Kanban: A Case Study. J. Softw. Evol. Process. 2020. [Google Scholar] [CrossRef]
- Sunden, J.; Hammarberg, M. Kanban; Helion: Warwick, UK, 2015; ISBN 978-83-283-6966-5. [Google Scholar]
- Charvat, J. How to Identify a Failing Project. Available online: https://www.techrepublic.com/article/how-to-identify-a-failing-project/ (accessed on 2 January 2021).
- McChrystal, S. Team of Teams: New Rules of Engagement for a Complex World; Penguin Books Ltd.: London, UK, 2015; ISBN 978-0-241-25083-9. [Google Scholar]
- Baldry, D. The Evaluation of Risk Management in Public Sector Capital Projects. Int. J. Proj. Manag. 1998, 16, 35–41. [Google Scholar] [CrossRef]
- Davis, K. Different Stakeholder Groups and Their Perceptions of Project Success. Int. J. Proj. Manag. 2014, 32, 189–201. [Google Scholar] [CrossRef]
- Egorova, E.; Torchiano, M.; Morisio, M.; Wohlin, C.; Aurum, A.; Svensson, R.B. Stakeholders’ Perception of Success: An Empirical Investigation. In Proceedings of the 35th Euromicro Conference on Software Engineering and Advanced Applications, Patras, Greece, 27–29 August 2009; pp. 210–216. [Google Scholar]
- Pinto, J.K.; Slevin, D.P.; English, B. Trust in Projects: An Empirical Assessment of Owner/Contractor Relationships. Int. J. Proj. Manag. 2009, 27, 638–648. [Google Scholar] [CrossRef]
- Atkinson, R. Project Management: Cost, Time and Quality, Two Best Guesses and a Phenomenon, Its Time to Accept Other Success Criteria. Int. J. Proj. Manag. 1999, 17, 337–342. [Google Scholar] [CrossRef]
Figure 1.
Scree plot for PCA based exploratory factor analysis, Varimax rotation with Kaiser normalization for 16 variables.
Figure 1.
Scree plot for PCA based exploratory factor analysis, Varimax rotation with Kaiser normalization for 16 variables.

Table 1.
Respondent characteristics.
| Variable | Category | Count | Percent |
|---|---|---|---|
| Gender | Female | 67 | 43.2 |
| Male | 88 | 56.8 | |
| Experience in IT | 1–3 | 33 | 21.3 |
| (years; M 1 = 10.4, S 2 = 8.1) | 4–6 | 34 | 21.9 |
| 7–10 | 29 | 18.7 | |
| 11–15 | 22 | 14.2 | |
| >15 | 37 | 23.9 | |
| Experience in IT project management | 1–3 | 50 | 32.3 |
| (years; M = 7.3, S = 6.2) | 4–6 | 45 | 29.0 |
| 7–10 | 29 | 18.7 | |
| 11–15 | 15 | 9.7 | |
| > 15 | 16 | 10.3 |
1 Mean value, 2 standard deviation.
Table 2.
Characteristics of projects managed by respondents.
| Variable | Category | Count | Percent |
|---|---|---|---|
| 1–6 | 48 | 31.0 | |
| 7–9 | 17 | 11.0 | |
| Project length (months; M 1 = 15, S 2 = 18.2) | 10–12 | 40 | 25.8 |
| 13–24 | 31 | 20.0 | |
| >24 | 19 | 12.3 | |
| Project scope type | Construction of a new system/service | 75 | 48.4 |
| Extension of the existing system/service | 42 | 27.1 | |
| Maintenance of the existing system/service | 38 | 24.5 | |
| Project customer type | External | 136 | 87.7 |
| Internal | 19 | 12.3 | |
| Project delivery type | Request for contribution/service | 71 | 45.8 |
| Transition (compliance) | 6 | 3.9 | |
| Transition and transformation | 55 | 35.5 | |
| Other (i.e., automation, migration, software, etc.) | 23 | 14.8 |
1 Mean value, 2 standard deviation.
Table 3.
Eigenvalues and variance explained for final exploratory model including four factors. (PCA, before and after Varimax rotation with Kaiser normalization).
Table 3.
Eigenvalues and variance explained for final exploratory model including four factors. (PCA, before and after Varimax rotation with Kaiser normalization).
| Factor | Before Rotation | After Varimax Rotation | ||||
|---|---|---|---|---|---|---|
| Eigenvalue | Variance Explained | Cumulative Variance | Eigenvalue | Variance Explained | Cumulative Variance | |
| F1 | 5.206 | 32.5% | 32.5% | 2.696 | 16.8% | 16.8% |
| F2 | 1.708 | 10.7% | 43.2% | 2.652 | 16.6% | 33.4% |
| F3 | 1.525 | 9.5% | 52.7% | 2.593 | 16.2% | 49.6% |
| F4 | 1.305 | 8.2% | 60.9% | 1.803 | 11.3% | 60.9% |
Table 4.
Basic statistics of final exploratory model with four factors (PCA, Varimax rotation with Kaiser normalization).
Table 4.
Basic statistics of final exploratory model with four factors (PCA, Varimax rotation with Kaiser normalization).
| Factor | Variable | Mean | SD 1 | Skewness | Kurtosis | Communalities | MSA 2 | VIF 3 |
|---|---|---|---|---|---|---|---|---|
| F1 | Q24 | 5.07 | 1.368 | −0.870 | 0.580 | 0.551 | 0.814 | 1.482 |
| Q25 | 4.25 | 1.355 | −0.297 | −0.439 | 0.545 | 0.913 | 1.809 | |
| Q30 | 4.90 | 1.410 | −0.659 | 0.060 | 0.489 | 0.850 | 1.570 | |
| Q31 | 5.45 | 1.249 | −1.119 | 1.349 | 0.496 | 0.864 | 1.634 | |
| Q32 | 5.15 | 1.320 | −1.234 | 1.124 | 0.683 | 0.856 | 2.042 | |
| F2 | Q01 | 4.74 | 1.574 | −0.576 | −0.494 | 0.704 | 0.831 | 1.730 |
| Q03 | 4.84 | 1.501 | −0.736 | −0.164 | 0.610 | 0.832 | 1.863 | |
| Q08 | 5.29 | 1.446 | −0.978 | 0.365 | 0.662 | 0.850 | 2.238 | |
| Q09 | 4.98 | 1.626 | −0.602 | −0.387 | 0.747 | 0.841 | 2.480 | |
| F3 | Q34 | 5.03 | 1.346 | −0.400 | −0.200 | 0.463 | 0.931 | 1.493 |
| Q41 | 5.12 | 1.266 | −0.896 | 0.609 | 0.663 | 0.774 | 1.980 | |
| Q42 | 4.92 | 1.272 | −0.621 | 0.133 | 0.778 | 0.803 | 2.311 | |
| Q44 | 4.99 | 1.329 | −0.834 | 0.327 | 0.607 | 0.827 | 1.880 | |
| F4 | Q06 | 2.74 | 1.721 | 0.666 | −1.006 | 0.729 | 0.675 | 1.550 |
| Q07 | 3.68 | 1.934 | −0.020 | −1.414 | 0.599 | 0.743 | 1.505 | |
| Q38 | 3.89 | 1.618 | −0.044 | −0.975 | 0.418 | 0.790 | 1.328 |
1 Standard deviation, 2 measures of sampling adequacy, 3 variance inflation factor.
Table 5.
Final, four-factors exploratory model with reliability and validity measures (PCA as the extraction method, Varimax rotation with Kaiser normalization, converged in five iterations).
Table 5.
Final, four-factors exploratory model with reliability and validity measures (PCA as the extraction method, Varimax rotation with Kaiser normalization, converged in five iterations).
| Factors and Measurement Variables | FL 4 | |
|---|---|---|
| F1. Agile techniques and change management (CA 1 = 0.776, CR 2 = 0.795, AVE 3 = 0.493) | ||
| Q24 | The project manager underwent training in agile methodology | 0.728 |
| Q25 | The work in progress was limited and bottlenecks removed for faster throughput | 0.572 |
| Q30 | The project focused on the work which has been delivered (outcomes) instead of how busy people were (utilization) to increase the throughput and flow | 0.633 |
| Q31 | The change request process was used in the project (recording, planning, documenting, testing, accepting, categorizing, assessing, authorizing, implementing and reviewing in a controlled manner) | 0.631 |
| Q32 | Throughout the project, a right amount of documentation was maintained, not too focused on producing elaborate documentation as milestones but not ignoring documentation altogether either | 0.783 |
| F2. Organization and people (CA = 0.824, CR = 0.849, AVE = 0.584) | ||
| Q01 | The project received strong executive support (by the Board of Directors or CEO, CFO, CIO, etc.) that was influenced the decision making | 0.798 |
| Q03 | In the project, a hierarchal culture which has clear divisions of responsibility and authority was employed | 0.729 |
| Q08 | The selected project team members had high technical competence and expertise (problem solving, subject matter) | 0.724 |
| Q09 | Project team members had great motivation and were committed to executing the project in the best possible way | 0.802 |
| F3. Stakeholders and risk analysis (CA = 0.793, CR = 0.838, AVE = 0.568) | ||
| Q34 | From the customer point of view, the most important features/outcomes were delivered first in the project | 0.581 |
| Q41 | In the project, risk analysis was evaluated at each change | 0.801 |
| Q42 | In the project, risk analysis was evaluated at control points | 0.862 |
| Q44 | The impact of stakeholders on the project was analyzed | 0.743 |
| F4. Work environment (CA = 0.614, CR = 0.770, AVE = 0.532) | ||
| Q06 | All team members worked in the same location for ease of communication and casual, constant contact | 0.828 |
| Q07 | The project team worked in a facility with a work environment like one of these: an open space, communal area, ample wall spaces for postings, etc. | 0.746 |
| Q38 | In the project, no multiple, independent teams were working together | 0.595 |
1 Cronbach’s alpha, 2 average variance extracted, 3 composite reliability, 4 factor loadings.
Publisher’s Note: MDPI stays neutral with regard to jurisdictional claims in published maps and institutional affiliations. |
© 2021 by the authors. Licensee MDPI, Basel, Switzerland. This article is an open access article distributed under the terms and conditions of the Creative Commons Attribution (CC BY) license (https://creativecommons.org/licenses/by/4.0/).
Share and Cite
MDPI and ACS Style
Zaleski, S.; Michalski, R. Success Factors in Sustainable Management of IT Service Projects: Exploratory Factor Analysis. Sustainability 2021, 13, 4457. https://0-doi-org.brum.beds.ac.uk/10.3390/su13084457
AMA Style
Zaleski S, Michalski R. Success Factors in Sustainable Management of IT Service Projects: Exploratory Factor Analysis. Sustainability. 2021; 13(8):4457. https://0-doi-org.brum.beds.ac.uk/10.3390/su13084457
Chicago/Turabian StyleZaleski, Szymon, and Rafał Michalski. 2021. "Success Factors in Sustainable Management of IT Service Projects: Exploratory Factor Analysis" Sustainability 13, no. 8: 4457. https://0-doi-org.brum.beds.ac.uk/10.3390/su13084457
Note that from the first issue of 2016, this journal uses article numbers instead of page numbers. See further details here.