Article

Barriers on Establishing Passive Strategies in Office Spaces: A Case Study in a Historic University Building

by
Nuno Baía Saraiva
,
Luisa Dias Pereira
*,
Adélio Rodrigues Gaspar
and
José Joaquim da Costa
Department of Mechanical Engineering, University of Coimbra, ADAI, Rua Luís Reis Santos, Pólo II, 3030-788 Coimbra, Portugal
*
Author to whom correspondence should be addressed.
Sustainability 2021, 13(8), 4563; https://0-doi-org.brum.beds.ac.uk/10.3390/su13084563
Submission received: 30 March 2021 / Revised: 15 April 2021 / Accepted: 16 April 2021 / Published: 20 April 2021
(This article belongs to the Special Issue Advances in Historic Buildings Conservation and Energy Efficiency)

Abstract

:
The adaptation of spaces to different usage typologies can be complex in heritage buildings. Facilities were initially planned for a specific type of use that, when changed, require additional measures to ensure a suitable indoor environment. Passive strategies—e.g., free cooling—are commonly used as an alternative without requiring equipment installation. However, its implementation often leads to unsatisfactory conditions. Therefore, it is important to clarify the main barriers to achieving thermal comfort in readapted historic buildings. The present work investigates the thermal comfort conditions reported by workers in office spaces of a historic building in the University of Coimbra. A monitoring campaign was carried out between May and September 2020 to assess indoor conditions’ quality. Due to the current pandemic of COVID-19, offices were not occupied at full capacity. A one-day evaluation of thermal comfort was made using a climate analyzer and six occupants were surveyed on 19 August 2020. The main results highlighted discomfort due to overheating of spaces. The causes were related to the combination of inadequate implementation of the free cooling actions and the building use. Furthermore, it was recommended the installation of HVAC systems in case of full capacity.

1. Introduction

Cities have been seeking solutions to adapt, reuse, retrofit, and rehabilitate historical centers and their heritage buildings, most of them driven by a need to revitalize buildings and respond to societal demands and expectations. In turn, decision-makers face difficulties when facing different concerns and alternatives from stakeholders [1]. Besides, more challenges arise when targeting the performance of buildings imposed by energy efficiency requirements [2] and indoor environment quality (IEQ) for both human safety and conservation [3]. Such challenges become even more difficult to tackle when patrimony has restrictions that safeguard its cultural value [4]. Extreme climatic events may put at risk or damage patrimony and decrease its energy performance from a future perspective. Therefore, climate change must also be addressed in the planning process [5].
Taking as reference the adaptative reuse of historic buildings, it englobes a retrofitting process that ensures the passing of historical value with a sustainable design and performance, as a type of circular economy strategy [6]. Nevertheless, facilities were initially planned for a specific type of use that requires additional measures to ensure a good indoor environment when changed. They may require changing and/or adding features, technological systems, and building materials to historic buildings [7] to improve the IEQ and energy performance. According to ASHRAE fundamentals [8], the design loads, and so the indoor environment, are affected by four different categories of factors: external (building envelope) and internal load generation (occupancy, lighting, and equipment), infiltration and energy and ventilation systems. For example, applying thermal insulation on the building envelope may be considered [9]. Rodrigues et al. [10] state that the insulation thickness depends on the type of use and occupancy pattern. Adding as study variables the glazing replacement and ventilation, Blázquez et al. [11] concluded that thermal insulation increases thermal comfort even in summer, but higher air-tightness levels increase discomfort in the same season, pointing out that there was a need to force ventilation. However, a minimal intervention plan should avoid changing the building envelope, or it may even not be allowed, where other strategies must be considered. For offices, Barbadilla-Martín et al. [12] state that hybrid cooling (natural and mechanical) should be widely practiced for Mediterranean cities to optimize systems’ energy performance. Caro and Sendra [13] defend that passive strategies can improve thermal comfort during summer but are not capable to maintain a comfortable indoor environment without an active cooling system. This raises the question concerning the main barriers to implement an efficient passive strategy during summer. Are those barriers the main reasons why standalone passive strategies are insufficient to deliver the required thermal comfort to occupants?
In historic buildings, the integration of energy-efficient ventilation systems is so complex that in Rieser et al. [14] developed a systematic intervention approach to address it. In office buildings, the building operation and occupant behavior have a considerable influence on the indoor environment. The building operation has a strict relation with internal heat gains. Occupancy, lighting, and appliances are significant heat contributions. Zhang et al. [15] investigated the partial contribution of these internal heat gain factors. It was found that occupants represented between 28% and 33% of the total heat gain density while lighting and appliances completed the remaining. Wang et al. [16] estimated that occupancy is responsible for 15% to 25% of total internal heat gains, lighting 20% to 30%, and appliances 50% to 55%. O’Connor et al. [17] proposed heat recovery technologies for lowering the energy demand necessary for cooling (and heating). Though it should be considered when energy retrofitting, this action turns unpractical when no HVAC system is present in a historic building.
Regarding occupant behavior, Mustapa et al. [18] stated that offices adopting free-running ventilation strategies are less comfortable than air-conditioned buildings, even though occupants could adapt behaviors to tolerate warmer indoor temperatures by drinking water, turning on fans, or opening doors and/or windows. As stated by Rieser et al. [14], natural ventilation is one of the key user-driven passive techniques. Nonetheless, the resulting passive (free-floating) hygrothermal behavior may not be efficient enough. Concerning window opening behavior, Zhou et al. [19] concluded that open-space offices tend to reveal more randomness than single offices associated with window operating behavior by occupants due to subjectivity of thermal sensation than single offices. Different people may have different thermal sensations within the same space [20], which may lead people to open windows when combined with poor air quality. Nevertheless, a correlation was found between window openings and outdoor temperatures [19]. Such finding highlights that an inadequate evaluation of the outdoor conditions may lead occupants to leave windows open during the hottest hours of the day. One way to overcome such limitations could be the introduction of automation systems [21], which go beyond users’ behavior, potentiating the real passive cooling in buildings. However, again, one integrated building energy management system (BEMS) is highly unlikely to be implemented without a proper refurbishment action.
The combination of occupants’ presence and their behavior jeopardizes the delivery of a comfortable environment to office rooms, decreasing their productivity. Taking as the study case offices in a historical building of the University of Coimbra, the present work contributes to studying the difficulties faced when relying only on passive strategies to improve thermal comfort in the cooling season. The main objective focuses on the identification of significant barriers to the effectiveness of passive strategies during summertime. In fact, from the indoor thermal comfort and need of HVAC system perspective, the cooling season is the most critical by the difficulties to install outdoor units of cooling systems in historical buildings, and particularly in the context of classified sites.

2. Materials and Methods

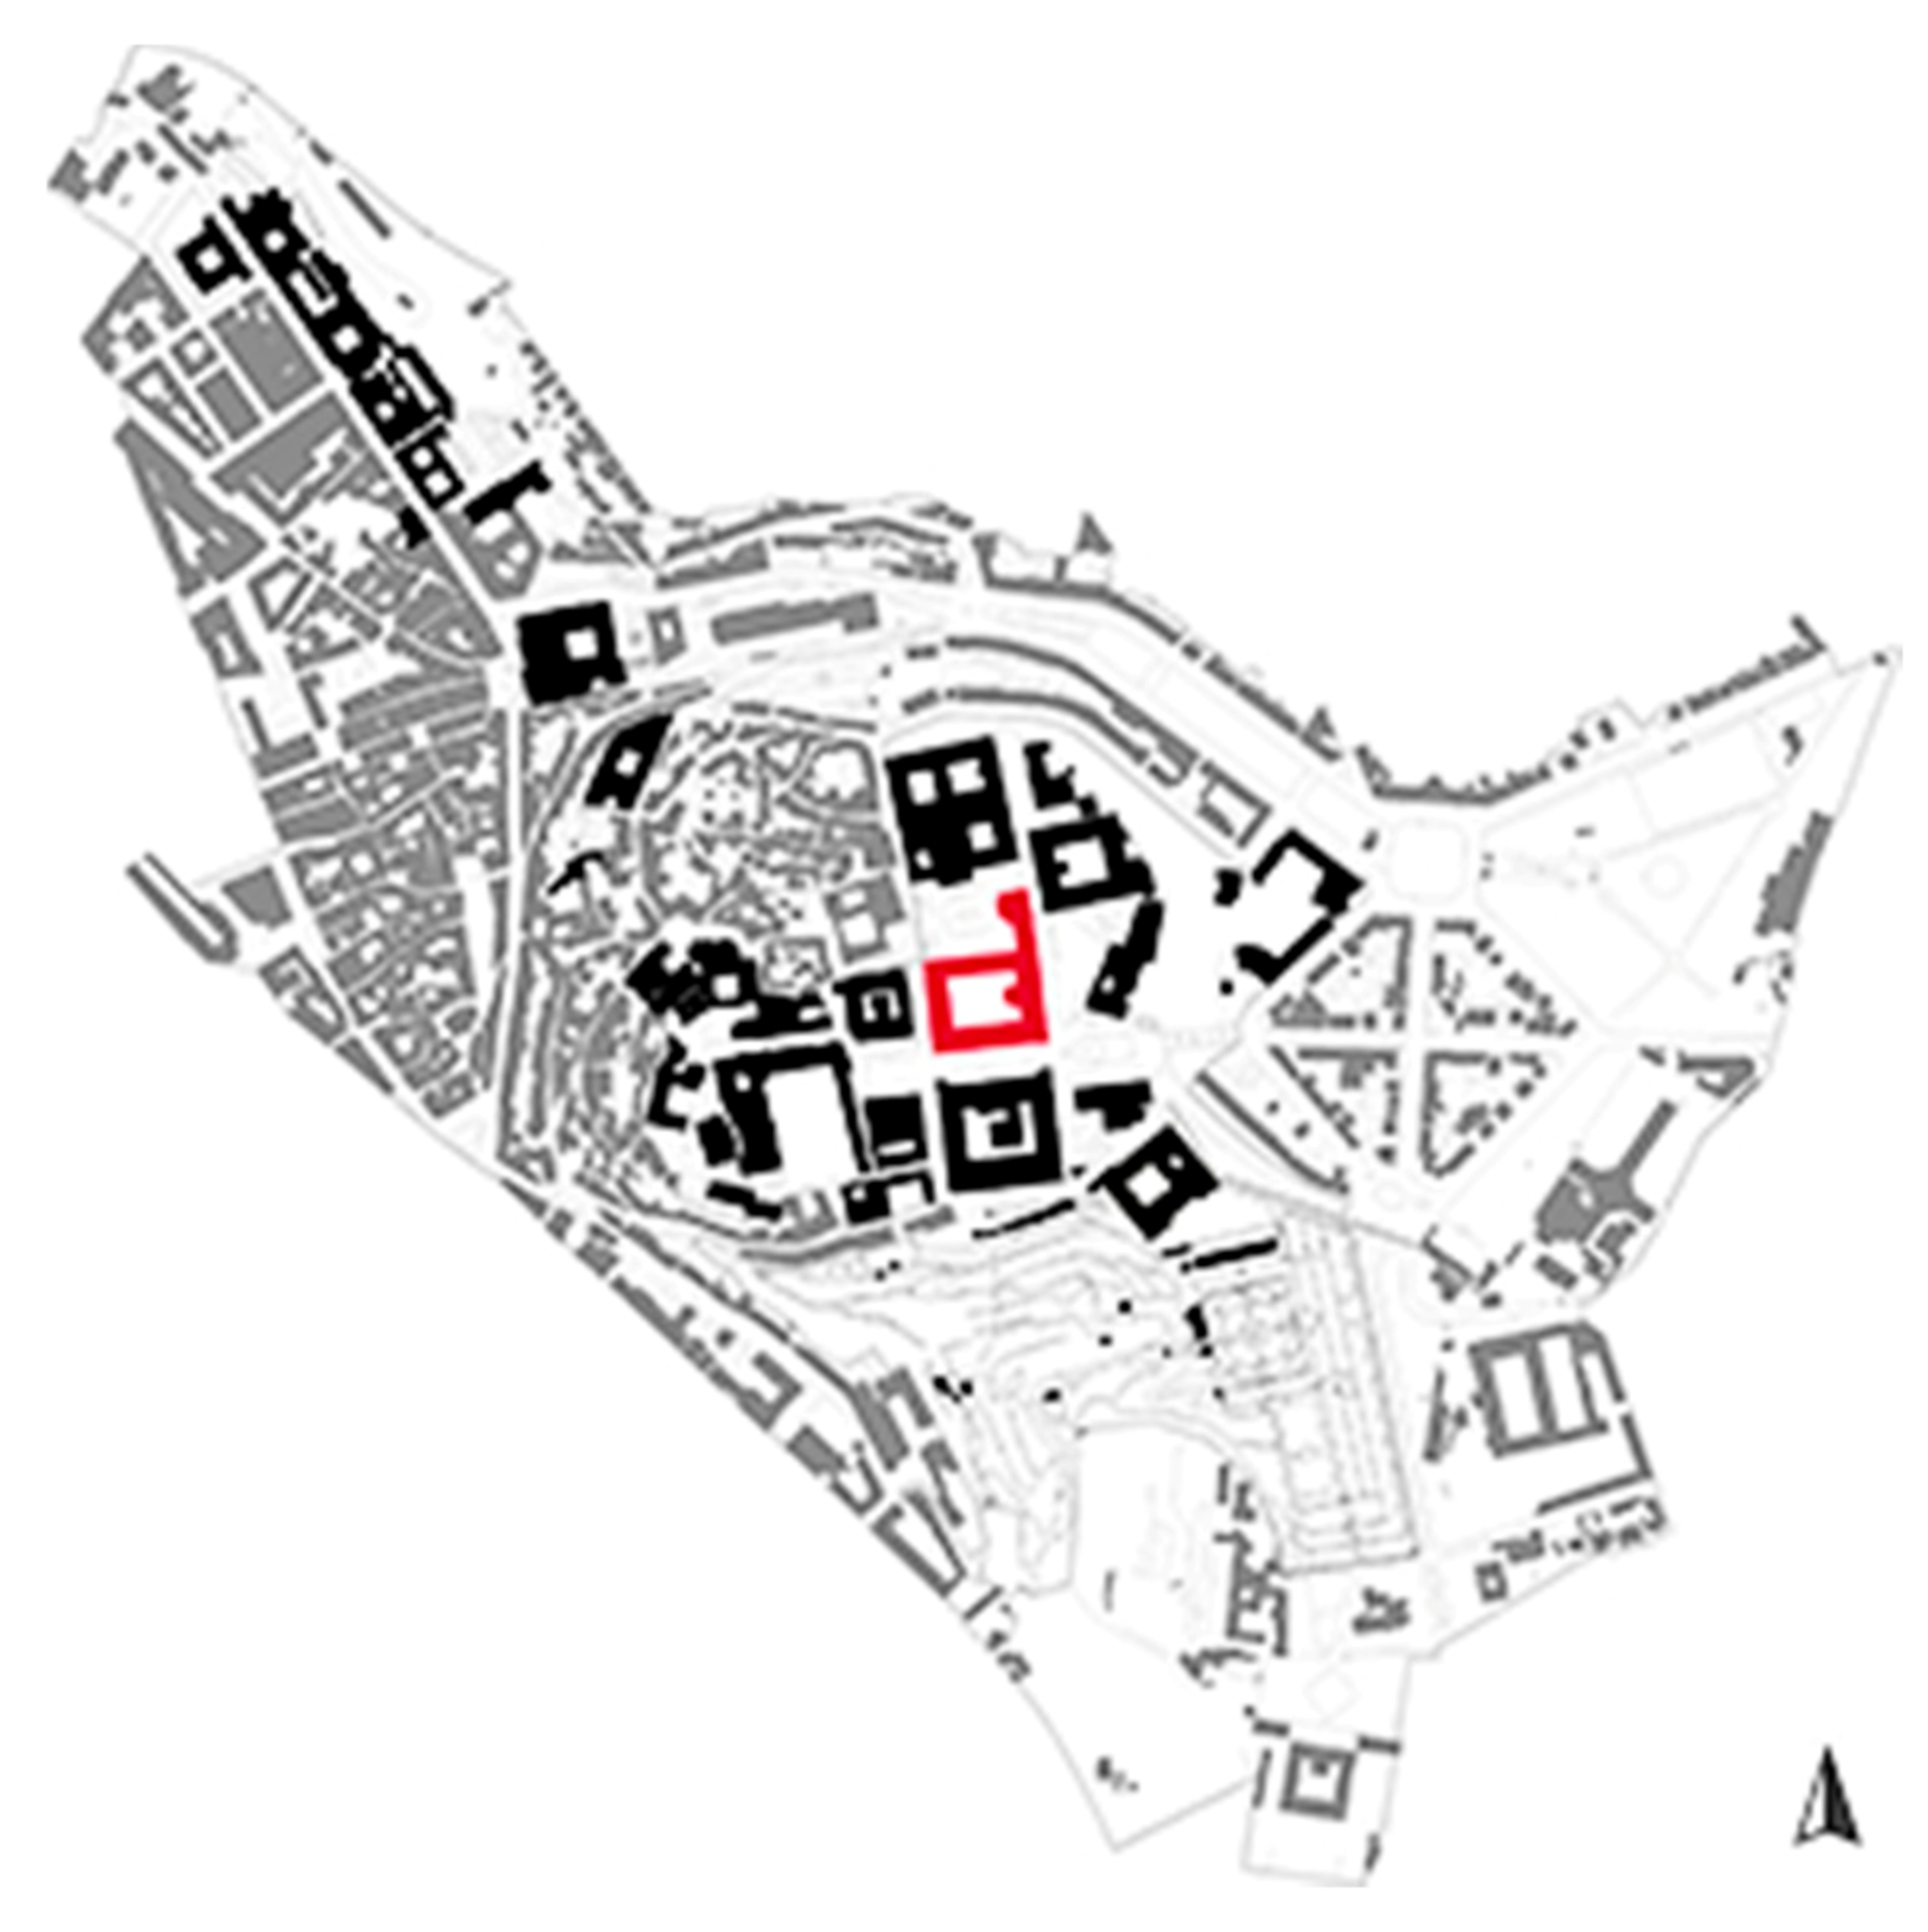
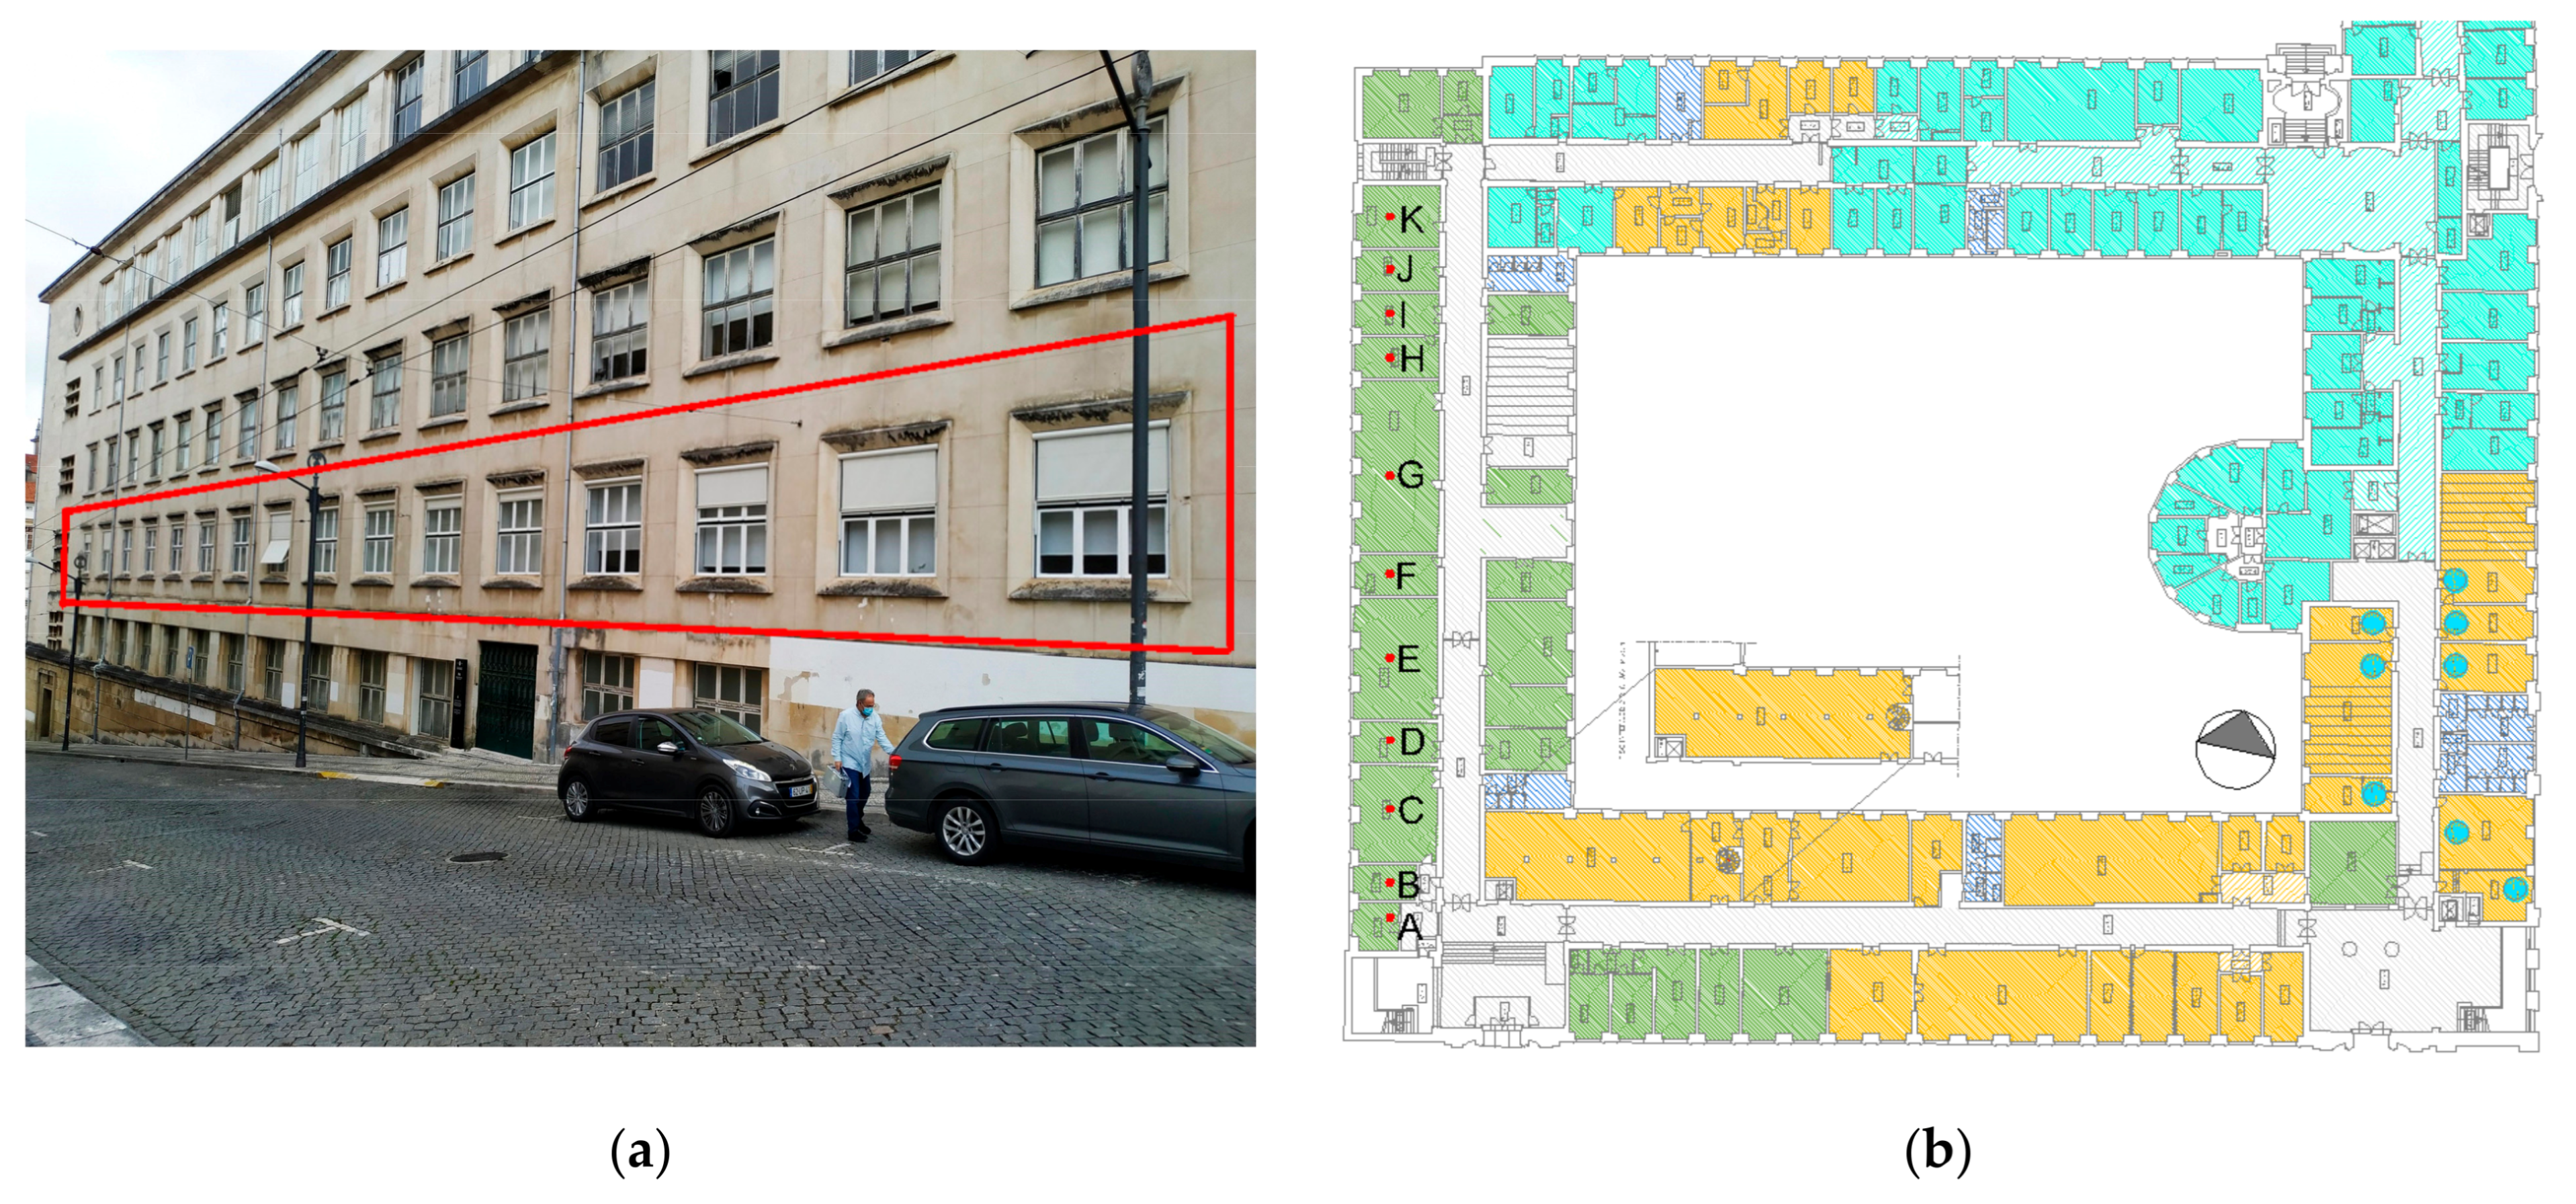
2.1. Case Study Presentation

The old building of the Faculty of Medicine of the University of Coimbra (FMUC), built in 1951–1956 [22], is located at Alta (Figure 1), the campus I of the university, declared by UNESCO as a World Heritage site in 2013, University of Coimbra—Alta and Sofia [23].
The campus is located at the heights of the city (altitude 100 m) with the geographical coordinates: 40°12′41″ N and 08°25′45″ W. From 1971 to 2000, Coimbra has been recording averages of 15.5 °C and 81% for temperature and relative humidity according to IPMA [24]. Annual averages of sunlight hours of 191.65 and average precipitation levels of 905.10 mm—please consider Table S1 of the Supplementary Material [25]. This climate of Coimbra is classified as warm and temperate, “Csb”, according to the Köppen-Geiger classification. The prevailing wind speed varied between average minimums and maximums of 1.5 and 3.2 km/h while the direction ranged majorly from SSW to WNW.

2.2. Applied Methodology and Case Study Description

The continuous monitoring campaign was carried out for over four months, from 4 May 2020 until 9 September 2020, using hygrothermal dataloggers. It was made an effort to place data loggers in the geometrical center of offices at the level of the work plan (0.8 m above the floor). Data were recorded every 10 min, in 11 offices located on the ground floor of the FMUC, west-oriented, as depicted in Figure 2. Rooms on upper floors were not considered because they still maintain their original functions, while the studied spaces modified their function during the recent past, being converted from classrooms and laboratories to administrative offices.
An in-depth thermal comfort analysis was performed on 19 August 2020. It was determined to choose a representative summer day to do a detailed indoor climate study in the office that had the most complaints concerning the overheated environment (office G). This one-day analysis was also done to support measurements of the continuous monitoring campaign. Due to the COVID-19 pandemic and the University scheduling at the time, this office registered an occupancy of only 30%.
To conduct this survey and assessment, an indoor climate analyzer Brüel & Kjær 1213 was used to record air temperature Ta, dew point temperature Tdew, radiant temperature asymmetry Tr, and air velocity va with a 1-min timestamp. This instrument was composed of a dry bulb temperature sensor, a hot-wire anemometer, and a net radiometer to measure the radiant temperature asymmetry. Equipment for the monitoring campaigns and its specification are described in Table 1.
As anticipated from Figure 1 and Figure 2b, the office windows of the FMUC facing the west side are partially shaded by the closest building. Each glazing surface is composed of three turn windows and three fixed windows with a total glazed area of 5.5 m2. The usual opening area varies from 1/6 to 2/6 of the total glazed area depending on the occupants’ behavior. The single glass windows of the façade are provided with internal and external shading devices to control solar exposure: internal opaque shadings and exterior blackouts. Some of the exterior blackouts are permanently down, while others are up. Windows are randomly open and managed individually by the office occupants, not following any protocol. Table 2 summarizes the characteristics of the monitored offices (occupancy, equipment, dimensions). Eleven hygrothermal sensors were distributed and referenced from A to K, as presented in Figure 2b.

2.3. Thermal Comfort Assessment

It was suggested to perform onsite thermal comfort monitoring campaigns of several reused rooms of the FMUC. These former single-occupant medical rooms are nowadays used as administrative offices of the University of Coimbra, provided with several office equipment, some of them with full occupancy, as determined by the Portuguese law restrictions for occupancy density [26]. The field surveys and thermal comfort data analysis were performed, treated, and classified according to the most commonly used thermal comfort guidelines: ISO 7730 [27] and ASHRAE 55 [28].
ISO 7730 adopts Fanger’s indices [29], the predicted mean vote (PMV), and the percentage of dissatisfied people (PPD), which resulted from the development of empirical models of heat transfer and sweat from the human skin. PMV is an index that reflects the mean vote of occupants in a room. It is expressed in a seven-point scale, corresponding to seven thermal sensations, from cold (−3) to hot (+3). It depends on four environmental variables (air temperature Ta, relative humidity RH, mean radiant temperature Tr, and air velocity va) and two individual variables (metabolism and clothing). PPD is a function of PMV and represents the percentage of people experiencing thermal discomfort for a given PMV. This index varies from 5% to 100%, pointing out that, from a psychological point of view, the same indoor conditions will not satisfy all occupants.
ISO 7730 [27] suggests three thermal comfort categories according to the typology of use and buildings age: A (buildings occupied by sensible people), B (new buildings), C (existing buildings), and D (only acceptable for short periods). Considering the characteristics of this kind of old buildings the target category is C as the minimally acceptable environment. Fanger’s indices were estimated for periods when the building was occupied.
ASHRAE 55 adaptative thermal comfort standard [28] proposes a simplified method to assess the indoor environment quality; depending not only on indoor conditions but also on past outdoor conditions. In other words, thermal comfort depends on the operative temperature (Top) and the mean monthly outdoor air temperature (Tout(month)). The adaptative thermal comfort model can be used for spaces without heating systems, for occupants with metabolisms between 1.0 and 1.3 met, clothing insulation of 0.5 to 1.0 clo, and Tout(month) between 10 and 33.5 °C.
Tout(month) is a weighted average of the outdoor air temperature in the last 30 days where closer days have more influence. It is defined by Equation (1).
Tout(month) = (1 − α) · (Tout(d − 1) + α · Tout (d − 2) + α2 · Tout (d − 3) + α4 · Tout (d − 4) + ),
ASHRAE 55 [23] suggests a weighting coefficient (α) of 0.6 for mid-latitude climates with larger day-to-day temperature variations for typical Portuguese weather. This adaptative thermal comfort standard divides the acceptance thresholds into two categories: (i) 90% of acceptance; and (ii) 80% of acceptance.
Due to the characteristics of this study, onsite field research of occupied offices, and the traditional equipment needed to perform such measurements, the study was performed under the assumption of some simplifications: (i) the mean radiant temperature is equal to the indoor air temperature [30], and the air velocity was considered constant and equal to 0.1 m/s (considering an average of 0.07 m/s in the one-day measurement); (ii) metabolism of occupants equal to 1.2 met according to the Portuguese rules for people working in offices [26]; and (iii) a range for clothing insulation between 0.6 and 1.0 clo for summer and mid-season clothing sets (1.0 clo = 0.155 m2∙°C/W). It was assumed that no occupants were under direct solar exposure. Measurements were analyzed using the previously appointed standards.
Additionally, a subjective thermal comfort survey was carried out. Office occupants filled in questionnaires, expressing their thermal sensation on a continuous scale with indicative qualitative indications, as suggested by Carvalho et al. [31]. This study approach was also reproduced to perform the survey results analysis. The questionnaire and its goal were thoroughly explained, and occupants’ data, such as age, gender, height and weight, and clothing insulation was collected under written given consent, as suggested by the Ethics Committee of the University and in compliance with the Helsinki declaration for medical research involving human subjects [32].

3. Results

3.1. Preliminary Visits

The preliminary visits to the building and offices allowed to understand some key aspects related to the operation of the building. There was no systematic record of each office occupancy rate because of the current pandemic context, but desktops were all turned on for remote working. Occupancy rates varied between 30 to 50% during the monitoring campaign. A survey on the internal heat generation was carried out during onsite visits. Table 3 summarizes the main heat contributions of workers and office equipment for an operation in full capacity of the building. Heat loads considered on the analysis were people, lighting, and office equipment.

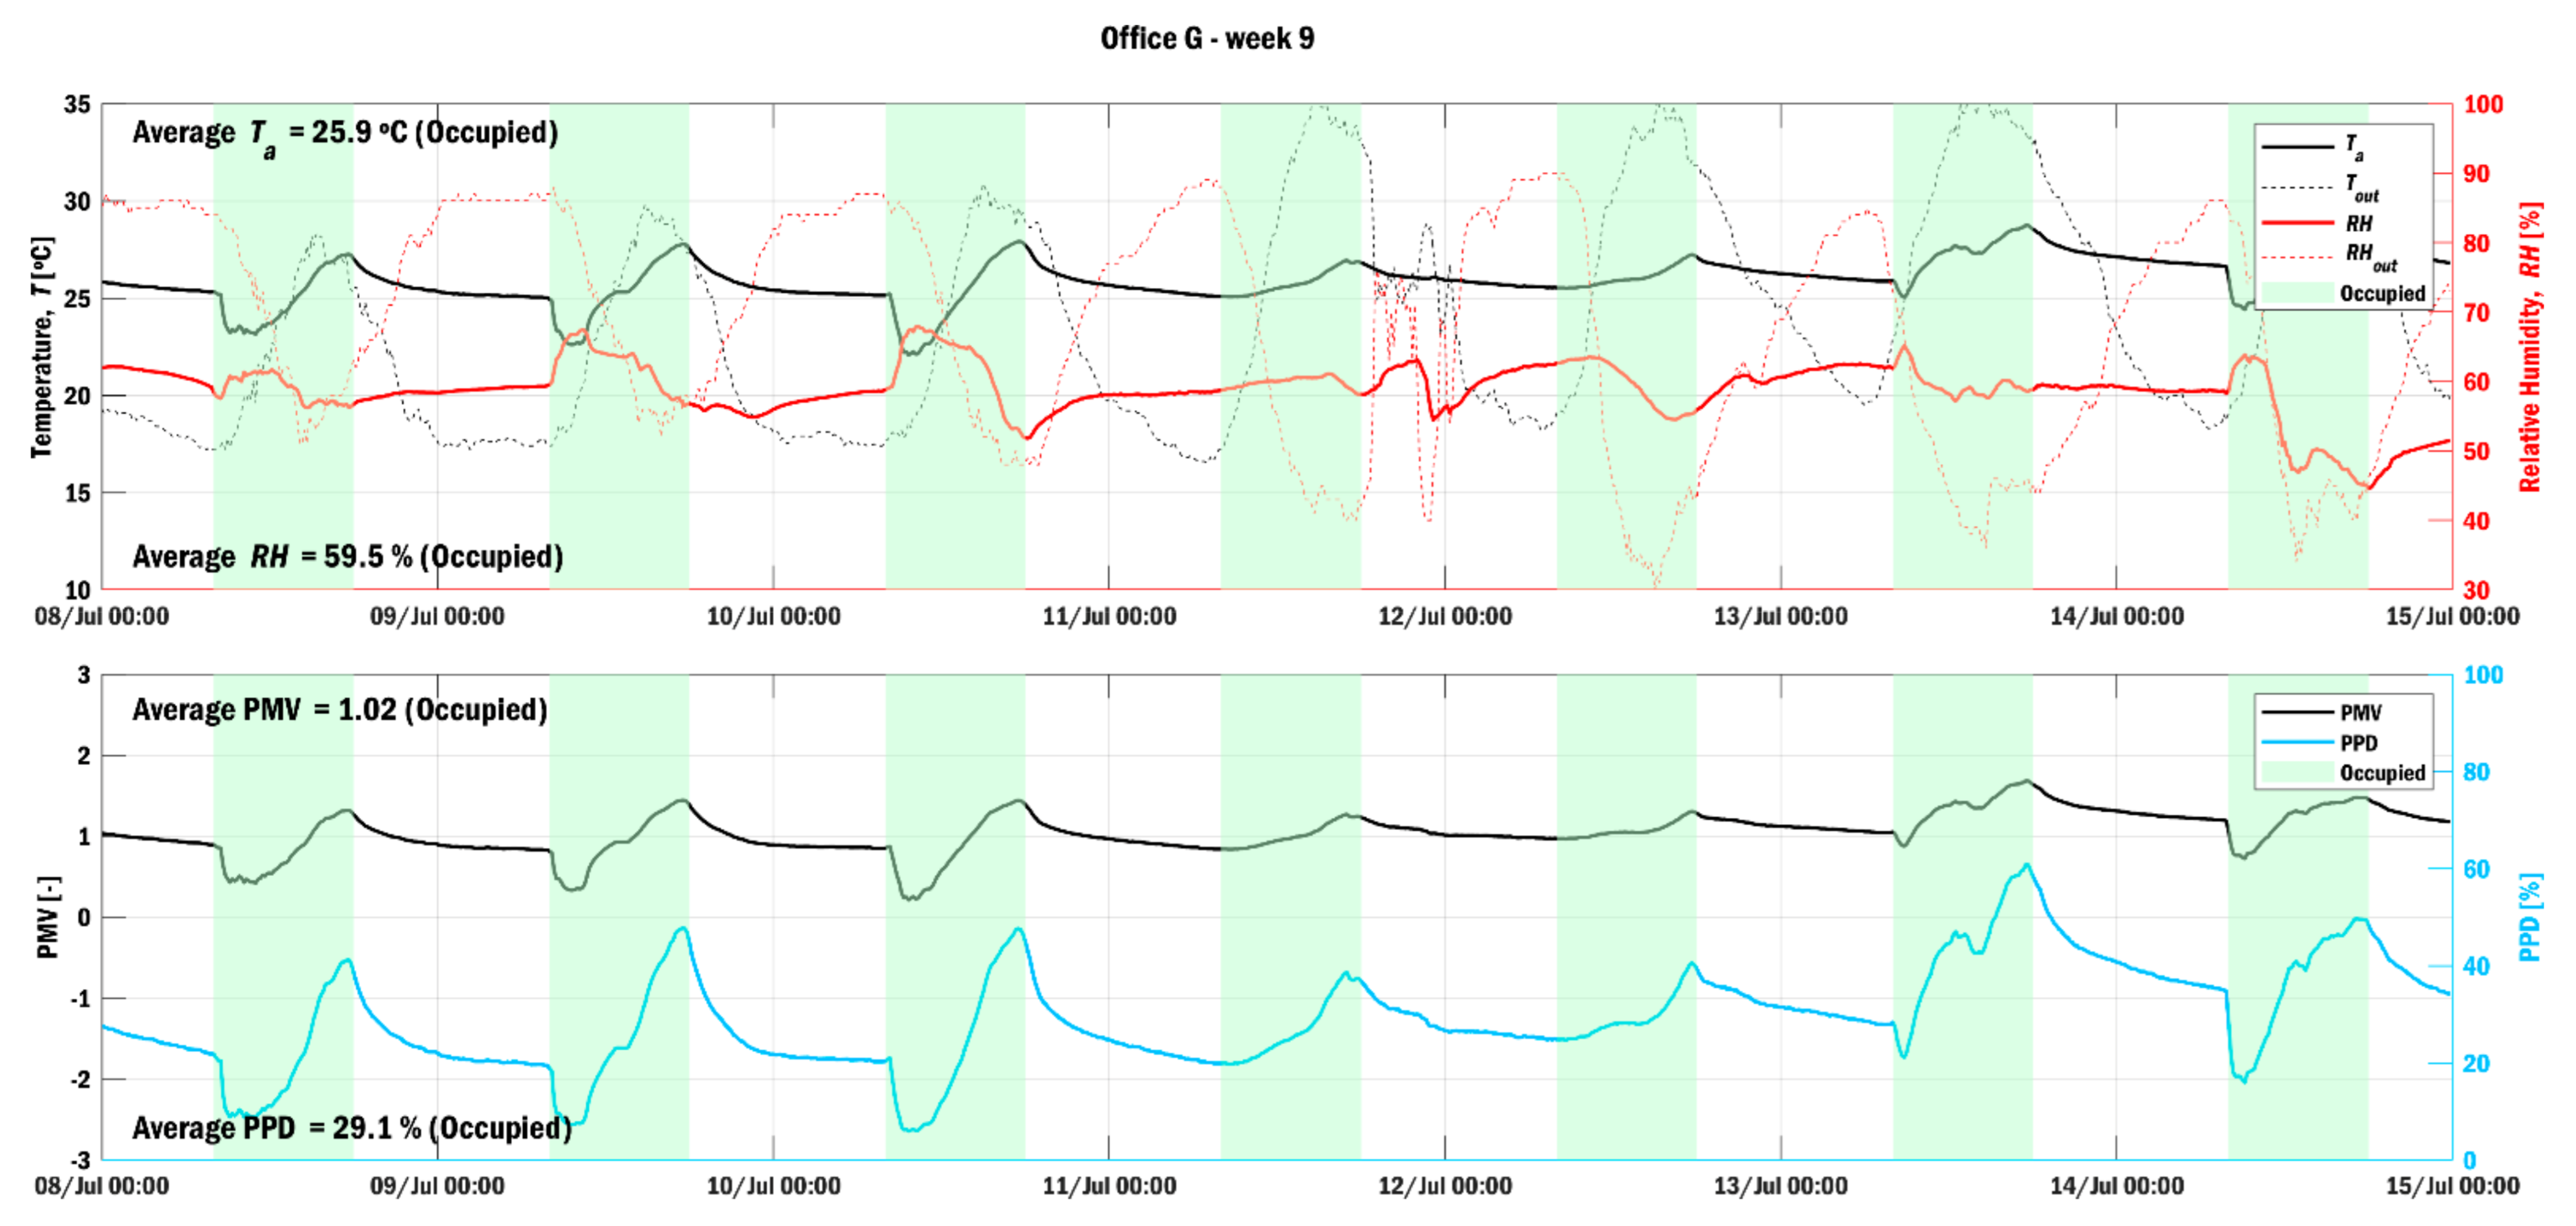
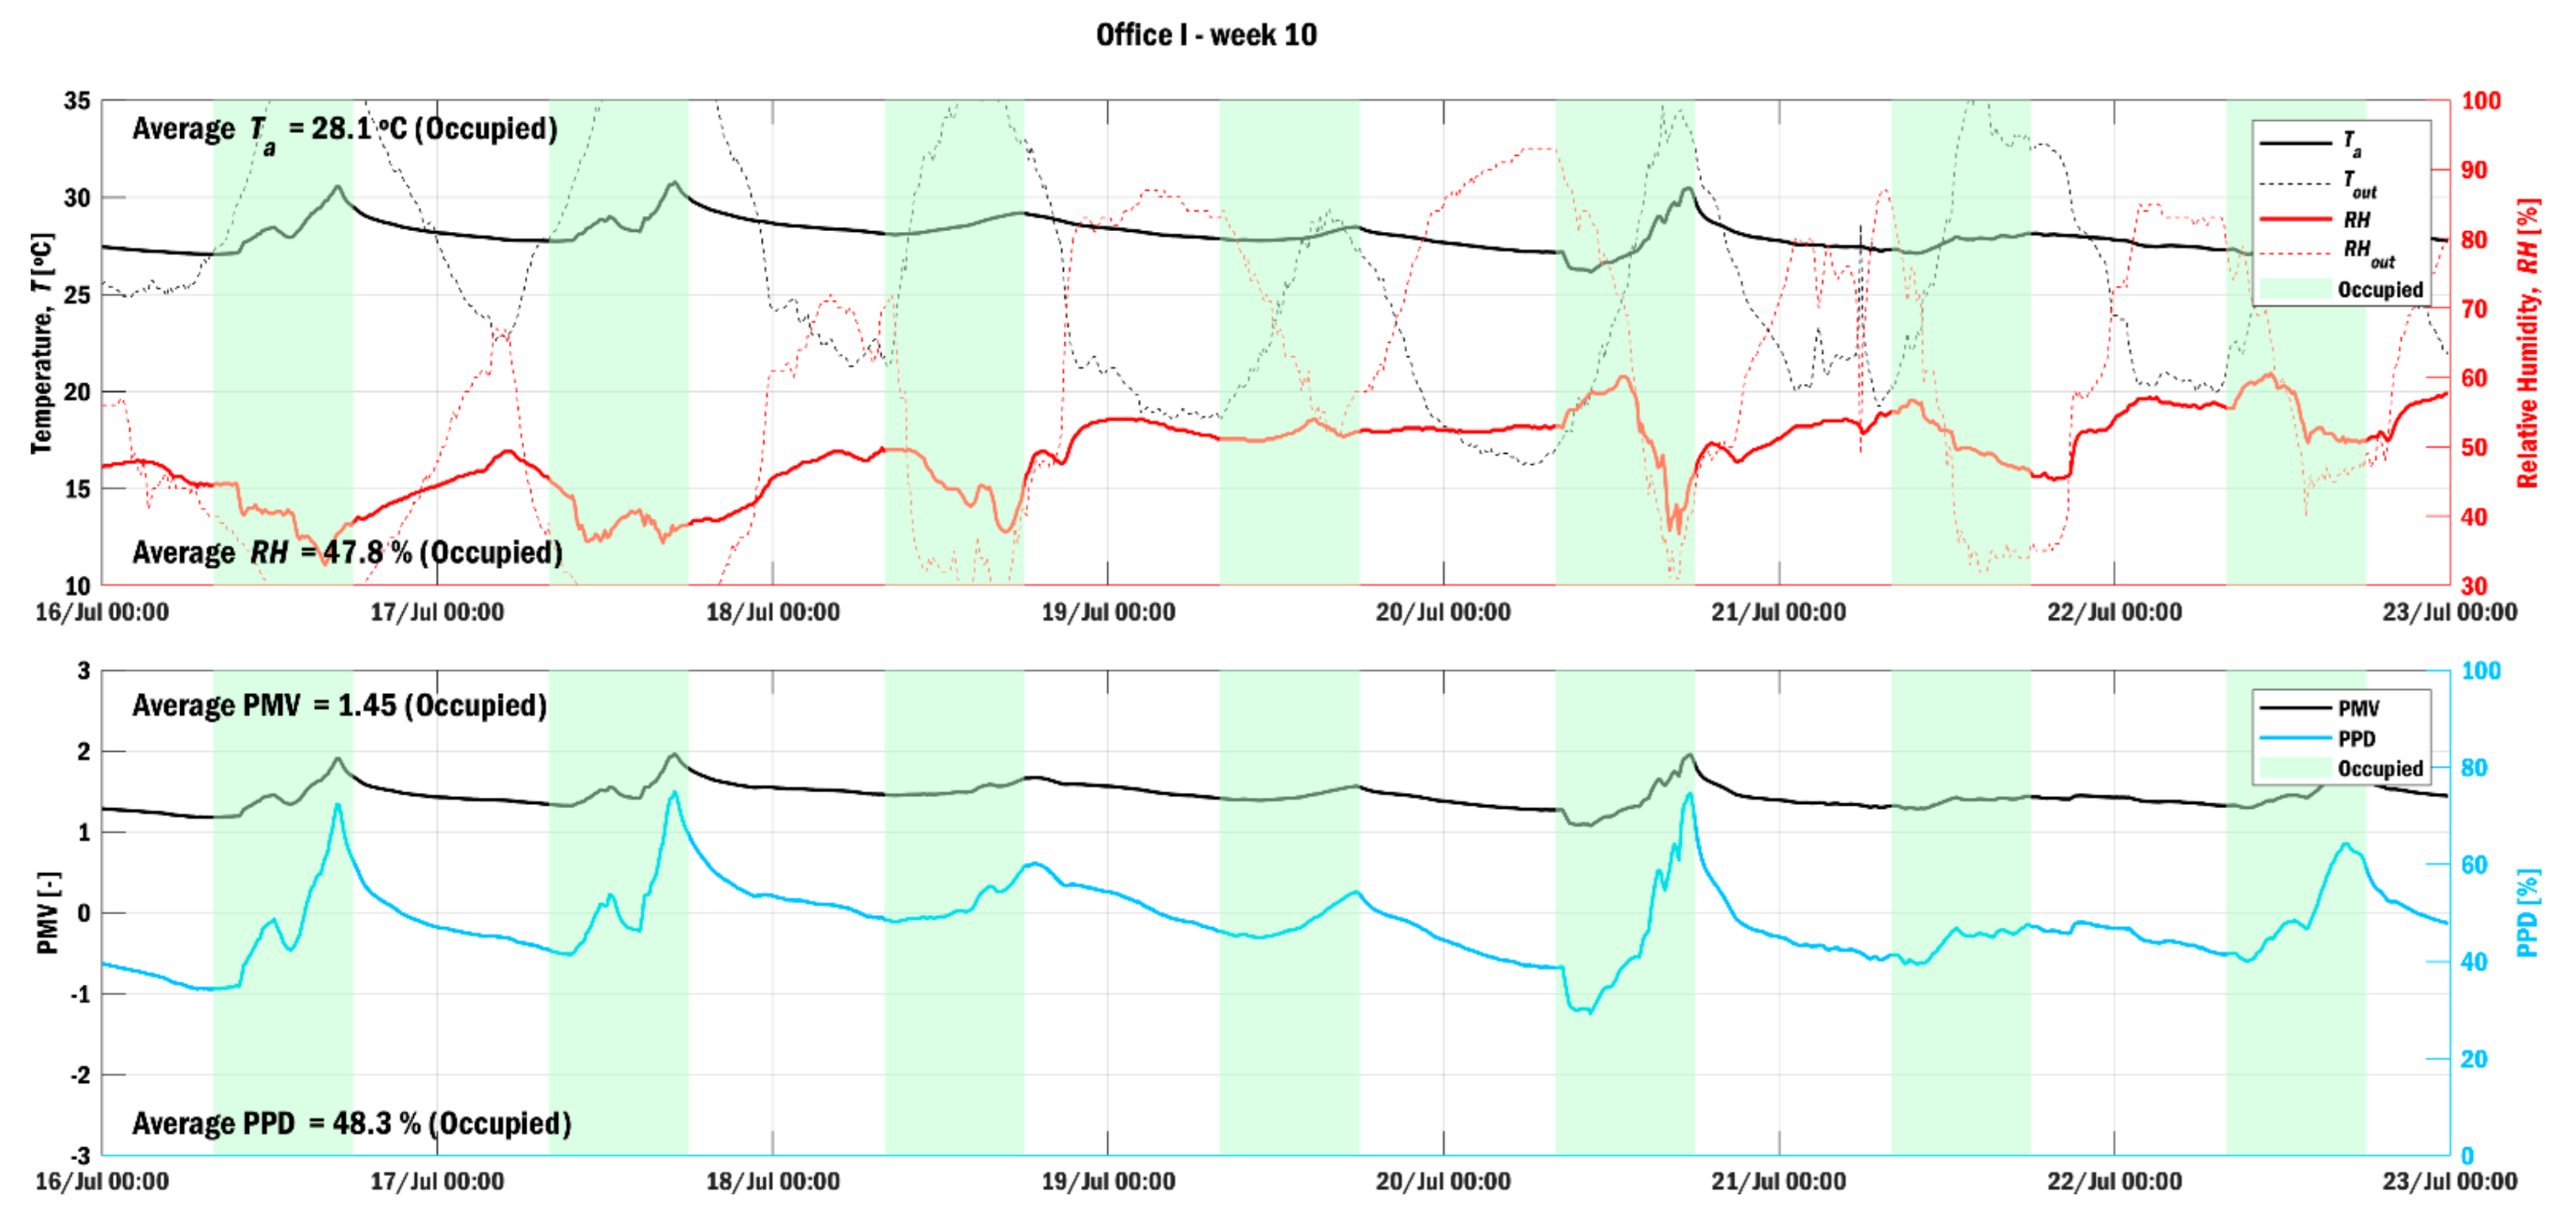
3.2. Indoor Temperature

The analysis of the results was divided into weekly periods to facilitate the interpretation of results. As the first parameter analyzed, weekly averages of T ¯ a were computed for each office along with a weekly average of outdoor temperature ( T ¯ out) for the occupancy schedule (between 08:00 and 18:00). Data were not collected in office B after week 12 due to technical issues of the datalogger.
From the results presented in Table 4, it is possible to notice an increase in T ¯ a after the third week along with an increase of T ¯ out. In fact, the highest T ¯ a was measured for the highest T ¯ out. This correlation indicates some dependency on the indoor environment relative to the outdoor conditions. Two significant causes could be enhancing such influence of the outdoor conditions on the indoor environment. The first one is related to the poor performance of the building envelope on responding to outdoor fluctuations due to the lack of thermal insulation (which in this case is none). However, if indoor and outdoor temperatures are compared between weeks 3, 4, and 5, it is possible to notice the effect of the high inertia of the building envelope, typical in historic buildings. Week 3 registered higher T ¯ out but week 4 had the larger T ¯ a that was maintained for one week more (through week 5) even though outdoor temperatures were considerably lower than in week 3 or 4. In other words, the building was heated due to outdoor conditions, but the thermal mass was keeping it warm for at least one week even if the outdoor temperatures drop. The same effect occurs for weeks 10 and 11.
The second cause is related to the operation of the building, since higher T ¯ a were registered when compared to T ¯ out values, taking as examples weeks 5, 6, 7, 11, 12, 13, 14, and 15. This effect is majorly due to high internal load generation (occupancy, lighting, and appliances) and/or inadequate efficacy of the window opening procedure. An inadequate operation of the building leads to overheating, which is aggravated by the building’s lack of thermal insulation and high thermal mass. Moreover, the impact at the end of each day is observed—the decrease of outdoor temperatures and workers leaving offices by 17:00/18:00 decreased the measured indoor temperature immediately. Summarily, internal heat generation contributed to the overheating of offices. At a full capacity, indoor temperatures would be higher if internal load generation followed the density presented in Table 3, where workers and desktops would represent 70% of the total internal heat generation. For this case, occupancy contributions are higher when compared to the findings of the values presented in Zhang et al. [15] and Wang et al. [16]. However, it is not the primary cause of overheating since offices were not fully occupied. Occupation rates varied between 30% to 50% of total capacity. These results point out that a virtual reduction of 50% of occupancy on the building’s regular operation would not be enough to ensure thermal comfort.
The building operation depends on the occupancy profile, which in turn influences the efficacy of the procedures to open the windows. As mentioned before, workers’ return after the lockdown led to a situation where workers themselves had to open and close windows. Nevertheless, the analysis of measurements evidenced that windows were inadequately left open after 11:00.
The positive effect of opening the windows in the morning is shown in Figure 3 for days 8, 9, and 10 July. However, during these days it is noticeable that windows were left open in periods when the outdoor temperature was higher than the indoor temperature, thus recovering the energy that had been dissipated earlier in the morning. An operation with the windows closed is seen on day 11 July, where maximum outdoor temperatures were higher than in other days, but the indoor temperature remained lower and more constant (lower daily amplitudes). Furthermore, as mentioned before, the prevailing wind direction ranged from SSW to WNW, which is precisely the direction of these offices. This indicates that air exchange rates were greater, thus intensifying the impact of a loss-making window opening operation.
Observing results for small offices (1–5 people), Figure 4 shows also an inadequate opening of windows. It is noticed the decrease of indoor temperature during the lunch period when the window was closed for a short period. Even with the increase of outdoor temperatures, closing the window countered the increase of the indoor temperature. This shows that, after lunch, the window was open again when outdoor temperatures were high, which contributed to the increase of thermal discomfort. Furthermore, on both days 16 and 17, the window was open too late when the outdoor temperature was already higher than indoors.
Another relevant fact is that the ventilation promoted in collective offices (e.g., office G) is more effective than in smaller size offices (e.g., office I). This fact is related to the number of windows in each office, and how many of them are open. Figure 3 shows an effective free cooling for office G while a similar positive impact was not registered in office I.
The comparison between offices according to the results presented in Table 5 allows drawing some conclusions. Weeks 4, 9, 10, and 11 registered higher indoor temperatures, and offices B, C, E, G, and I were the warmest. Room A is a server room justifying the high indoor temperatures registered. Office B shares a wall with room A, making this individual office, B, the warmest among them—with higher mean indoor air temperatures. For the collective rooms, it was expected that collective offices, C, E, and G, were the warmest for having more significant contact with outdoor conditions (larger exterior walls and glazing areas) and more significant internal heat generation density (per floor area). In these offices, it is noticed more events of door openings due to a more significant need to ventilate and cool the spaces. Nevertheless, all offices (small, collective, and individual) showed examples of poor behavior when controlling the window openings.

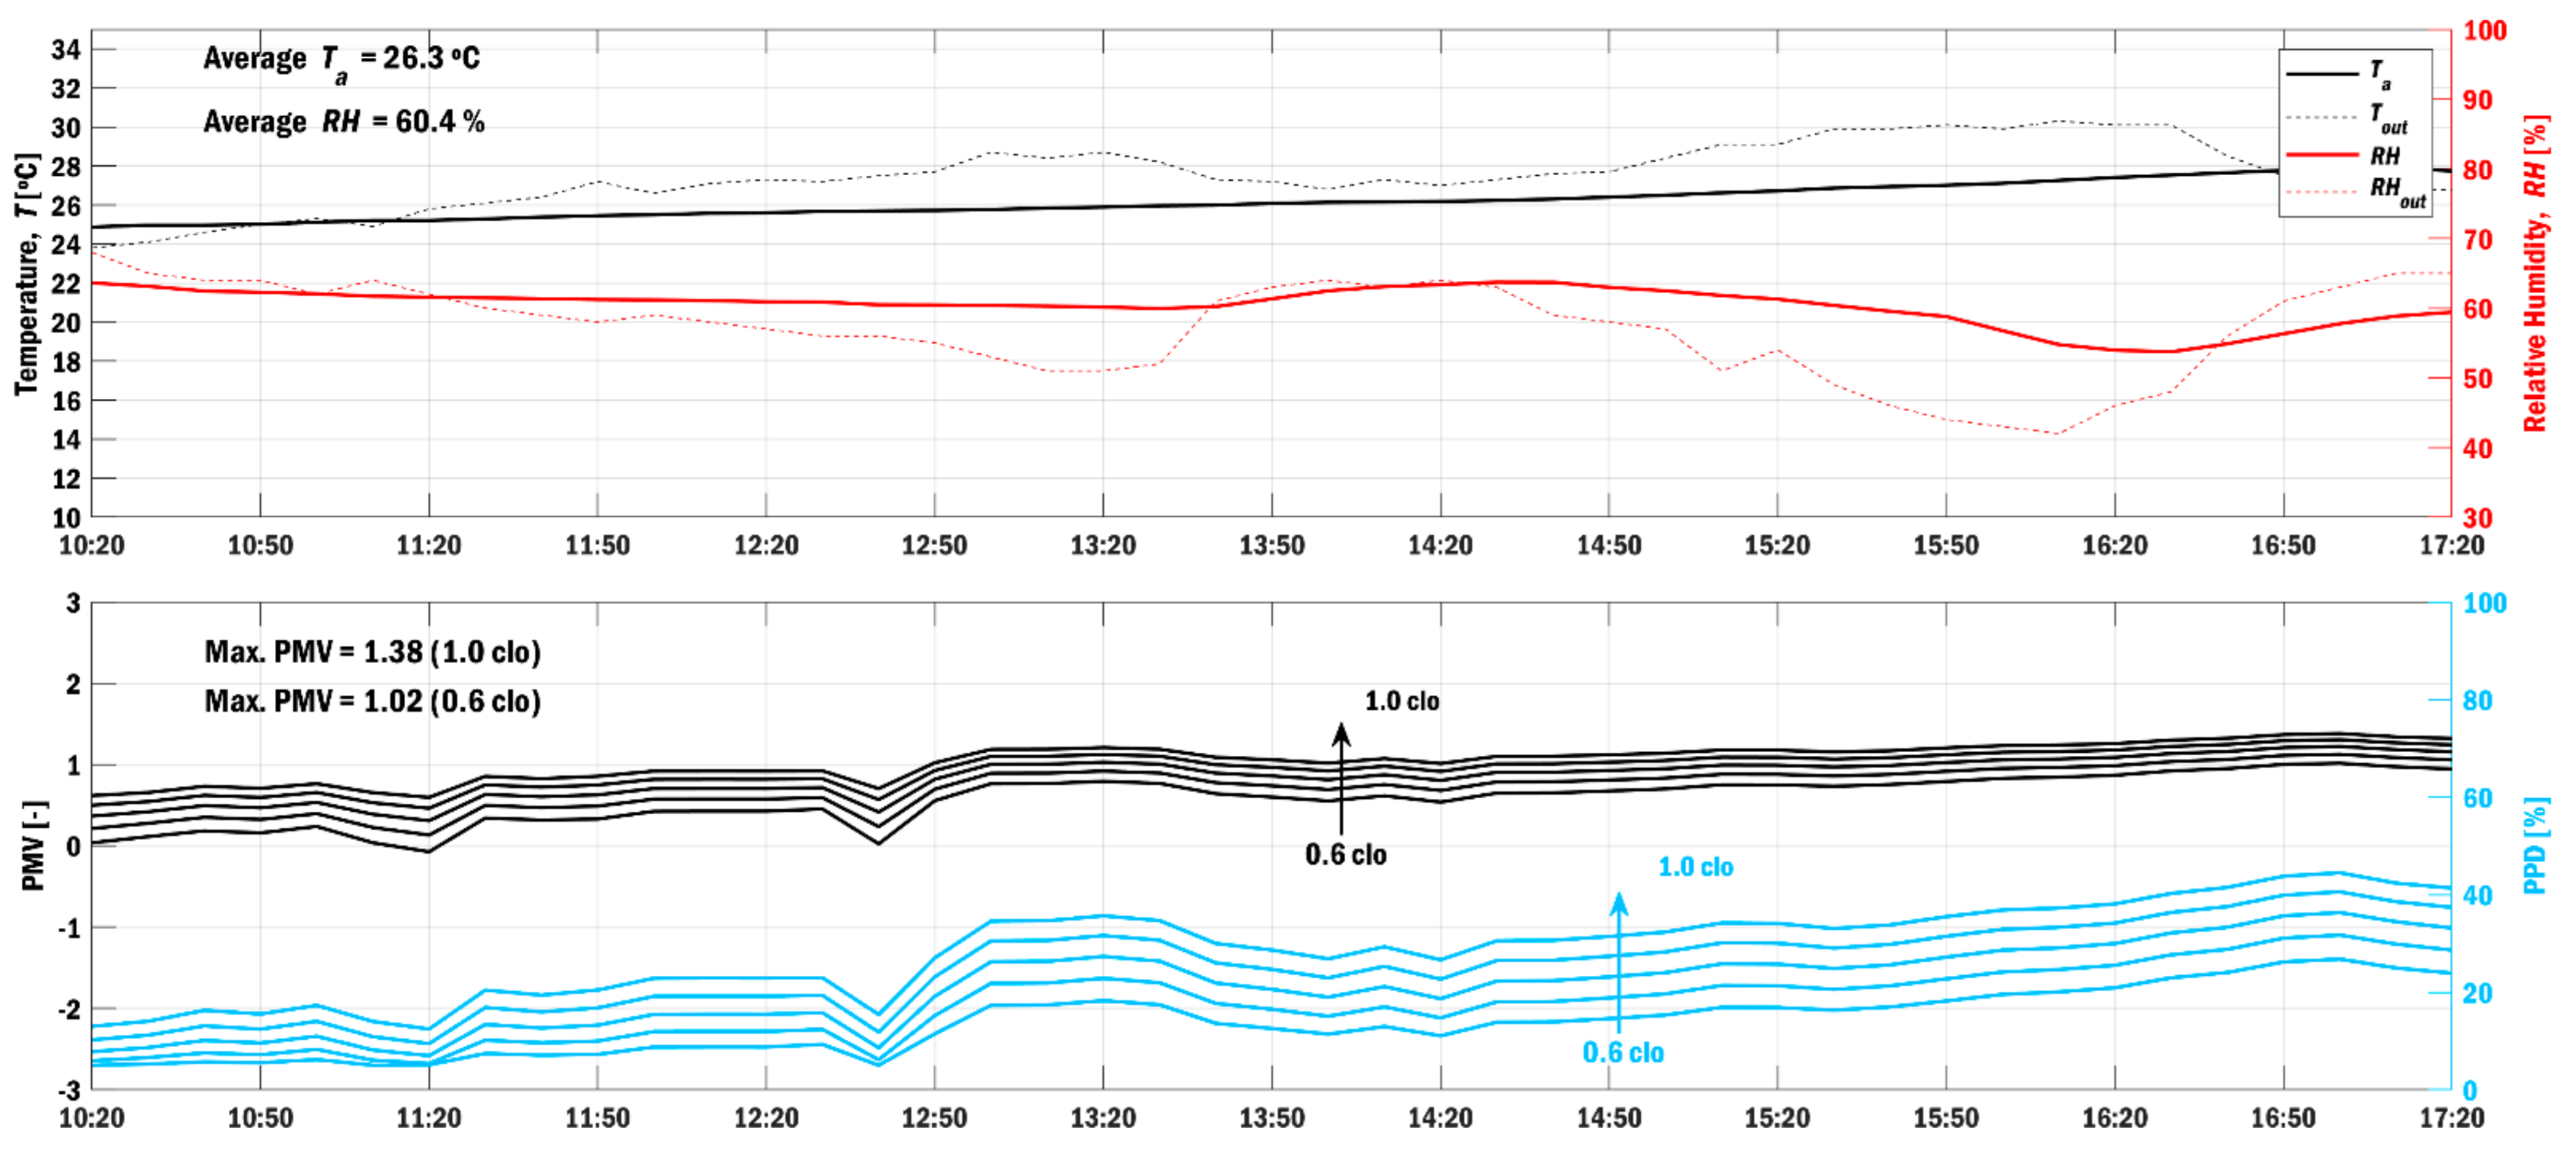
3.3. Thermal Comfort—PMV and PPD Indices

After analyzing the indoor temperature results presented in the previous section, the Thermal Comfort indices suggested in Section 2.3 were estimated. Tables S3 and S4 of the Supplementary Material [25] present the values corresponding to the percentage of time that a given space did not provide thermal comfort conditions (due to overheating)—performance index (PI) of discomfort—and the maximum weekly percentage of people dissatisfied, PPD, estimated for a formal dress code scenario (1.0 clo). Likewise, for comparison purposes, these parameters assessment is shown in Table 5 and Table 6 for typical summer clothing (0.6 clo).
The results show that the percentage of time in thermal discomfort (PMV > 0.7) due to overheating was very dominant, except for weeks 1, 2, 5, and 6 (the cooler weeks) for clothing insulation of 1.0 clo. It is worth mentioning that, regardless of the office space, the conditions revealed by these results do not meet the thermal comfort requirements of ISO 7730 [29], when wearing formal clothing. Therefore, the maximum weekly PPD value was high in all surveyed spaces, as shown in Table S4 of the Supplementary Material. The highest values of PPD (percentage of dissatisfied people) occurred mainly during the hottest weeks 4, 10, and 11, in which the maximum PMV values were higher than 2 (Hot).
After the analysis of both tables, it was concluded that offices C, E, F, and G presented the worst thermal comfort indices results over the complete monitoring. Though punctually, rooms B, E, and G presented the highest values of PMV and PPD, therefore considered the most uncomfortable offices.
Considering a lower clothing insulation level (0.6 clo), typical of the cooling season, the results change significantly. Moreover, assuming that workers adopted a dress code between 0.6 and 1.0 clo, the thermal sensation ranged between the results presented in tables for 1.0 and 0.6 clo tending more to uncomfortable sensations. The average values presented in Table 5, for 0.6 clo, point at shorter periods of thermal discomfort when compared to Table S3 of the Supplementary Material, for 1.0 clo. Table 6 presents lower extreme values concerning the maximum heat/hot sensation, for a clothing insulation of 0.6, when compared to results of Table S4 of the Supplementary Material, for 1.0 clo.
However, whenever offices return to operate in full occupancy and warmer periods come along, similar to the ones registered in weeks 10 and 11, new thermal discomfort conditions will arise. It was concluded that in regular operation, the thermal sensation of comfort in the collective offices would be considered ‘hot’ and with an unsuitable condition for a workplace, according to ISO 7730.

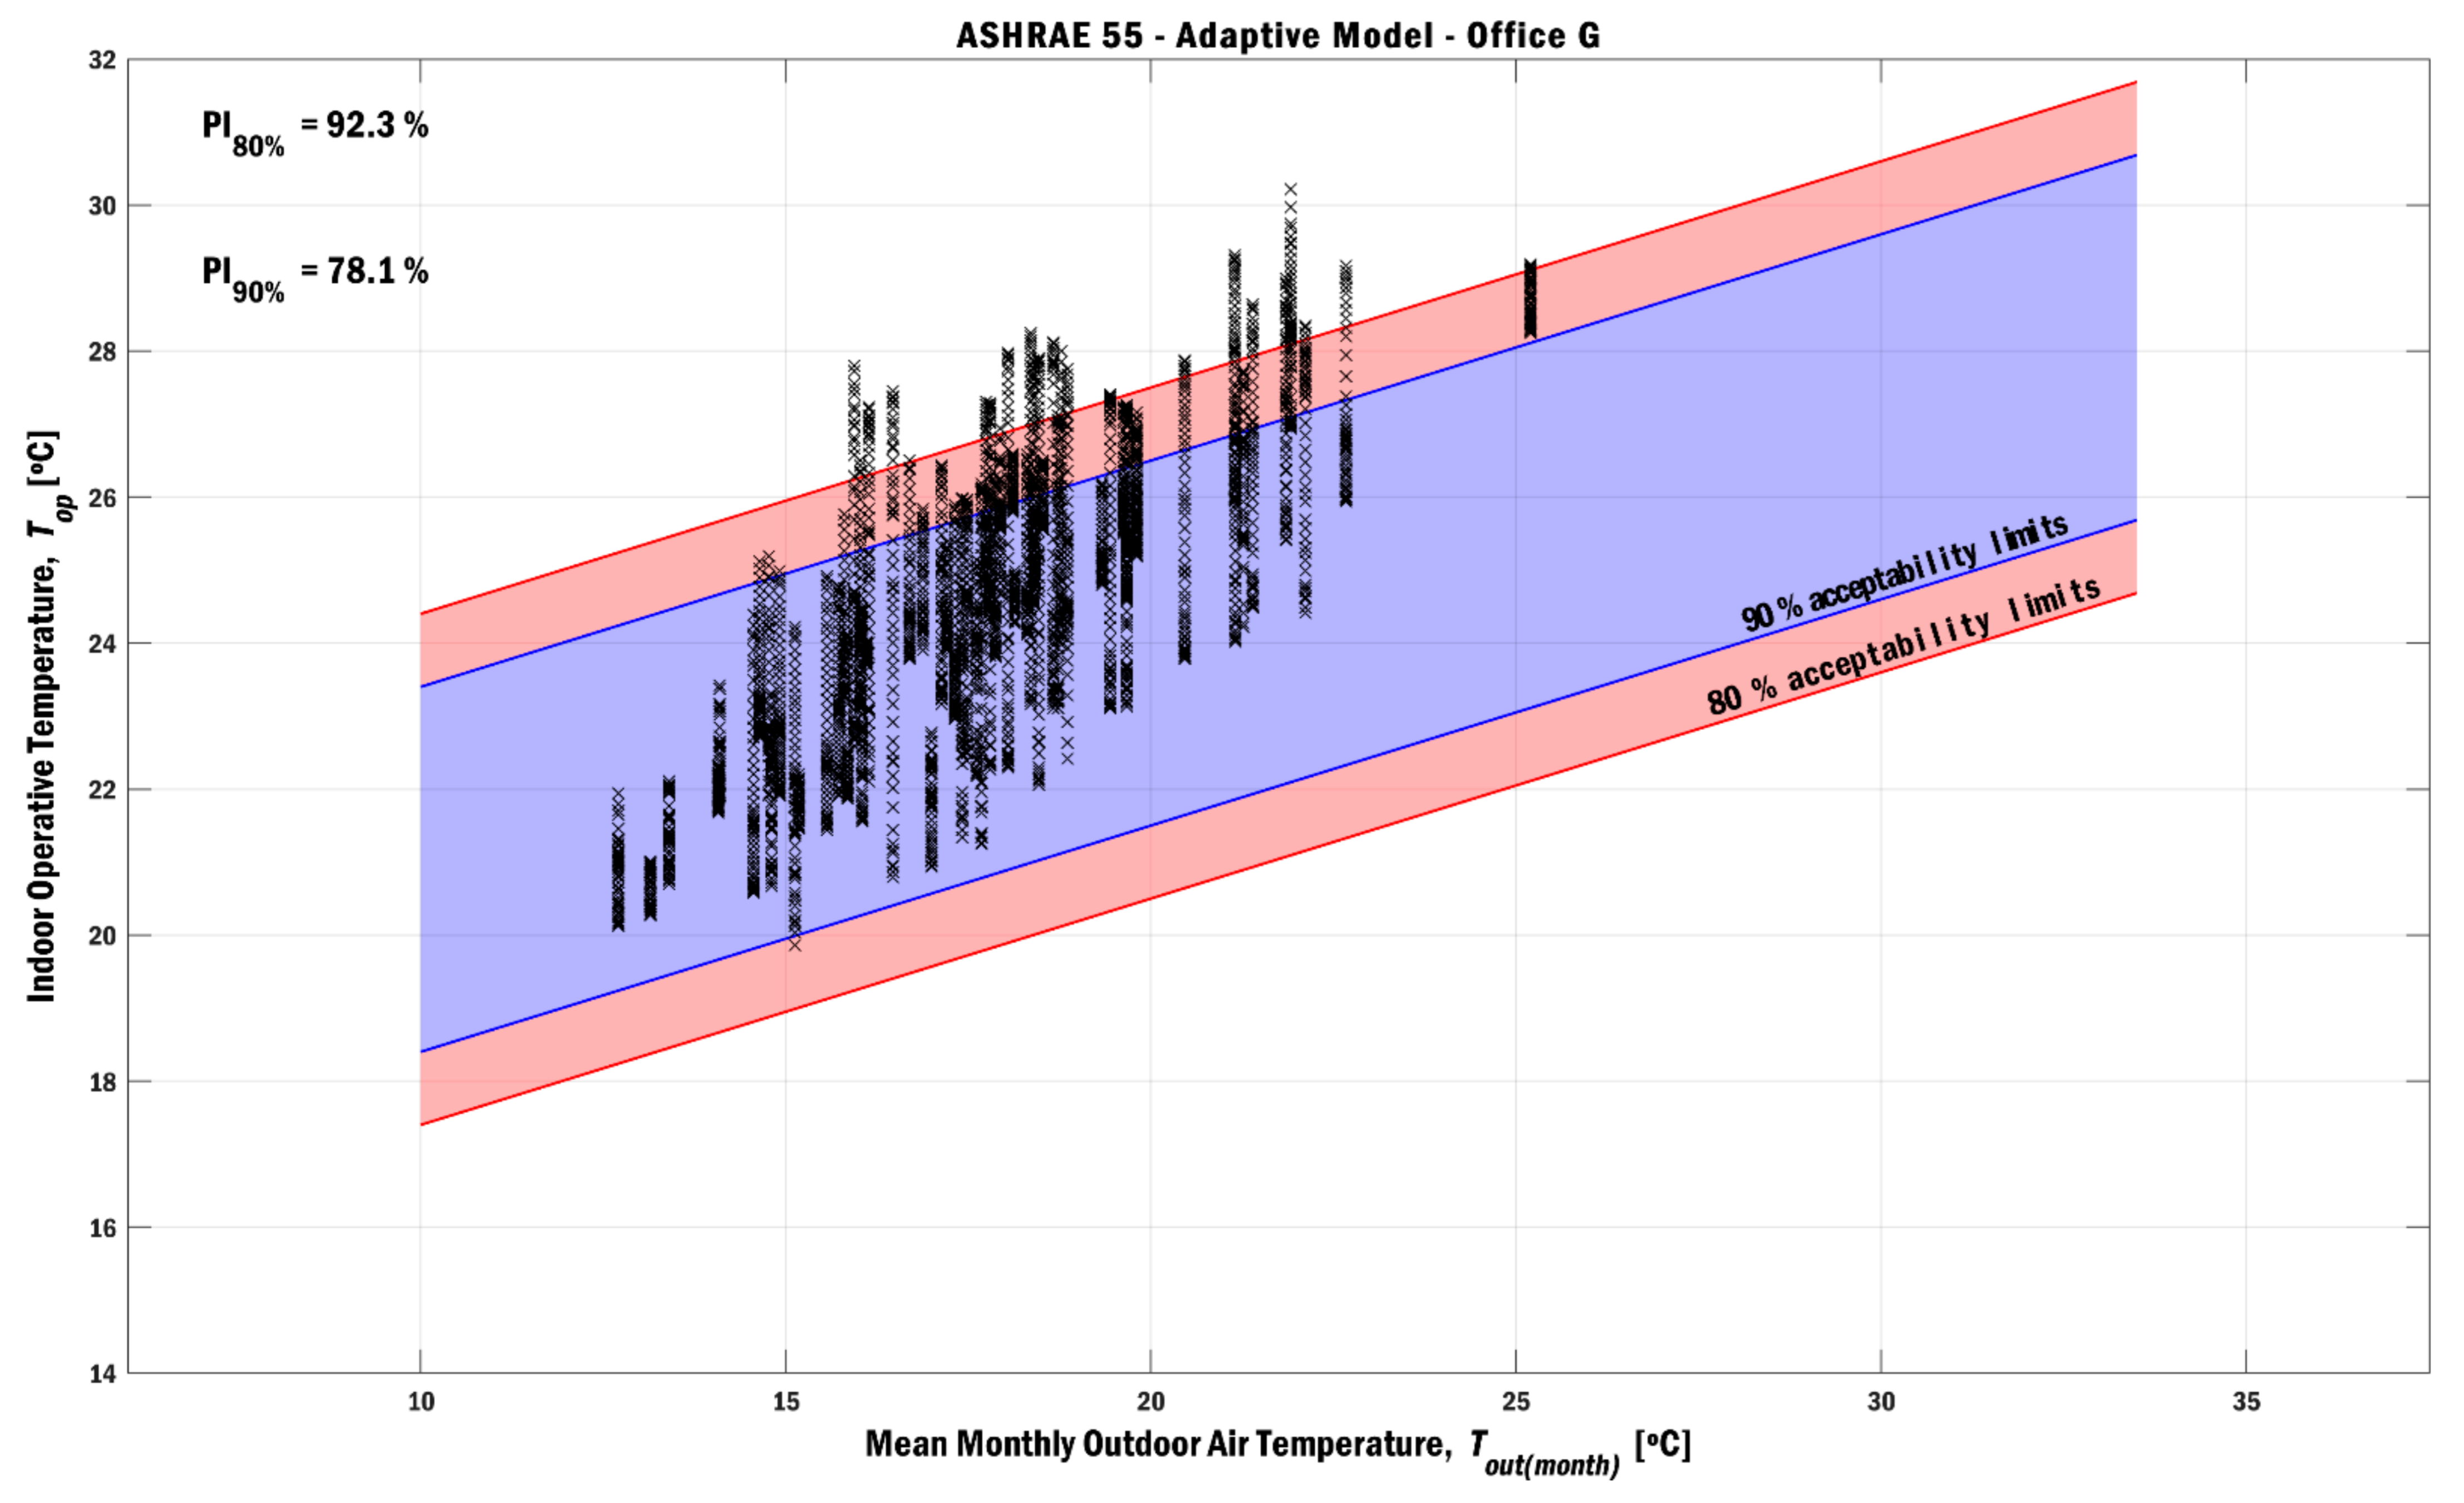
3.4. Thermal Comfort—Adaptative Model

As the adaptive model has a broader criterion, because it results from our perception of comfort based on the clothing and human body adaptation to the external environment, it is expected that the results would suggest better thermal comfort conditions.
Through the analysis of Figure 5 (distribution of the measured values in Office G) it is observed that for a substantial part of the time (78.1%), the thermal conditions were within the limit to satisfy 90% of the occupants. However, as presented by the daily vertical lines (scattered points result of all the Top values), the limits suggested by ASHRAE 55 are often exceeded, affecting the occupants’ comfort during some period of the day, and consequently their work performance.
The achieved percentage of time (78.1%), in which the comfort condition is perceived by 90% of the occupants, lies between the results obtained in office G by the previous method for clothing insulations of 1.0 and 0.6, respectively: 48.6% (100–51.4% (bolded in Table S3 of the Supplementary Material)) and 83.2% (100–16.8% (bolded in Table 5)). Thus, both models are fairly in agreement with each other, a conclusion that does not cope with Ricciardi and Buratti [20] results, who found different results from adaptive approaches and Fanger’s model.

3.5. Thermal Comfort Subjective Assessment—Questionnaires

Subjective thermal sensation votes (TSV) of occupants were collected on 19 August 2020. Additionally, it was decided to conduct a more in-depth onsite monitoring campaign using the indoor climate analyzer. On this day, the maximum outdoor temperature registered was 30.2 °C, and the daily average was 23.5 °C. The maximum and mean outdoor temperature values were respectively, 27.9 °C and 26.3 °C, which represented a typical summer day.
Figure 6 shows (i) the evolution of the hygrothermal conditions throughout the day and (ii) the respective evolution of estimated comfort indices. In the latter, different levels of clothing were considered (maximum of 1.0 clo and minimum of 0.6 clo), thus resulting in maximum PMV indices of 1.38 and 1.02, which correspond to a sensation between ‘slightly hot’ and ‘hot’, and percentages of dissatisfaction of 44.6% and 26.8%, respectively.
The results obtained from the monitoring campaign corroborate those obtained by the analysis of the completed questionnaires. The TSV collected for each occupant were: 1.02, 1.32, 1.62, 1.68, 1.80, and 1.92—present in Table S5 of the Supplementary Material [25]. By comparison, it was observed that the values of the questionnaires were slightly more critical than those predicted by Fanger’s model (between 1.02 and 1.38).
Data was also assessed according to the adaptive model suggested in the ASHRAE 55 standard. As shown in Figure S1 of the Supplementary Material [25], the obtained results are considerably worse: only 55.8% of the monitoring time would be satisfactory for 90% of the occupants.

4. Discussion

The continuous monitoring campaign of the hygrothermal conditions highlighted previous occupants’ complaints of overheating. Many of these employees had already complained of thermal discomfort during the working hours in the cooling season. Thermal comfort subjective assessment, i.e., anonymized questionnaires answered by the occupants, confirmed the previously reported discomfort, also supported by the results numerically obtained of the estimated thermal comfort indices (PMV and PPD). It was verified that some procedures for passive ventilation and free cooling are practiced (see Section 3.1), but not adequately managed. In fact, after workers return to offices following the first pandemic lockdown, it was verified that most windows were left open after the 08:00–10:00 am period, even during the solar peak hours.
From the thermal comfort point of view, the following measures were proposed to mitigate extreme conditions:
  • reduce to half the number of desktops computers in offices C, E, G, and K;
  • installation of a local cooling unit in room A (server center) for the safety of the equipment and space, and to reduce thermal discomfort in the adjacent office B;
  • change to a users’ IT infrastructure based on servers (located in a specific and air-conditioned space), replacing desktops with individual terminals (mini PCs).
  • improve/educate and instruct natural ventilation procedures to occupants, in order to potentiate the use of the free cooling effect, especially in the hottest months (June, July, August, and September)—typically, suggesting windows opening at 08:00, and closure from 10:00 (as these were the coolest working hours outdoors). For the success of this measure, occupants should be instructed and motivated to take as reference the instantaneous data from a nearby weather station (and even the weather/temperature forecast, in the corresponding free-access platform).
Only the proper combination of all these measures will improve thermal comfort and reduce complaints. However, the authors recognize that it might not be enough, especially in warmer weeks sharing the same recommendation of Caro and Sendra [13] with a need to install HVAC systems.

5. Conclusions

The onsite monitoring campaigns of hygrothermal parameters carried out between May and September 2020, complemented with a detailed monitoring on 19 August allowed the assessment of the comfort conditions in office spaces in the administrative offices located in the old building of the Faculty of Medicine of the University of Coimbra, Coimbra, Portugal.
It became clear that most offices (especially collective ones) are not enough comfortable during the summer due to overheating, as a result of:
  • the building itself (thermal inertia; insufficient insulation) and exposure of its west façade to high solar radiation afternoon;
  • the heat generated by internal loads (occupancy and equipment);
  • the inadequate windows’ operation, open in periods of outdoor warm air.
The hygrothermal monitoring campaigns highlighted previous occupants’ complaints of overheating. Many of these employees had already complained of thermal discomfort during the working hours in the cooling season. Thermal comfort subjective assessment—i.e., anonymized questionnaires answered by the occupants, confirmed the previously reported discomfort, also supported by the obtained results of the estimated thermal comfort indices.
Several measures were proposed to mitigate the summer discomfort conditions due to overheated spaces. Authors note that only the correct combination of all the proposed measures can bring benefits for thermal comfort improvement. However, as most of these measures are essentially of passive/behavioral nature, authors recognize these might not be enough. In very warm weeks, with outdoor daily average temperatures above 24 °C ( T ¯ out, Table 4), the impact of external climate conditions is difficultly counteracted without mechanical cooling systems.
Based on the results obtained in this study, according to the criteria presented, it would be necessary to install HVAC systems, mainly in collective rooms, to guarantee thermal comfort requirements during the cooling season.

Supplementary Materials

The following are available online at https://0-www-mdpi-com.brum.beds.ac.uk/article/10.3390/su13084563/s1, Figure S1: Distribution of the performance indices (PI) in office G on 19 August 2020 for the two acceptable thermal comfort limits according to the ASHRAE 55 adaptive model; Table S1: Annual average climate data according to IPMA between 1971 and 2000; Table S2: Specification of monitoring equipment; Table S3: Weekly percentage of time in which the surveyed spaces did not provide comfort conditions due to overheating, in each week (1.0 clo); Table S4: Weekly summary of the obtained results concerning the weekly maximum PPD (1.0 clo). Color scale according to ISO 7730: red (uncomfortable), yellow (category C), Light green (category B), dark green (category A); Table S5: TSV collected from the questionnaires plotted along with estimated PMV. https://zenodo.org/record/4693183#.YHhW5OhKg2x, doi:10.5281/zenodo.4693183.

Author Contributions

Conceptualization, N.B.S., A.R.G., J.J.d.C. and L.D.P.; Methodology, N.B.S., A.R.G. and J.J.d.C. Investigation, N.B.S., A.R.G. and J.J.d.C.; Resources, N.B.S. and L.D.P.; Writing—original draft preparation, N.B.S. and L.D.P.; Writing—review and editing, N.B.S., A.R.G., J.J.d.C. and L.D.P.; Visualization, N.B.S. All authors contributed to the article and approved the submitted version. All authors have read and agreed to the published version of the manuscript.

Funding

This research received no external funding.

Institutional Review Board Statement

The study was conducted according to the guidelines of the Declaration of Helsinki. Nonetheless, ethical review and approval were waived for this study, due to the characteristics of the study: no medical experiments were performed on human; occupants’ data was collected under written given consent; data was anonymized.

Informed Consent Statement

Informed consent was obtained from all subjects involved in the study.

Data Availability Statement

The data presented in this study are available on request from the corresponding author.

Acknowledgments

The first author thanks the support to research by the Foundation for Science and Technology and MIT Portugal under 2020 MPP2030FCT Ph.D. Grant call. The research presented has been developed under the Energy for Sustainability Initiative of the University of Coimbra (UC) and in the framework of the project “BJUC-AHT—Monitorização e análise do ambiente interior na Biblioteca Joanina da Universidade de Coimbra”. This work was also carried out in the framework of Project UIDP/50022/2020—LAETA—Laboratório Associado de Energia, Transportes e Aeronáutica, with the financial support of FCT/MCTES through national funds (PIDDAC).

Conflicts of Interest

The authors declare no conflict of interest.

References

  1. Chen, C.S.; Chiu, Y.H.; Tsai, L. Evaluating the adaptive reuse of historic buildings through multicriteria decision-making. Habitat Int. 2018, 81, 12–23. [Google Scholar] [CrossRef]
  2. Berg, F.; Flyen, A.C.; Godbolt, Å.L.; Broström, T. User-driven energy efficiency in historic buildings: A review. J. Cult. Herit. 2017, 28, 188–195. [Google Scholar] [CrossRef] [Green Version]
  3. Lidelöw, S.; Örn, T.; Luciani, A.; Rizzo, A. Energy-efficiency measures for heritage buildings: A literature review. Sustain. Cities Soc. 2019, 45, 231–242. [Google Scholar] [CrossRef]
  4. de Santoli, L. Guidelines on energy efficiency of cultural heritage. Energy Build. 2015, 86, 534–540. [Google Scholar] [CrossRef]
  5. Coelho, G.B.A.; Entradas Silva, H.; Henriques, F.M.A. Impact of climate change in cultural heritage: From energy consumption to artefacts’ conservation and building rehabilitation. Energy Build. 2020, 224, 110250. [Google Scholar] [CrossRef]
  6. Foster, G. Circular economy strategies for adaptive reuse of cultural heritage buildings to reduce environmental impacts. Resour. Conserv. Recycl. 2020, 152, 104507. [Google Scholar] [CrossRef]
  7. Dias Pereira, L.; Tavares, V.; Soares, N. Up-to-date challenges for the conservation, rehabilitation and energy retrofitting of higher education cultural heritage buildings. Sustainability 2021, 13, 2061. [Google Scholar] [CrossRef]
  8. ASHRAE. ASHRAE Handbook—Fundamentals 2013; American Society of Heating Refrigerating and Air-Conditioning Engineers: Atlanta, GA, USA, 2013. [Google Scholar]
  9. Raimundo, A.M.; Saraiva, N.B.; Oliveira, A.V.M. Thermal insulation cost optimality of opaque constructive solutions of buildings under Portuguese temperate climate. Build. Environ. 2020, 182, 107107. [Google Scholar] [CrossRef]
  10. Rodrigues, C.; Freire, F. Adaptive reuse of buildings: Eco-efficiency assessment of retrofit strategies for alternative uses of an historic building. J. Clean. Prod. 2017, 157, 94–105. [Google Scholar] [CrossRef]
  11. Blázquez, T.; Ferrari, S.; Suárez, R.; Sendra, J.J. Adaptive approach-based assessment of a heritage residential complex in southern Spain for improving comfort and energy efficiency through passive strategies: A study based on a monitored flat. Energy 2019, 181, 504–520. [Google Scholar] [CrossRef]
  12. Barbadilla-Martín, E.; Lissén, J.M.S.; Martín, J.G.; Aparicio-Ruiz, P.; Brotas, L. Field study on adaptive thermal comfort in mixed mode office buildings in southwestern area of Spain. Build. Environ. 2017, 123, 163–175. [Google Scholar] [CrossRef]
  13. Caro, R.; Sendra, J.J. Evaluation of indoor environment and energy performance of dwellings in heritage buildings. The case of hot summers in historic cities in Mediterranean Europe. Sustain. Cities Soc. 2020, 52, 101798. [Google Scholar] [CrossRef]
  14. Rieser, A.; Pfluger, R.; Troi, A.; Herrera-Avellanosa, D.; Thomsen, K.; Rose, J.; Arsan, Z.; Akkurt, G.; Kopeinig, G.; Guyot, G.; et al. Integration of Energy-Efficient Ventilation Systems in Historic Buildings—Review and Proposal of a Systematic Intervention Approach. Sustainability 2021, 13, 2325. [Google Scholar] [CrossRef]
  15. Zhang, Q.; Yan, D.; An, J.; Hong, T.; Tian, W.; Sun, K. Spatial distribution of internal heat gains: A probabilistic representation and evaluation of its influence on cooling equipment sizing in large office buildings. Energy Build. 2017, 139, 407–416. [Google Scholar] [CrossRef] [Green Version]
  16. Wang, Z.; Hong, T.; Piette, M.A. Data fusion in predicting internal heat gains for office buildings through a deep learning approach. Appl. Energy 2019, 240, 386–398. [Google Scholar] [CrossRef] [Green Version]
  17. O’Connor, D.; Calautit, J.K.S.; Hughes, B.R. A review of heat recovery technology for passive ventilation applications. Renew. Sustain. Energy Rev. 2016, 54, 1481–1493. [Google Scholar] [CrossRef]
  18. Mustapa, M.S.; Zaki, S.A.; Rijal, H.B.; Hagishima, A.; Ali, M.S.M. Thermal comfort and occupant adaptive behaviour in Japanese university buildings with free running and cooling mode offices during summer. Build. Environ. 2016, 105, 332–342. [Google Scholar] [CrossRef]
  19. Zhou, X.; Liu, T.; Shi, X.; Jin, X. Case study of window operating behavior patterns in an open-plan office in the summer. Energy Build. 2018, 165, 15–24. [Google Scholar] [CrossRef]
  20. Ricciardi, P.; Buratti, C. Thermal comfort in open plan offices in northern Italy: An adaptive approach. Build. Environ. 2012, 56, 314–320. [Google Scholar] [CrossRef]
  21. Roccotelli, M.; Rinaldi, A.; Fanti, M.P.; Iannone, F. Building Energy Management for Passive Cooling Based on Stochastic Occupants Behavior Evaluation. Energies 2020, 14, 138. [Google Scholar] [CrossRef]
  22. University of Coimbra. University of Coimbra—Alta and Sofia|Main Buildings—Faculty of Medicine. Available online: https://www.uc.pt/ruas/inventory/mainbuildings/medicinas (accessed on 19 March 2021).
  23. UNESCO. University of Coimbra—Alta and Sofia. 2013. Available online: https://whc.unesco.org/en/list/1387/ (accessed on 8 December 2020).
  24. IPMA. Coimbra: Climate Datasheet—Statistical Data 1971–2000; Instituto Português do Mar e da Atmosfera: Lisbon, Portugal, 2021. [Google Scholar]
  25. Baía Saraiva, N.; Dias Pereira, L.; Gaspar, A.R.; Costa, J.J. Supplementary Data to Barriers on Establishing Passive Strategies in Office Spaces: A Case Study in a Historic University Building. 2021. Available online: https://zenodo.org/record/4693183#.YHgfwOhKg2w (accessed on 15 April 2021). [CrossRef]
  26. Portaria n.o353-A/2013. Ordinance no353-A/2013 (in Portuguese: Regulamento de Desempenho Energético dos Edifícios de Comércio e Serviços (RECS)—Requisitos de Ventilação e Qualidade do Ar Interior). 2013. Available online: https://dre.pt/pesquisa/-/search/331868/details/maximized (accessed on 15 April 2021).
  27. ISO 7730. EN ISO 7730: 2005 Ergonomics of the Thermal Environment. Analytical Determination and Interpretation of Thermal Comfort Using Calculation of the PMV and PPD Indices and Local Thermal Comfort Criteria; International Standardisation Organisation: Geneve, Switzerland, 2005.
  28. ASHRAE. ANSI/ASHRAE Standard 55—Thermal Environmental Conditions for Human Occupancy—2013; American Society of Heating; Refrigerating and Air-Conditioning Engineers: Atlanta, GA, USA, 2017. [Google Scholar]
  29. Fanger, P.O. Thermal Comfort: Analysis and Applications in Environmental Engineering; McGraw-Hil: New York, NY, USA, 1972. [Google Scholar]
  30. Roaf, S.; Humphreys, M.; Nicol, F. Adaptive Thermal Comfort: Principles and Practice; Routledge: London, UK, 2012. [Google Scholar]
  31. de Carvalho, P.M.; Gameiro da Silva, M.; Esteves, J. Influence of weather and indoor climate on clothing of occupants in naturally ventilated school buildings. Build. Environ. 2013, 59, 38–46. [Google Scholar] [CrossRef]
  32. WMA Declaration of Helsinki—Ethical Principles for Medical Research Involving Human Subjects. 2018. Available online: https://www.wma.net/policies-post/wma-declaration-of-helsinki-ethical-principles-for-medical-research-involving-human-subjects/ (accessed on 19 March 2021).
Figure 1. University of Coimbra—Alta and Sofia. The old building of the Faculty of Medicine is evidenced in red (UNIVERSIDADE DE COIMBRA, COIMBRA, PORTUGAL © 2021, [22]).
Sustainability 13 04563 g001
Figure 2. Old building of the FMUC: (a) Western façade of the building—the red rectangle highlights the studied offices; (b) Ground floor plan—distribution of the studied offices and location of the hygrothermal sensors.
Sustainability 13 04563 g002
Figure 3. Time series of Ta and RH and the respective PMV and PPD for 1.0 clo during week 9 for office G.
Sustainability 13 04563 g003
Figure 4. Time series of Ta and RH and the respective PMV and PPD for 1.0 clo during week 10 for office I.
Sustainability 13 04563 g004
Figure 5. Distribution of the performance indices (PI) in office G, for the two acceptable thermal comfort limits according to the ASHRAE 55 adaptive model.
Sustainability 13 04563 g005
Figure 6. Time evolution of the monitored hygrothermal parameters (Ta and RH) in office G on 19 August 2020; and estimated PMV and PPD indices for different clothing levels from 0.6 and 1.0 clo.
Sustainability 13 04563 g006
Table 1. Specification of monitoring equipment.
EquipmentParameterRangeAccuracy
Hygrothermal
sensors
Air temperature, Ta (°C)(−20–70) °C(0–50 °C): ± 0.35 °C
Relative humidity, RH (%)(5–95)%(10–90%): 2.5%
Indoor climate
analyzer
Air temperature, Ta (°C)(−20–50) °C(5–40 °C): ± 0.20 °C
Dew point temperature, Tdew (°C)TaTdew < 25 °CTaTdew < 10 °C: ± 0.5 °C
10 °C < TaTdew < 25 °C: ± 1.0 °C
Radiant temperature asymmetry, Tr (°C)Ta ± 50 °C(−15 °C < TrTa < 15 °C): ± 0.5 °C
Air velocity, va (m/s)(0.05–1) m/s± 5% ± 0.05 m/s
Table 2. Summary of office characteristics (ceiling height: 2.5~3.0 m).
OfficeOccupancyEquipmentArea (m2)Occupancy Density (Person/m2)
A01 Server17.50-
B11 Desktop
2 Luminaries
18.350.05
C99 Desktop
6 Luminaries
1 Printer
66.690.13
D11 Desktop
3 Luminaries
28.200.04
E1414 Desktop
9 Luminaries
84.040.17
F22 Desktop
3 Luminaries
28.200.07
G1919 Desktop
12 Luminaries
118.960.16
H51 Desktop
3 Luminaries
18.350.04
I44 Desktop
3 Luminaries
28.200.14
J11 Desktop
3 Luminaries
28.200.04
K77 Desktop
7 Luminaries
41.700.17
Table 3. Internal heat generation density in each office operating in total capacity and the respective percentage of variables (workers and desktops) that can be managed.
Internal Heat LoadBCDEFGHIJK
Thermal power (W/m2)14.9333.2410.8538.4118.3036.7710.8533.1910.8540.62
People44%49%39%52%47%52%39%51%39%50%
Desktop33%37%29%39%35%39%29%38%29%37%
People + Desktop77%85%68%91%81%91%68%89%68%87%
Table 4. Weekly averages of Ta for each office room while occupied and T ¯ out for the same period of the working day (the signaled rectangles represent the highest values).
T ¯ aABCDEFGHIJK T ¯ out
Week125.0521.6621.3820.9521.6021.3021.9121.8122.0120.8421.1319.12
224.6721.1720.7720.5121.2320.9221.5021.5021.6520.3620.8320.20
327.0123.4823.2022.6523.7523.3223.8123.8524.1022.7522.7924.88
429.0525.5624.9924.8826.0125.5225.3625.6325.2724.8424.8623.57
526.2322.9122.7422.8223.5823.2723.1823.1122.8322.5922.7018.89
625.8523.0222.2221.7522.4222.5222.1922.3722.0821.6422.0320.35
727.5524.4523.4223.0923.7824.1824.3323.4923.4022.9723.1922.34
828.2225.0824.0523.8324.5024.8424.5223.8923.9424.0223.8824.31
929.9126.0225.5125.4026.0525.9225.8625.7326.0425.6425.6527.07
1031.9728.0427.5527.3728.0727.9228.0427.4328.1427.5227.4330.07
1130.2426.6425.9325.7025.7425.6425.7925.5925.8225.8225.7724.29
1229.70-25.6825.2325.2725.0825.1125.0625.1825.1325.0624.29
1329.46-25.3124.6124.4524.5324.5124.6624.5824.6724.6122.67
1429.71-25.4724.5725.0424.8625.0324.2824.9724.6524.5423.65
1529.40-24.9724.6624.6424.6824.8524.1624.5424.4324.2722.98
1630.03-25.4825.0825.4724.9525.3624.9625.2524.7424.8027.62
Avg28.3824.3724.2923.9424.4824.3424.4624.2224.3623.9123.97-
Table 5. Weekly percentage of time in which the offices did not provide comfort conditions due to overheating (0.6 clo).
% Discomfort TimeBCDEFGHIJK
Week10.00.00.00.00.00.00.00.00.00.0
20.00.00.00.00.00.00.00.00.00.0
30.70.00.02.10.02.60.02.60.00.0
411.03.60.018.810.219.89.88.30.01.2
50.00.00.00.00.00.00.00.00.00.0
60.00.00.00.00.00.00.00.00.00.0
73.10.00.00.02.66.70.00.00.00.0
89.34.10.05.58.413.80.74.80.00.0
933.619.15.737.420.240.220.737.610.018.3
10100.092.687.491.794.892.682.997.196.788.8
1159.821.06.222.117.631.21.031.210.013.3
12-16.41.218.10.020.51.714.81.20.5
13-2.60.00.00.02.40.00.70.00.0
14-6.40.04.30.07.60.01.40.00.0
15-8.30.54.32.115.50.01.40.00.0
16-6.20.015.70.016.01.06.21.01.4
Avg19.311.36.313.89.816.87.412.97.47.7
Table 6. Weekly summary of the obtained results concerning the maximum PPD (0.6 clo). Color scale, according to ISO 7730: red (uncomfortable); yellow (category C), light green (category B), dark green (category A).
% Discomfort TimeBCDEFGHIJK
Week15.16.77.55.26.26.95.05.49.76.5
25.16.18.55.05.57.05.07.18.35.8
316.48.26.618.612.320.315.320.97.78.6
427.119.113.840.825.749.826.221.314.618.3
57.65.15.07.15.66.55.05.05.35.1
610.25.96.55.75.26.65.05.76.16.0
720.39.95.615.227.724.613.511.67.36.8
825.820.48.745.125.237.717.123.812.214.2
935.029.520.553.729.745.157.650.329.633.4
1052.253.341.186.052.259.742.866.441.473.0
1140.024.222.034.922.833.316.030.122.021.1
12-24.017.427.912.852.416.827.116.315.4
13-17.012.212.69.717.29.716.110.49.9
14-24.811.320.813.732.46.717.611.511.0
15-21.615.417.817.343.67.816.012.012.4
16-17.814.232.411.623.523.519.221.516.6
Avg22.218.413.526.817.729.217.121.514.816.5
Publisher’s Note: MDPI stays neutral with regard to jurisdictional claims in published maps and institutional affiliations.

