
Elevated Tropospheric Ozone Concentration Alters Soil CO2 Emission: A Meta-Analysis


1
Institute of Resources and Environmental Sciences, School of Metallurgy, Northeastern University, Shenyang 110819, China
2
Institute of Applied Ecology, Chinese Academy of Sciences, Shenyang 110016, China
3
Ministry of Education Key Lab for Eco-Restoration of Contaminated Environment, Shenyang University, Shenyang 110044, China
*
Authors to whom correspondence should be addressed.
Sustainability 2021, 13(8), 4571; https://0-doi-org.brum.beds.ac.uk/10.3390/su13084571
Submission received: 2 April 2021
/
Revised: 15 April 2021
/
Accepted: 17 April 2021
/
Published: 20 April 2021
(This article belongs to the Section Air, Climate Change and Sustainability)
Abstract
:Elevated tropospheric ozone (O3) concentration may substantially influence the below-ground processes of terrestrial ecosystems. Nevertheless, a comprehensive and quantitative understanding of O3 impacts on soil CO2 emission remains elusive, making the future sources or sinks of soil C uncertain. In this study, 77 pairs of observations (i.e., elevated O3 concentration treatment versus control) extracted from 16 peer-reviewed studies were synthesized using meta-analysis. The results depicted that soil CO2 efflux was significantly reduced under short-term O3 exposure (≤1 year, p < 0.05), while it was increased under extended duration (>1 year, p < 0.05). Particularly, soil CO2 emission was stimulated in nonagricultural ecosystems, in the free-air CO2 enrichment (FACE) experiment, and in the soils of lower pH. The effect sizes of soil CO2 efflux were significantly positively correlated with experimental duration and were significantly negatively correlated with soil pH, respectively. The ozone effect on soil CO2 efflux would be enhanced at warm temperatures and high precipitation. The duration of O3 exposure was the fundamental factor in analyzing O3 impacts on soil CO2 emission.
1. Introduction
Ozone (O3) in the troposphere is not just a greenhouse gas but also an air pollutant that is prejudicial to human health and injures vegetation [1,2]. Tropospheric O3 concentrations (hereinafter referred to as [O3]) have significantly increased by 1–2% per year in recent decades due to accelerated industrial development and intensive combustion of fossil fuels [3].
As a highly oxidizing phytotoxic pollutant, O3 could inhibit plant growth and cause considerable reduction in crop yields and quality [4]. Moreover, elevated [O3] may impact the C allocation to roots [5], alter the rhizodeposition [6], change the quantity and composition of root exudate [7], modify the nutrient and energy supply to soil microorganisms [8], influence the microbial community diversity [9,10], and accordingly, influence soil CO2 emission flux [11,12].
The rising levels of atmospheric O3 make it difficult to assess the future soil C source/sink function. A few studies have reported increased CO2 efflux under elevated [O3] [13,14,15,16], but there are also results to the contrary [11,17]. These inconsistencies could be attributed to the variations in ecosystem type [18], O3 exposure duration [19], fumigation facility [15], and the complexity of soil and climate conditions [20].
The purposes of this study were (1) to assess the responses of soil CO2 emission flux to elevated [O3] using meta-analytic techniques and (2) to reveal the possible sources of variation.
2. Materials and Methods
2.1. Data Sources
All peer-reviewed literature on soil CO2 emissions with reference to elevated O3 concentration were extensively searched through Scopus (https://www.scopus.com (accessed on 19 February 2021)) and ISI Web of Science (http://apps.webofknowledge.com (accessed on 19 February 2021)) with the following key terms: (O3 OR ozone) AND (soil OR rhizosphere* OR terrestrial OR land) AND (carbon dioxide OR respiration* OR CO2) AND (elevate* OR impact* OR affect* OR effect* OR alter* OR respond* OR decrease* OR increase*). The relevant Chinese literature were searched through the China National Knowledge Infrastructure Database (CNKI) (http://www.cnki.net/ (accessed on 19 February 2021)). The search produced a total of 293 publications in ISI, 244 publications in Scopus, and 279 publications in CNKI. After examining the relevance, eliminating the duplications in both ISI and Scopus, and cross-checking the reference lists to avoid missing relevant studies, 28 publications were identified for further screening.
Data in the published sources were screened according to the following criteria: (1) only field studies were included; (2) experiments of control (ambient [O3]) and O3 enrichment treatments were carried out at the same site, with similar microclimate, vegetation and initial soil conditions; (3) the means, standard deviation (SD), and replicate numbers (n) could be obtained; (4) the facilities of O3 fumigation were open top chamber (OTC) or free-air O3 concentration enrichment (FACE); (5) publications and their measurements were excluded if the data were reported more completely in another source. According to these criteria, 7 studies based on pot-plants and 5 studies of root respiration or emissions from soil-plant ecosystems were excluded. The final database consisted of 16 articles published between 2001 and 2019, including 13 papers indexed by both ISI and Scopus and 3 studies indexed by CNKI (Appendix A). The data were acquired from 10 experiments performed at 32°03′ N to 62°39′ N latitude and 88°12′ W to 119°42′ E longitude. The mean annual temperature (MAT) ranged from 4.9 °C to 22.5 °C, and the mean annual precipitation (MAP) ranged from 307 mm to 1200 mm. The average increment in [O3] across all studies was 23 ± 10 nL/L.
In the present study, the cumulative or average soil CO2 efflux over a year or across a growing season was included as a single data point [21,22]. Thus, if the original study put forward the temporal dynamics of the variable, the annual or growing-seasonal averaged mean () and standard error () were calculated as [23]
where j is the observation times with each year or growing season (≥2), and Mi, SEi, and ni represent mean, standard error, and sample size in the ith observation, respectively.
Soil CO2 efflux data were considered to be independent if they referred to multiple O3 levels or to different additional treatments within a single study [24]. Values from context or tables were directly obtained, and data from the figures were digitized and extracted using GetData Graph Digitizer version 2.24 (http://getdata-graph-digitizer.com (accessed on 26 March 2008)). The unidentified error bar was assumed to be standard error [25]. Unidentified replicate numbers were assumed to be the replication of the plot [25]. The detailed dataset could be found in the Mendeley Data (doi:10.17632/jxfkh54hkh.1).
To explain variations in the responses of soil CO2 efflux to elevated [O3], the following categorical variables were chosen: (1) O3 level: low (≤1.5 × ambient [O3]), high (>1.5 × ambient [O3]); (2) exposure duration: short (duration ≤ 1 year), medium (1 year < duration ≤ 5 year), long (duration > 5 year); (3) soil pH: pH ≤ 6.0 and pH > 6; (4) ecosystem types: agricultural and nonagricultural; (5) fumigation methods: FACE and OTC. Meanwhile, information such as source of data, study site, latitude, longitude, soil texture, and climate was acquired directly from the selected papers or their references (Mendeley Data, doi:10.17632/jxfkh54hkh.1).
2.2. Analysis
The meta-analyses were performed using MetaWin 2.1 software (Sinauer Associates, Inc., Sunderland, MA, USA [26]). For each pair of observation, the effect size and variance were calculated as
where lnR is the effect size; XE and XC are annual or growing-seasonal averaged means in the experimental (elevated [O3]) and control treatments, respectively; nE and nC are the replicate numbers; and SDE and SDC are the standard deviations.
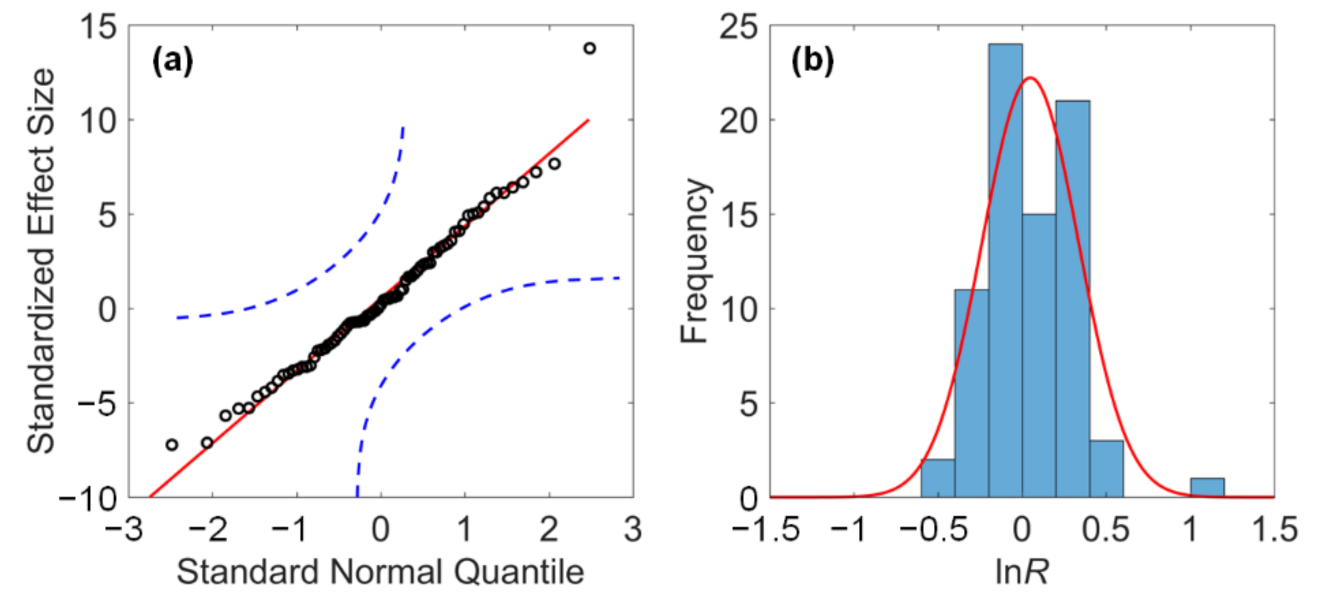
Before proceeding with the weighted analyses, normal quantile plots and the frequency distributions of lnR (Figure 1) were plotted to check the data normality [27]. A weighted random-effects model was used to calculate the overall and grouped effect size [28]. The 95% bias-corrected confidence intervals (CIs) around the effect size were assessed using a bootstrapped resampling technique with 64,999 iterations. The response to elevated [O3] was considered significant if the 95% bootstrapped CIs did not overlap zero. The O3-induced percentage change was calculated as (R−1) × 100% [24]. Positive percentage change indicates an increase in the soil CO2 efflux in response to elevated [O3], and a negative value indicates a decrease.
The total heterogeneity of each variable (QT) was tested against a χ2-distribution with n−1 degrees of freedom (Table 1) [26]. It was also assessed using an I2 index that quantifies the ratio of true variation caused by real differences between studies to total variation (true variation + sampling error) (Table 1) [29]. A positive I2 value indicates true heterogeneity [30]. Afterwards, the categorical analysis was proceeded across all data by dividing the total heterogeneity (QT) into the within-group heterogeneity (QW) and between-group heterogeneity (QB). The dataset was then subdivided into different levels if the QB of categorical variables was significant, i.e., the randomized p-values < 0.05 (Table 1) [31]. Significant differences between two levels were reported if their 95% bootstrapped CIs did not overlap [32].
A continuous meta-analysis model was employed to examine the relationship between lnR and environmental or forcing factors, such as duration of ozone exposure, soil pH, MAT, and MAP. Weighted regressions were used to test whether the slopes differed from zero using a parametric mixed model approach [26]. The regression relationship was considered significant if p < 0.05.
The possibility of publication bias within each group was firstly evaluated statistically with Kendall’s tau rank correlation and Spearman’s rho rank correlation between the standardized effect size and replicate number of each study (Table 2) [26]. Then, a Rosenthal’s fail-safe number at α = 0.05 was calculated (Table 2) [33]. A publication bias was confirmed only if all above methods showed positive results simultaneously (namely, if rank correlation tests were significant (p < 0.05) and Rosenthal’s fail-safe number less was than 5k + 10, where k is the observation number).
3. Results and Discussion
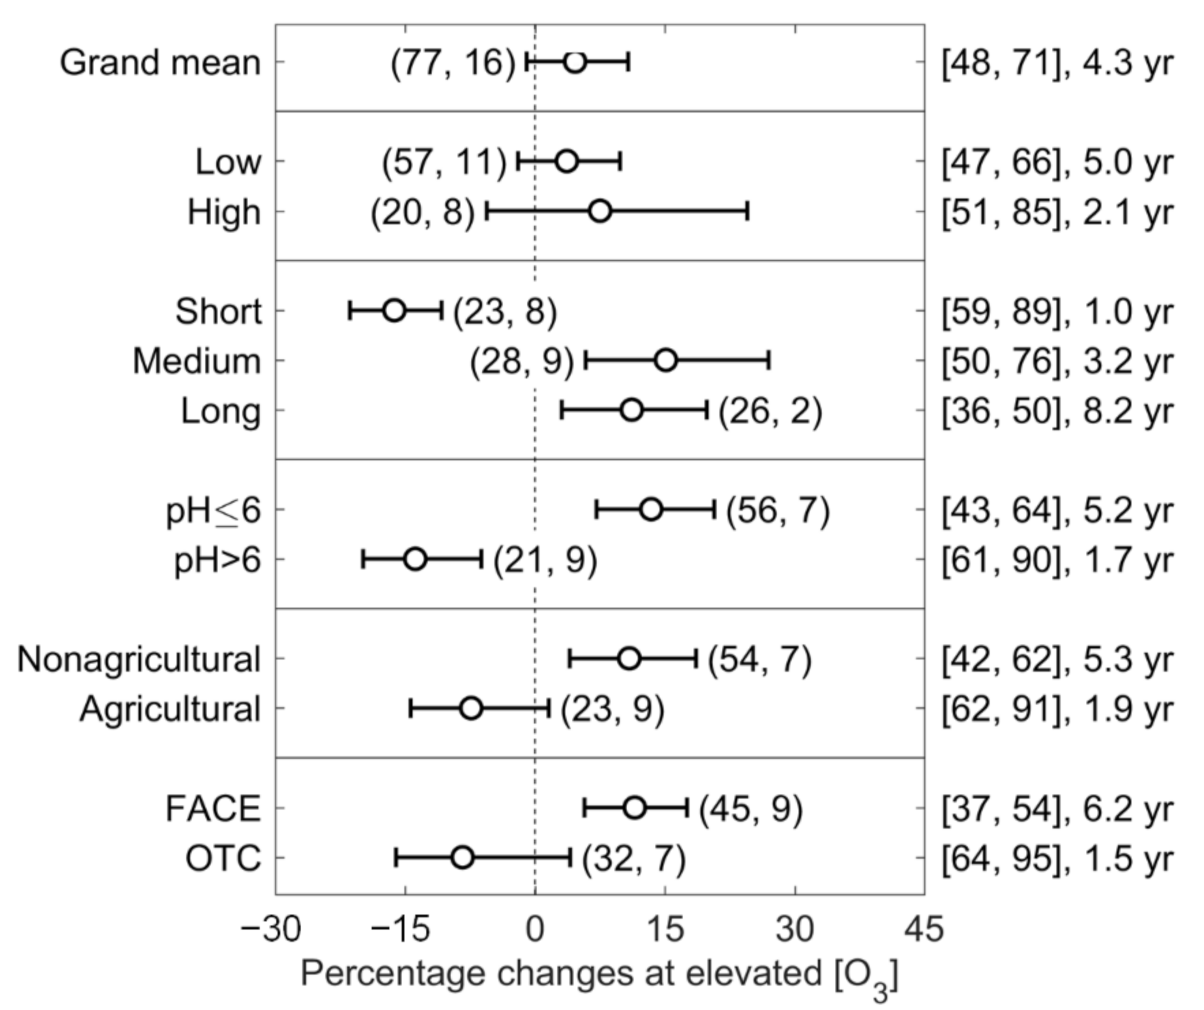
Although soil CO2 efflux shows an increasing trend (4.6%) at elevated [O3] compared with the control [O3] across all studies (the grand mean change in Figure 2), it did not reach a significant level since its bias-corrected 95% bootstrapped Cis overlapped zero. However, the significant QT (p < 0.05) and positive I2 values suggested heterogeneity among studies (Table 1). The QB values of most groups were significant, except for the O3 level category (Table 1), which implied that the responses magnitudes of soil CO2 efflux to elevated [O3] were affected by O3 experimental duration, ecosystem type, soil pH, and fumigation method.
3.1. Effect of O3 Exposure Duration
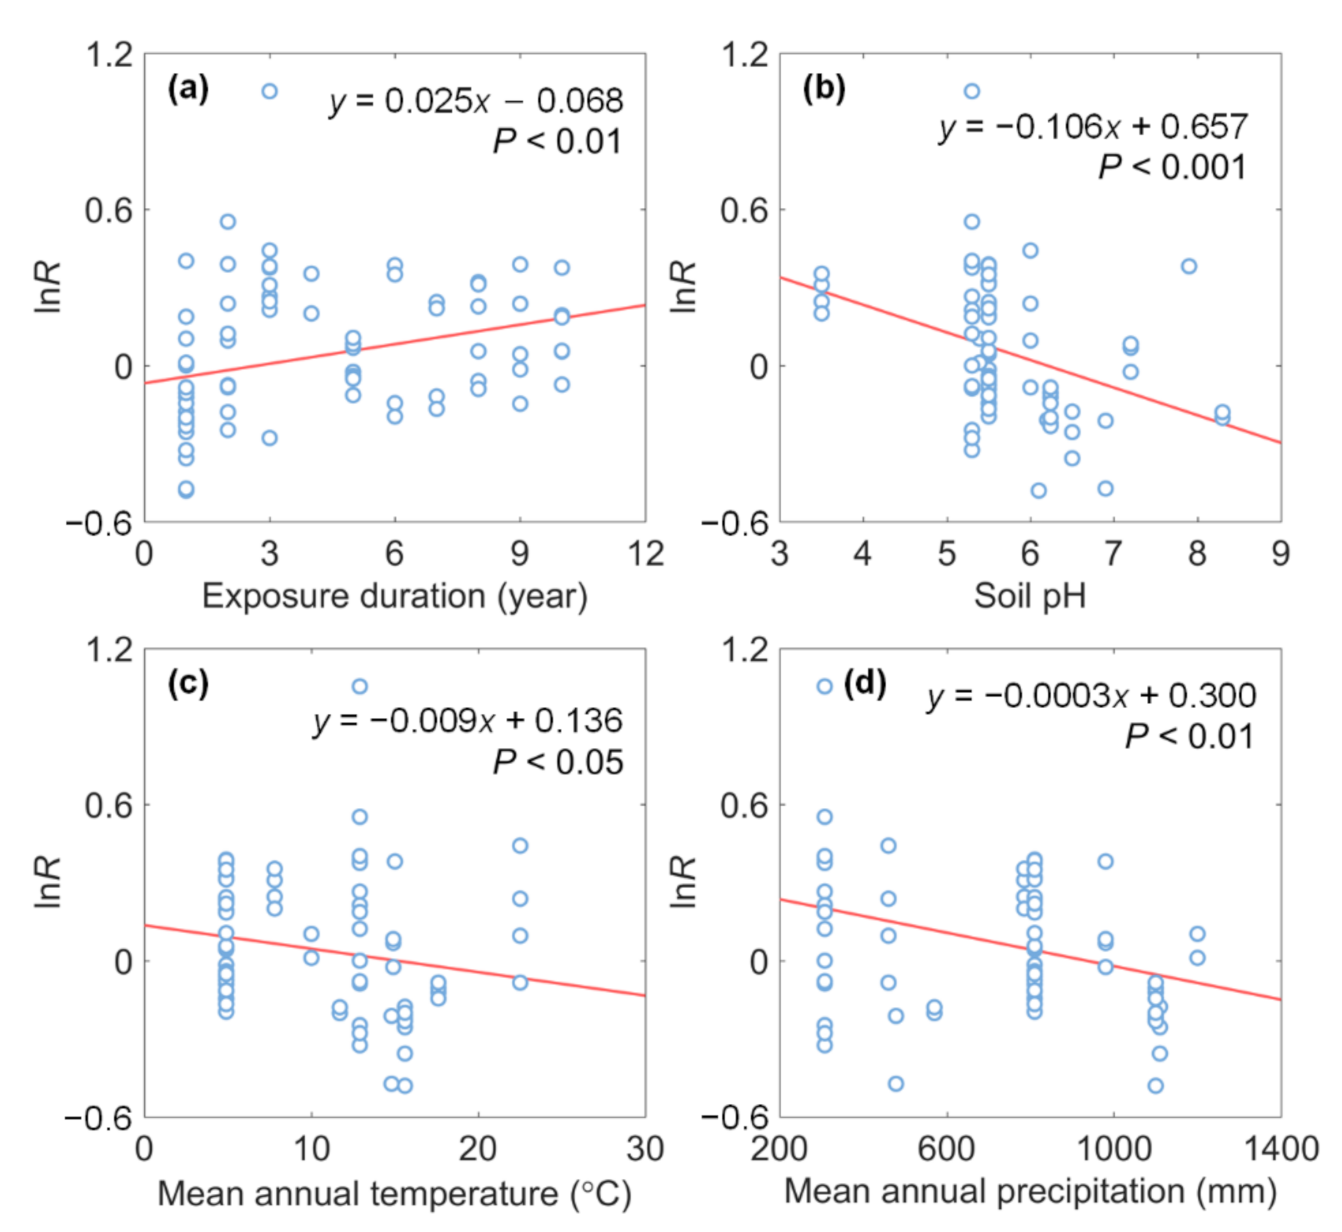
As illustrated in Figure 2, there were significant differences in the responses of soil CO2 efflux to elevated [O3] among three O3 exposure duration levels. Statistically significant increases in soil CO2 efflux were found in both medium (15.1%) and long (11.2%) O3 fumigation (p < 0.05), while the opposite was observed in the short-term exposure (−16.3%, p < 0.05). The weighted meta-regression analysis showed a significantly positive correlation between lnR and O3 exposure duration (p < 0.01, Figure 3a), which also showed that prolonged O3 exposure could stimulate soil CO2 emission.
Elevated [O3] is known to influence the transport of photosynthates from leaves to roots, reduce the quantity of root residue and exudates, and decrease belowground carbon allocation from root exudates to soil labile carbon pools [34]. Therefore, soil carbon contents generally decreased under elevated [O3] [11]. This may explain the decreased soil CO2 efflux under short O3 fumigation (≤1 year) since soil organic matter is the main carbon source for soil respiration and the energy source of microbial activity [35]. However, the responses of belowground processes to elevated [O3] is much less and slower than that of aboveground processes. Short-term O3 exposure may give a false estimate of the O3 effects, and longer-term studies would be more meaningful when the experimental results are interpreted by cumulative status [36]. Pregitzer et al. [13] reported an increase in fine-root biomass over a long-time O3 exposure. The greater root biomass increased the autotrophic root component of soil respiration, and the root detritus increased the carbon source of soil microorganisms, hence improving the soil heterotrophic respiration. This may be the possible reason for the enhanced soil CO2 efflux under prolonged O3 exposure.
3.2. Effect of Soil pH
As shown in Figure 2, the pre-existing soil pH significantly affected the magnitude and even direction of soil CO2 responses to elevated [O3]: the O3 effect was positive in soils of pH ≤ 6.0 (13.4%), whereas it was significantly negative in soils of pH > 6 (−13.8%). There was also a significantly negative correlation between lnR and soil pH (p < 0.001, Figure 3b). O3 exposure duration was longer in the group of soil pH ≤ 6.0 (5.2 years) than that in the group of soil pH > 6.0 (1.7 years), indicating that exposure duration may influence the results of soil pH categorization. In other words, the regression relationship between soil CO2 efflux and soil pH may be essentially related to the regression relationships between soil CO2 efflux and O3 exposure duration.
3.3. Difference between Agricultural and Nonagricultural Ecosystems
In terms of ecosystem type, soil CO2 efflux in response to elevated [O3] was increased by 10.9% in nonagricultural soil and tended to decrease in agricultural soil (Figure 2). The O3 exposure duration for nonagricultural ecosystems (5.3 years) was generally longer than that for agricultural land (1.9 years). Extended O3 exposure duration may be beneficial to soil CO2 emissions. Moreover, crops on agricultural land are mostly annual plants. The reduced crop residue consequently decreased soil organic matter under O3 exposure, which may lead to a decrease in soil CO2 efflux (Figure 2) [14]. However, plants in nonagricultural ecosystems, such as forest and grassland, are mostly perennials and include both tolerant and sensitive species or genotypes. Over a relatively long time of O3 exposure, the tolerant species become more able to live and occupy the living space of sensitive species, resulting in a relatively increased total root biomass [13]. Greater root biomass would be conducive to soil autotrophic and heterotrophic soil respiration [13]. Consequently, the nonagricultural soil CO2 efflux increased and responded more significantly to elevated [O3] than the agricultural soil.
3.4. Effect of O3 Fumigation Method
There was a significant difference on O3-induced percentage change of soil CO2 efflux between fumigation methods. Elevated [O3] strongly increased soil CO2 efflux by 11.5% in FACE experiments but did not induce significant changes in OTC experiments. The duration of O3 exposure in FACE experiments (6.2 years) was generally longer than that in OTC experiments (1.5 years), and longer O3 fumigation was intended to exacerbate the O3 effect.
3.5. Effect of Climate Conditions
Weighted meta-regression analyses in Figure 3c,d showed that that the effect size of soil CO2 efflux was significantly negatively correlated with MAT (p < 0.05) and MAP (p < 0.01), respectively. This means the O3 effect on soil CO2 efflux was more detrimental (i.e., more negative effect sizes) in higher temperature and more precipitation areas.
Previous studies have reported contrasting effects of warming and O3 on plant physiology, rhizosphere chemical environment, and microbial communities [37,38]. However, the results of weighted meta-regression analyses in the present study revealed that the negative responses of soil CO2 efflux to elevated [O3] were generally enhanced in warmer areas. In addition, some studies showed that moderate drought might alleviate the O3 effects on photosynthesis, physiology, stomata characteristics, fine-root dynamics, and soil respiration [39]. In other words, the detrimental response of soil CO2 efflux to elevated [O3] would be enhanced at higher precipitation conditions, which is consistent with the negative meta-regression results in the present study.
4. Conclusions
Understanding the effects of elevated [O3] on soil CO2 emission is of great importance for assessing future soil C source/sink status since soil plays an important role in the global C budget. The present meta-analysis revealed that O3 exposure duration was an important factor that controlled the O3 effect on soil CO2 emission. Soil CO2 efflux was significantly reduced in short-term (≤1 year) O3 exposure but increased in prolonged (>1 year) duration. The response magnitudes of soil CO2 efflux to elevated [O3] were exacerbated in warm areas with high precipitation. The significantly stimulated soil CO2 emission in nonagricultural ecosystems, in the FACE experiment, and in the soils of pH ≤ 6.0 was associated with a longer experimental duration. Such responses need to be validated in further studies since the confounding effects among classes reduces the effectiveness of meta-analysis in generalizing across studies.
Author Contributions
Conceptualization, E.H. and W.Z.; methodology, E.H.; software, Z.R.; validation, E.H., Z.R. and S.X.; formal analysis, Z.R.; investigation, Z.R.; resources, W.Z.; data curation, E.H.; writing—original draft preparation, Z.R. and E.H.; writing—review and editing, E.H. and W.Z.; visualization, S.X.; supervision, S.X. and W.Z.; project administration, W.Z.; funding acquisition, S.X. and W.Z. All authors have read and agreed to the published version of the manuscript.
Funding
This research was funded by the National Natural Science Foundation of China, grant number 41977388, 32071597, 31870458 and 31670412, the Fundamental Research Funds for the Central Universities, grant number N2025008. The APC was funded by the Institute of Applied Ecology, Chinese Academy of Sciences.
Institutional Review Board Statement
Not applicable.
Informed Consent Statement
Not applicable.
Data Availability Statement
The detailed dataset for the present meta-analysis can be found in: Hu, E; Ren, Z; Zhang, W. Data for “Impact of elevated tropospheric ozone concentration on soil CO2 emission: a meta-analysis”, Mendeley Data, V1. 2021, doi:10.17632/jxfkh54hkh.1.
Acknowledgments
We thank Xiaoke Wang from the Research Center for Eco-Environmental Sciences, Chinese Academy of Sciences for the critical review of the manuscript.
Conflicts of Interest
The authors declare no conflict of interest.
Appendix A
The list of 16 papers from which the data were extracted for this meta-analysis.
- Pregitzer, K.S.; Burton, A.J.; King, J.S.; Zak, D.R. Soil respiration, root biomass, and root turnover following long-term exposure of northern forests to elevated atmospheric CO2 and tropospheric O3. New Phytol. 2008, 180, 153–161, doi:10.1111/j.1469-8137.2008.02564.x.
- King, J.S.; Pregitzer, K.S.; Zak, D.R.; Sober, J.; Isebrands, J.G.; Dickson, R.E.; Hendrey, G.R.; Karnosky, D.F. Fine-root biomass and fluxes of soil carbon in young stands of paper birch and trembling aspen as affected by elevated atmospheric CO2 and tropospheric O3. Oecologia 2001, 128, 237–250, doi:10.1007/s004420100656.
- Kou, T.; Hang, X.; Lam, S.K.; Chen, D.; He, J. Ozone pollution increases CO2 and N2O emissions in ozone-sensitive wheat system. Agron. J. 2018, 110, 496–502, doi:10.2134/agronj2017.09.0514.
- Shi, K. Effects of elevated ozone concentration on soil respiration, nitrification and denitrification in a farmland. Clim. Chang. Res. Lett. 2017, 6, 11–21, doi:10.12677/ccrl.2017.61002 (In Chinese).
- Zhang, Y.; Chen, S.; Wang, L.; Shen, X.; Hu, Z.; Shi, Y. Effects of elevated ozone concentration on soil respiration, nitrification and denitrification in a winter wheat farmland. Environ. Sci. 2010, 31, 2988–2994, doi:10.13227/j.hjkx.2010.12.039 (In Chinese).
- Hu, E.; Yuan, Z.; Zhang, H.; Zhang, W.; Wang, X.; Jones, S.B.; Wang, N. Impact of elevated tropospheric ozone on soil C, N and microbial dynamics of winter wheat. Agric. Ecosyst. Environ. 2018, 253, 166–176, doi:10.1016/j.agee.2017.11.010.
- Sánchez-Martín, L.; Bermejo-Bermejo, V.; García-Torres, L.; Alonso, R.; Cruz, A.D.L.; Calvete-Sogo, H.; Vallejo, A. Nitrogen soil emissions and belowground plant processes in Mediterranean annual pastures are altered by ozone exposure and N-inputs. Atmos. Environ. 2017, 165, 12–22, doi:10.1016/j.atmosenv.2017.06.030.
- Decock, C.; Chung, H.; Venterea, R.; Gray, S.B.; Leakey, A.D.B.; Six, J. Elevated CO2 and O3 modify N turnover rates, but not N2O emissions in a soybean agroecosystem. Soil Bio. Biochem 2012, 51, 104-114, doi:10.1016/j.soilbio.2012.04.015.
- Chen, S.; Zhang, Y.; Chen, H.; Hu, Z. Effects of elevated O3 on soil respiration in a winter wheat-soybean rotation cropland. Soil Res. 2012, 50, 500–506, doi:10.1071/sr11296.
- Kou, T.J.; Cheng, X.H.; Zhu, J.G.; Xie, Z.B. The influence of ozone pollution on CO2, CH4, and N2O emissions from a Chinese subtropical rice–wheat rotation system under free-air O3 exposure. Agric. Ecosyst. Environ. 2015, 204, 72–81, doi:10.1016/j.agee.2015.02.013.
- Wang, J.; Hayes, F.; Chadwick, D.R.; Hill, P.W.; Mills, G.; Jones, D.L. Short-term responses of greenhouse gas emissions and ecosystem carbon fluxes to elevated ozone and N fertilization in a temperate grassland. Atmos. Environ. 2019, 211, 204–213, doi:10.1016/j.atmosenv.2019.05.027.
- Kasurinen, A.; Kokko-Gonzales, P.; Riikonen, J.; Vapaavuori, E.; Holopainen, T. Soil CO2 efflux of two silver birch clones exposed to elevated CO2 and O3 levels during three growing seasons. Global Change Biol. 2004, 10, 1654–1665, doi:10.1111/j.1365-2486.2004.00841.x.
- Nikolova, P.S.; Andersen, C.P.; Blaschke, H.; Matyssek, R.; Haberle, K.H. Belowground effects of enhanced tropospheric ozone and drought in a beech/spruce forest (Fagus sylvatica L./Picea abies [L.] Karst). Environ. Pollut. 2010, 158, 1071–1078, doi:10.1016/j.envpol.2009.07.036.
- Yu, Y.; Lin, X.; Zhang, J.; Li, Q.; Zhu, J. Effect of elevated surface O3 concentration on soil microbial functional diversity in wheat field. Chin. J. Appl. Environ. Biol. 2012, 18, 309–314, doi:10.3724/sp.J.1145.2012.00309 (In Chinese).
- Pregitzer, K.; Loya, W.; Kubiske, M.; Zak, D. Soil respiration in northern forests exposed to elevated atmospheric carbon dioxide and ozone. Oecologia 2006, 148, 503–516, doi:10.1007/s00442-006-0381-8.
- Wang, Y.; Hu, Z.; Islam, A.R.M.T.; Chen, S.; Shang, D.; Xue, Y. Effect of warming and elevated O3 concentration on CO2 emissions in a wheat-soybean rotation cropland. Int. J. Env. Res. Public Health 2019, 16, doi:10.3390/ijerph16101755.
References
- Krupa, S.V.; Manning, W.J. Atmospheric ozone: Formation and effects on vegetation. Environ. Pollut. 1988, 50, 101–137. [Google Scholar] [CrossRef]
- Jerrett, M.; Burnett, R.T.; Arden Pope, I.C.; Ito, K.; Thurston, G.; Krewski, D.; Shi, Y.; Calle, E.; Thun, M. Long-term ozone exposure and mortality. N. Engl. J. Med. 2009, 360, 1085–1095. [Google Scholar] [CrossRef] [Green Version]
- Forster, P.; Ramaswamy, V.; Artaxo, P.; Berntsen, T.; Betts, R.; Fahey, D.; Haywood, J.; Lean, J.; Lowe, D.; Myhre, G.; et al. Changes in Atmospheric Constituents and in Radiative Forcing. In Climate Change 2007: The Physical Science Basis. Contribution of Working Group I to the Fourth Assessment Report of the IPCC. Chapter 2; Solomon, S., Qin, D., Manning, M., Chen, Z., Marquis, M., Averyt, K.B., Tignor, M., Miller, H.L., Eds.; Cambridge University Press: Cambridge, UK; New York, NY, USA, 2008; p. 212. [Google Scholar]
- Ainsworth, E.A.; Serbin, S.P.; Skoneczka, J.A.; Townsend, P.A. Using leaf optical properties to detect ozone effects on foliar biochemistry. Photosynth. Res. 2014, 119, 65–76. [Google Scholar] [CrossRef]
- Andersen, C.P. Source-sink balance and carbon allocation below ground in plants exposed to ozone. New Phytol. 2003, 157, 213–228. [Google Scholar] [CrossRef]
- Kou, T.; Wang, L.; Zhu, J.; Xie, Z.; Wang, Y. Ozone pollution influences soil carbon and nitrogen sequestration and aggregate composition in paddy soils. Plant Soil 2014, 380, 305–313. [Google Scholar] [CrossRef]
- McCrady, J.K.; Andersen, C.P. The effect of ozone on below-ground carbon allocation in wheat. Environ. Pollut. 2000, 107, 465–472. [Google Scholar] [CrossRef]
- Andersen, C.P.; Scagel, C.F. Nutrient availability alters belowground respiration of ozone-exposed ponderosa pine. Tree Physiol. 1997, 17, 337–387. [Google Scholar] [CrossRef] [PubMed] [Green Version]
- Phillips, R.L.; Zak, D.R.; Holmes, W.E.; White, D.C. Microbial community composition and function beneath temperate trees exposed to elevated atmospheric carbon dioxide and ozone. Oecologia 2002, 131, 236–244. [Google Scholar] [CrossRef] [Green Version]
- Chen, Z.; Maltz, M.R.; Cao, J.; Yu, H.; Shang, H.; Aronson, E. Elevated O3 alters soil bacterial and fungal communities and the dynamics of carbon and nitrogen. Sci. Total Environ. 2019, 677, 272–280. [Google Scholar] [CrossRef]
- Hu, E.; Yuan, Z.; Zhang, H.; Zhang, W.; Wang, X.; Jones, S.B.; Wang, N. Impact of elevated tropospheric ozone on soil C, N and microbial dynamics of winter wheat. Agric. Ecosyst. Environ. 2018, 253, 166–176. [Google Scholar] [CrossRef]
- Kanerva, T.; Regina, K.; Ramo, K.; Ojanpera, K.; Manninen, S. Fluxes of N2O, CH4 and CO2 in a meadow ecosystem exposed to elevated ozone and carbon dioxide for three years. Environ. Pollut. 2007, 145, 818–828. [Google Scholar] [CrossRef]
- Pregitzer, K.S.; Burton, A.J.; King, J.S.; Zak, D.R. Soil respiration, root biomass, and root turnover following long-term exposure of northern forests to elevated atmospheric CO2 and tropospheric O3. New Phytol. 2008, 180, 153–161. [Google Scholar] [CrossRef] [Green Version]
- Kou, T.; Hang, X.; Lam, S.K.; Chen, D.; He, J. Ozone pollution increases CO2 and N2O emissions in ozone-sensitive wheat system. Agron. J. 2018, 110, 496–502. [Google Scholar] [CrossRef]
- Kou, T.J.; Cheng, X.H.; Zhu, J.G.; Xie, Z.B. The influence of ozone pollution on CO2, CH4, and N2O emissions from a Chinese subtropical rice–wheat rotation system under free-air O3 exposure. Agric. Ecosyst. Environ. 2015, 204, 72–81. [Google Scholar] [CrossRef]
- Nikolova, P.S.; Andersen, C.P.; Blaschke, H.; Matyssek, R.; Haberle, K.H. Belowground effects of enhanced tropospheric ozone and drought in a beech/spruce forest (Fagus sylvatica L./Picea abies [L.] Karst). Environ. Pollut. 2010, 158, 1071–1078. [Google Scholar] [CrossRef] [PubMed]
- Chen, S.; Zhang, Y.; Chen, H.; Hu, Z. Effects of elevated O3 on soil respiration in a winter wheat-soybean rotation cropland. Soil Res. 2012, 50, 500–506. [Google Scholar] [CrossRef] [Green Version]
- Wang, J.; Hayes, F.; Chadwick, D.R.; Hill, P.W.; Mills, G.; Jones, D.L. Short-term responses of greenhouse gas emissions and ecosystem carbon fluxes to elevated ozone and N fertilization in a temperate grassland. Atmos. Environ. 2019, 211, 204–213. [Google Scholar] [CrossRef]
- Scagel, C.F.; Andersen, C.P. Seasonal changes in root and soil respiration of ozone-exposed ponderosa pine (Pinus ponderosa) grown in different substrates. New Phytol. 1997, 136, 627–643. [Google Scholar] [CrossRef]
- Wang, J.; Hayes, F.; Turner, R.; Chadwick, D.R.; Mills, G.; Jones, D.L. Effects of four years of elevated ozone on microbial biomass and extracellular enzyme activities in a semi-natural grassland. Sci. Total Environ. 2019, 660, 260–268. [Google Scholar] [CrossRef]
- Morgan, P.B.; Ainsworth, E.A.; Long, S.P. How does elevated ozone impact soybean? A meta-analysis of photosynthesis, growth and yield. Plant Cell Environ. 2003, 26, 1317–1328. [Google Scholar] [CrossRef]
- Chen, H.; Li, X.; Hu, F.; Shi, W. Soil nitrous oxide emissions following crop residue addition: A meta-analysis. Glob. Chang. Biol. 2013, 19, 2956–2964. [Google Scholar] [CrossRef]
- Liao, C.; Peng, R.; Luo, Y.; Zhou, X.; Wu, X.; Fang, C.; Chen, J.; Li, B. Altered ecosystem carbon and nitrogen cycles by plant invasion: A meta-analysis. New Phytol. 2008, 177, 706–714. [Google Scholar] [CrossRef]
- de Graaff, M.-A.; van Groenigen, K.-J.; Six, J.; Hungate, B.; van Kessel, C. Interactions between plant growth and soil nutrient cycling under elevated CO2: A meta-analysis. Glob. Chang. Biol. 2006, 12, 2077–2091. [Google Scholar] [CrossRef]
- Treseder, K.K. A meta-analysis of mycorrhizal responses to nitrogen, phosphorus, and atmospheric CO2 in field studies. New Phytol. 2004, 164, 347–355. [Google Scholar] [CrossRef] [Green Version]
- Rosenberg, M.S.; Adams, D.C.; Gurevitch, J. MetaWin: Statistical Software for Meta-Analysis; Version 2.1; Sinauer Associates, Inc.: Sunderland, MA, USA, 2000. [Google Scholar]
- Ainsworth, E.A. Rice production in a changing climate: A meta-analysis of responses to elevated carbon dioxide and elevated ozone concentration. Glob. Chang. Biol. 2008, 14, 1642–1650. [Google Scholar] [CrossRef]
- Dieleman, W.I.; Luyssaert, S.; Rey, A.; de Angelis, P.; Barton, C.V.; Broadmeadow, M.S.; Broadmeadow, S.B.; Chigwerewe, K.S.; Crookshanks, M.; Dufrene, E.; et al. Soil [N] modulates soil C cycling in CO2-fumigated tree stands: A meta-analysis. Plant Cell Environ. 2010, 33, 2001–2011. [Google Scholar] [CrossRef]
- Huedo-Medina, T.; Sanchez-Meca, J.; Marin-Martinez, F.; Botella, J. Assessing heterogeneity in meta-analysis: Q statistic or I² index? Psychol. Methods 2006, 11, 193–206. [Google Scholar] [CrossRef] [PubMed] [Green Version]
- Wang, S.; Auge, R.M.; Toler, H.D. Arbuscular mycorrhiza formation and its function under elevated atmospheric O3: A meta-analysis. Environ. Pollut. 2017, 226, 104–117. [Google Scholar] [CrossRef] [PubMed]
- Wittig, V.E.; Ainsworth, E.A.; Naidu, S.L.; Karnosky, D.F.; Long, S.P. Quantifying the impact of current and future tropospheric ozone on tree biomass, growth, physiology and biochemistry: A quantitative meta-analysis. Glob. Chang. Biol. 2009, 15, 396–424. [Google Scholar] [CrossRef]
- Gurevitch, J.; Hedges, L.V. Statistical issues in ecological meta-analyses. Ecology 1999, 80, 1142–1149. [Google Scholar] [CrossRef]
- Rosenthal, R. The file drawer problem and tolerance for null results. Psychol. Bull. 1979, 86, 638–641. [Google Scholar] [CrossRef]
- Jones, T.G.; Freeman, C.; Lloyd, A.; Mills, G. Impacts of elevated atmospheric ozone on peatland below-ground DOC characteristics. Ecol. Eng. 2009, 35, 971–977. [Google Scholar] [CrossRef] [Green Version]
- von Arnold, K.; Nilsson, M.; Hanell, B.; Weslien, P.; Klemedtsson, L. Fluxes of CO2, CH4 and N2O from drained organic soils in deciduous forests. Soil Bio. Biochem. 2005, 37, 1059–1071. [Google Scholar] [CrossRef]
- Samuelson, L.; Kelly, J.M. Scaling ozone effects from seedlings to forest trees. New Phytol. 2001, 149, 21–41. [Google Scholar] [CrossRef] [PubMed]
- Changey, F.; Bagard, M.; Souleymane, M.; Lerch, T.Z. Cascading effects of elevated ozone on wheat rhizosphere microbial communities depend on temperature and cultivar sensitivity. Environ. Pollut. 2018, 242, 113–125. [Google Scholar] [CrossRef] [PubMed]
- Qiu, Y.; Jiang, Y.; Guo, L.; Burkey, K.O.; Zobel, R.W.; Shew, H.D.; Hu, S. Contrasting warming and ozone effects on denitrifiers dominate soil N2O emissions. Environ. Sci. Technol. 2018, 52, 10956–10966. [Google Scholar] [CrossRef]
- Xu, S.; Fu, W.; He, X.; Chen, W.; Zhang, W.; Li, B.; Huang, Y. Drought alleviated the negative effects of elevated O3 on Lonicera maackii in Urban Area. Bull. Environ. Contam. Toxicol. 2017, 99, 648–653. [Google Scholar] [CrossRef] [PubMed]
Figure 1.
Normal quantile plots (a) and frequency distributions (b) of the natural logarithms of the response ratios for soil CO2 efflux responses to elevated [O3]. The red solid line in (a) is the diagonal reference line. The blue dashed lines in (a) show the Lilliefors confidence bounds. The red solid curve in (b) is a Gaussian fit to the frequency data.

Figure 2.
Overall and grouped cumulative responses with significant QB of soil CO2 efflux to elevated [O3]. Symbols represent the grand mean percentage change at elevated [O3] relative to control, and the bars show the 95% bias-corrected bootstrapped confidence intervals. The number of observations and articles are provided in parentheses. Mean control [O3] and elevated [O3] are given in brackets. The average fumigation durations are given on the right side.

Figure 3.
Weighted meta-regression between the effect sizes (the natural logarithms of the response ratios, lnR, vertical axis) of response variables and environmental factors: (a) exposure duration, (b) soil pH, (c) MAT and (d) MAP, respectively. Solid line denotes weighted meta-regression.
Figure 3.
Weighted meta-regression between the effect sizes (the natural logarithms of the response ratios, lnR, vertical axis) of response variables and environmental factors: (a) exposure duration, (b) soil pH, (c) MAT and (d) MAP, respectively. Solid line denotes weighted meta-regression.


Table 1.
The total heterogeneity (QT); percentage of heterogeneity due to true variation among effect sizes (I2); and between-group heterogeneity (QB), estimated using resampling tests with 64,999 iterations to generate a randomized p-value for responses of soil CO2 efflux to elevated O3 relative to controls in a weighted random-effects meta-analysis with categorical structure.
| Number of observations | 77 |
| QT | 1131.41 *** |
| I2 | 93 |
| QB (O3 level) | 0.43 |
| QB (Exposure duration) | 35.96 *** |
| QB (Soil pH) | 28.46 *** |
| QB (Ecosystem) | 12.49 ** |
| QB (Fumigation method) | 18.01 *** |
p-values < 0.05 are considered significant. ** p < 0.01; *** p < 0.001.
Table 2.
Kendall’s tau and Spearman’s rho rank correlation tests as well as Rosenthal’s fail-safe numbers for assessing publication bias a.
Table 2.
Kendall’s tau and Spearman’s rho rank correlation tests as well as Rosenthal’s fail-safe numbers for assessing publication bias a.
| Index | k | Kendall’s Tau | Spearman’s Rho | Rosenthal’s Fail-Safe Number | |
|---|---|---|---|---|---|
| Overall | 77 | 0.56 | 0.54 | NS b | |
| O3 level | Low | 57 | 0.44 | 0.49 | NS |
| High | 20 | 0.80 | 0.89 | NS | |
| Exposure duration | Short | 23 | 0.62 | 0.78 | 935.3 |
| Medium | 28 | 0.87 | 0.83 | 751.1 | |
| Long | 26 | 0.88 | 0.92 | 732.1 | |
| Soil pH | pH ≤ 6 | 56 | 0.88 | 0.99 | 2520.9 |
| pH > 6 | 21 | 0.95 | 0.90 | 669.3 | |
| Ecosystem | Nonagricultural | 54 | 0.89 | 0.99 | 1595.4 |
| Agricultural | 23 | 0.73 | 0.64 | NS | |
| Fumigation method | FACE | 45 | 0.64 | 0.73 | 2355.8 |
| OTC | 32 | 0.06 | 0.03 | NS | |
a No publication bias if the p-values of rank correlation tests are >0.05 or if the Rosenthal’s fail-safe numbers are greater than (5k + 10). b NS means the response to e[O3] was nonsignificant.
Publisher’s Note: MDPI stays neutral with regard to jurisdictional claims in published maps and institutional affiliations. |
© 2021 by the authors. Licensee MDPI, Basel, Switzerland. This article is an open access article distributed under the terms and conditions of the Creative Commons Attribution (CC BY) license (https://creativecommons.org/licenses/by/4.0/).
Share and Cite
MDPI and ACS Style
Hu, E.; Ren, Z.; Xu, S.; Zhang, W. Elevated Tropospheric Ozone Concentration Alters Soil CO2 Emission: A Meta-Analysis. Sustainability 2021, 13, 4571. https://0-doi-org.brum.beds.ac.uk/10.3390/su13084571
AMA Style
Hu E, Ren Z, Xu S, Zhang W. Elevated Tropospheric Ozone Concentration Alters Soil CO2 Emission: A Meta-Analysis. Sustainability. 2021; 13(8):4571. https://0-doi-org.brum.beds.ac.uk/10.3390/su13084571
Chicago/Turabian StyleHu, Enzhu, Zhimin Ren, Sheng Xu, and Weiwei Zhang. 2021. "Elevated Tropospheric Ozone Concentration Alters Soil CO2 Emission: A Meta-Analysis" Sustainability 13, no. 8: 4571. https://0-doi-org.brum.beds.ac.uk/10.3390/su13084571
Note that from the first issue of 2016, this journal uses article numbers instead of page numbers. See further details here.