
Physio-Chemical Characterization of Biochar, Compost and Co-Composted Biochar Derived from Green Waste


1
Institute of Soil Science, Pir Mehr Ali Shah Arid Agriculture University, Rawalpindi 46300, Pakistan
2
Department of Agronomy, Pir Mehr Ali Shah Arid Agriculture University, Rawalpindi 46300, Pakistan
3
Department of Agricultural Research for Northern Sweden, Swedish University of Agricultural Sciences, 90183 Umeå, Sweden
*
Author to whom correspondence should be addressed.
Sustainability 2021, 13(9), 4628; https://0-doi-org.brum.beds.ac.uk/10.3390/su13094628
Submission received: 6 April 2021
/
Revised: 18 April 2021
/
Accepted: 19 April 2021
/
Published: 21 April 2021
(This article belongs to the Special Issue Sustainable Agriculture Through Technological Intervention)
Abstract
:Organic wastes are naturally biodegradable, but they contribute to environmental pollution and management issues. Composting and pyrolysis are widely used technologies for recycling these wastes into valuable organic products for soil health and crop production. In the current study, fruits vegetables waste (FVW) was converted to biochar, compost, and co-composted biochar. The microcrystal structure, functional groups, surface morphology, and nutrient contents of organic materials were investigated by XRD, FTIR, SEM-EDS, AAS, multi C-N analyzer, and ICP-OES techniques. Heavy metals contamination was not detected in the biomass used for pyrolysis and compost preparation. FVW had an acidic pH (5.92), while biochar, compost, and co-composted biochar had an alkaline pH. Total macronutrient (K, Na, S) and micronutrient (Cu, Fe) concentrations were higher in compost and co-composted biochar, with the exception of K, which was higher in biochar. Biochar had the highest surface area (4.99 m2g), followed by FVW, compost, and co-composted biochar. Co-composted biochar had a porous structure. Si, Ca, and Al contents were common in all organic materials, while P, K, Mg, and S were found with lower concentrations in both biochar and compost. Iron was only found in compost and co-composted biochar. Quartz, sylvite, and calcite were common minerals found in all organic treatments. Biochar contained more aromatic carbon ring structure C=C/C=O and aromatic C-H bending as compared to FVW and compost, thus, making biochar a stable carbon rich material suitable for soil carbon sequestration.
1. Introduction
The fruit and vegetable production, processing and waste produce environmental pollutants, including wastewater as well as biodegradable waste. Food raw materials spoil easily and may be a source of microbiological contamination during production [1]. Fruits and vegetables waste (FVW) are biodegradable in nature causing problems of municipal landfill and open burning [1,2]. Landfill leachate produced from dumping sites contains a mixture of organic carbon, NH4-N, NH3, and heavy metals [3]. Open burning of waste produce methane gas (CH4) and other toxic dioxins. The increase in concentration of dioxins, heavy metals, odors, disease vectors, and greenhouse gases annually affecting human health and polluting environment [4]. The human created environmental pollutants have different meanings and can be managed differently in different parts of globe. For the developed world, pollution usually signifies CO2 emission and other greenhouse gases, whilst for the developing world, pollution means garbage of basic human life activity [5]. Different kinds of organic wastes including crop residues, farmyard manure, fruit vegetables, and municipals waste have become a major management problem and to overcome these issues biological (composting; C) and heat (pyrolysis) treatment are among the economical technologies through which their wastes can be converted into organic amendments for sustainable soil, and environmental and crop health. Recently, fruit and vegetable wastes are converted into biocomposites that consist entirely of biodegradable raw materials [6,7]. Gelatin can also be produced from wastes from industry and farming [8]. Composting (C), a biological treatment through which organic wastes are converted into valuable humus [9], is a widely accepted technology for the recycling of organic waste. However, the composting process not only emits large quantities of greenhouse gases (GHGs), but also malodor and leachate imposed environmental pollution, and compost is not stable in the soil for a long time. An alternative to composting organic waste heating at high temperature in absence of/or limited oxygen is called pyrolysis, which primarily focuses on optimizing charcoal production in terms of yield, composition, and properties. However, this process often yields gas (syngas), liquid (bio-oil), and solid (biochar; BC) in different portions, depending on the composition of feedstock and pyrolysis conditions [10].
Pyrolysis technologies can be further categorized into slow, intermediate, fast, and flash pyrolysis, based on the proportion of different outputs, the reaction time, and the heating rate of the pyrolysis process [11,12]. Slow pyrolysis yields typically 30–35% solid (biochar), 30% liquid (bio-oil), and 35% gases (syngas) by mass [13], while fast pyrolysis yielded liquid (bio-oil) 50–70%, biochar 10–30% biochar, and gas (syngas) 15–20% [14]. Organic wastes can be converted into C rich charred material biochar through pyrolysis and the composition of biochar is influenced by feedstock source (wastes) and the pyrolysis condition, especially temperature. Plant-derived biochars has a low nutrient content due to their limited nitrogen (N), phosphorous (P), and potassium (K) contents [15,16], while biochar from manure wastes is high in mineral elements and used as a fertilizer [17,18]. Higher temperature decreases biochar yield and increases ash content [19,20,21]. Biochar is a suitable soil amendment that provide carbon to soil while enhancing water retention [22], retained nutrients improve microbial activity [23], and nitrogen fixation. Biochar is beneficial due to its highly porous structure, wide range of functional groups [24,25], high negative surface charges, and large cation exchange capacity (CEC) [26].
In the pyrolysis process, biochar undergoes various physical, chemical, and molecular changes [27,28,29]. Generally, three chemical characterizations of biochar, pH, EC, and cation exchange capacity (CEC) are the important factors for determining its functions in soil. Biochar CEC has been increased at higher pyrolysis temperature [30]. This is likely due to the oxidation process during pyrolysis, which produces a greater density of negatively charged carboxyl, phenolic, and hydroxyl functional groups on the biochar surface [31,32]. In general, numerous chemical functional groups are formed during pyrolysis, such as hydroxyl functional groups (-OH), ester, aldehyde-(C=O)H, amino-NH2, nitro-NO2, and carboxyl-(C=O)OH functional groups [20,33]. Other functional groups, such as N- and S- containing functional groups, can also be observed mainly in biochars produced from manures, sewage sludge, and rendering wastes [34].
Biochar (BC) characterization can provide a valuable insight to end-users who used it for a particular agroecosystem. Characterization of single feedstock biochars as amendment for crop yield and soil health, are reported largely. Recently, biochar is also mixed with organic (compost) and inorganic (minerals) for sustainable soil and crop productivity. Biochar’s physical and chemical properties are strongly influenced by the feedstock compositions. Feedstock’s biomass and pyrolysis conduction determine its effect on soil health and crop yield [35]. Biochar alone and along with other organic amendments are treated vigorously [36] but inadequate information is available regarding the characterization and application of co-composted biochar (BCC). The biochar when placed in a composting unit can be enriched by absorbing leachate on the surface and pores. Thus, it is called co-composted biochar (BCC). This co-composted biochar helps to reduce plant available nutrient losses that occur during the composting process [37].
Pyrolysis causes some nutrients to volatilize from the surface of the material. Nitrogen is the most sensitive of all macronutrients to heating; thus, the N content is low in simple/pristine biochar [38]. Co-composting of biochar can reduce the nitrogen losses in the composting process. During co-composting CEC of biochar increased possibly due to thermophilic oxidation, depending upon feedstock [39]. Co-composted biochar showed a strong affinity for C, N, and S but could lose B, Mg, and S [40]. The CEC of co-composted biochar increases due to adsorption of organic matter on the biochar surface, whereas dissolved organic matter/leachate clogged the micropores of biochar, which reduced the biochar surface area [37,41,42]. Dissolved phosphate and nitrates can be adsorbed into these voids. Energy dispersive spectroscopy (EDS) analysis confirmed the presence of Al, Ca, P, K, Fe, and Si on their porous amorphous C matrix [43,44]. Scanning electron microscopy (SEM) shows that sections of the external surfaces of the biochar and many of the internal macro- and micro-pores of co-composted biochar (BCC) are coated with a layer (rich in C and inorganic/mineral matter) with some evidence of fungi growth [45]. The surface coating of the BCC has a high concentration of C, Si, and O and detectable concentrations of N, P, Fe, Al, Mg, Ca, Cl, and S, as compared to BC. The spectro-microscopic evidence indicates that complex chemical and physical processes are taking place on the external and internal pores of the biochar as redox, pH, and temperature vary during the composting and turning process. It is also possible that some micro-fracturing of biochar has occurred [46].
Organic byproducts including C, BC, BCC help to improve soil health and crop yield. There is a need for detailed characterization of organic waste and byproducts as soil amendments. Keeping in view different strategies for organic waste management, the present study focused on preparation and characterization of C, BC, and BCC from fruits and vegetable wastes as organic soil amendments.
2. Materials and Methods
2.1. Preparation of Compost, Biochar and Co-Composted Biochar
Fruit and vegetable waste (FVW) were used for preparation of biochar, compost, and co-composted biochar. The material was collected from Rawalpindi fruit and vegetable market (Sabzi mandi) with the coordination of Rawalpindi waste management company (RWMC). Biochar, compost, and co-composted biochar were prepared according to the following methods:
2.1.1. Biochar Preparation
Biochar (BC) was prepared with slow pyrolysis of raw feedstock (FVW) under conventional pyrolysis tank. Firstly, FVW was air-dried and then all feedstock was dried in an oven at 105 °C for 24 h. The pyrolysis process was performed in an airtight vessel consisting of two metal barrels at 350 °C. The space between the barrels were ignited through natural gas. The process took 4 h, while the produced biochar was left to cool for 2 h, converting 50% of the biomass to biochar [47].
2.1.2. Compost and Co-Composted Biochar Preparation
A mixture of FVW and BC filled litter bags (polyester fabric, mesh size: 0.125 mm) was placed under a heap in a composting unit on a 1:10 ratio on dry weight bases and was first moistened with water and then we moistened the material with leachate spray in order to maintain the moisture percentage. The material was turned on day 0, 3, 5,7,10, and 15 and there after at 15 days intervals during the composting period, i.e., 90 days [48].
The composting unit were constructed from wooden slats with a base area of 3.5 m × 3 m. The composter sides and base were covered with polyethylene fabric sheet to control water seepage. In the base, a drainpipe was built for collection of leachate samples from the composter in the container. Two fans (ceiling, axil) were installed in the composting unit/composting. A ceiling fan provided a steady air circulation within the composter. The axil fan with the help of a PVC pipe pumped the condensed air formed inside composting unit wall causing relating high humidity. During the composting process, the temperature was measured daily within the heap using a thermo element. At end of the composting experiment, the solid samples were collected from compost, co-composted biochar (BCC), and dried at 105 °C for 24 h. The dried samples were ground into fine particles for analysis to study various morphological and internal structural changes that occur in co-composted biochar after composting.
2.2. Physical and Chemical Characterization of Organic Materials
Organic materials were characterized determining their physical chemical composition through following parameters using standard methods.
Samples of FVW, C, BC, and BCC, all < 0.25 mm in size, were soaked in distilled water at a 1:5 solid/water ratio for 24 h. The pH and EC of the samples were determined using a standardized pH (ino Lab pH 7110) and conductivity meter (Microprocessor conductivity meter Series.8; EDT instruments; RE 387 Tx) [49].
A muffle furnace was heated to 750 °C and porcelain crucibles were placed in the furnace for 10 min before they were cooled and weighed. We took 1 g of the ground samples of FVW, BC, C, and BCC and they were dried to constant weight at 105 °C for 2 h. They were removed from the oven and weighed again after cooling [50]. Moisture was determined by the following formula:
where, A = grams of air-dry sample used (i.e.,1 g); B = grams of sample after drying at 105 °C.
For ash content determination, the crucibles were preheated to about 500 °C, then cooled in a desiccator, and weighed. We added 1 g of each sample of FVW, C, BC, and BCC into the crucibles and reweighed them. The crucibles were placed in the muffle furnace and the temperature was raised to 500 °C for about 90 min and allowed to cool in a desiccator at room temperature and were then reweighed. The ash content was calculated using Equation (2).
Volatile matter was measured after weighing 1 g of each sample in crucible and placing them in the furnace for 10 min at a temperature of 500 °C. The volatile matter (VM) was calculated using the following equation,
The organic carbon contents were determined through dry ash method. A sample was heated for 4 h in the furnace at a temperature of 500 °C and calculated using the formula [51].
The surface area was measured using the Brunauer Emmett Teller (BET) method and was measured at N2 sorption (0.162 nm2) at 77 K. Approximately 300 mg of the sample was out gassed at 120 °C for 16.5 h and then analyzed on an Autosorb-1 Surface Area Analyzer (Quantachrome Instruments). Five data points, with relative pressures of 0.05–0.3 was used to calculate the surface area [52].
Cation Exchange Capacity (CEC) was measured after taking a sample of 0.5 g. The sample was leached under vacuum (−20 to −40 kPa) in small plastic columns with distilled water. This was repeated five times, followed by three washings with 5 mL of 1 M sodium acetate (pH 8.2) and three washings with 10 mL of 2-propanol. The sample was vacuum-dried for 10 min. Sodium adsorbed on the sample were replaced with ammonium acetate solution and measured on a flame photometer (PFP7; JENWAY Ltd.; UK) [30,53,54]. For digestion and analysis of organic samples, 200 mg grand samples of FVW, C, BC, and BCC were taken in digestion tubes. Then, 3.5 g of the digestion mixture was added (Se powder, H2SO4 and K2SO4) into a digestion tube. We digested the samples for 70 min at 420 °C till the solution was colorless. Distilled water was added and mixed well and prepared 50 mL final volume. The filtrate was used for analysis of macro (P, K) and micronutrients (Fe, Cu, Mn, Zn) and heavy metals (Ni, Pb, Cd, Cr) using atomic absorption spectrophotometer (Shimadzu, AA 6300, Japan) [55]. Total phosphorus was measured after taking 5 mL digested filtrate in a 100 mL test tube and 5 mL color reagent ammonium heptamolybdate-ammonium vanadate in citric acid were added. The sample was mixed well and allowed to stand for 1 h for complete color development. The reading was recorded on a spectrophotometer (Model 6100, JENWAY Ltd.; London, UK) [56]. Total potassium was measured after diluting digested filtrate to a suitable concentration range and then K concentration in the aliquot was read on a flame photometer (PFP7; JENWAY Ltd.; London UK) [57]. Furthermore, total micronutrients (Zn, Fe, Cu and Mn) and heavy metals (Ni, Pb, Cd and Cr) in digests were determined using atomic absorption spectroscopy [57].
The surface morphology of organic treatments was measured by scanning electron microscopy (SEM) using a Hitachi S-4100 instrument, attached with energy dispersive spectroscopy (EDS) to allow elemental nutrients analysis. In SEM, two types of signal were produced; secondary electron (SE) and backscattered electron (BSE). Generally, the difference in the energies of the backscattered electrons allows them to be collected by different detectors to produce different signals and, hence, distinctly different images of the sample being investigated. Secondary electrons are generated from a small volume around the point where the electron beam hits the sample. The depth from which this signal is generated is tens of nanometers, while for backscattered electrons, with their higher energies, a signal is generated from larger volumes in the sample, typically, the several image contrast in backscattered electron images comes from the difference in the average atomic number at each point in the sample, thus, the signal detected carries compositional information. Conversely, secondary electron images contrast predominately arise from the surface of the sample [58,59].
The organic material samples were mounted to the SEM samples holder stub with double-sided carbon tape. The samples were then stuck to the SEM sample holder using double-sided carbon tape. Samples were coated with 50 nm chromium. LEICA ACE 660 coater instrument is used for chromium coating. Samples after chromium coating were then prepared for external and internal structure and element analysis using a SEM along with EDS. SEM imaging and EDS analysis were conducted under high vacuum conditions. Secondary and backscattered electron images were acquired using a beam energy of either 15 or 20 kV and probe current of approximately 100 pA. The EDS were analyzed using 6/30 (30 mm2), Bruker Nano GmbH (Germany) and proprietary software “Quantax”, Esprit 1.9. Different functional groups and chemical bonds in the samples were identified using a PerkinElmer Spotlight 100 Fourier Transform Infrared (FTIR) micro-spectrometer, coupled with a large area microscopic attenuated total reflection (ATR) imaging with a Linear Array Detector. The FTIR spectra were collected via ATR imaging, where the samples are directly contacted with the ATR crystal and applied force 80 N. The response from organic materials samples could be improved by preparing a finely ground powder in order to increase homogeneity. FTIR spectra were collected between the range from 600 cm−1 to 4000 cm−1 using 4 accumulations and 4 cm−1 resolution of each samples. Data was processed with help of Spectrum V6 software [59].
Crystalline stability of organic materials was monitored by X-ray diffraction (RIGAKU D/MAX 2550/PC, Japan) operated at 40 kV and 40 mA. The data was collected at the range (2θ) of 10 to 80° using Cu Kα radiation with a scan step of 0.026° and the diffractometer was operated at 40 mA and 45 kV. The phase peaks were identified by comparing the observed XRD patterns to standards compiled by the Joint Committee on Powder Diffraction and Standards (PDF22004).
2.3. Statistical Analysis
Resulting data was processed by using of MS excel and origin 2020. All results were expressed as an average of three replicates with a stander deviation.
3. Results
3.1. Proximate and Chemical Properties of Organic Materials
The proximate analysis and other properties results of fruits vegetables waste (FVW), biochar (BC), compost (C), and co-composted biochar (BCC) are listed in the Table 1. The compost had higher moisture contents (5.68%) than FVW (4.99%), BC (3.64%) and BCC (4.16%). The volatile matter of FVW (5.46%) and C (5.70%) were almost similar to each other, whereas BC (3.08%) and BCC (3.54%) had lower volatile matter, while ash contents were higher in BC (57.6%) followed by BCC (53.1%), C (45.5%) and lowest in FVW (43.9%). The FVW had acidic pH (5.92), whereas BC (7.62), C (7.36), and BCC (7.59) had alkaline pH. The determined electrical conductivity (EC) of FVW, BC, C, and BCC were 0.32, 0.27, 0.51, and 0.45 µS cm−1, respectively. Cation exchange capacity recorded highest in C (41.8 cmol kg−1) followed by FVW (37.6 cmol kg−1), BCC (32.4 cmol kg−1), and BC (28.6 cmol kg−1).
As far as total organic carbon (TOC) is concerned, TOC was detected higher in BC (54%) followed by BCC (46%), FVW (42%), and C (37%). Total nitrogen (TN) contents ranged from 2.7 to 4.3%. The highest amount of TN (4.3%) was detected in FVW followed by BCC (4.0%), BC (2.80%), and C (2.70%). Available P were highest in FVW (0.76%) as compared to BC (0.33%), C (0.59%), and BCC (0.68%). The determined zinc (Zn) for FVW, BC, C, and BCC were 1.98, 2.25, 3.63 and 5.02 mg kg−1, while the iron (Fe) concentration was 3.30, 5.99, 18.6, and 10.8 mg kg−1, respectively. The manganese (Mn) contents ranged from 0.30 mg kg−1 in FVW to 0.65 mg kg−1 in BCC. The copper (Cu) concentration of FVW and BCC (0.35 mg kg−1) were similar to each other, whereas BC (0.34 mg kg−1) had a lower Cu concentration and a higher Cu concentration (0.37 mg kg−1) was observed in C.
3.2. Surface Area Analysis
Surface area analysis revealed that FVW, BC, C, and BCC are micro-mesoporous materials that have similar type of N2 adsorption isotherm due to having similar type of pore structure. The surface area, pore volume, and pore diameter results were presented in Table 2. The BC showed a greater surface area (4.99 m2g−1) followed by FVW (3.89 m2g−1), C (4.43 m2g−1), and BCC (4.13 m2g−1). The pore volume of C (0.014 cc g−1) was found greater than for FVW (0.0030 cc g−1), BC (0.0025 cc g−1), and BCC (0.0030 cc g−1). Based on the BET method, the BCC exhibited greater pore radius (15.13 Å) followed by FVW 14.54 Å, BC 14.52 Å, and C 14.48 Å.
3.3. Water Extractable Macro and Micro- Nutrients in Organic Materials
The value of water extractable from macro- and micro-nutrients analysis of FVW, BC, C, and BCC are listed in Table 3. The total dissolved carbon (TDC) was observed highest in FVW, i.e., 4212 mg L−1, followed by C (1698 mg L−1), BC (740 mg L−1), and BCC (418 mg L−1). The total dissolved inorganic carbon (TDIC; 229 mg L−1) was recorded highest in C and lowest (6.35 mg L−1) in FVW. Dissolved organic carbon (DOC) contents were highest (4205 mg L−1) in FVW as compared to BC (691 mg L−1), C (1469 mg L−1), and BCC (3730 mg L−1). The C (309 mg L−1) and BCC (278 mg L−1) had higher total dissolved nitrogen (TDN) than FVW (103 mg L−1) and BC (46 mg L−1).
Water soluble macro (P, K, Ca, Mg, S) and micro (Zn, Cu, Fe, Mn, Na) nutrients are listed in Table 3. Available phosphorous (P) content was highest in FVW (237 mgL−1) followed by that in C (70.2 mgL−1), BC (33.6 mg L−1), and BCC (26.9 mg L−1). Whereas higher K contents were observed in C (1617 mg L−1) followed by BCC (1181 mg L−1), FVW (876 mg L−1), and BC (890 mg L−1). The determined concentration of available calcium (Ca mg L−1) for FVW, BC, C, and BCC were 164, 36.9, 30.2, and 26.1, respectively. The Ca contents of BC, C, and BCC were similar to each other, whereas FVW (164 mg L−1) had relatively higher Ca contents. The magnesium (Mg) was observed highest in FVW (115 mg L−1) followed by that in BC (26.2 mg L−1), BCC (23.9 mg L−1), and C (21.8 mg L−1). The sulfur (S) concentration was recorded highest in C (185 mg L−1) followed by that in BC (134 mgL−1), FVW (110 mg L−1), and BCC (106 mg L−1).
As far as micro-nutrients are concerned, Zn concentration highest in FVW (0.43 mg L−1) and C (0.38 mg L−1) while lowest in BC (0.03 mg L−1) and BCC (0.08 mg L−1). While Mn concentration values of 4.88, 0.27, 0.14 and 0.16 mg L−1 were detected in FVW, BC, C and BCC, respectively. The Mn concentration of BC, C and BCC were similar to each other, and highest in FVW (4.88 mg L−1). Among the organic materials type, C had higher Cu contents (0.67 mg L−1) than BC (0.17 mg L−1), than FVW (0.15 mg L−1), and than BCC (0.10 mg L−1). Iron (Fe) concentration was also recoded highest in C (2.64 mg L−1) followed by FVW (0.63 mg L−1), BCC (0.42 mg L−1), and BC (0.41 mg L−1). Sodium (Na) contents were recorded highest in C (538 mg L−1), followed by BCC (423 mg L−1), BC (193 mg L−1), and FVW (154 mg L−1).
3.4. Fourier Transform Infrared Spectroscopy (FTIR) Analysis of Organic Materials
FTIR spectroscopy is a great tool to observe the shifting of a chemical composition. Surface functional groups of FVW, BC, C, and BCC are displayed in Figure 1. As can be observed, the FTIR of organic materials such as FVW, BC, C, and BCC were different from others regarding the intensity and specific functionality.
The broad band observed at around 3408 cm−1 to the stretching vibration of the hydroxyl (O-H) functional group could be attributed to the adsorbed water in all organic materials, i.e., FVW, BC, C, and BCC. Asymmetric (CH2) 2918 cm−1 and symmetric (CH3) 2848 cm−1 stretching of the aliphatic functional group were also observed in FVW, BC, C, and BCC. The aromatic carbon (C=C) vibration and carboxyl (C=O) stretching were found at 1636 cm−1, whereas the aromatic C=C/C=O was found in BC as compared to FVW and BCC, while the 1636 cm−1 peak was diminished in C. In both FVW and BC materials, C-H bending of the carbonyl functional group peak was detected at 1433 cm−1, while greater intensity of the C-H binding was observed in BC. The representative transmittance of aromatic CO- or phenolic-OH stretching vibration detected at around 1317 cm−1 was also observed in FVW and BC, while the above-mentioned intensity at 1317 cm−1 and 1433 cm−1 was not noticeable in both C and BCC. In BCC, the band was identified at 1384 cm−1 a greater intensity of aliphatic functional groups was detected and this transmittance did not appearer in FVW, BC, and C. The C-N stretching associated at 1259 cm−1 was observed in all organic materials except for in FVW. The carbohydrate small peak of C-O stretching was associated at 1080 cm−1 in BC, C, and BCC samples. The aromatic C-H stretching vibration between 700 and 873 cm−1 was assigned to the out-of-plan binding for aromatic carbon in organic materials. The moderate transmittance of aromatic C-H stretching associated at 873 cm−1 was observed in all organic materials except for in FVW. The transmittance indicated at 797 cm−1 was not observed in FVW, while the C-H binding at 797 cm−1, had assigned very small transmittance in BC samples. The appearance of higher transmittance of aromatic C-H binding at 797 cm−1 was also detected in both BCC and C.
3.5. X-ray Diffraction (XRD) of Organic Materials
The crystalline stability of FVW, BC, C, and BCC is shown in Figure 2. Quartz, sylvite, and calcite minerals were common in all organic materials. In FVW, X-rays spectra observed the hump-like structure, which shows the presence of cellulose and amorphic components. The presence of quartz (SiO2) was identified by peaks at 3.34 and 1.54 Å in FVW. The calcite mineral was observed at an intensity of 3.03 and 2.28 Å in X-ray pattern. The peaks at 4.26, 3.34, 2.49, and 1.54 Å were found in BC, C, and BCC and were attributed to the presence of SiO2. The sharp peak at 3.34 Å of SiO2 mineral was observed in both BC and BCC whole moderated and a small peak was found in C and FVW, respectively. X-ray patterns in BC indicated the presence of sylvite at an intensity of 3.15, 1.82, and 1.38 Å, while similar peaks of sylvite were observed in C and BCC, but sylvite mineral occurrence was not identified in FVW. The moderate peak associated at 2.69 Å was observed in the C sample. Calcite mineral occurrence was observed in all organic materials at an intensity of 3.03, 2.28, and 2.09 Å. The sharp peak at 3.03 Å indicated that calcite was observed as well as a crystallized structure in BC and BCC, whereas small intense peaks of calcite were detected in FVW.
3.6. Scanning Electron Microscopy-Energy Dispersive Spectroscopy (SEM-EDS)
The microstructure and chemical composition of the organic materials were investigated using SEM, together with EDS analysis. Scanning electron microscopy analysis showed the external and internal structure of organic materials. The morphology structure of organic materials was varied from each other (Figure 3). The SEM scans showed the complex surface structure of FVW, which might be heterogeneous materials collected from fruits and vegetables markets, while the surface scans of BC showed its irregular and macro-pores structure. The surface scans of C showed a fluffy sponge type surface structure. Likewise, scans of BCC showed its honeycomb like porous surface structure and large number of macro- and micro-pores at the surface. The FVW was rich in elements such as C, O, Si, and Ca, whereas the lower concentration of minerals K, Mg, and Al was shown in the EDS analysis (Figure 4). The intersection of the C and O map with the Ca map indicated large portion of calcium carbonate (CaCO3), as seen in Figure 4. The EDS spectra showed that BCC contained higher concentration of C, Si, O, Al, and Ca contents, while has a lower quantity of K, Fe, Mg, and Na contents. Overall, comparison between each organic treatment showed that BCC had a more porous surface structure, as compared to FVW, BC, and C. The higher nutrient contents were observed in C and thereafter a higher concentration of nutrients was found in BCC.
4. Discussion
After complete characterization, a clear difference was observed among FVW, BC, C, and BCC. In proximate analysis, ash contents were observed higher in biochar. According to Mukome et al. [60], ash contents were higher in non-woody derived biochar as compared to wood biochar. Ash contents increased at higher pyrolysis temperature [17,61,62,63]. Moreover, in biochar alkaline in nature, pH (7.62) was detected higher as compared to other organic materials (FVW, C, and BCC). The higher pH value in biochar might mean the presence of greater concentration of alkaline slats/or elementals (K, Ca, Mg and Na) in the biochar [64]. In previous research, some authors observed that biochar pH increased with increasing pyrolysis temperature [18,65]. However, Zornoza et al. [63] reported that the pyrolysis temperature had no effect on the pH value of feedstock, while according to Ippolito et al. [66], produced acidic biochar range from pH 4.0–5.8 from algae and some grasses, which were pyrolyzed at a range from 300–600 °C, pyrolysis temperature. The BC that has a pH range between 6.5 and 7.5 is suitable for nutrients adsorption and is effective for seed germination and crop growth [67], while minimum (0.27 µScm−1) electrical conductivity was observed in BC as compared to other organic materials. Both Wang et al. [68] and Purakayastha et al. [69] reported that electrical conductivity of BC derived from maize straw decrease with increasing pH and temperature. According to Pradhan et al. [70], electrical conductivity varied in feedstock types and pyrolysis temperature. The N2 BET surface area of BC was observed greater (4.99 m2 g−1) and after the composting experiment the surface area of BCC decreased (4.13 m2 g−1), while higher CEC was detected in C (41.83 cmol kg−1) as compared to FVW, BC, and BCC, while significantly lower CEC was detected in BC (28. 64 cmol kg−1). Cation exchange capacity decreased at an increasing temperature [19]. Zornoza et al. [63] reported that the MSW and cotton crop residues pyrolysis at 300–700 °C temperature. The observed CEC ranged from 19.1–23.2 cmol kg−1and 36.9–41.2 cmol kg−1, respectively. Similar results were found in our study. After BCC cation, exchange capacity potential increases but the surface area of BC was decreased/reduced. Many authors’ studies suggested that during the composting process dissolved organic matter/leachate clogged into the micro-pores of BC, leading to a reduced surface area and organic matter adsorption increased CEC potential BCC [37,41,42]. Surface area properties (surface area and pore volume) of biochar are compared in detail with previously reported studies and are reported at Table 4. The total organic carbon contents were higher in BC followed by BCC, C, and FVW. The common trend was that the C contents increased with increasing pyrolysis temperature [16,71]. Zornoza et al. [63] conducted research and found the labile carbon contents decreased markedly with increasing temperature. At 700 °C, the labile C contents deceased 85% in poultry manure and cotton crop residues and 40% in municipal solid waste compared to BC at 300 °C [63]. Tan et al. [72] reported that C contents of BC slightly decreased with increasing pyrolysis temperature. Due to microbial activity in the composting process, decomposed feedstock and a lower concentration of total organic carbon was detected in compost [73]. According to Vandecasteele et al. [74], total organic carbon content slightly decreased in composted biochar, by 37–39% at the end products. Total nitrogen contents were significantly higher in FVW (4.30 mg kg−1) and BCC (4.00 mg kg−1) followed by BC and C. In biochar, N contents decreased with temperature [65] and according to Martins and Dewes [48], animal manure decomposition in composting process at 40 °C highest total nitrogen loss through leachate and gases. Prost et al. [37] also reported that total nitrogen contents slightly increased in BCC. The higher concentration of total available phosphorous, 0.71 and 0.68%, respectively, was found in FVW and BCC, followed by BC and C. In previous studies, researchers concluded that P concentrations decrease in biochar when heat temperature increased [28,61]. The K contents were higher in BC, while Zn and Mn concentrations were higher in BCC, while the Fe content was found to be higher in C samples. Tsai et al. [18] reported that in addition to SiO2 and CaCO3, biochar contained a higher level of P, K, Ca, and Mg based on the mineral elements analysis [75,76].
4.1. Water Extractable Macro and Micro Nutrients in Organic Materials
Total dissolved carbon was observed to be higher in FVW (4212 mg L−1) and C (1698 mg L−1), as compared to BC and BCC, while a similar trend was observed in total dissolved organic carbon. Total dissolved inorganic carbon and total dissolved nitrogen content was detected to be significantly higher in C (288.76 and 309 mg L−1 respectively), as followed by other organic materials and a non-significant difference occurred between BC and BCC. Enhanced DOC decomposition of biochar-amended feedstock during the composting process was observed in several studies before [39,40]. In our study, S contents were higher in C as followed by FVW, BC, and BCC. According to Al-Wabel et al. [71], sulfur content decreases with increasing pyrolysis temperature, and organic S contain compounds volatile at 350 °C. Liu el al. [90] and Devi and Saroha [91] reported that in biochar, S contents remained stable at a pyrolysis temperature range from 300–700 °C. However, its mechanism is still not clear and is not clear how high a concentration of S has been available in biochar produced in different pyrolysis conditions. At higher temperatures (473–673 °C), K and Na concentration lost through vaporization [92]. Vassilev et al. [93] noted that in biochar derived from herbaceous residues, the concentration of P. K, Ca, Mg, and Na were higher, followed by pine wood biochar. It might be that the feedstocks with high annual growth rates are rich in alkaline elements as they are readily taken up from the soil.
4.2. FTIR Analysis of Organic Materials
The hydroxyl functional group is associated at 3408 cm−1 in all organic materials such as FVW, BC, C, and BCC. The higher transmittance of FVW decreased with increasing pyrolysis temperature and there was less stretching detected in BC. The O-H group was unstable at an increasing temperature [94]. It also attributed to acceleration in the dehydration reaction of the feedstock [95]. Abdulrazzaq et al. [96] reported that in empty fruit bunch and wood biochar O-H stretching was indicated to be between 3748 and 3252 cm−1, which showed the dehydration of cellulose and hemicellulose compounds. Both Gomez-Serrano et al. [97] and Chia et al. [59] reported that cellulosic components/biomass was dominant in biochar samples. According to Zhang et al. [43], the cellulose is a polymer that is rich in hydroxyl groups, and even after pyrolysis some hydroxide remains in the samples; therefore, the peak at 3400 cm−1 could be assigned to O-H stretching.
The symmetric (2848 cm−1) and asymmetric (2918 cm−1) C-H stretching of the aliphatic functional group was observed in BC and BCC, but the appearance of C-H stretching bands was not detected in FVW and C. The peaks associated at 2920 cm−1 and 2850 cm−1 assigned aliphatic methyl and methylene bands, and it was confirmed that after pyrolysis, the biochars were not entirely carbonized [59,98]. Li et al. [79] pyrolyzed Eichornia crassipes (water hyacinth) at three different temperatures (300, 500, 700 °C) and reported that the symmetric (2854 cm−1) and asymmetric (2927 cm−1) C-H stretching bands were found in WH 300 and WH500 but not shown in WH 700 and, thus, illustrated that non-polar aliphatic functional declined at a higher temperature. The peak is observed at around 2300 cm−1 in all organic materials except for in FVW. Waqas et al. [81] also reported that the sharp bond between 1900–2300 cm−1 can be attributed to carbon dioxide molecules.
In BC, greater intensity of aromatic C=C and C=O functional group associated at 1636 cm−1 and it was not detected in C. Li et al. [79] detected aromatic C=C and C=O bands at 1636 cm−1 in Eichornia crassipes-derived biochars and reported that it can be varnished at a higher pyrolysis temperature. In FVW and BC, a band at around 1433 cm−1 can be assigned to the in-plane bending of the carbonyl (-COH) functional group [32]. During the composting process, carboxyl C was converted into CO2 [99,100]. In FVW and BC, bonds found at around 1317 cm−1 were attributed to the phenolic -OH and aromatic CO- stretching vibration. Li et al. [79] also found phenolic -OH and aromatic CO- stretching vibration at 1317 cm−1 and reported that the polar group (-OH and CO-) significantly reduced when the feedstock was heated at 500 °C. The carbohydrate small intensity of C-O stretching was associated at 1080 cm−1 in BC, C, and BCC. Wang et al. [101] reported that the band associated approximately at 1040–1080 cm−1 is attributed to C-O stretching of polysaccharides or polysaccharides-like substances. Mahmoud et al. [102] noted that in rice straw compost, sharp peaks associated at 1090 cm−1 showed C-O stretching of polysaccharides or polysaccharide-like substances. However, in rice straw-derived biochar, peaks decreased at 1086, which meant that after pyrolysis polysaccharide was destroyed at higher temperature.
The aromatic C-H stretching vibration peak between 700 and 873 cm−1 were assigned to the bends of the out-of-plane binding for aromatic carbon in samples. This was attributed to the out-of-plane deformation of aromatic C-H [82,96]. In our experiment, we observed bonds at around 471 cm−1 for all organic materials. Waqas et al. [81] also suggested that the peaks’ wavelength below 500 cm−1 associated C-X stretching vibration (Halocarbon compounds) like organochlorine, organofluorine, organoiodine, and organobromine. Biochar filed litterbags composted with fruits and vegetable waste resulted in some changes in functional groups of biochar. Co-composted biochar functional groups that associated at 1384, 797, and 471 cm−1 were slightly stronger compared to that of biochar.
In the composting process, the concentration of aromatic substance was reduced, which indicates aliphatic C decomposition rate is faster compared to aromatic C. According to Abouelwafa et al. [99] and Song et al. [100], during the composting process, microbes used polysaccharide and aliphatic substance as an energy source that can increase the biodegradation process. In the composting process, aliphatic C–alcohol C ratio and aromatic C–alcohol C ratio decreased, which might be due to the increase of alcohol C concentration and the decrease of aliphatic C and aromatic C contents [103].
4.3. X-rays Diffraction of Organic Materials
The XRD spectra were indicative of an amorphous material, C rich phase in organic treatment, but had different peaks suggesting the presence of several minerals, varying mainly by FVW, BC, C, and BCC. The X-ray spectra observed a hump-like structure in FVW. This hump might show the concentration of cellulose and amorphic components in FVW. According to El Fels et al. [104], feedstock heated at 105 °C and with XRD patterns at 2θ = 15–25 occurred at the cellulose peak. Some other researchers [20,105] also observed that the raw feedstock samples showed higher content of cellulose. Cellulose contents in biomass were found both in amorphous and crystalline forms. However, cellulose crystallinity was lost at 400°C. An intermediate, amorphous C stage has also been observed within the narrow temperature interval of 410–450 °C during the charring process of wood [20]. The absence of any crystalline peaks of cellulose in the cotton straw biochar X-ray pattern confirms that it contained mainly the amorphous compounds because the decomposition of cellulose indicating an amorphous carbon structure with randomly oriented aromatic carbon sheets [106]. Increasing the pyrolysis temperature from 300 to 500 °C changed the mineralogical heterogeneity of biochar [107]. Ding et al. [108] and Ahmad et al. [109] also observed that the pyrolysis temperature affected the mineralogical composition of biochar.
In previous research, some authors observed that in biochar were mostly found quartz (SiO2), sylvite (KCl), and calcite (CaCO3) minerals [106,110,111], and in our research experiment similar findings were observed. In our study, in BC and BCC the quartz (SiO2) mineral was identified by its d-space, 4.26, 3.34, 2.49, and 1.54 Å. According to Han et al. [112], in biochar, crystal minerals varied if the pyrolysis temperature increased. The amorphous organic components were gradually reduced, and the crystal minerals were formed. Beside an organic material, biochar is also composed of mineral compounds. Municipal solid waste showed a higher quantity of quartz (SiO2) and calcite (CaCO3). Calcite increased with increasing temperature and holding time.
Zhao and Nartey [106] noted that the cotton residues, potato straw, potato residues, and swine manure prepared biochar. The quartz (SiO2) and calcite (CaCO3) minerals were found at 3.35 Å and 3.16 Å, respectively, in all biochar. Domingues et al. [113] also detected quartz peaks at 4.25 and 3.34 Å in coffee husk biochar derived at 450 and 750 °C pyrolysis temperature. In addition to calcite and quartz, the resulting biochars contained high levels of P, Ca, Mg, and K [18]. Calcite mineral occurrence was observed in all organic materials (FVW, BC, C, and BC) at an intensity of 3.03, 2.28 and 2.09 Å, but in FVW small intense peaks were detected. Many authors suggested that calcite increased with increasing temperature and holding time [106,110,111]. Domingues et al. [113] also found calcite peaks at 3.85, 3.03, 2.49 2.28, 2.09, and 1.87 Å found in chicken manure biochar at all pyrolysis temperatures. The presence of calcite was consistent with the alkalinity of the biochars [79].
X-ray patterns in BC showed the presence of sylvite at an intensity of 3.15, 1.82, and 1.38 Å, while similar peaks of sylvite were observed in C and BCC. Yuan et al. [107] also detected the calcite and sylvite mineral in canola-derived biochar at three pyrolysis temperatures (300, 500, and 700 °C). Many authors reported that the increasing pyrolysis temperature and holding time did not affect increasing intensity of sylvite (KCl) mineral after pyrolysis [63,107].
During the composting process, organic matter (O.M) decomposed and the minerals contained a form of some stable compounds. Therefore, the XRD analysis of the compost products provides a choice to directly identify the mineralization process during composting [114]. According to Li et al. [103], in XRD spectra, no significant mineralization changes were observed in compost samples with and without external additives. The first order peak at 16° showed well-established cellulose contents, while the broad peak of amorphous compounds was found at 22°. In compost evolution, both peaks at 16° and 22° had decreased as shown in X-rays spectra, which represent loss of amorphous and cellulose components. Composting composition was quite a complex system with transformation of various compounds. Quartz and carbolite were the major components, together with calcium sulfate.
4.4. Surface Morphology of Organic Materials
SEM scans showed complex surface structure of FVW due to heterogeneous components collected from fruit and vegetable markets and after pyrolysis surface scans have shown irregular structure and macr- pores observed in the BC surface structure. Liang et al. [115] reported that the broiler litter SEM scan have shown a complex surface structure, probably due to the heterogeneous mixture consisting of seed, hair, digested food, proteins, and bedding materials. Lehmann et al. [116] reported that high volatile matter and low quantity of lignin in fruit and vegetable waste affected the pore formation in biochar. With the increasing of pyrolysis temperature, already occurring volatile matters in biomass gradually vaporized, causing pores and crack formation in biochar particles. In biomass fluid, components start losing at 550°C and in resulting cracking occurred in the surface structure of biochar probably due to heating heterogeneity developed in the biochar porous structure [117].
The SEM scans showed a fluffy sponge type surface structure in the C samples. However, in BCC, a porous honeycomb-like surface structure was observed. Claoston et al. [118] reported that biochar formed at high pyrolysis temperature was hard and brittle. In biochar derived from rice husk and empty fruit bunch, the pores were not properly developed at 350 °C pyrolysis temperature and at 500 °C honeycomb-like structures and large cylindrical pores were developed. However, in the empty fruit bunch, the regular pattern of these block-like structures was destroyed at 650°C pyrolysis temperature. Zielińska et al. [119] also noted that surface morphology of sludge biochar was elongated in porous forms looking like fluffy sponges, honeycombs, and ball structures.
Energy dispersive spectroscopy (EDS) is less accurate for quantification of elements, with atomic numbers <11 [120]. In EDX spectra, the higher quantity of C, O, K, Al, Si, and Ca nutrients contents were detected in all organic materials, while lower contents of P, Mg, S, and Fe were detected in BC, C, and BCC, but Cl contents were observed in C samples. The lower quantity of Na contents was found in BCC. Zhang et al. [43] proposed that dissolved nitrates and phosphate can be adsorbed into these holes. The structure is a porous amorphous C matrix with a range of sub-5 nm mineral phases containing P, K, Ca, S, Fe Al, and Si detected by EDS. Mary et al. [121] observed the presence of K, Ca, Na, and Cl mineral contents in FVW-derived biochar through EDS elemental mapping. Zama et al. [122] and Kim et al. [123] reported that in sewage sludge-derived biochar, the concentration of Ca, Al, Si, and Cd was quite high as compared to fruits and vegetable waste.
5. Conclusions
Biochar, compost, and co-composted biochar were prepared from fruit and vegetable waste (FVW). A systematic characterization of FVW, BC, C, and BCC revealed significant variation in the physical, chemical, and structural properties of the organic materials. Biochar retained available nutrients and increased CEC during the composting process due to its high aromatic carbon ring structure C=C/C=O and aromatic C-H functional groups, large surface area, and porous structure, making biochar effective in reducing N losses during the composting process. The surface area of co-composted biochar decreased after composting, as leachate clogged the pores. Quartz, sylvite, and calcite minerals were abundant in BC, C, and BCC. The addition of biochar to bio-waste (fruit and vegetable waste) helped conserve moisture and improved aeration during the composting process. Biochar is an effective treatment for producing high-quality compost because it reduces nutrients losses and facilitates compost maturity during the composting process. Organic materials derived from bio-waste, in this study, can be considered safe to use as soil amendment because they contain negligible concentrations of heavy metals. Moreover, future research should look into the comparative efficacy of biochar, compost, and co-composted biochar derived from bio-waste as soil amendment under field conditions.
Author Contributions
Conceptualization, G.M. and R.H.; methodology, G.M., R.H., and Q.H.; formal analysis, G.M., R.H., and Q.H.; investigation, G.M. and R.H.; resources, G.M., R.H., Q.H., and M.A.; data curation, G.M. and R.H.; writing—original draft preparation, G.M., R.H., and Q.H.; writing—review and editing, G.M., R.H., Q.H., and M.A.; visualization, R.H., Q.H., and M.A.; supervision, R.H.; project administration, R.H.; funding acquisition, G.M. and R.H. All authors have read and agreed to the published version of the manuscript.
Funding
First author received funding from Higher Education Commission (HEC) Pakistan under International Research Support Initiative Programme (IRSIP).
Institutional Review Board Statement
Not applicable.
Informed Consent Statement
Not applicable.
Data Availability Statement
Data is contained within the article.
Acknowledgments
We thank Institute of Soil Science, Pir Mehr Ali Shah Arid Agriculture University for supporting this research. The authors are thankful to HEC Pakistan for giving support to first author to travel abroad under IRSIP. Authors are also thankful to MDPI for providing full waiver to this article due to the management of MDPI journal special issue by M.A.
Conflicts of Interest
The authors declare no conflict of interest.
References
- Pathak, P.D.; Mandavgane, S.A.; Kulkarni, B.D. Characterizing fruit and vegetable peels as bioadsorbents. Curr. Sci. 2016, 110, 2114–2123. [Google Scholar] [CrossRef]
- Wojdalski, J.; Grochowicz, J.; Ekielski, A.; Radecka, K.; Stępniak, S.; Orłowski, A.; Florczak, I.; Drożdż, B.; Żelaziński, T.; Kosmala, G. Production and properties of apple pomace pellets and their suitability for energy generation purposes. Rocznik Ochrona Srodowiska 2016, 18, 89. [Google Scholar]
- Torretta, V.; Ferronato, N.; Katsoyiannis, I.A.; Tolkou, A.K.; Airoldi, M. Novel and conventional technologies for landfill leachates treatment: A review. Sustainability 2017, 9, 9. [Google Scholar] [CrossRef] [Green Version]
- Tue, N.M.; Goto, A.; Takahashi, S.; Itai, T.; Asante, K.A.; Kunisue, T.; Tanabe, S. Release of chlorinated, brominated and mixed halogenated dioxin-related compounds to soils from open burning of e-waste in Agbogbloshie (Accra, Ghana). J. Hazard. Mater. 2016, 302, 151–157. [Google Scholar] [CrossRef] [PubMed]
- Borowski, P.F. Environmental pollution as a threats to the ecology and development in Guinea Conakry. J. Inst. Environ. Prot. Natl. Res. Inst. 2017, 28, 27–32. [Google Scholar] [CrossRef] [Green Version]
- Picard, M.C.; Rodriguez-Uribe, A.; Thimmanagari, M.; Misra, M.; Mohanty, A.K. Sustainable biocomposites from poly (butylene succinate) and apple pomace: A study on compatibilization performance. Waste Biomass Valorization 2020, 11, 3775–3787. [Google Scholar] [CrossRef]
- Żelaziński, T. Properties of Biocomposites from Rapeseed Meal, Fruit Pomace and Microcrystalline Cellulose Made by Press Pressing: Mechanical and Physicochemical Characteristics. Materials 2021, 14, 890. [Google Scholar] [CrossRef]
- Wojdalski, J.; Krajnik, M.; Borowski, P.F.; Dróżdż, B.; Kupczyk, A. Energy and water efficiency in the gelatine production plant. AIMS Geosci. 2020, 6, 491–503. [Google Scholar] [CrossRef]
- Kashmanian, R.M.; Kluchinski, D.; Richard, T.L.; Walker, J.M. Quantities, characteristics, barriers, and incentives for use of organic municipal by-products. In Land Application of Agricultural, Industrial, and Municipal By-Products; Soil Science Society of America: Madison, WI, USA, 2000; Volume 6, pp. 127–167. [Google Scholar]
- Joseph, S.; Doug, P.O.W.; Dawson, K.; Mitchell, D.R.; Rawal, A.; James, H.O.O.K.; Taherymoosavi, S.; van Zwieten, L.; Joshua, R.U.S.T.; Donne, S.; et al. Feeding biochar to cows: An innovative solution for improving soil fertility and farm productivity. Pedosphere 2015, 25, 666–679. [Google Scholar] [CrossRef]
- Edmunds, C.W. The effects of biochar amendment to soil on bioenergy crop yield and biomass composition. Master’s Thesis, University of Tennessee, Knoxville, TN, USA, 2012. [Google Scholar]
- Nsamba, H.K.; Hale, S.E.; Cornelissen, G.; Bachmann, R.T. Sustainable technologies for small-scale biochar production—A review. J. Sustain. Bioenergy Sys. 2015, 5, 10. [Google Scholar] [CrossRef] [Green Version]
- Meyer, S.; Glaser, B.; Quicker, P. Technical, economical, and climate-related aspects of biochar production technologies: A literature review. Environ. Sci. Technol. 2011, 45, 9473–9483. [Google Scholar] [CrossRef] [PubMed]
- Laird, D.A.; Brown, R.C.; Amonette, J.E.; Lehmann, J. Review of the pyrolysis platform for coproducing bio-oil and biochar. Biofuels Bioprod. Biorefining 2009, 3, 547–562. [Google Scholar] [CrossRef]
- Fabbri, D.; Torri, C.; Spokas, K.A. Analytical pyrolysis of synthetic chars derived from biomass with potential agronomic application (biochar). Relationships with impacts on microbial carbon dioxide production. J. Anal. Appl. Pyrolysis 2012, 93, 77–84. [Google Scholar] [CrossRef]
- Kaal, J.; Cortizas, A.M.; Reyes, O.; Soliño, M. Molecular characterization of Ulex europaeus biochar obtained from laboratory heat treatment experiments—A pyrolysis—GC/MS study. J. Anal. Appl. Pyrolysis 2012, 95, 205–212. [Google Scholar] [CrossRef]
- Cantrell, K.B.; Hunt, P.G.; Uchimiya, M.; Novak, J.M.; Ro, K.S. Impact of pyrolysis temperature and manure source on physicochemical characteristics of biochar. Bioresour. Technol. 2012, 107, 419–428. [Google Scholar] [CrossRef] [PubMed]
- Tsai, W.T.; Liu, S.C.; Chen, H.R.; Chang, Y.M.; Tsai, Y.L. Textural and chemical properties of swine-manure-derived biochar pertinent to its potential use as a soil amendment. Chemosphere 2012, 89, 198–203. [Google Scholar] [CrossRef] [PubMed]
- Novak, J.M.; Busscher, W.J.; Laird, D.L.; Ahmedna, M.; Watts, D.W.; Niandou, M.A. Impact of biochar amendment on fertility of a southeastern coastal plain soil. Soil Sci. 2009, 174, 105–112. [Google Scholar] [CrossRef] [Green Version]
- Keiluweit, M.; Nico, P.S.; Johnson, M.G.; Kleber, M. Dynamic molecular structure of plant biomass-derived black carbon (biochar). Environ. Sci. Technol. 2010, 44, 1247–1253. [Google Scholar] [CrossRef] [PubMed] [Green Version]
- Zheng, H.; Wang, Z.; Deng, X.; Herbert, S.; Xing, B. Impacts of adding biochar on nitrogen retention and bioavailability in agricultural soil. Geoderma 2013, 206, 32–39. [Google Scholar] [CrossRef]
- Safian, M.; Motaghian, H.; Hosseinpur, A. Effects of sugarcane residue biochar and P fertilizer on P availability and its fractions in a calcareous clay loam soil. Biochar 2020, 2, 357–367. [Google Scholar] [CrossRef]
- Pokharel, P.; Ma, Z.; Chang, S.X. Biochar increases soil microbial biomass with changes in extra-and intracellular enzyme activities: A global meta-analysis. Biochar 2020, 2, 65–79. [Google Scholar] [CrossRef] [Green Version]
- Lam, S.S.; Yek, P.N.Y.; Ok, Y.S.; Chong, C.C.; Liew, R.K.; Tsang, D.C.; Park, Y.K.; Liu, Z.; Wong, C.S.; Peng, W. Engineering pyrolysis biochar via single-step microwave steam activation for hazardous landfill leachate treatment. J. Hazard. Mater. 2020, 390, 121649. [Google Scholar] [CrossRef] [PubMed]
- Foong, S.Y.; Liew, R.K.; Yang, Y.; Cheng, Y.W.; Yek, P.N.Y.; Mahari, W.A.W.; Lee, X.Y.; Han, C.S.; Vo, D.V.N.; van Le, Q.; et al. Valorization of biomass waste to engineered activated biochar by microwave pyrolysis: Progress, challenges, and future directions. Chem. Eng. J. 2020, 389, 124401. [Google Scholar] [CrossRef]
- Bradford, K.; Hsiao, T. Physiological responses to moderate water stress. In Physiological Plant Ecology II; Springer: Berlin/Heidelberg, Germany, 1982; pp. 263–324. [Google Scholar]
- Inguanzo, M.; Domınguez, A.; Menéndez, J.A.; Blanco, C.G.; Pis, J.J. On the pyrolysis of sewage sludge: The influence of pyrolysis conditions on solid, liquid and gas fractions. J. Anal. Appl. Pyrolysis 2002, 63, 209–222. [Google Scholar] [CrossRef]
- Bridle, T.R.; Pritchard, D. Energy and nutrient recovery from sewage sludge via pyrolysis. Water Sci. Technol. 2004, 50, 169–175. [Google Scholar] [CrossRef] [PubMed]
- Abrego, J.; Arauzo, J.; Sánchez, J.L.; Gonzalo, A.; Cordero, T.; Rodríguez-Mirasol, J. Structural changes of sewage sludge char during fixed-bed pyrolysis. Ind. Eng. Chem. Res. 2009, 48, 3211–3221. [Google Scholar] [CrossRef]
- Gaskin, J.W.; Steiner, C.; Harris, K.; Das, K.C.; Bibens, B. Effect of low-temperature pyrolysis conditions on biochar for agricultural use. Trans. ASABE 2008, 51, 2061–2069. [Google Scholar] [CrossRef]
- Cheng, C.H.; Lehmann, J.; Thies, J.E.; Burton, S.D.; Engelhard, M.H. Oxidation of black carbon by biotic and abiotic processes. Org. Geochem. 2006, 37, 1477–1488. [Google Scholar] [CrossRef]
- Cheng, C.-H.; Lehmann, J.; Engelhard, M.H. Natural oxidation of black carbon in soils: Changes in molecular form and surface charge along a climosequence. Geochim. Cosmochim. Acta 2008, 72, 1598–1610. [Google Scholar] [CrossRef]
- Harris, P.J. Structure of non-graphitising carbons. Int. Mater. Rev. 1997, 42, 206–218. [Google Scholar] [CrossRef]
- Lima, I.M.; Marshall, W.E. Granular activated carbons from broiler manure: Physical, chemical and adsorptive properties. Bioresour. Technol. 2005, 96, 699–706. [Google Scholar] [CrossRef] [PubMed]
- Novak, J.M.; Cantrell, K.B.; Watts, D.W.; Busscher, W.J.; Johnson, M.G. Designing relevant biochars as soil amendments using lignocellulosic-based and manure-based feedstocks. J. Soil Sediments 2014, 14, 330–343. [Google Scholar] [CrossRef]
- Rogovska, N.; Laird, D.; Cruse, R.; Fleming, P.; Parkin, T.; Meek, D. Impact of biochar on manure carbon stabilization and greenhouse gas emissions. Soil Sci. Soc. Am. J. 2011, 75, 871–879. [Google Scholar] [CrossRef] [Green Version]
- Prost, K.; Borchard, N.; Siemens, J.; Kautz, T.; Séquaris, J.M.; Möller, A.; Amelung, W. Biochar affected by composting with farmyard manure. J. Environ. Qual. 2013, 42, 164–172. [Google Scholar] [CrossRef] [PubMed] [Green Version]
- Tryon, E.H. Effect of charcoal on certain physical, chemical, and biological properties of forest soils. Ecol. Monogr. 1948, 18, 81–115. [Google Scholar] [CrossRef]
- Dias, B.O.; Silva, C.A.; Higashikawa, F.S.; Roig, A.; Sánchez-Monedero, M.A. Use of biochar as bulking agent for the composting of poultry manure: Effect on organic matter degradation and humification. Bioresour. Technol. 2010, 101, 1239–1246. [Google Scholar] [CrossRef]
- Khan, N.; Clark, I.; Sánchez-Monedero, M.A.; Shea, S.; Meier, S.; Qi, F.; Kookana, R.S.; Bolan, N. Physical and chemical properties of biochars co-composted with biowastes and incubated with a chicken litter compost. Chemosphere 2016, 142, 14–23. [Google Scholar] [CrossRef]
- Pignatello, J.J.; Kwon, S.; Lu, Y. Effect of natural organic substances on the surface and adsorptive properties of environmental black carbon (char): Attenuation of surface activity by humic and fulvic acids. Environ. Sci. Technol. 2006, 40, 7757–7763. [Google Scholar] [CrossRef] [PubMed]
- Wiedner, K.; Fischer, D.; Walther, S.; Criscuoli, I.; Favilli, F.; Nelle, O.; Glaser, B. Acceleration of biochar surface oxidation during composting? J. Agric. Food Chem. 2015, 63, 3830–3837. [Google Scholar] [CrossRef]
- Zhang, A.; Liu, Y.; Pan, G.; Hussain, Q.; Li, L.; Zheng, J.; Zhang, X. Effect of biochar amendment on maize yield and greenhouse gas emissions from a soil organic carbon poor calcareous loamy soil from Central China Plain. Plant Soil 2012, 351, 263–275. [Google Scholar] [CrossRef]
- Joseph, S.; Kammann, C.I.; Shepherd, J.G.; Conte, P.; Schmidt, H.P.; Hagemann, N.; Rich, A.M.; Marjo, C.E.; Allen, J.; Munroe, P.; et al. Microstructural and associated chemical changes during the composting of a high temperature biochar: Mechanisms for nitrate, phosphate and other nutrient retention and release. Sci. Total Environ. 2018, 618, 1210–1223. [Google Scholar] [CrossRef] [Green Version]
- Vanek, S.J.; Lehmann, J. Phosphorus availability to beans via interactions between mycorrhizas and biochar. Plant Soil 2015, 395, 105–123. [Google Scholar] [CrossRef]
- Spokas, K.A.; Novak, J.M.; Stewart, C.E.; Cantrell, K.B.; Uchimiya, M.; DuSaire, M.G.; Ro, K.S. Qualitative analysis of volatile organic compounds on biochar. Chemosphere 2011, 85, 869–882. [Google Scholar] [CrossRef]
- Gunther, S. Biochar 10, mother nature network. Plant Soil 2009, 8, 236–242. [Google Scholar]
- Martins, O.; Dewes, T. Loss of nitrogenous compounds during composting of animal wastes. Bioresour. Technol. 1992, 42, 103–111. [Google Scholar] [CrossRef]
- Leite, J.C.S.P.; Freeman, P. Requirements validation through viewpoint resolution. IEEE Trans. Software Eng. 1991, 17, 1253–1269. [Google Scholar] [CrossRef]
- ASTM. Standard Test Method for Chemical Analysis of Wood Charcoal; American Society for Testing and Materials: Conshohocken, PA, USA, 2009. [Google Scholar]
- Brake, J.D. A practical guide for composting poultry litter. Bull. Miss. Agric. For. Exp. Stn. 1992, 97, 1–9. [Google Scholar]
- Brunauer, S.; Emmett, P.H.; Teller, E. Adsorption of gases in multimolecular layers. J. Am. Chem. Soc. 1938, 60, 309–319. [Google Scholar] [CrossRef]
- Firestone, M.K.; Firestone, R.B.; Tiedje, J.M. Nitrous oxide from soil denitrification: Factors controlling its biological production. Science 1980, 208, 749–751. [Google Scholar] [CrossRef] [PubMed]
- Mulvaney, R.L.; Yaremych, S.A.; Khan, S.A.; Swiader, J.M.; Horgan, B.P. Use of diffusion to determine soil cation-exchange capacity by ammonium saturation. Commun. Soil Sci. Plant. Anal. 2004, 35, 51–67. [Google Scholar] [CrossRef]
- Enders, A.; Lehmann, J. Comparison of wet-digestion and dry-ashing methods for total elemental analysis of biochar. Commun. Soil Sci. Plant. Anal. 2012, 43, 1042–1052. [Google Scholar] [CrossRef]
- Shapter, R. The estimation of phosphorus in plant material. J. Proc. Aust. Chem. Inst. 1940, 7, 155–163. [Google Scholar]
- Wright, R.J.; Stuczynski, T. Atomic absorption and flame emission spectrometry. In Methods of Soil Analysis, Part 3: Chemical Methods; John Wiley & Sons: Hoboken, NJ, USA, 1996; Volume 5, pp. 65–90. [Google Scholar]
- Goyal, H.; Seal, D.; Saxena, R. Bio-fuels from thermochemical conversion of renewable resources: A review. Renew. Sustain. Energy Rev. 2008, 12, 504–517. [Google Scholar] [CrossRef]
- Chia, C.H.; Gong, B.; Joseph, S.D.; Marjo, C.E.; Munroe, P.; Rich, A.M. Imaging of mineral-enriched biochar by FTIR, Raman and SEM–EDX. Vib. Spectrosc. 2012, 62, 248–257. [Google Scholar] [CrossRef]
- Mukome, F.N.; Zhang, X.; Silva, L.C.; Six, J.; Parikh, S.J. Use of chemical and physical characteristics to investigate trends in biochar feedstocks. J. Agric. Food Chem. 2013, 61, 2196–2204. [Google Scholar] [CrossRef]
- Hossain, M.K.; Strezov, V.; Chan, K.Y.; Ziolkowski, A.; Nelson, P.F. Influence of pyrolysis temperature on production and nutrient properties of wastewater sludge biochar. J. Environ. Manag. 2011, 92, 223–228. [Google Scholar] [CrossRef] [PubMed]
- Peng, X.Y.L.L.; Ye, L.L.; Wang, C.H.; Zhou, H.; Sun, B. Temperature-and duration-dependent rice straw-derived biochar: Characteristics and its effects on soil properties of an Ultisol in southern China. Soil Tillage Res. 2011, 112, 159–166. [Google Scholar] [CrossRef]
- Zornoza, R.; Moreno-Barriga, F.; Acosta, J.A.; Muñoz, M.A.; Faz, A. Stability, nutrient availability and hydrophobicity of biochars derived from manure, crop residues, and municipal solid waste for their use as soil amendments. Chemosphere 2016, 144, 122–130. [Google Scholar] [CrossRef] [PubMed]
- Singh, B.; Singh, B.P.; Cowie, A.L. Characterisation and evaluation of biochars for their application as a soil amendment. Soil Res. 2010, 48, 516–525. [Google Scholar] [CrossRef]
- Cely, P.; Gascó, G.; Paz-Ferreiro, J.; Méndez, A. Agronomic properties of biochars from different manure wastes. J. Anal. Appl. Pyrolysis 2015, 111, 173–182. [Google Scholar] [CrossRef] [Green Version]
- Ippolito, J.A.; Ducey, T.F.; Cantrell, K.B.; Novak, J.M.; Lentz, R.D. Designer, acidic biochar influences calcareous soil characteristics. Chemosphere 2016, 142, 184–191. [Google Scholar] [CrossRef]
- Jeffery, S.; Abalos, D.; Prodana, M.; Bastos, A.C.; van Groenigen, J.W.; Hungate, B.A.; Verheijen, F. Biochar boosts tropical but not temperate crop yields. Environ. Res. Lett. 2017, 12, 053001. [Google Scholar] [CrossRef]
- Wang, Y.; Dong, H.; Li, L.; Tian, R.; Chen, J.; Ning, Q.; Wang, B.; Tang, L.; Zeng, G. Influence of feedstocks and modification methods on biochar’s capacity to activate hydrogen peroxide for tetracycline removal. Bioresour. Technol. 2019, 291, 121840. [Google Scholar] [CrossRef]
- Purakayastha, T.; Kumari, S.; Pathak, H. Characterisation, stability, and microbial effects of four biochars produced from crop residues. Geoderma 2015, 239, 293–303. [Google Scholar] [CrossRef]
- Pradhan, S.; Abdelaal, A.H.; Mroue, K.; Al-Ansari, T.; Mackey, H.R.; McKay, G. Biochar from vegetable wastes: Agro-environmental characterization. Biochar 2020, 2, 439–453. [Google Scholar] [CrossRef]
- Al-Wabel, M.I.; Al-Omran, A.; El-Naggar, A.H.; Nadeem, M.; Usman, A.R. Pyrolysis temperature induced changes in characteristics and chemical composition of biochar produced from conocarpus wastes. Bioresour. Technol. 2013, 131, 374–379. [Google Scholar] [CrossRef]
- Tan, G.; Shi, F.; Sun, H.; Zhao, L.D.; Uher, C.; Dravid, V.P.; Kanatzidis, M.G. SnTe–AgBiTe 2 as an efficient thermoelectric material with low thermal conductivity. J. Mater. Chem. 2014, 2, 20849–20854. [Google Scholar] [CrossRef]
- Manohara, B.; Belagali, S. Evaluation of energy dispersive scanning electron microscopy and X-ray fluorescence techniques for analysis of compost quality. Anal. Methods 2017, 9, 253–258. [Google Scholar]
- Vandecasteele, B.; Sinicco, T.; D’Hose, T.; Nest, T.V.; Mondini, C. Biochar amendment before or after composting affects compost quality and N losses, but not P plant uptake. J. Environ. Manag. 2016, 168, 200–209. [Google Scholar] [CrossRef] [PubMed]
- Cao, X.; Harris, W. Properties of dairy-manure-derived biochar pertinent to its potential use in remediation. Bioresour. Technol. 2010, 101, 5222–5228. [Google Scholar] [CrossRef] [PubMed]
- Yao, Y.; Gao, B.; Inyang, M.; Zimmerman, A.R.; Cao, X.; Pullammanappallil, P.; Yang, L. Biochar derived from anaerobically digested sugar beet tailings: Characterization and phosphate removal potential. Bioresour. Technol. 2011, 102, 6273–6278. [Google Scholar] [CrossRef] [PubMed]
- Shaaban, A.; Se, S.M.; Mitan, N.M.M.; Dimin, M.F. Characterization of biochar derived from rubber wood sawdust through slow pyrolysis on surface porosities and functional groups. Procedia Eng. 2013, 68, 365–371. [Google Scholar] [CrossRef] [Green Version]
- Behazin, E.; Ogunsona, E.; Rodriguez-Uribe, A.; Mohanty, A.K.; Misra, M.; Anyia, A.O. Mechanical, chemical, and physical properties of wood and perennial grass biochars for possible composite application. BioResources 2016, 11, 1334–1348. [Google Scholar] [CrossRef]
- Li, F.; Shen, K.; Long, X.; Wen, J.; Xie, X.; Zeng, X.; Liang, Y.; Wei, Y.; Lin, Z.; Huang, W.; et al. Preparation and characterization of biochars from Eichornia crassipes for cadmium removal in aqueous solutions. PLoS ONE 2016, 11, e0148132. [Google Scholar] [CrossRef] [Green Version]
- Fan, J.; Cai, C.; Chi, H.; Reid, B.J.; Coulon, F.; Zhang, Y.; Hou, Y. Remediation of cadmium and lead polluted soil using thiol-modified biochar. J. Hazard. Mater. 2020, 388, 122037. [Google Scholar] [CrossRef]
- Waqas, M.; Aburiazaiza, A.S.; Miandad, R.; Rehan, M.; Barakat, M.A.; Nizami, A.S. Development of biochar as fuel and catalyst in energy recovery technologies. J. Clean. Prod. 2018, 188, 477–488. [Google Scholar] [CrossRef]
- Özçimen, D.; Ersoy-Meriçboyu, A. Characterization of biochar and bio-oil samples obtained from carbonization of various biomass materials. Renew. Energy 2010, 35, 1319–1324. [Google Scholar] [CrossRef]
- Zheng, H.; Wang, Z.; Deng, X.; Zhao, J.; Luo, Y.; Novak, J.; Herbert, S.; Xing, B. Characteristics and nutrient values of biochars produced from giant reed at different temperatures. Bioresour. Technol. 2013, 130, 463–471. [Google Scholar] [CrossRef]
- Jindo, K.; Mizumoto, H.; Sawada, Y.; Sanchez-Monedero, M.A.; Sonoki, T. Physical and chemical characterization of biochars derived from different agricultural residues. Biogeosciences 2014, 11, 6613–6621. [Google Scholar] [CrossRef] [Green Version]
- Yakout, S.M.; Daifullah, A.E.H.M.; El-Reefy, S.A. Pore structure characterization of chemically modified biochar derived from rice straw. Environ. Eng. Manag. J. 2015, 14, 473–480. [Google Scholar] [CrossRef]
- Meng, J.; Wang, L.; Liu, X.; Wu, J.; Brookes, P.C.; Xu, J. Physicochemical properties of biochar produced from aerobically composted swine manure and its potential use as an environmental amendment. Bioresour. Technol. 2013, 142, 641–646. [Google Scholar] [CrossRef] [PubMed]
- Pituello, C.; Francioso, O.; Simonetti, G.; Pisi, A.; Torreggiani, A.; Berti, A.; Morari, F. Characterization of chemical–physical, structural and morphological properties of biochars from biowastes produced at different temperatures. J. Soils Sediments 2015, 15, 792–804. [Google Scholar] [CrossRef]
- Stoyle, A. Biochar Production for Carbon Sequestration. Bachelor’s Thesis, Worcester Polytechnic Institute, Worcester, MA, USA, 2011. [Google Scholar]
- Kacprzak, A.; Kobyłecki, R.; Włodarczyk, R.; Bis, Z. The effect of fuel type on the performance of a direct carbon fuel cell with molten alkaline electrolyte. J. Power Sources 2014, 255, 179–186. [Google Scholar] [CrossRef]
- Liu, X.; Zhang, Y.; Li, Z.; Feng, R.; Zhang, Y. Characterization of corncob-derived biochar and pyrolysis kinetics in comparison with corn stalk and sawdust. Bioresour. Technol. 2014, 170, 76–82. [Google Scholar] [CrossRef] [PubMed]
- Devi, P.; Saroha, A.K.J.B.T. Effect of pyrolysis temperature on polycyclic aromatic hydrocarbons toxicity and sorption behaviour of biochars prepared by pyrolysis of paper mill effluent treatment plant sludge. Bioresour. Technol. 2015, 192, 312–320. [Google Scholar] [CrossRef]
- Chan, K.Y.; Xu, Z. Biochar: Nutrient properties and their enhancement. Biochar For. Environ. Manag. Sci. Technol. 2009, 1, 67–84. [Google Scholar]
- Vassilev, S.V.; Baxter, D.; Andersen, L.K.; Vassileva, C.G. An overview of the chemical composition of biomass. Fuel 2010, 89, 913–933. [Google Scholar] [CrossRef]
- Hossain, M.A.; Ngo, H.H.; Guo, W.S.; Nguyen, T.V. Biosorption of Cu (II) from water by banana peel based biosorbent: Experiments and models of adsorption and desorption. J. Water Sustain. 2012, 2, 87–104. [Google Scholar]
- Chen, Y.; Yang, H.; Yang, Q.; Hao, H.; Zhu, B.; Chen, H. Torrefaction of agriculture straws and its application on biomass pyrolysis poly-generation. Bioresour. Technol. 2014, 156, 70–77. [Google Scholar] [CrossRef] [PubMed]
- Abdulrazzaq, H.; Jol, H.; Husni, A.; Abu-Bakr, R. Characterization and stabilisation of biochars obtained from empty fruit bunch, wood, and rice husk. BioResources 2014, 9, 2888–2898. [Google Scholar] [CrossRef]
- Gomez-Serrano, V.; Pastor-Villegas, J.; Perez-Florindo, A.; Duran-Valle, C.; Valenzuela-Calahorro, C. FT-IR study of rockrose and of char and activated carbon. J. Anal. Appl. Pyrolysis 1996, 36, 71–80. [Google Scholar] [CrossRef]
- Ghani, W.A.W.A.K.; Mohd, A.; da Silva, G.; Bachmann, R.T.; Taufiq-Yap, Y.H.; Rashid, U.; Ala’a, H. Biochar production from waste rubber-wood-sawdust and its potential use in C sequestration: Chemical and physical characterization. Ind. Crop. Prod. 2013, 44, 18–24. [Google Scholar] [CrossRef]
- Abouelwafa, R.; Amir, S.; Souabi, S.; Winterton, P.; Ndira, V.; Revel, J.C.; Hafidi, M. The fulvic acid fraction as it changes in the mature phase of vegetable oil-mill sludge and domestic waste composting. Bioresour. Technol. 2008, 99, 6112–6118. [Google Scholar] [CrossRef] [PubMed]
- Song, C.; Li, M.; Xi, B.; Wei, Z.; Zhao, Y.; Jia, X.; Qi, H.; Zhu, C. Characterisation of dissolved organic matter extracted from the bio-oxidative phase of co-composting of biogas residues and livestock manure using spectroscopic techniques. Int. Biodeterior. Biodegrad. 2015, 103, 38–50. [Google Scholar] [CrossRef]
- Wang, D.; Zhou, X.; Meng, Y.; Chen, Z. Durability of concrete containing fly ash and silica fume against combined freezing-thawing and sulfate attack. Constr. Build. Mater. 2017, 147, 398–406. [Google Scholar] [CrossRef]
- Mahmoud, E.; Ibrahim, M.; Ali, N.; Ali, H. Spectroscopic analyses to study the effect of biochar and compost on dry mass of canola and heavy metal immobilization in soil. Commun. Soil Sci. Plant. Anal. 2018, 49, 1990–2001. [Google Scholar] [CrossRef]
- Li, H.; Zhang, T.; Tsang, D.C.; Li, G. Effects of external additives: Biochar, bentonite, phosphate, on co-composting for swine manure and corn straw. Chemosphere 2020, 248, 125927. [Google Scholar] [CrossRef] [PubMed]
- El Fels, L.; Zamama, M.; Aguelmous, A.; El Hayany, B.; El Glaoui, G.E.M.; Benksim, A.; Rahhou, I.; Mounir, A.; Khajmi, H.; Rihani, M.; et al. Assessment of organo-mineral fraction during co-composting of sewage sludge-lignocellulosic waste by XRD and FTIR analysis. Mor. J. Chem. 2017, 5, 730–739. [Google Scholar]
- Azargohar, R.; Nanda, S.; Kozinski, J.A.; Dalai, A.K.; Sutarto, R. Effects of temperature on the physicochemical characteristics of fast pyrolysis bio-chars derived from Canadian waste biomass. Fuel 2014, 125, 90–100. [Google Scholar] [CrossRef]
- Zhao, B.; Nartey, O.D. Characterization and evaluation of biochars derived from agricultural waste biomasses from Gansu, China. In Proceedings of the World Congress on Advances in Civil, Environmental, and Materials Research, Busan, Korea, 24–28 August 2014. [Google Scholar]
- Yuan, J.-H.; Xu, R.-K.; Zhang, H. The forms of alkalis in the biochar produced from crop residues at different temperatures. Bioresour. Technol. 2011, 102, 3488–3497. [Google Scholar] [CrossRef] [PubMed]
- Ding, Z.; Wan, Y.; Hu, X.; Wang, S.; Zimmerman, A.R.; Gao, B. Sorption of lead and methylene blue onto hickory biochars from different pyrolysis temperatures: Importance of physicochemical properties. J. Ind. Eng. Chem. 2016, 37, 261–267. [Google Scholar] [CrossRef] [Green Version]
- Ahmad, M.; Lee, S.S.; Lee, S.E.; Al-Wabel, M.I.; Tsang, D.C.; Ok, Y.S. Biochar-induced changes in soil properties affected immobilization/mobilization of metals/metalloids in contaminated soils. J. Soil Sediments 2017, 17, 717–730. [Google Scholar] [CrossRef]
- Parr, J.F.; Sullivan, L. Soil carbon sequestration in phytoliths. Soil Biol. Biochem. 2005, 37, 117–124. [Google Scholar] [CrossRef]
- Amonette, J.E.; Joseph, S. Characteristics of biochar: Microchemical properties. In Biochar for Environmental Management: Science and Technology; Earthscan: London, UK, 2009; Volume 33. [Google Scholar]
- Han, L.; Qian, L.; Liu, R.; Chen, M.; Yan, J.; Hu, Q. Lead adsorption by biochar under the elevated competition of cadmium and aluminum. Sci. Rep. 2017, 7, 1–11. [Google Scholar] [CrossRef] [PubMed] [Green Version]
- Domingues, R.R.; Trugilho, P.F.; Silva, C.A.; Melo, I.C.N.D.; Melo, L.C.; Magriotis, Z.M.; Sanchez-Monedero, M.A. Properties of biochar derived from wood and high-nutrient biomasses with the aim of agronomic and environmental benefits. PLoS ONE 2017, 12, e0176884. [Google Scholar] [CrossRef] [Green Version]
- Hu, Z.; Liu, Y.; Chen, G.; Gui, X.; Chen, T.; Zhan, X. Characterization of organic matter degradation during composting of manure–straw mixtures spiked with tetracyclines. Bioresour. Technol. 2011, 102, 7329–7334. [Google Scholar] [CrossRef] [PubMed]
- Liang, S.; Han, Y.; Wei, L.; McDonald, A.G. Production and characterization of bio-oil and bio-char from pyrolysis of potato peel wastes. Biomass Convers. Biorefinery 2015, 5, 237–246. [Google Scholar] [CrossRef]
- Lehmann, J.; Rillig, M.C.; Thies, J.; Masiello, C.A.; Hockaday, W.C.; Crowley, D. Biochar effects on soil biota–a review. Soil Biol. Biochem. 2011, 43, 1812–1836. [Google Scholar] [CrossRef]
- Suliman, W.; Harsh, J.B.; Abu-Lail, N.I.; Fortuna, A.M.; Dallmeyer, I.; Garcia-Perez, M. Influence of feedstock source and pyrolysis temperature on biochar bulk and surface properties. Biomass Bioenergy 2016, 84, 37–48. [Google Scholar] [CrossRef]
- Claoston, N.; Samsuri, A.W.; Ahmad Husni, M.H.; Mohd Amran, M.S. Effects of pyrolysis temperature on the physicochemical properties of empty fruit bunch and rice husk biochars. Waste Manag. Res. 2014, 32, 331–339. [Google Scholar] [CrossRef] [PubMed]
- Zielińska, A.; Oleszczuk, P.; Charmas, B.; Skubiszewska-Zięba, J.; Pasieczna-Patkowska, S. Effect of sewage sludge properties on the biochar characteristic. J. Anal. Appl. Pyrolysis 2015, 112, 201–213. [Google Scholar] [CrossRef]
- Laskin, A.; Cowin, J.P. Automated single-particle SEM/EDX analysis of submicrometer particles down to 0.1 μm. Anal. Chem. 2001, 73, 1023–1029. [Google Scholar] [CrossRef] [PubMed]
- Mary, G.S.; Sugumaran, P.; Niveditha, S.; Ramalakshmi, B.; Ravichandran, P.; Seshadri, S. Production, characterization and evaluation of biochar from pod (Pisum sativum), leaf (Brassica oleracea) and peel (Citrus sinensis) wastes. Int. J. Recycl. Org. Waste Agric. 2016, 5, 43–53. [Google Scholar] [CrossRef] [Green Version]
- Zama, E.F.; Reid, B.J.; Arp, H.P.H.; Sun, G.X.; Yuan, H.Y.; Zhu, Y.G. Advances in research on the use of biochar in soil for remediation: A review. J. Soil Sediments 2018, 18, 2433–2450. [Google Scholar] [CrossRef] [Green Version]
- Kim, B.; Murayama, M.; Colman, B.P.; Hochella, M.F. Characterization and environmental implications of nano-and larger TiO 2 particles in sewage sludge, and soils amended with sewage sludge. J. Environ. Monit. 2012, 14, 1128–1136. [Google Scholar] [CrossRef] [PubMed]
Figure 1.
Functional groups of organic materials.

Figure 2.
Crystalline stability of organic materials.

Figure 3.
SEM scans of fruits and vegetable waste (FVW), biochar (BC), compost (C), and co-composted biochar (BCC).
Figure 3.
SEM scans of fruits and vegetable waste (FVW), biochar (BC), compost (C), and co-composted biochar (BCC).

Figure 4.
Energy-dispersive X-ray spectroscopic elemental analysis of fruits and vegetable waste (FVW), biochar (BC), compost (C), and co-composted biochar (BCC).
Figure 4.
Energy-dispersive X-ray spectroscopic elemental analysis of fruits and vegetable waste (FVW), biochar (BC), compost (C), and co-composted biochar (BCC).


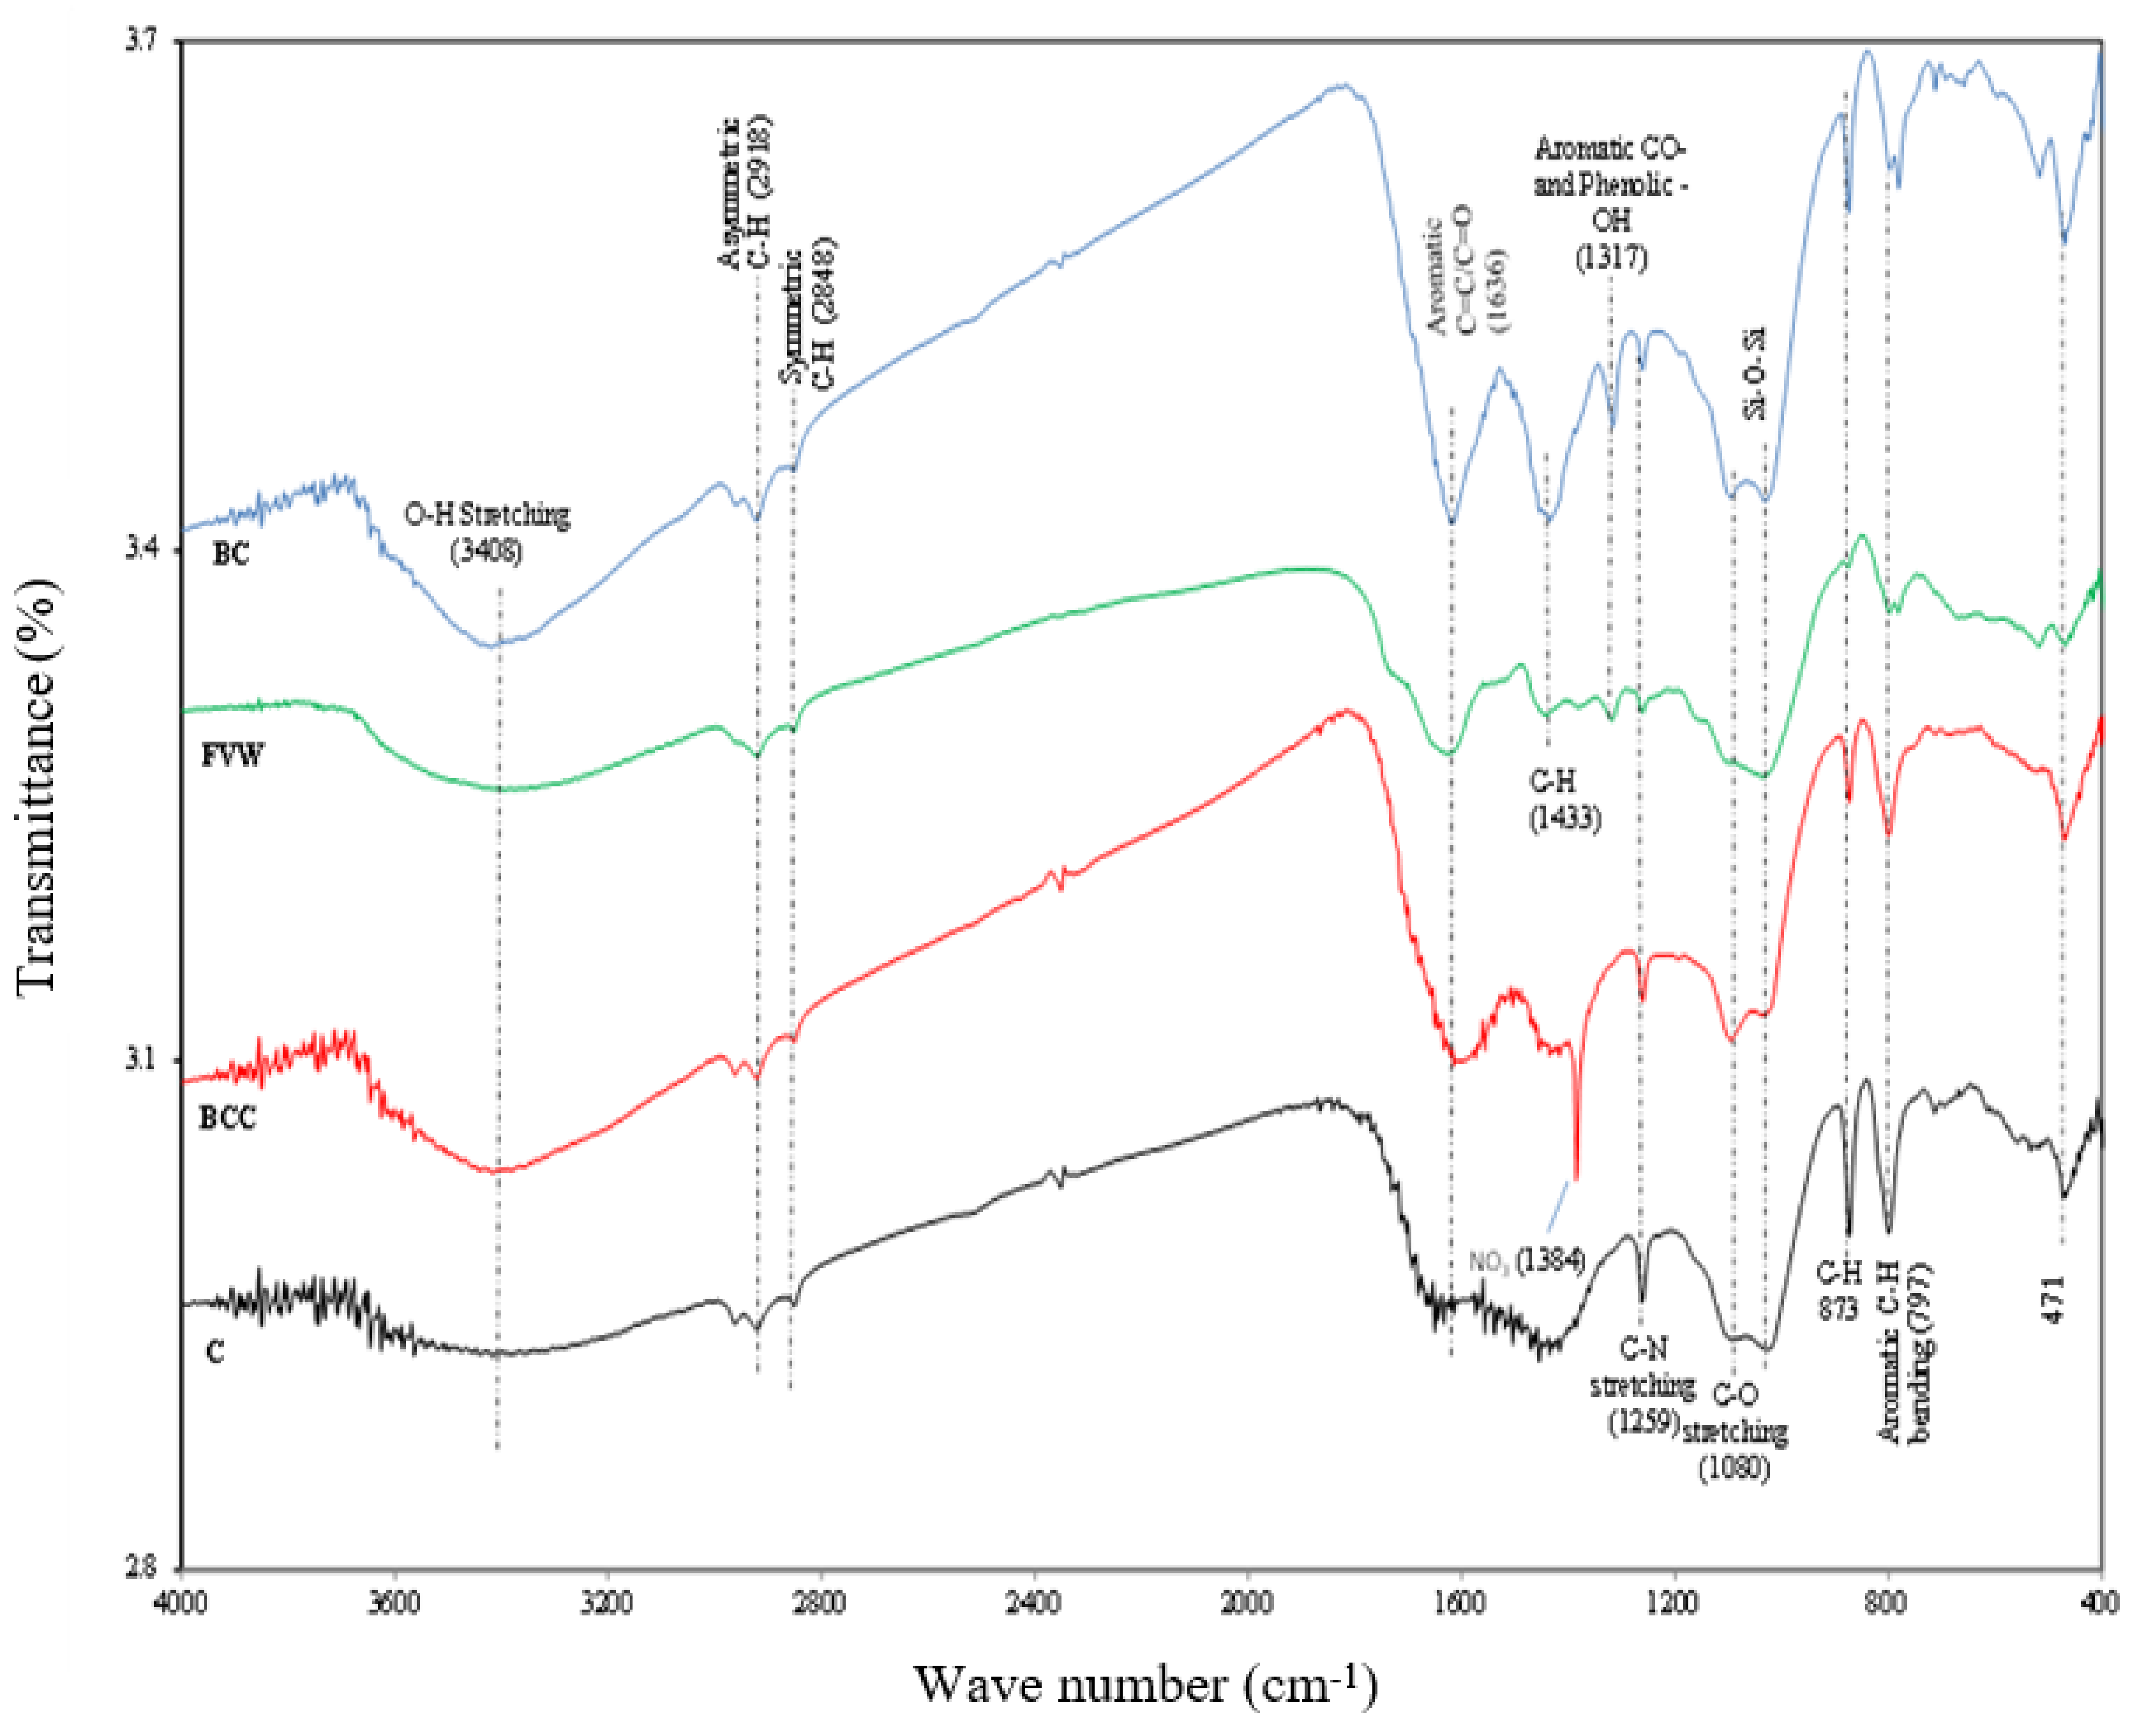
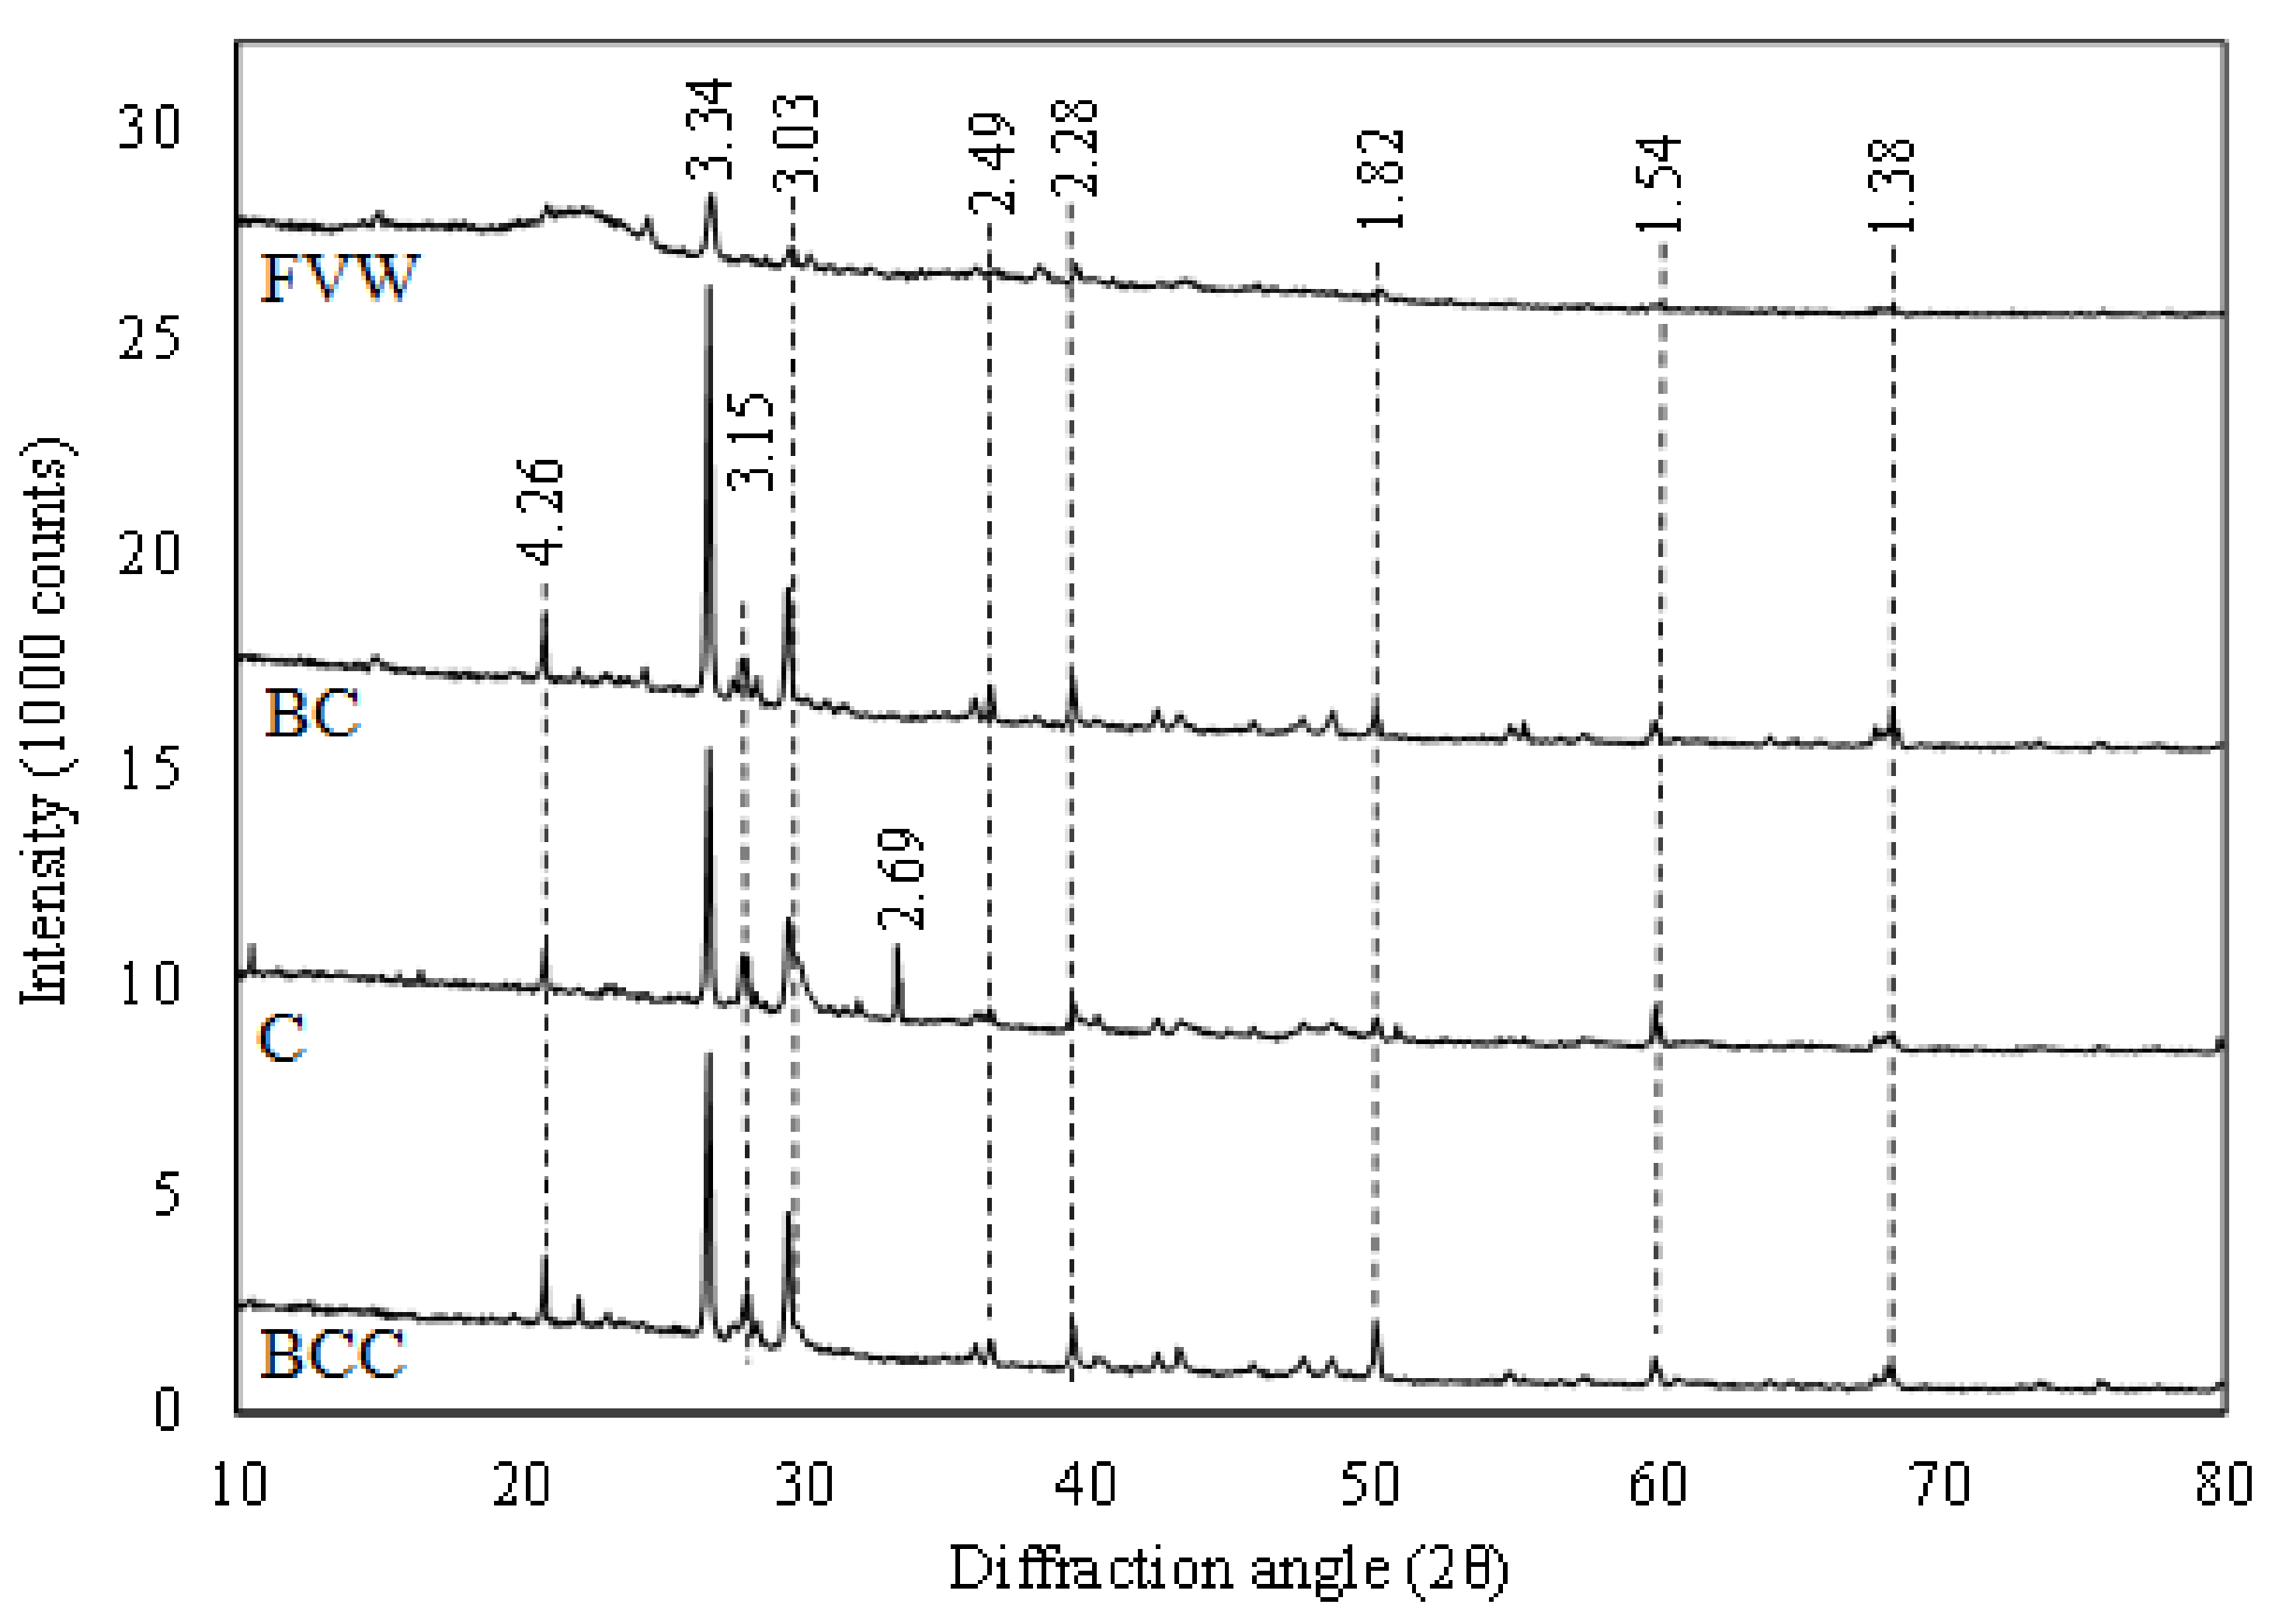
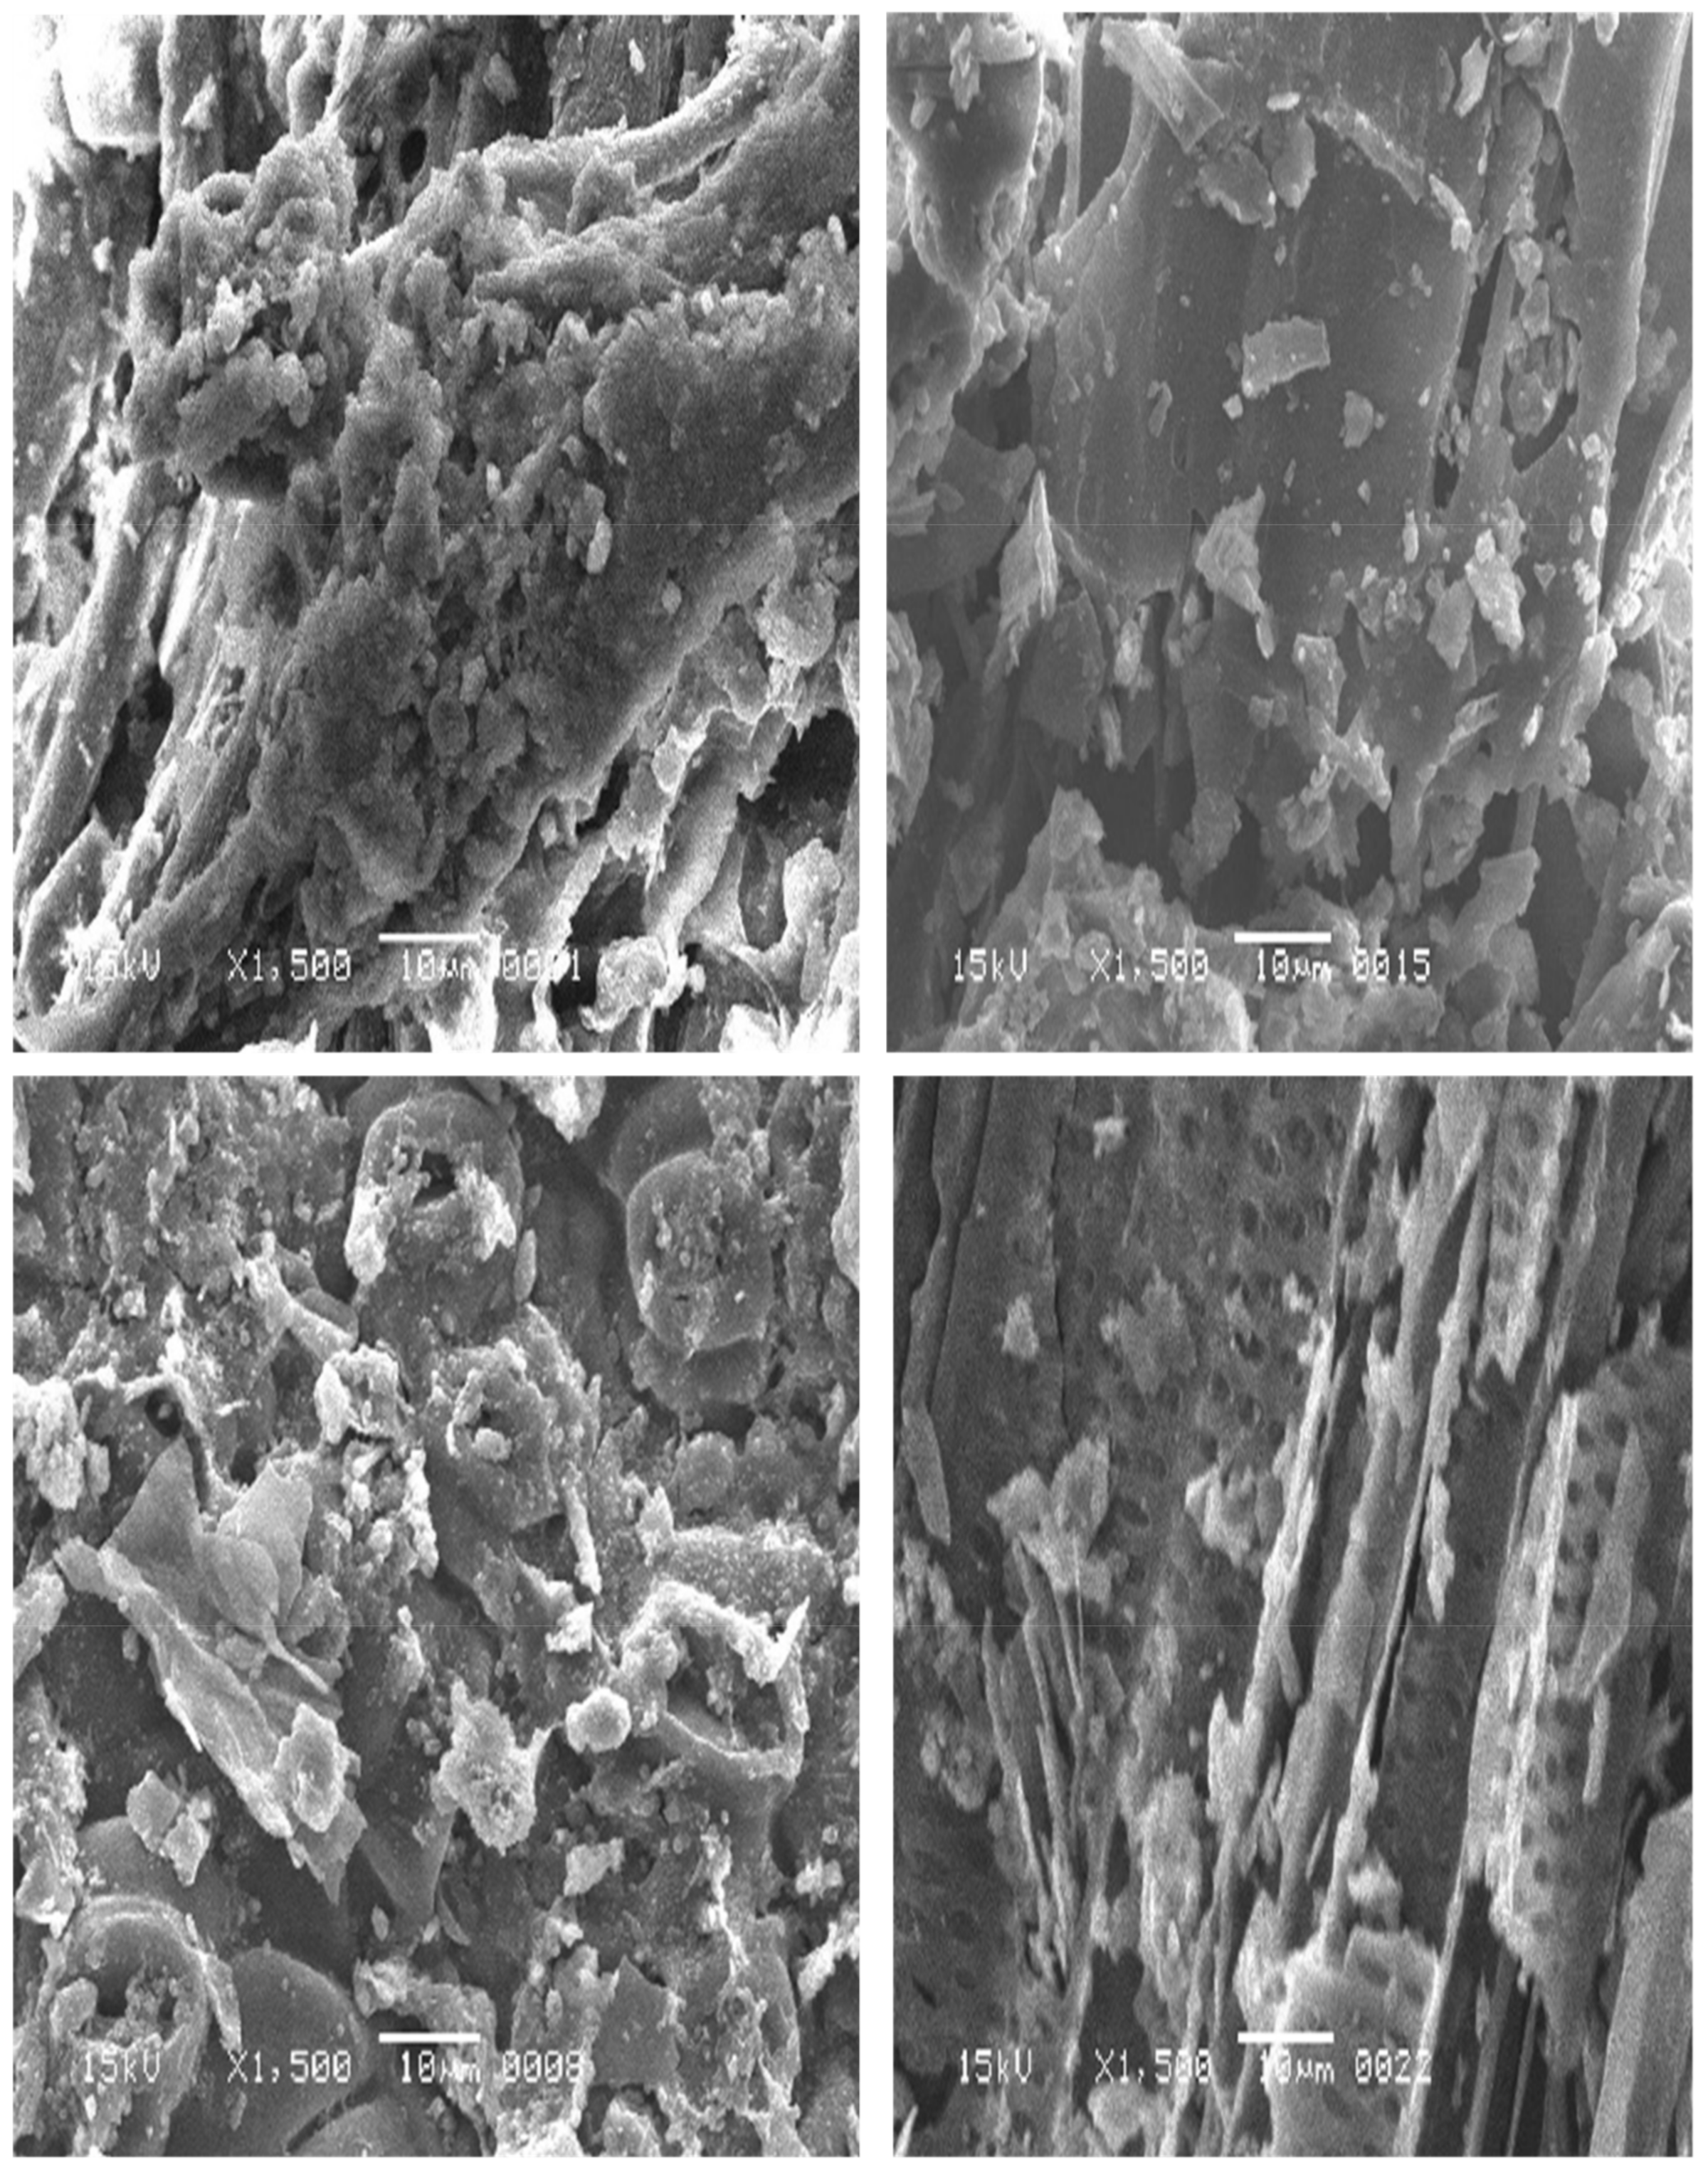
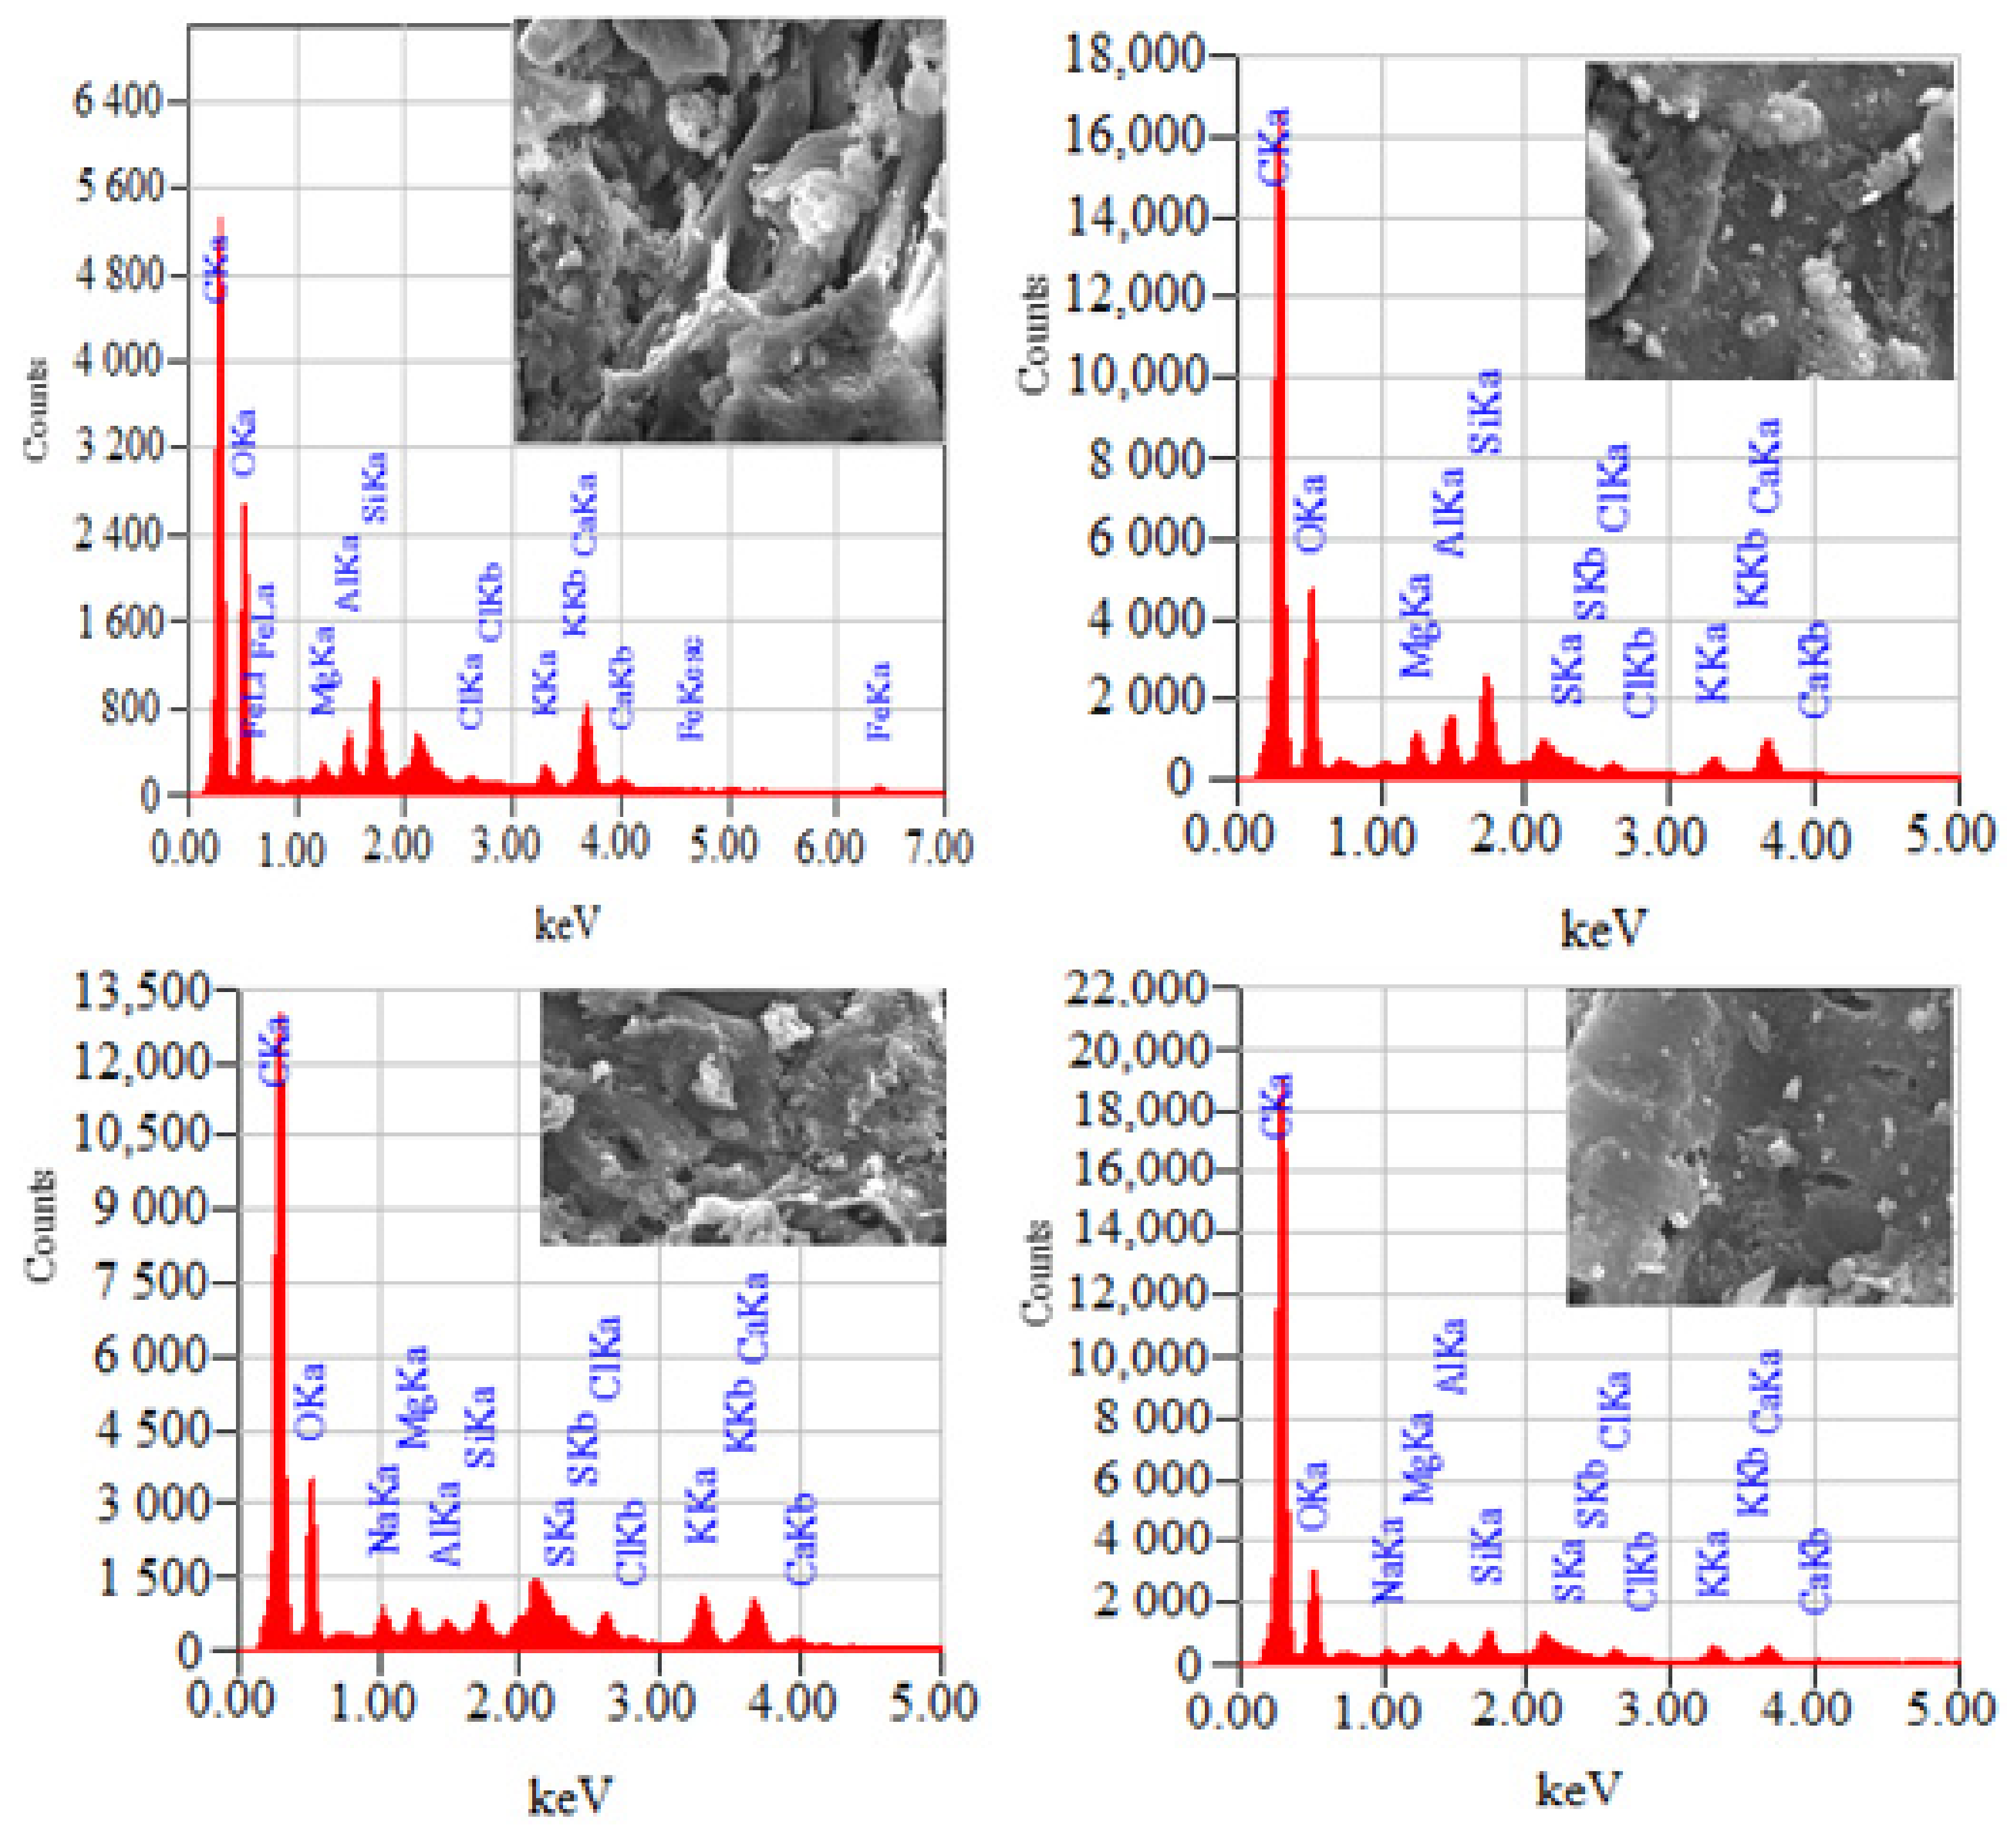
Table 1.
Proximate and chemical analysis of organic materials.
| Parameters | Unit | FVW | BC | C | BCC |
|---|---|---|---|---|---|
| Moisture | % | 4.99 ± 0.38 | 3.64 ± 0.11 | 5.68 ± 0.12 | 4.16 ± 0.09 |
| Volatile matter | % | 5.46 ± 0.12 | 3.08 ± 0.06 | 5.70 ± 0.14 | 3.54 ± 0.07 |
| Ash content | % | 43.9 ± 1.93 | 57.6 ± 0.67 | 45.5 ± 0.29 | 53.1 ± 0.26 |
| Fixed Carbon | % | ||||
| pH | - | 5.92 ± 0.03 | 7.62 ± 0.04 | 7.36 ± 0.03 | 7.59 ± 0.05 |
| EC | µS/cm | 0.32 ± 0.01 | 0.27 ± 0.01 | 0.51 ± 0.01 | 0.45 ± 0.01 |
| CEC | Cmol kg−1 | 37.6 ± 0.21 | 28.6 ± 0.13 | 41.8 ± 0.17 | 32.4 ± 0.11 |
| TOC | % | 42 ± 0.44 | 54 ± 0.48 | 37 ± 0.39 | 46 ± 0.37 |
| N | % | 4.30 ± 0.13 | 2.80 ± 0.11 | 2.70 ± 0.08 | 4.0 ± 0.23 |
| P | % | 0.76 ± 0.07 | 0.33 ± 0.04 | 0.59 ± 0.06 | 0.68 ± 0.04 |
| K | % | 4.64 ± 0.05 | 6.47 ± 0.05 | 4.23 ± 0.04 | 5.74 ± 0.06 |
| Zn | mg kg−1 | 1.98 ± 0.25 | 2.25 ± 0.16 | 3.63 ± 0.16 | 5.02 ± 0.15 |
| Fe | mg kg−1 | 3.30 ± 0.27 | 5.99 ± 0.10 | 18.6 ± 0.53 | 10.8 ± 0.39 |
| Mn | mg kg−1 | 0.30 ± 0.03 | 0.31 ± 0.03 | 0.45 ± 0.02 | 0.65 ± 0.03 |
| Cu | mg kg−1 | 0.35 ± 0.02 | 0.34 ± 0.03 | 0.37 ± 0.04 | 0.35 ± 0.02 |
| Ni, Pb, Cd, Cr | mg kg−1 | ND | ND | ND | ND |
FVW = fruits vegetables waste, BC = Biochar, C = Compost; BCC = Co-composted biochar.
Table 2.
Surface structure of organic materials.
| Organic Materials | BET Surface Area (m2/g) | Pore Volume (cc/g) | Pore Radius °A |
|---|---|---|---|
| FVW | 3.89 ± 0.09 | 0.0030 | 14.54 ± 0.47 |
| BC | 4.99 ± 0.07 | 0.0025 | 14.52 ± 0.62 |
| C | 4.43 ± 0.04 | 0.0140 | 14.48 ± 0.48 |
| BCC | 4.13 ± 0.05 | 0.0030 | 15.13 ± 0.13 |
FVW = fruits vegetables waste; BC = Biochar, C = Compost; BCC = Co-composted biochar.
Table 3.
Water extractable nutrients in organic materials through multi C-N analyzer and ICP-OES in unit of mg L−1.
Table 3.
Water extractable nutrients in organic materials through multi C-N analyzer and ICP-OES in unit of mg L−1.
| Parameters | MDL | FVW | BC | C | BCC |
|---|---|---|---|---|---|
| TDC | 100 | 4212 ± 165 | 740 ± 23.1 | 1698 ± 61.2 | 418 ± 4.62 |
| TDIC | 100 | 6.35 ± 1.9 | 48.4 ± 7.14 | 229 ± 13.7 | 45.2 ± 2.76 |
| TDOC | 4205 ± 167 | 691 ± 16.3 | 1469 ± 47.5 | 373 ± 7.38 | |
| TDN | 20 | 103 ± 2.22 | 46.0 ± 3.38 | 309 ± 6.45 | 278 ± 8.04 |
| P | 2.0 | 237 ± 17.9 | 33.6 ± 2.27 | 70.2 ± 3.70 | 26.9 ± 0.63 |
| K | 2.0 | 876 ± 30.2 | 890 ± 16.0 | 1617 ± 94.5 | 1181 ± 43.2 |
| Ca | 2.0 | 163 ± 15.7 | 36.9 ± 0.64 | 30.2 ± 2.06 | 26.1 ± 0.90 |
| Mg | 2.0 | 115 ± 6.42 | 26.2 ± 0.31 | 21.8 ± 2.40 | 23.9 ± 0.51 |
| Na | 2.0 | 154 ± 5.71 | 193 ± 3.27 | 538 ± 32.8 | 423 ± 12.7 |
| S | 2.0 | 110 ± 2.91 | 134 ± 4.63 | 185 ± 7.45 | 106 ± 2.20 |
| Zn | 0.5 | 0.43 ± 0.06 | 0.03 ± 0.01 | 0.38 ± 0.01 | 0.08 ± 0.01 |
| Cu | 0.5 | 0.15 ± 0.01 | 0.17 ± 0.02 | 0.67 ± 0.04 | 0.10 ± 0.02 |
| Fe | 0.5 | 0.63 ± 0.07 | 0.41 ± 0.01 | 2.64 ± 0.17 | 0.42 ± 0.02 |
| Mn | 0.5 | 4.88 ± 0.34 | 0.27 ± 0.01 | 0.14 ± 0.01 | 0.16 ± 0.01 |
MDL = Method detection limit is the lowest concentration at which an analyte can be detected in a sample with 99% certainty. FVW = fruits vegetables waste; BC = Biochar; C = Compost; BCC = Co-composted biochar.
Table 4.
Effect of feedstock and pyrolysis temperature on surface properties (surface area, pore volume) of biochar.
Table 4.
Effect of feedstock and pyrolysis temperature on surface properties (surface area, pore volume) of biochar.
| Feedstock | Temperature (°C) | Surface Area (m2 g−1) | Pore Volume | References |
|---|---|---|---|---|
| Rubber wood sawdust | 300 | 1.93 | 3.366 × 10⁻³ cm3 g−1 | [77] |
| 500 | 2.01 | 6.371 × 10⁻³ cm3 g−1 | ||
| 700 | 5.49 | 9.655 × 10⁻³ cm3 g−1 | ||
| Miscanthus | 500 | 6.52 | 1.23 × 10⁻² cc g−1 | [78] |
| Switchgrass | 500 | 10.26 | 2.12 × 10⁻² cc g−1 | |
| Softwood chip | 500 | 103.5 | 7.76 × 10⁻² cc g−1 | |
| Swine manure | 400 | 5.7 | 0.0015 cc g−1 | [18] |
| 500 | 3.9 | 0.0020 cc g−1 | ||
| 600 | 3.4 | 0.0016 cc g−1 | ||
| Eichornia crassipes | 300 | 3.52 | 0.0068 cc g−1 | [79] |
| 500 | 6.71 | 0.0148 cc g−1 | ||
| Rice straw | 500 | 7.82 | [80] | |
| Agricultural waste | 250 | 1.21 | 0.007 cc g−1 | [81] |
| 350 | 2.5 | 0.006 cc g−1 | ||
| 450 | 1.7 | 0.004 cc g−1 | ||
| Apricot Stone | 11.25 | [82] | ||
| Hazelnut | 14.68 | |||
| Grapeseed | 14.48 | |||
| Chestnut shell | 0.67 | |||
| Giant reed | 300 | 2.72 | [83] | |
| 350 | 2.16 | |||
| 400 | 3.04 | |||
| 500 | 2.58 | |||
| Apple tree branch | 400 | 11.90 | [84] | |
| 500 | 58.60 | |||
| 600 | 208.69 | |||
| Oak tree | 400 | 5.60 | ||
| 500 | 103.17 | |||
| 600 | 288.58 | |||
| Rice husk | 400 | 193.70 | ||
| 500 | 262.00 | |||
| 600 | 243.00 | |||
| Rice straw | 400 | 46.60 | ||
| 500 | 59.91 | |||
| 600 | 129.00 | |||
| Rice straw | 550 | 71.35 | 0.055 m3 g−1 | [85] |
| 650 | 76.2 | 0.063 m3 g−1 | ||
| 750 | 63.0 | 0.052 m3 g−1 | ||
| Swine manure compost (21 days) | 400 | 4.26 | 0.01145 m3 g−1 | [86] |
| 700 | 116.90 | 0.08019 m3 g−1 | ||
| Cattle manure and silage | 250 | 1.4 | [87] | |
| 350 | 2.2 | |||
| 450 | 2.9 | |||
| 550 | 58.6 | |||
| Municipal organic waste | 250 | 0.7 | ||
| 350 | 5.6 | |||
| 450 | 27.3 | |||
| 550 | 77.7 | |||
| Poultry litter | 250 | 0.5 | ||
| 350 | 0.9 | |||
| 450 | 2.4 | |||
| 550 | 3.6 | |||
| Vineyard pruning residues | 250 | 0.5 | ||
| 350 | 1.3 | |||
| 450 | 1.1 | |||
| 550 | 19.2 | |||
| sewage sludge | 250 | 0.8 | ||
| 350 | 2.0 | |||
| 450 | 7.2 | |||
| 550 | 12.7 | |||
| Corn | 200 | 1.91 | [88] | |
| 350 | 2.44 | |||
| 500 | 31.7 | |||
| Rice | 200 | 1.92 | ||
| 350 | 27.8 | |||
| 500 | 198 | |||
| Apple tree chips | 450 | 6.65 | [89] | |
| Sunflower husks | 450 | 3.99 | ||
| Energetic willow shavings | 450 | 2.68 | ||
| Pine | 450 | 1.52 |
Publisher’s Note: MDPI stays neutral with regard to jurisdictional claims in published maps and institutional affiliations. |
© 2021 by the authors. Licensee MDPI, Basel, Switzerland. This article is an open access article distributed under the terms and conditions of the Creative Commons Attribution (CC BY) license (https://creativecommons.org/licenses/by/4.0/).
Share and Cite
MDPI and ACS Style
Mujtaba, G.; Hayat, R.; Hussain, Q.; Ahmed, M. Physio-Chemical Characterization of Biochar, Compost and Co-Composted Biochar Derived from Green Waste. Sustainability 2021, 13, 4628. https://0-doi-org.brum.beds.ac.uk/10.3390/su13094628
AMA Style
Mujtaba G, Hayat R, Hussain Q, Ahmed M. Physio-Chemical Characterization of Biochar, Compost and Co-Composted Biochar Derived from Green Waste. Sustainability. 2021; 13(9):4628. https://0-doi-org.brum.beds.ac.uk/10.3390/su13094628
Chicago/Turabian StyleMujtaba, Ghulam, Rifat Hayat, Qaiser Hussain, and Mukhtar Ahmed. 2021. "Physio-Chemical Characterization of Biochar, Compost and Co-Composted Biochar Derived from Green Waste" Sustainability 13, no. 9: 4628. https://0-doi-org.brum.beds.ac.uk/10.3390/su13094628
Note that from the first issue of 2016, this journal uses article numbers instead of page numbers. See further details here.