
Immersive Robotic Telepresence for Remote Educational Scenarios


1
Department of Computer Science, University of Luxembourg, L-4364 Esch-sur-Alzette, Luxembourg
2
Department of Mechanical, Informatics and Aerospace Engineering, University of León, 24071 León, Spain
*
Author to whom correspondence should be addressed.
Sustainability 2021, 13(9), 4717; https://0-doi-org.brum.beds.ac.uk/10.3390/su13094717
Submission received: 19 March 2021
/
Revised: 13 April 2021
/
Accepted: 20 April 2021
/
Published: 23 April 2021
(This article belongs to the Special Issue Visual Technologies for Sustainable Digital Environments)
Abstract
:Social robots have an enormous potential for educational applications and allow for cognitive outcomes that are similar to those with human involvement. Remotely controlling a social robot to interact with students and peers in an immersive fashion opens up new possibilities for instructors and learners alike. Using immersive approaches can promote engagement and have beneficial effects on remote lesson delivery and participation. However, the performance and power consumption associated with the involved devices are often not sufficiently contemplated, despite being particularly important in light of sustainability considerations. The contributions of this research are thus twofold. On the one hand, we present telepresence solutions for a social robot’s location-independent operation using (a) a virtual reality headset with controllers and (b) a mobile augmented reality application. On the other hand, we perform a thorough analysis of their power consumption and system performance, discussing the impact of employing the various technologies. Using the QTrobot as a platform, direct and immersive control via different interaction modes, including motion, emotion, and voice output, is possible. By not focusing on individual subsystems or motor chains, but the cumulative energy consumption of an unaltered robot performing remote tasks, this research provides orientation regarding the actual cost of deploying immersive robotic telepresence solutions.
1. Introduction
The potential of social robots for educational applications is enormous, allowing cognitive outcomes that are similar to those with human involvement [1]. While many research efforts focus on aspects related to autonomous and cognitive robotics for education [2,3,4,5], enabling learners and instructors to control a social robot remotely and to immersively interact with their peers and students opens up further possibilities for effective lesson delivery, participation, and tutoring in the classroom. For the operator, who could be either a teacher or a tutor (peer) [6], directly interacting with students is crucial for acquiring non-verbal feedback and observing immediate reactions to evaluate their comprehension [7].
Educational research distinguishes various communication mechanisms between students and instructors, i.e., teachers or tutors, which include non-verbal clues that are visible to the instructor during the lesson [7,8]. These clues involve monitoring and tracking motion to different extents and the time that students spend looking at materials or looking away. Conversely, instructor feedback to students is equally important to the learning process [9], and could be transmitted to students using the verbal and non-verbal capabilities of the robot. A social robot with diverse interaction modalities would thus increase the quality and amount of feedback delivered to students.
Virtual reality (VR) and augmented reality (AR) technologies lend themselves perfectly to complement pure human–robot interaction (HRI) scenarios where a robot is controlled remotely. Operators using a VR headset combined with motion-based control can naturally translate their movements into input, which, together with the visual, acoustic, and further channels of expression, allows for a highly immersive interaction between operator and student. Technologies such as emotion recognition and face detection further enhance how the operator can perceive the student.
Due to the proliferation and high availability of mobile networked devices, such as smartphones or tablets, in addition to the VR-based telepresence solution discussed in [10], in this article, we also introduce a mobile application for the location-independent operation of a social robot. Albeit slightly less immersive, an AR layer in a mobile application can also present much of the above information. Motion controls can be realized through both touch or gyroscopic input.
The recent COVID-19 pandemic has resulted in remote teaching at an unprecedented scale, with telepresence and related technologies gaining further significance. However, the performance and power consumption associated with the involved devices are often not sufficiently contemplated, despite being particularly important in light of sustainability considerations. In addition to discussing VR- and app-based telepresence solutions for the location-independent operation of a social robot (cf. Figure 1), we thus perform a thorough analysis of their power consumption and system performance, examining the impact of employing the various technologies. By not focusing on individual subsystems or motor chains, but the cumulative energy and message flows within an unaltered robot performing remote tasks, this research provides orientation regarding the actual cost of deploying immersive robotic telepresence (IRT) solutions.
1.1. Problem Description
Robotic telepresence in classroom settings has been the subject of research for several decades, resulting in different applied commercial solutions, such as Beam [11], Double [12], or Ubbo [13], along with many purely experimental approaches.
Zhang et al. [14], for instance, proposed a telepresence system based on a robot avatar controlled via a mobile-app solution where the robot fulfills the role of the teacher. In their work, they reviewed the major hardware and software components associated with telepresence systems. Other research approaches, such as that by Cha et al. [15], evaluated different design elements associated with robot and interface systems for deploying the platforms in classroom scenarios. Based on the Beam system, they analyzed different user experience challenges in teaching sessions through telepresence, such as communications, inclusion, or embodiment. Gallon et al. [16] presented an overview based on Self-Determination Theory (SDT), a psychological theory that was applied to understand the learning process and how to motivate and attract students’ attention. Using Transactional Distance (TD) theory, they suggested a multi-device system comprising a tablet serving as a whiteboard and a computer for robot control. TD focuses on technology-enabled teaching and learning, determining the degree of psychological distance between the student and the teacher, including the three variables of dialogue, structure, and learner autonomy.
The robots in all of these experiments consisted of a display or tablet computer mounted on a mobile drive unit, only vaguely resembling a human. Even with this non-anthropomorphic shape, such robots prove to be valuable for education, and embodiment constitutes a cornerstone of student engagement [17]. The addition of other humanoid features to the robot is usually omitted due to bandwidth requirements, as well as an increased interaction complexity and higher cognitive load for users [15]. In terms of interface, the final operator is provided with information similar to that of videoconferencing software, i.e., audio–visual data from the local robot are transmitted to the remote operator, and vice versa. Some complex tasks can be performed autonomously, such as approaching students or navigating in the classroom [14].
The majority of studies focus on enabling telepresence in the first place and rarely take an immersive approach [18], which would involve dedicated social robots, as in [10], or adapted robots, as in [19]. IRT solutions are much more common in, e.g., drone operation [20], since, once airborne, more degrees of freedom (DoFs) can be easily mapped to motion and sensorics, and VR technology [21] can potentially be involved to convey a higher informational bandwidth.
VR elements in an IRT system for educational purposes add another dimension to curricular components, offering many promising applications [22]. For instance, individuals interacting with VR textbooks show better performance and obtain better feedback than under traditional or video conditions [23]. VR has also been successfully employed in physical education for people with disabilities [24]. However, such advantages observed in VR studies also require analysis from a Robotics in Education (RiE) perspective [25], from a curricular point of view [26], and in the broader perspective of Inclusive Education [27] in order to be able to provide equal opportunities for all.
Although most of the reviewed IRT approaches are well motivated and well intended, the literature mainly focuses on the analysis of bandwidth consumption, operator experience, and final user acceptability. Deployment cost and resource consumption are rarely contemplated fully, which, under sustainability considerations, is highly relevant and might result in different design decisions, choices, and concerns.
1.2. Challenges
When deploying robots outside of a laboratory context, power consumption constraints become a central concern. Depending on the application, the robot’s battery can be drained in no time and can deteriorate the user experience. For instance, it is well known in the robotics community that vision systems and the associated sensors generate most of a system’s overall consumption.
Modeling a robot’s resource consumption is tackled similarly to modeling any other computer system [28]. It is not a straightforward process when the robot is not meant to be tampered with and to remain unopened. Therefore, it is necessary to first identify and estimate the power consumption of the platform’s various hardware components. Subsequently, the power associated with software applications needs to be modeled, since different heuristics would produce other levels of power consumption [29].
1.3. Research Question(s)
This article focuses on IRT for remote educational scenarios. By discussing a dedicated social robot’s location-independent operation using (a) a VR headset and controllers and (b) a mobile application, we explore the following central aspects and associated research questions:
- RQ1—Applicability. How can we use immersive technologies, such as VR and AR, to promote engagement in remote educational scenarios involving robots?
- RQ2—Sustainability. How do IRT solutions fare in light of sustainability considerations?
- -
- RQ2.1 (explanatory). What is the cumulative energy consumption?
- -
- RQ2.2 (exploratory). What are the effects of different immersive technology types on robot performance?
- -
- RQ2.3 (exploratory). What are the deployment costs of each system?
By answering the above research questions and analyzing power consumption, performance, and other vital indices, this article provides a general overview and a set of guidelines on the potential and associated costs to consider when deploying different IRT solutions using both VR-based and AR-based approaches. A more detailed discussion of the underlying framework and an initial qualitative study on how the different stakeholders in educational settings, i.e., instructors, learners, and peers, receive IRT solutions can be found in [10].
2. Materials and Methods
2.1. Robot
This project’s robotic platform is LuxAI’s QTrobot [30], a humanoid robot with an expressive social appearance. It has a screen as its face, allowing it to display facial expressions and emotions using animated characters, along with 12 DoFs to present upper-body gestures. Eight DoFs are motor controlled—two in each shoulder, one in each arm, plus pitch and yaw movements of the head. The other four—one in each wrist and one in each hand—can be manually configured. As shown in Figure 2, amongst other features, QTrobot has a close-range 3D camera mounted on its forehead and is provided with a six-microphone array. The QTrobot is powered by an Intel NUC processor and Ubuntu 16.04 LTS, providing it with a native Robot Operating System (ROS) interface.
2.2. Robot Power Model
Throughout an HRI-based telepresence session in the classroom, the robot performs different interaction patterns with the students. Generally, social robotics research favors the inclusion of new technologies and approaches in the robot and its interfaces to enhance operator experience and perceived usability (e.g., offering multiple devices for control with augmented information on the robot’s environment using lasers or 3D cameras, adding arms for enhancing the acceptability of the robot). Therefore, it is crucial to consider all hardware components involved in the robot routine to achieve better energy efficiency and, in some cases, to avoid specific software solutions that increase overall power consumption :
Hence, the consumption model proposed here is associated with hardware components , which have a consumption associated with behaviors defined from the software point of view ().
2.2.1. Hardware Perspective
From the hardware perspective, this study generalizes robot power consumption. The model for the robot is simplified into the next formula according to the approach suggested by Mei et al. [31]:
An electronic device can function as both a sensor and actuator, e.g., a motor where it is possible also to measure movement by analyzing its consumption. However, to reduce complexity, we assign one device per action. For instance, a piezoelectric transducer in a speaker produces sounds, and we will not consider it as a microphone.
- Sensors. Every robot has a set of sensors that measure various physical properties associated with the robot and its environment. Again, we follow Mei et al. [31], who suggested a linear function to model the power consumption of sensors:The proposal connects the sensing power () to two physical constants associated with the device, and is also coupled with the sensing frequency.
- Actuators. This study simplifies the actuators into motors, which convert electrical energy into mechanical energy. The motor power consumption is associated with the mechanical engine and the transforming loss related to friction or resistance, such as those associated with grasping and manipulating objects or the surface where the robot is moving. Once more, Mei et al. [31] proposed a possible model to be applied in this case:A motor’s motion power is associated with mass m, v represents the velocity, and a defines the acceleration. defines the transforming loss, and is the mechanical power, where g is the gravitational constant.
- Main Controller Unit. This element is responsible for managing the robot and parts of the controllers with their associated devices. It comprises the central processing unit (CPU) and can sequence and trigger robot behaviors using the different hardware elements under its controls. This study simplifies the model in that all components are evaluated together, and it does not distinguish between the directly (hard drive and fans) and indirectly measurable (network ports) devices.
- Others. There are different devices that need to be considered, such as controllers, routers, external fans, batteries, displays, or speakers. Each one is modeled on its own, and product specifications define their values.
2.2.2. Software Perspective
To assess the power consumption impact of a particular software, this study uses the model presented by Acar et al. [32], which encompasses the following model subtypes:
- CPU Model. The power consumed by a specific process given a set of constants and the percentage of CPU use over a period of time.
- Memory Model. The power that a process needs when triggering one of the four states of the random access memory (RAM): read, write, activate, and precharge.
- Disk Usage Model. The power consumption associated with read/write processes of a given application when the disk is in active mode.
Combined, these yield the following formula for modeling the software-related power consumption:
At times, the power consumption associated with sending or receiving data through the network is also considered. However, as this is highly specific to how the various ROS topics and the associated ROS message types are defined, we opt for a model that does not include these data.
2.3. QTrobot Power Model
While Section 2.2 discusses the generalized robot power model, this section details how it specifically maps onto the QTrobot platform employed in this study. The resulting model constitutes the basis for the experiments and measurements discussed later.
2.3.1. Hardware Perspective
Physically, the QTrobot (cf. Figure 2) is a non-mobile platform. The power supply unit is a strictly one-way single-entry point system from a regular plug dock of 220 V. As detailed in Section 2.1, the QTrobot has eight DoFs for arm and head movements. In addition, it includes a few extra actuators and sensors—mainly a RealSense camera, as well as a microphone array. The robot also includes a speaker that is used for presenting audible information. Furthermore, it has an eight-inch display and an Intel NUC, and we generalize other components that potentially consume energy in the system (e.g., fans).
- NUC: The robot integrates an Intel NUC i7 computer running an Ubuntu 16.04 LTS operating system with 16 GB of RAM. The NUC kits are well known for their bounded consumption [33].
- Camera: The QTrobot is equipped with an Intel RealSense D435 depth camera. According to the Intel documentation [34], it demands 0.7 Amps as a feeding source for operating.
- Motors: The robot has eight motors rendering eight DoFs for the robot’s neck and two arms. The neck’s two motors provide pitch and yaw, while each arm contains two motors in the shoulders and one in the elbow. It is out of this work’s scope to evaluate the motor efficiency, so we generalize the power consumption without explicitly dealing with copper, iron, mechanical, and stray losses.
- Display: QTrobot features an LCD panel that is active from the moment that the robot is switched on. This eight-inch multicolor graphic TFT LCD with 800 × 480 pixels mainly shows direct animations of facial expressions. The current version does not allow changes to the backlight brightness, so it is assumed to work under the same operating voltage and current as the robot. It is not possible to measure or extract more information about its consumption without disassembling the display.
- Speaker: The robot has a 2.8 W stereo-class audio amplifier with a frequency rate of 800–7000 Hz.
- Other: Any regulators, network devices, or other control mechanisms beyond our knowledge that somehow drain power.
Combined, these yield the following formula for modeling the hardware-related power consumption:
As mentioned above, the procedures of handling the power consumption of each element individually would require disassembling the robot; therefore, this study manages consumption as a single consumption element.
2.3.2. Software Perspective
From the software perspective, the power consumption is static or dynamic. Static power consumption results from the component’s features as defined by the manufacturer, and therefore remains unalterable. Hence, we only model and investigate dynamic power consumption, which depends on the software’s implementation and source code.
The main applications used in the IRT experience in this article are:
- Robot Operating System (ROS) [35]: ROS is considered the de facto standard for robotics middleware. It provides a set of libraries and tools for building and running robot applications.
- NuiTrack™: A 3D tracking system developed by 3DiVi Inc. [36] that provides a framework for skeleton and gesture tracking. It offers capabilities for realizing natural user interfaces.
- QTrobot Interface [37]: The set of ROS interfaces for robot interaction provided by QTrobot’s manufacturer, LuxAI. Following ROS’s publish/subscribe paradigm, it is possible to find an interface for implementing different robot behaviors, such as changing the robot’s emotional and facial expressions, generating robot gestures, or playing audio files.
- Telepresence Components: The set of software components for connecting to the QTrobot ROS interfaces. These components have two views: the QTrobot side, where the components manage robot interfaces, and the operator side, which comprises the components running outside of the robot to control and present robot information in VR-based IRT or app-based IRT. Additionally, there is always a link between both sides presented by a communication channel, but its consumption footprint is not evaluated in this study.
- Object Recognition: There is a component for offering object recognition in the robot. Such components are notorious in the robotics community for having a higher CPU consumption than other software components deployed in the robot. Specifically, [38] is used, which is a webcam-based feature extractor employed to detect objects. Upon detection, the component publishes the object ID and its position on a dedicated ROS topic.
2.4. Telepresence
The different IRT solutions discussed in this research (cf. Figure 1) have slightly different rationales behind their development: on the one hand, the VR-based solution for full immersion, and on the other hand, the mobile-app-based solution for maximum availability.
2.4.1. VR-Based IRT
VR technology comprises two central elements: the hardware, i.e., all physical components conveying the experience of and interaction with the environment, such as screens, gloves, and controllers, and software, which allows the development of the virtual environments.
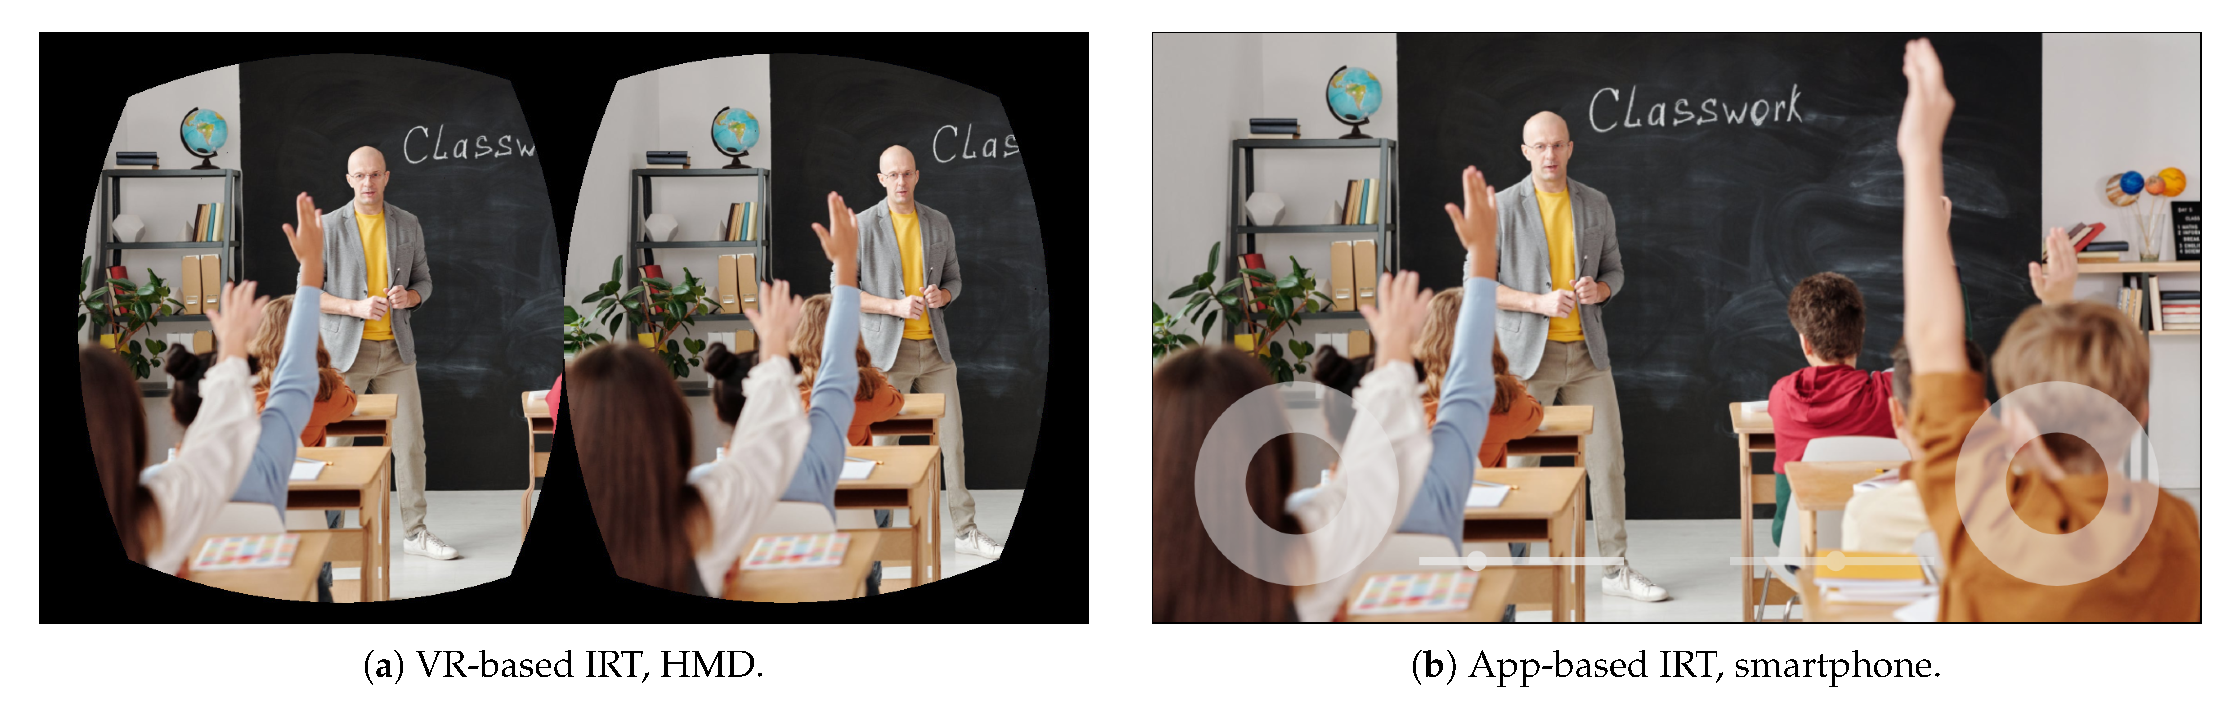
In terms of hardware, we employ the Oculus Rift 3 headset together with the accompanying Touch controllers for the VR-based telepresence solution (cf. Figure 1, top right). The HMD consists of two PenTile OLED displays with an overall resolution of 2160 × 1200 at 90 Hz and a 110 degree field of view. This dual-display arrangement is complemented by two adjustable lenses that rectify the 1080 × 1200 image for each eye to create a stereoscopic 3D image. The headset features rotational and positional tracking and comes with integrated headphones supporting 3D-audio effects. The Oculus Touch controllers utilize the same low-latency tracking technology as the headset, providing a setup with joysticks and buttons for input and the opportunity for haptic feedback. Both the headset and the controllers are tracked using Oculus’ Constellation sensors, a pair of external infrared cameras mounted on dedicated desk stands.
Developers can easily integrate the Oculus hardware with existing game engines, such as Unity, to create realistic VR experiences. We chose Unity, since it provides the flexibility to deploy and develop the software on a wide range of different platforms [39]. Moreover, it has a large community of developers, and there are previous results where the engine has been put to good use in robot–VR scenarios [39,40]. Different ROS topics communicate the essential data between the robot and the VR setup; worth mentioning are the two separate streams provided by the stereo camera, which are necessary to generate the dual image that is later corrected by the HMD’s lenses (cf. the render view in Figure 3a). The VR-based IRT solution favors direct interaction control and the use of different sensory channels. The operator’s head and arm motions are directly forwarded and translated to the robot interacting with the users and bystanders. Other input, such as audio, can be also be forwarded and processed in real time. Botev and Rodríguez Lera [10] provided further details on the software architecture, user interface, and various interaction modes.
2.4.2. App-Based IRT
The app-based telepresence solution (cf. Figure 1, bottom right) aims at providing the same feature set and functionality as in VR-based IRT, but on a more widely available hardware platform. Due to its dominant global market share of around 85 percent [41], we chose Android as the target platform for the mobile application, which was also developed in Unity (Version 2019.3.0a8). For the measurements, the application ran on a Samsung A40 smartphone (Model SM-A405FN) with Android 10 installed. It has 4 GB of RAM and comes with a 5.9-inch Super AMOLED display with FHD+ resolution of 2160 × 2340 pixels, powered by an Exynos 7885 CPU and Mali-G71 MP2 GPU. The built-in sensors include an accelerometer, fingerprint sensor, gyroscopic sensor, geomagnetic sensor, hall sensor, light sensor, and proximity sensor.
The smartphone’s gyroscopic sensor is used to translate head motion. Simultaneously, virtual joysticks with separate elbow motion sliders rendered on a semi-transparent layer on top of the robot’s camera stream (cf. the render view in Figure 3b) allow the operator to control arm movement. The partial control of some motors via touch input together with the perceived screen size hampers immersion, but ensures full controllability. The robot transmits an unprocessed, single-camera image to the device via a dedicated ROS topic. The other topics are nearly identical to those of the VR-based IRT implementation, with their data only rendered in a different way.
2.5. Experiment Modes and Measurements
To measure the robotic system’s energy consumption in the different experiments, we used a Fluke 289 True-RMS Digital Multimeter capable of high-resolution and event- and interval-based logging of the electric current. The multimeter was placed between the outlet and the robot’s power supply to intercept and record the actual, unalloyed AAC values.
In addition to the externally gathered data, internal statistics were compiled using system tools and a dedicated ROS profiling tool [42]. This tool harvests statistics about each captured event, bounding the window start/stop, samples, and threads running. An event contains information about CPU usage (as a percentage of total local use), virtual memory use, and real memory use, which helps with the evaluation of (cf. Section 2.2.2).
Moreover, ROS bags were used for storing different performance and message data on the robot during operation. The bags were created by subscribing to dedicated ROS topics and storing the received data in an efficient file structure.
The experiment modes employed for evaluating the impact of the different IRT configurations can be classified into two behavioral categories:
- Test/Calibration: Robot behavior associated with various motion and gestures to check the motor status and perform calibration tasks.
- Natural: Classic HRI-related robot behavior comprising motions and gestures such as greetings, head tilts, or hand rubbing.
The next sections detail the various routines that we devised for the baseline and realistic measurements, introducing the different experimental modes that form the basis of the results discussed in Section 3 and Section 4.
2.5.1. Baseline
To better evaluate the performance and power consumption with natural behaviors and provide a common baseline for the measurements, we integrated two different test-specific modes into our experimental setup. On the one hand, we assessed the robot in idle mode, i.e., the QTrobot at the beginning or end of a session without any external or scripted activity. On the other hand, a scripted demo routine provided a further indication of the aggregate cost of coordinated motion using the robot’s different actuators. The demo relied on the basic interfaces supplied by the manufacturer to trigger predefined motion sequences as follows: The robot (1) spreads its arms while moving its head to look up, (2) moves its head from left to right and, at the same time, twists and folds the stretched arms so that its hands touch, and (3) moves its head to the upper left while the arms move down, stretch, and settle in the default, relaxed position. Both baseline modes were carried out with and without active 3D tracking to explore the associated cost.
2.5.2. Realistic
This study’s central element is the measurement under realistic conditions, i.e., comprising the full experimental setup with VR- and app-based IRT to control the QTrobot. The following calibration routine with simplistic robot movements covers the respective servo motors’ full play: (1) left arm (up/down), (2) right arm (up/down), (3) nod of the head (up/down), and (4) shake of the head (left/right). Finally, we tested the system with a natural motion routine mimicking realistic behaviors extending over all DoFs: (1) wave with right arm bent (welcome), (2) fling up both arms (cheer), (3) grab and look (investigate), (4) nod swiftly (sneeze), and wave with right arm stretched (farewell). These gestures are examples of purposeful and meaningful interactions for robotic telepresence, as proposed, e.g., in [43,44].
3. Results
This section presents the experimental results obtained from the profiling tools and power consumption measurements. All experiments were performed in five iterations (or more) but for the baseline measurements, which needed less individual capturing, since no applications were running.
The experiment results are presented below as follows: Firstly, we show the overall real power consumption obtained from the power meter device; secondly, we focus on the software results, where the CPU and RAM consumption is evaluated. In total, we ran 39 different test routines, comprising 14 baseline measurements and 25 measurements under realistic conditions (divided into five loops each plus an extra five rounds for calibration in VR-based IRT). The 14 baseline measurements are distributed into four different collections: (1) idle, default robot behavior; (2) idle with NUI, default, plus NuiTrack application; (3) demo, default robot behavior running find-object-2d for entertainment purposes, and (4) demo with NUI, similarly to the previous case, but adding NuiTrack. The reason for using five extra loops for VR-based IRT was the appearance of non-normal outlier cases during data analysis; thus, after removing some of them, we decided to maintain ten iterations. Overall, the experimental results supported our core hypotheses and are consistent with related research.
3.1. Hardware Perspective
The robot’s regular power consumption was measured using the external multimeter (cf. Section 2.5) for periods of approximately one minute, during which data on the electric current were recorded.
Research question 2.2 (“What is the cumulative energy consumption?”) is partially answered with Table 1, which details the robot power in watts in both baseline and realistic (i.e., app- and VR-based IRT) scenarios, underlining the importance of specific applications in the robot. Firstly, the baseline cases without NuiTrack had a 44% and 37% lower power consumption. Secondly, there was a measurable difference between the two IRT options, with the VR-based approach producing a slightly higher consumption. This establishes that telepresence proportionally doubles the overall power consumption, which natural-input, VR-based IRT further exacerbates.
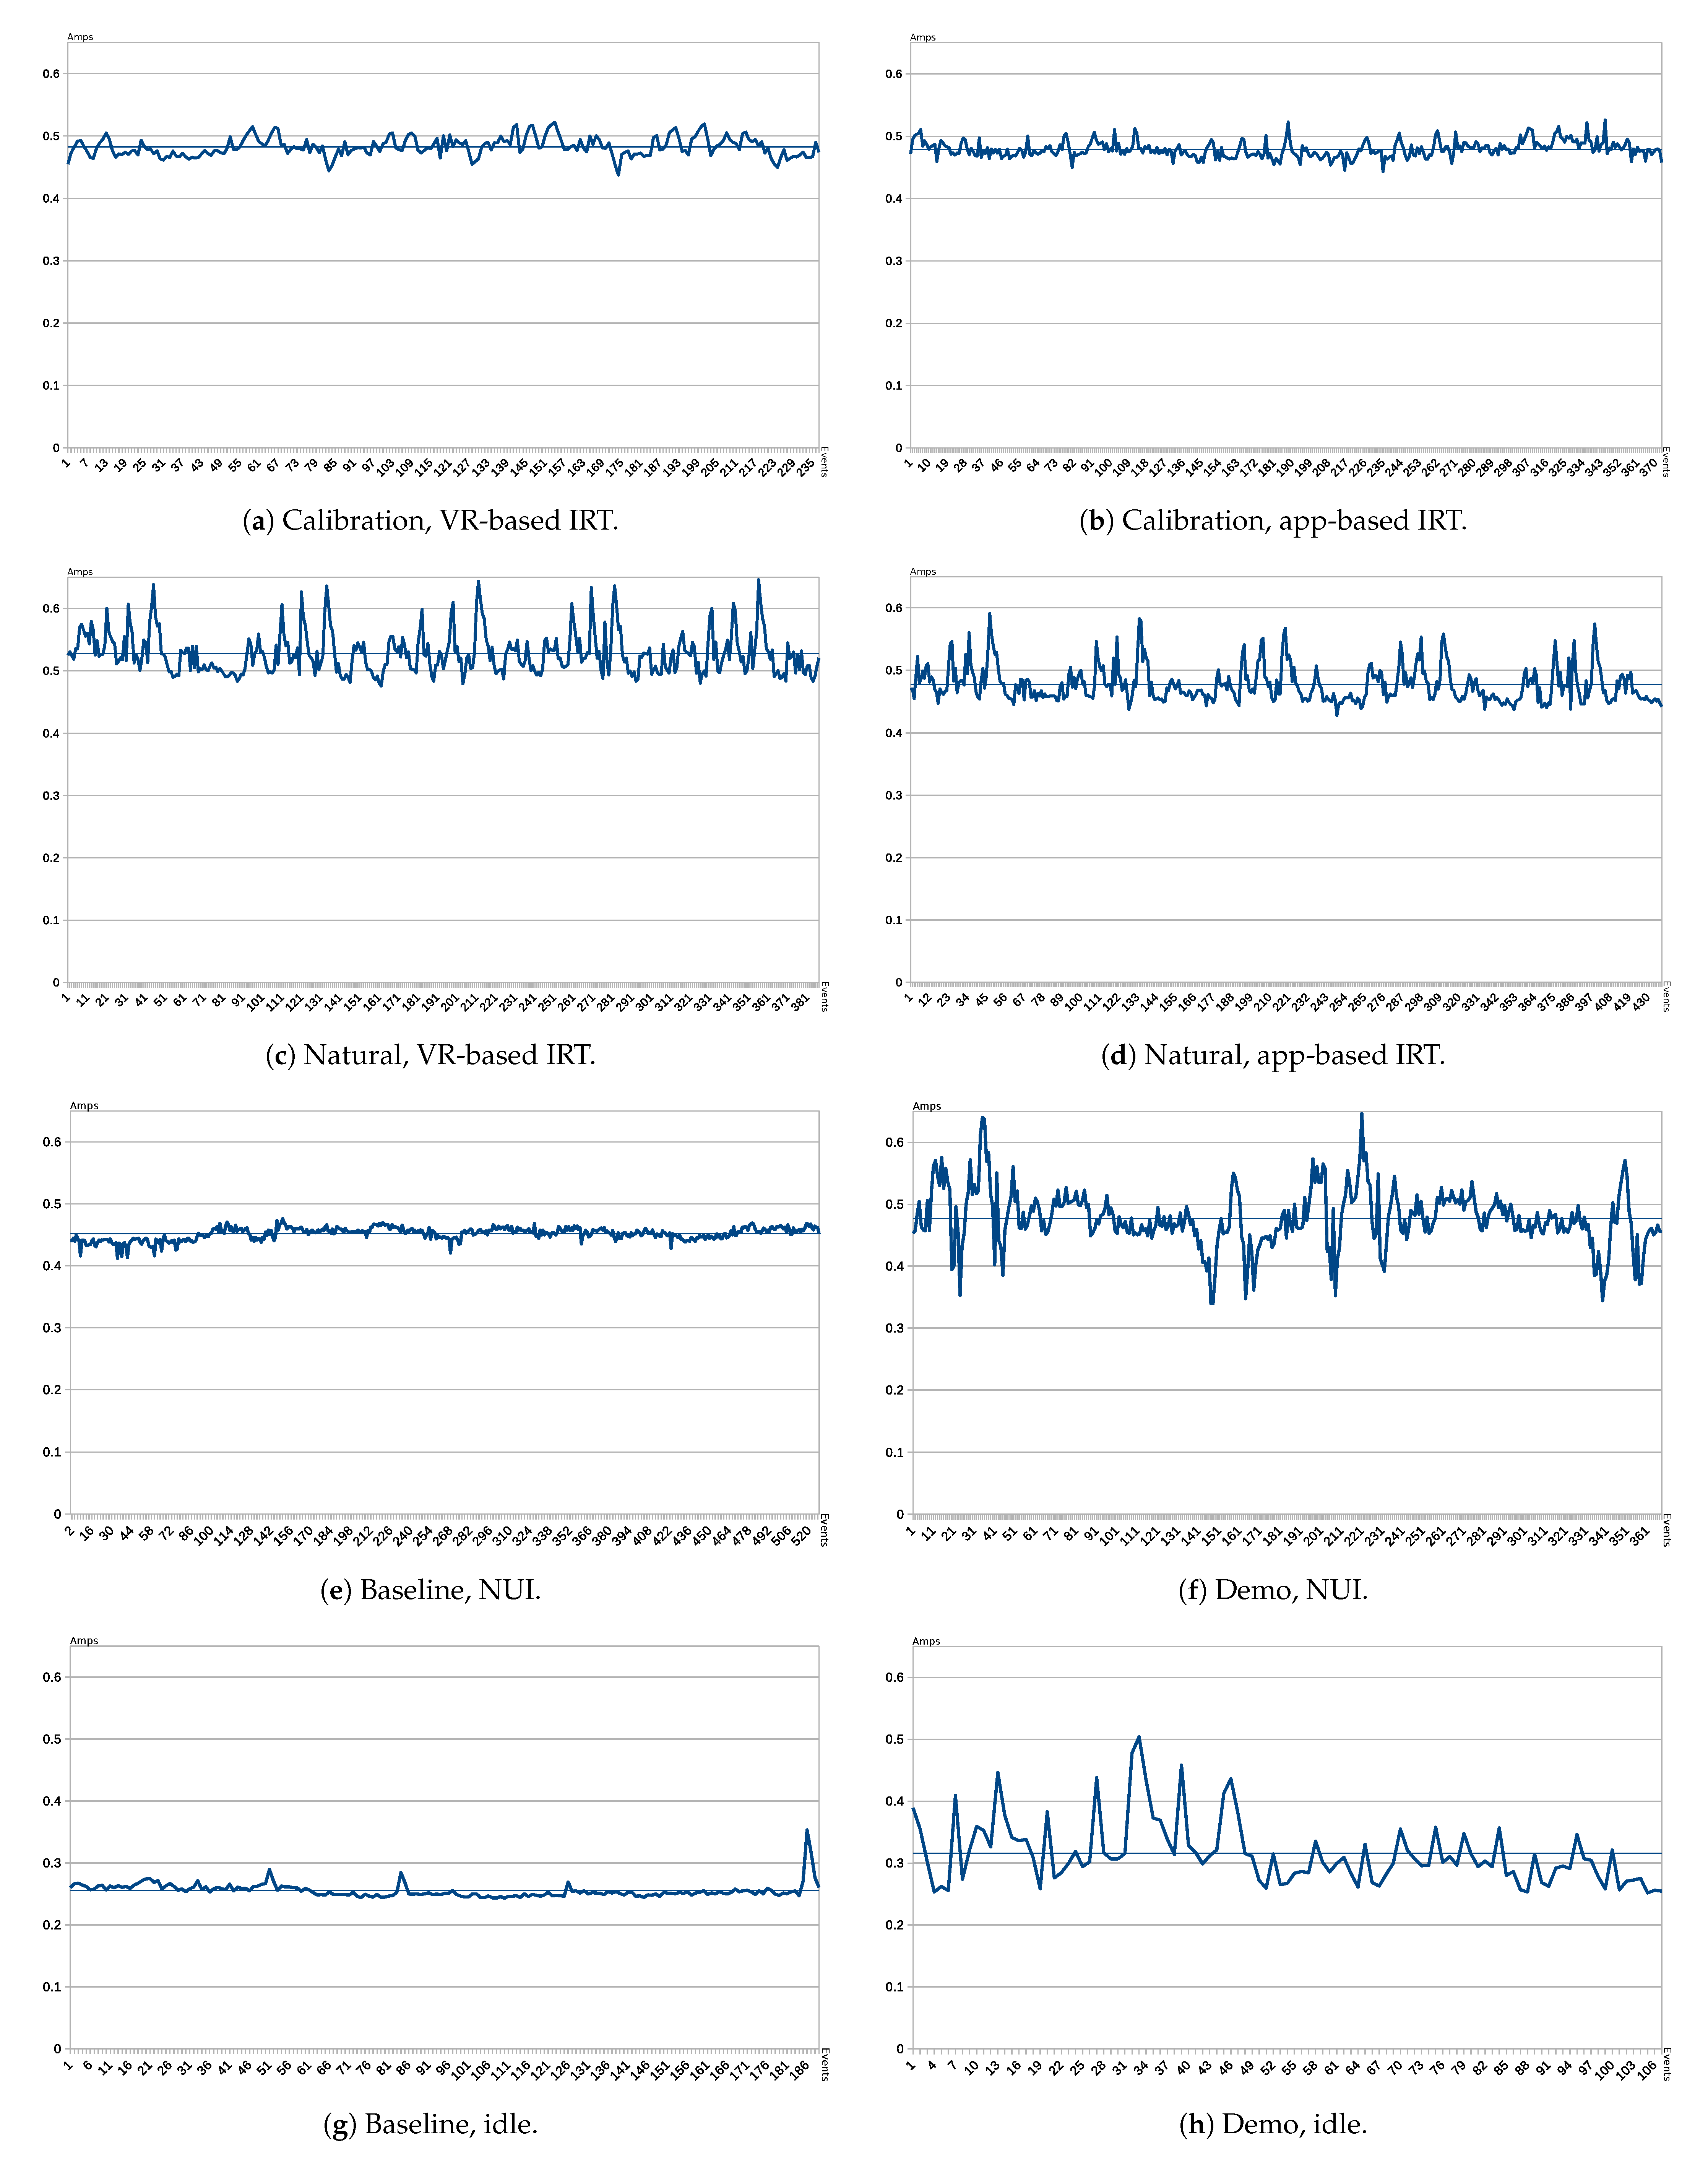
Figure 4 illustrates the cumulative consumption for the different experimental modes as a function of power over time based on the events captured by the multimeter. The x-axis indicates the variable count (over time), and the y-axis presents the consumption in Amps. Looking at the realistic modes, we can discern two cases: (1) calibration (Figure 4a,b), where the line slightly fluctuates around the mean, which is below 0.5, and (2) natural (Figure 4c,d), where the line shows a pronounced fluctuation around a mean of above 0.5 for VR-based IRT and below 0.5 in app-based IRT. The baseline (Figure 4e,g) and demo (Figure 4f,h) modes also showed clearly discernible behaviors: The baseline remained mostly constant except for a few sudden spikes, while the demo mode consistently showed dramatic power consumption changes. In these cases, the consumption was around 0.3 Amps in the non-NUI approaches and close to 0.5 Amps in those deploying NuiTrack, which was also reflected in the cumulative power consumption data and relative behavior presented in Table 1.
3.2. Software Perspective
This section mostly covers the exploratory research question RQ2.2 (“What are the effects of different immersive technology types on robot performance?”). The question is associated with , and we examined the robot performance from two central characteristics: CPU and memory. We refrained from measuring disk usage, assuming that the robot processed everything in memory based on ROS’s publish/subscribe paradigm without necessitating paging or using swap memory.
3.2.1. CPU Consumption
The percentage of mean CPU consumption associated with each routine is described in Table 2, showing the cumulative mean CPU loads induced by the ROS processes during the routine tested in each experimental approach. There were six different nodes involved in every experiment associated with ROS: find_object2d, qt_emotion_app, record nodes, rosprofiler, rostopic, and qt_nuitrack_app. Outside of the baseline modes, i.e., during the actual IRT experiments, the following ROS nodes were active: infoJoints, repub, rosapi, and rosbridge_websocket.
Table 2 indicates a low CPU consumption of under 15% for the idle and demo baseline scenarios. However, involving NuiTrack or with realistic IRT modes, CPU consumption leaped up to beyond 200%. In contrast, only around 6.4% of the CPU consumption was necessary for running in the simple baseline.
The most distinctive peaks could be observed in the realistic scenarios, specifically during calibration, where maximum values of up to 280% were possible, i.e., more than 30% above the actual mean values.
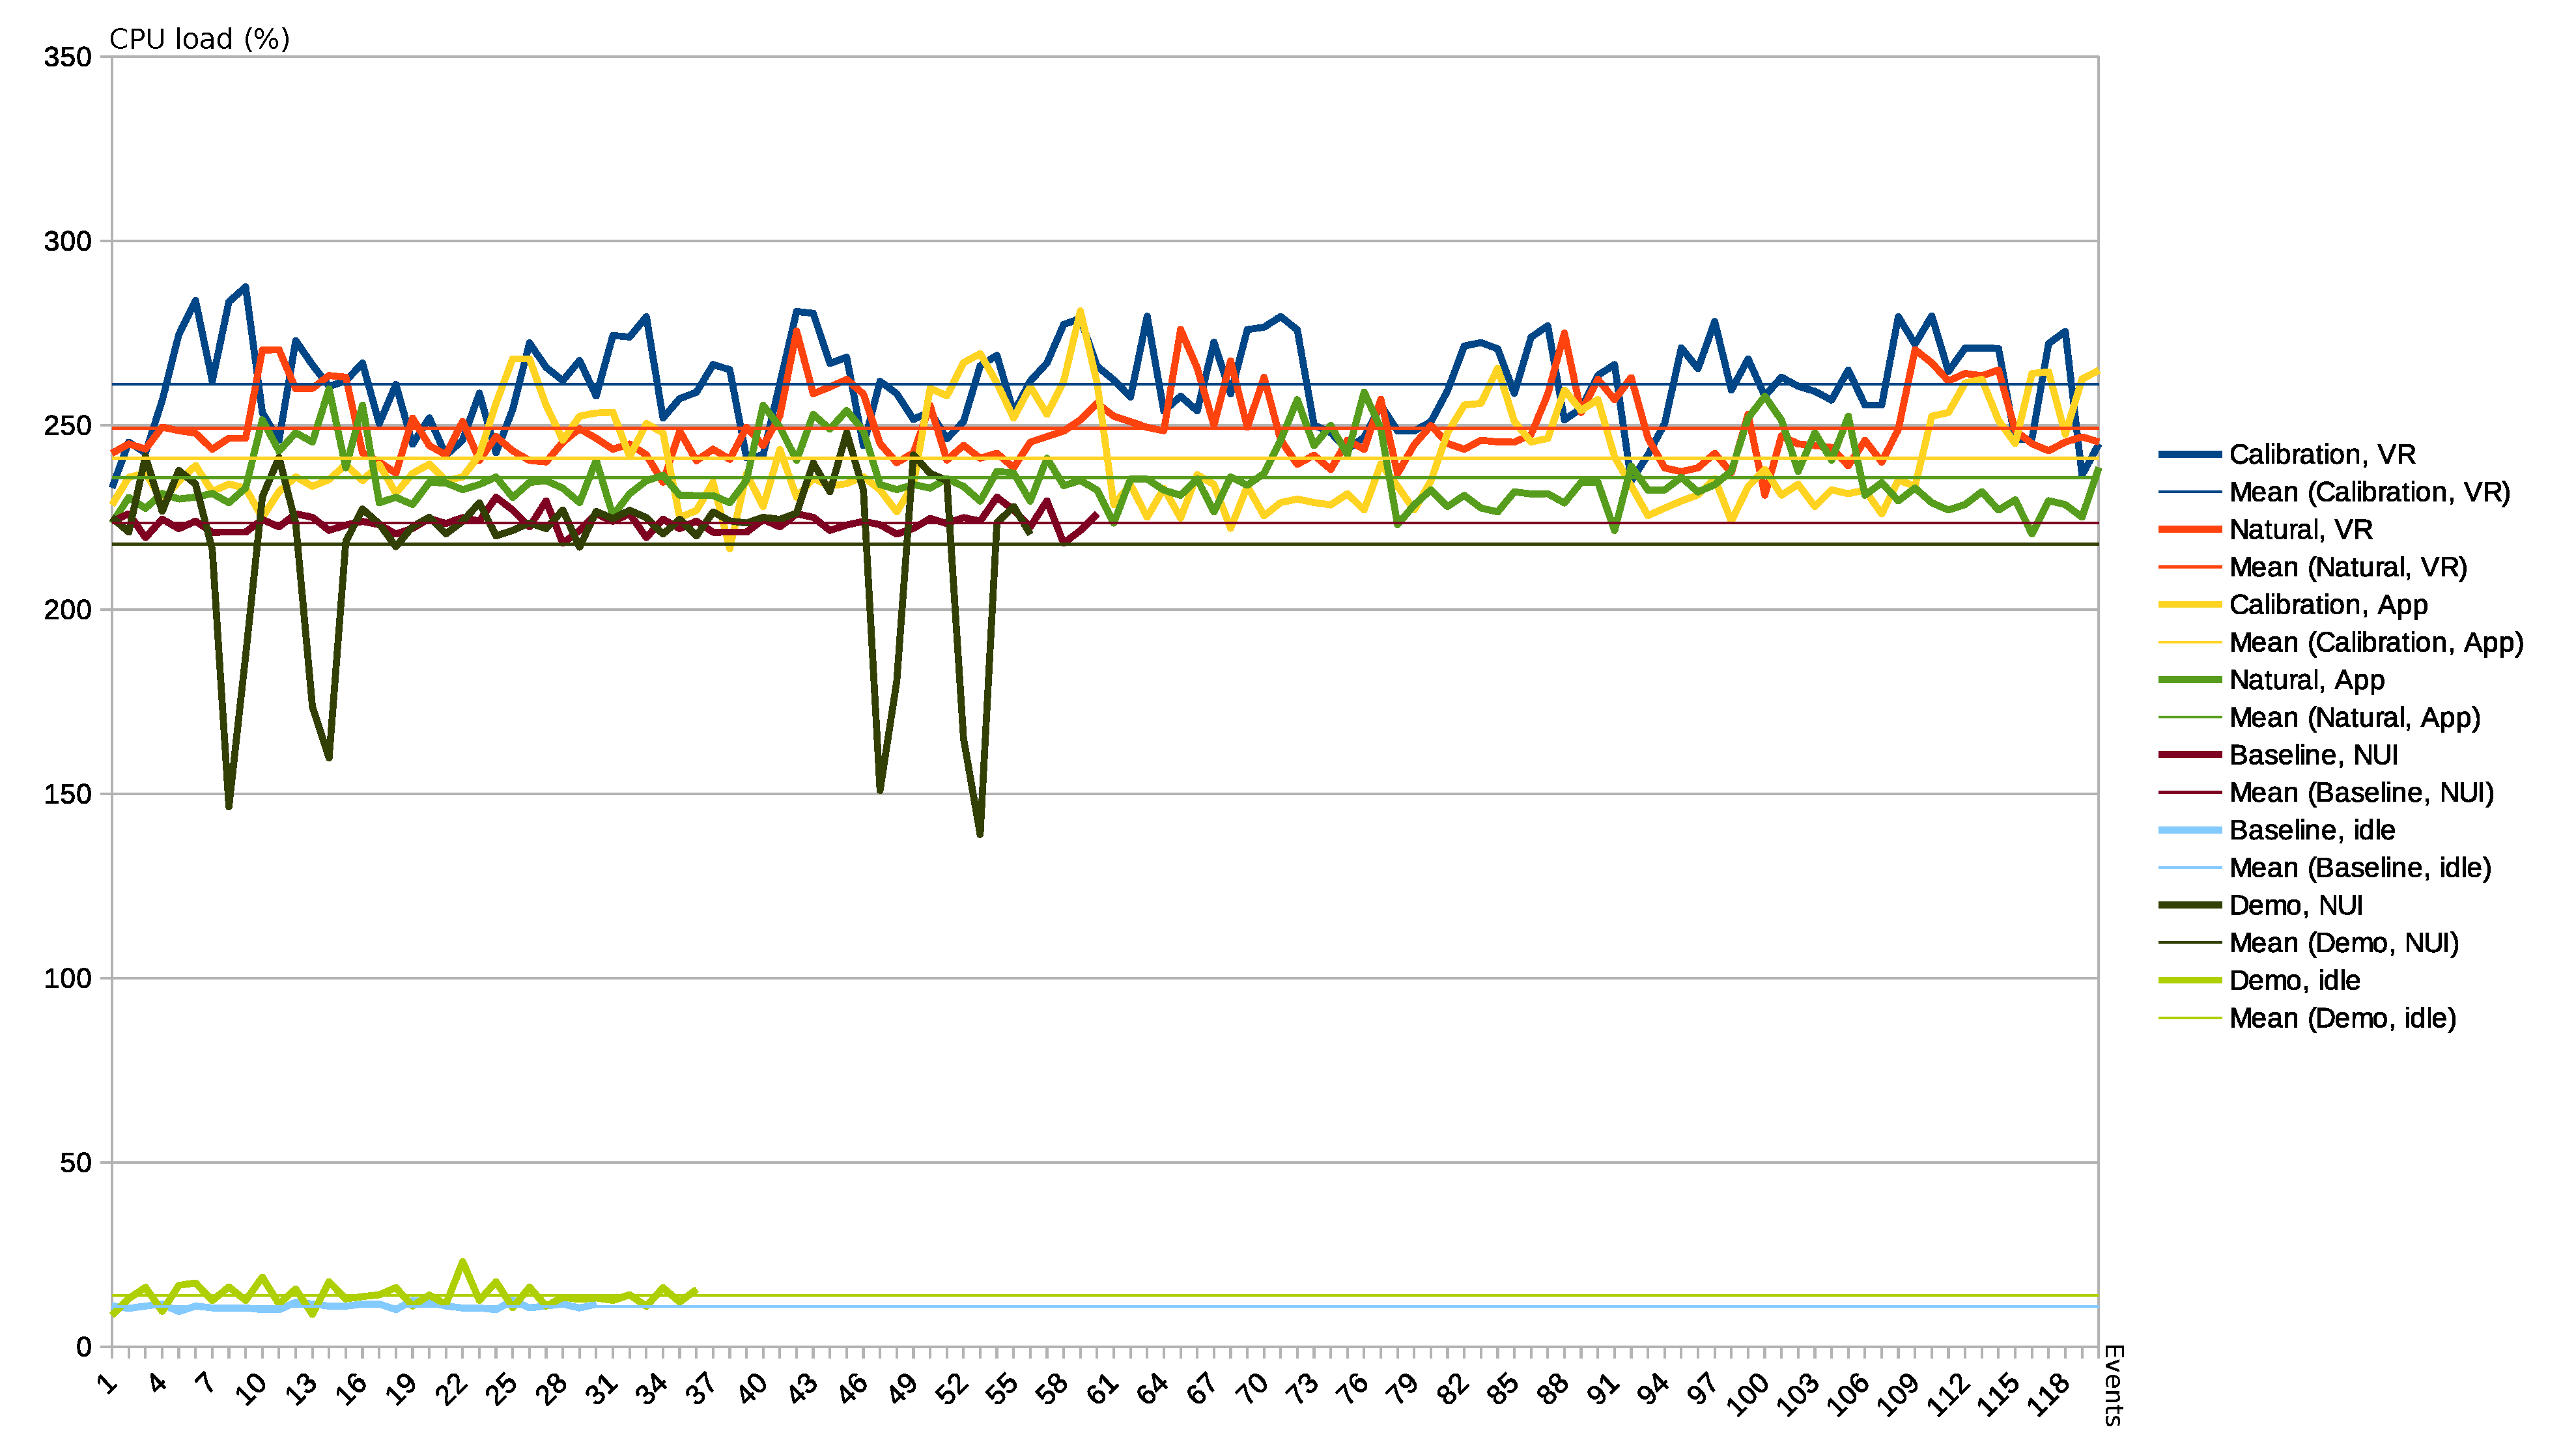
Figure 5 presents a high-level overview of the mean CPU consumption in percent over time, with the x-axis indicating the number of events registered by the profiling tool. In accordance with the profiling tool’s documentation [42], the sample rate was set to 0.1 s with an update rate of 2 s. The y-axis shows the mean CPU load in units of percent for the total number of CPUs; values above 100 imply that more than one CPU core was used.
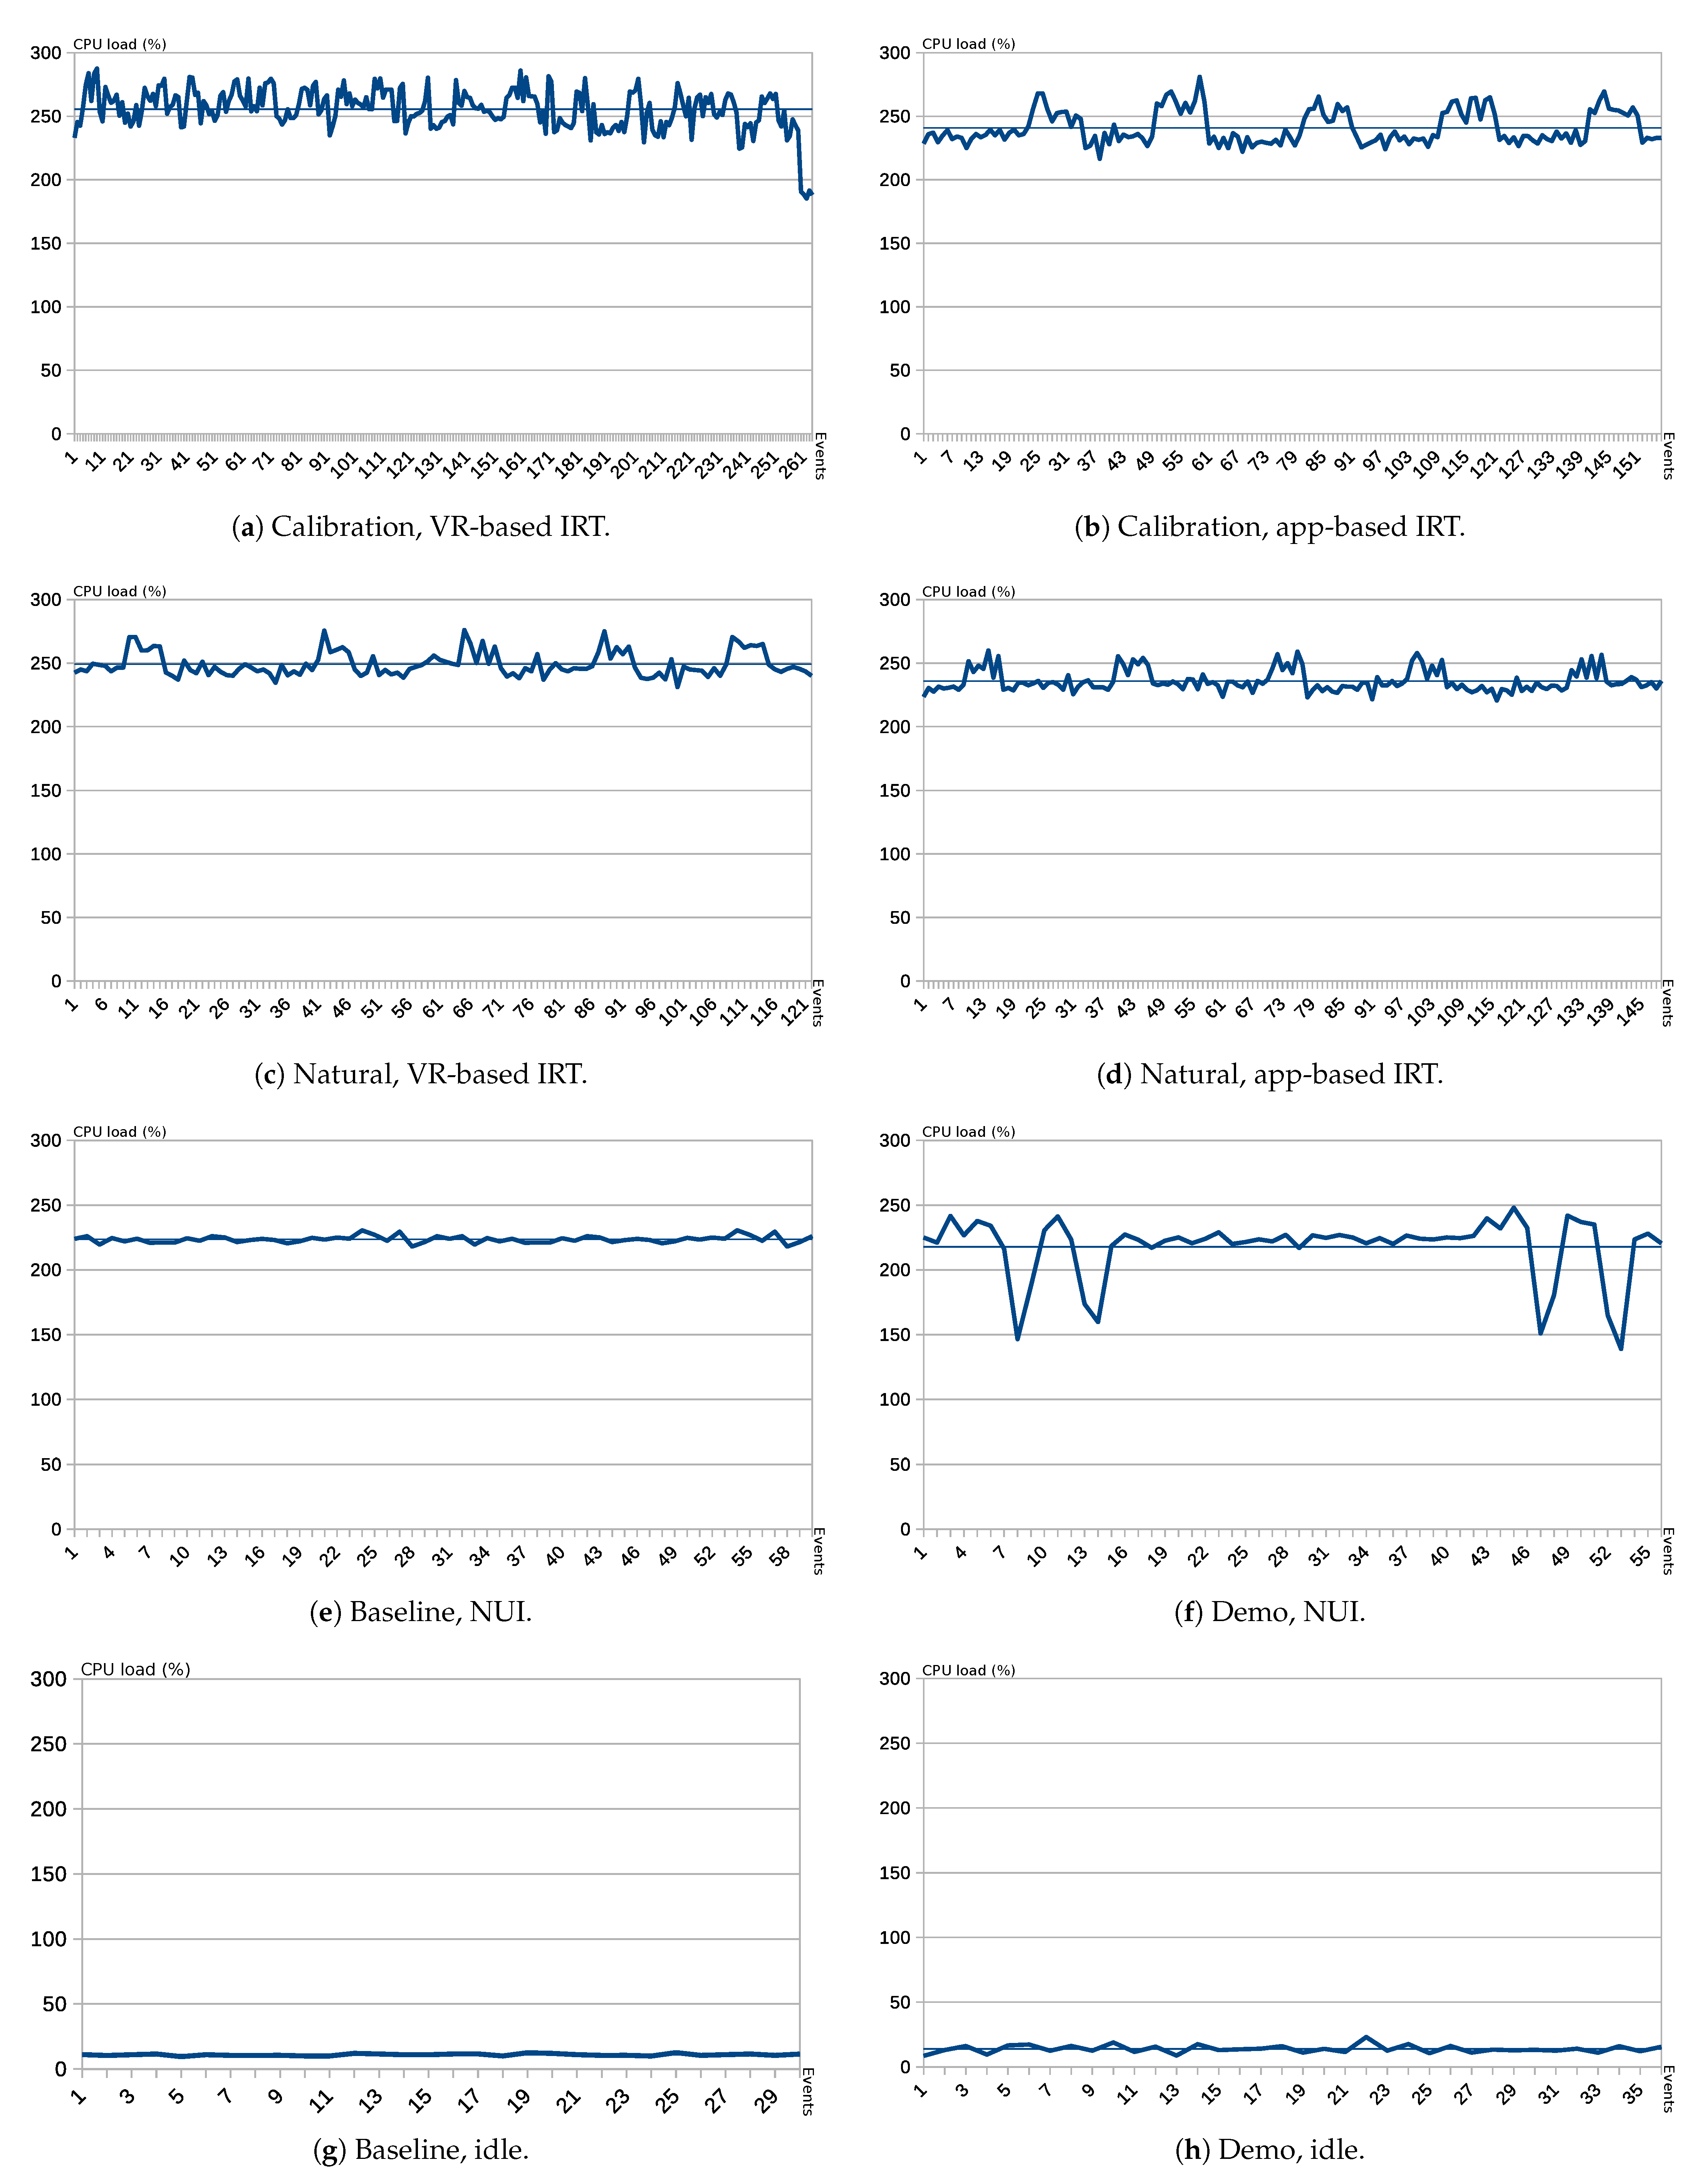
The overlaid plots in Figure 5 show that the baseline graphs level off around their means (cf. Figure 6e,g,h). However, the demo mode with active NuiTrack exhibited four drastic drops in find_object_2d. This might have been due to the app being blocked during a short period of time, and therefore, its performance decreased. We included this data in tabular form (cf. Table 3) for clarification; however, the specific behavior of this application is out of this article’s scope, and these drop points are considered outliers when compared to the otherwise constant behavior of the demo.
The app-based IRT approach, in turn, showed constant behavior over time (cf. Figure 6b,d). The other realistic mode, VR-based IRT, showed a more fluctuating behavior over time; however, this appears to be coherent with the scenario’s average performance.
3.2.2. Memory Usage
Memory usage is also associated with the software perspective and is one of the elements that affects power consumption. Although the default consumption is low, a component view of RAM power consumption [45] revealed values between 3 and 4.5 Watts for a DDR2 RAM module at 1.8 Volts and 2 Watts for a DDR3 RAM module at 1.5 Volts. Memory size and use should be considered for cases where much memory is needed, and it is likely necessary to perform paging, which includes storing data on a disk, and therefore also adds to the power consumption.
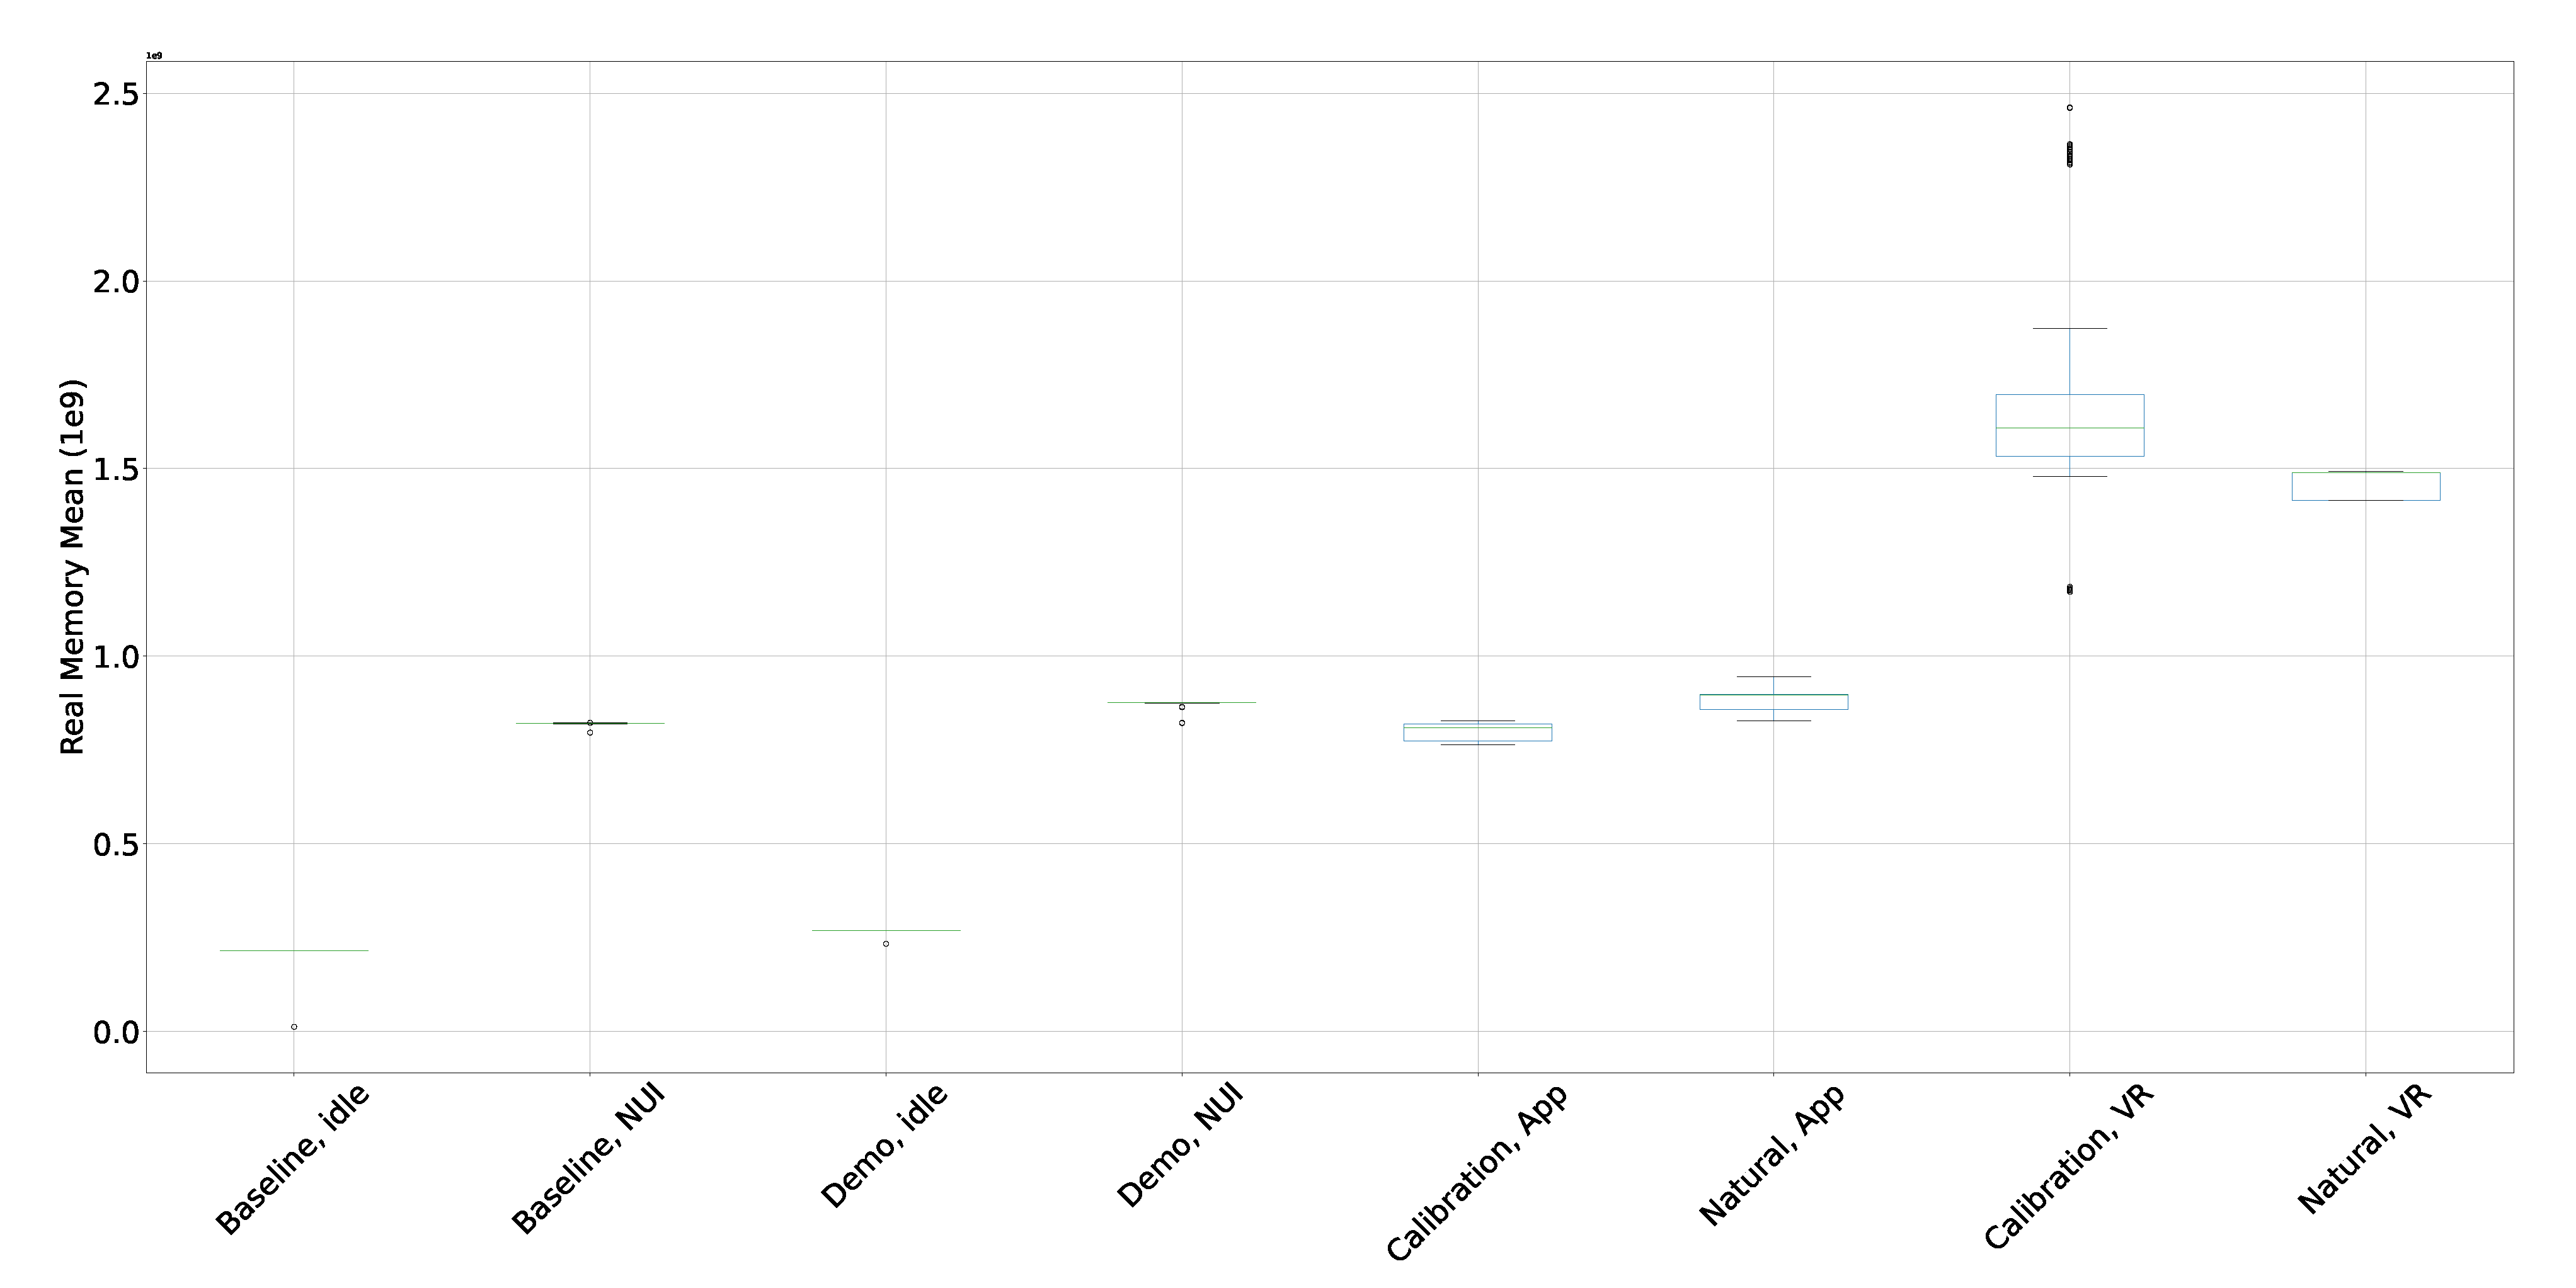
This study presents a general overview of the total RAM used for all ROS nodes running on the system using the same nodes presented in Section 3.2.1 on CPU usage. Table 4 contains the values measured for each scenario, which, again, exhibited consistent behavior across scenarios (baseline and realistic). Baselines without NuiTrack used between 200 (idle) and 270 MB (demo), while the values increased to between 820 and 873 MB with NuiTrack active. Conversely, the realistic scenarios showed means that doubled the mean memory consumption.
To illustrate these values, Figure 7 shows a box plot that reveals that the scenarios with active NuiTrack showed a similar behavior to that of the realistic app-based option. Finally, the realistic VR-based solution consumed almost 1.5 GB of RAM.
3.3. Collateral Effects of the Telepresence Option
The remote telepresence component is not independent of robot telepresence components, showing that the remote control or visualization tool relies on the hardware and software components available on the robot. For instance, if the robot has stereo-vision services provided by the camera, it will affect runtime performance. This means that a telepresence system component can affect and be affected by other software components that related with IRT or unrelated.
The chosen example is associated with the robot camera, as well as the assumption that a data stream of stereo images will generate more consumption. Particularly, we will analyze the Rosbridge performance. By definition [46], Rosbridge provides a JSON API to ROS functionality for non-ROS applications. In our specific case, ROS needs to work with the Unity framework, which both the VR-based and app-based IRT solutions require.
Table 5 presents an overview of the component performance. For VR-based IRT, Rosbridge sends more information due to the requirement of simulating human binocular vision. This requires sending more than one image per frame to perceive depth, nearly doubling the machine’s CPU consumption. Moreover, the memory consumption is quite similar for app-based and calibration-based operation. When comparing the results using means, it should be noted that the calibration mode in VR is reported to have a high value. However, when focusing on individual modes’ values, this pattern can be correlated with other cases; both work under the same exponent and can be considered similar and minimal.
4. Discussion
4.1. Impact of Measurement Tools
Measurement tools were essential for determining the power consumption in this study. While the correctness of an external multimeter relies on the device manufacturer’s calibration, it is necessary to evaluate the tool’s impact when measuring system performance using software.
On the one hand, the ros_profiling tool’s impact was minor; its mean CPU load in regular operation was 3.66%, with a mode of 3.5% and a standard deviation of 0.34 (using 692 events throughout the experimental measurements).
Regarding the mean memory usage, the average consumption was 58,836,646.466 MB (standard deviation of 219,576.960 MB) in all cases. This mean value corresponded to the 28% in the baseline excluding the NuiTrack application and 7% in the idle/demo cases including NuiTrack, as well as 3.5% in VR-based IRT. Such values reveal a normalized behavior, but significantly impact the baseline while only marginally impacting the other cases.
On the other hand, we used the rosbag tool during some of the experiments to record from and play back ROS topics afterwards. The tool is preconceived to operate with high performance, and its working mode avoids deserialization and reserialization of harvested messages. Thus, it used around 1% of the mean CPU load and 12 MB of the memory mean.
As we are evaluating the power consumption, it is important to consider the related footprint of recording rosbags (cf. Table 6). The power consumption minimally deteriorates, mainly for the idle baseline scenarios. We observed only slightly increased values; however, that difference is not significant.
To sum up, these results lead to acceptable values for our measurement tools, with only a minimal, negligible impact on the general metrics outside of the baseline cases with their very low mean consumption.
4.2. Effect of Immersive Technologies on the Power Consumption Model
When employing novel technologies to create immersive experiences, it is vital to assess and weigh the various cost factors associated with their deployment. For both the VR-based and app-based IRT solutions, the transfer of video data constitutes the largest payload and, thus, the most significant power consumption factor. While there is a sizable difference between transmitting stereoscopic and regular video, the transmission of the video data and commands/controls is—in terms of electricity—completely “overpowered” by the AI-based processing on the QTrobot.
However, it is essential to note that the realistic scenarios have a significant impact on the trends. In both cases, we continuously measured a CPU consumption of beyond 200%, and the memory consumption in the VR-based IRT setting increased sharply. Unsurprisingly, CPU and RAM consumption reached their lowest levels in the baseline scenarios or the minimal demonstration modes.
4.3. Developing Energy-Efficient Demos
To our knowledge, the development of energy-efficient demos remains mostly unexplored in social robotics research. Usually, the different demo modes included with social robots aim at increasing acceptability without involving sustainability considerations. During the experiments, we observed that a demo is highly dependent on depth information or detection services, which constitute the robot’s baseline energy consumption. In addition, in light of the economic aspects discussed in the following section, it is advisable to address sustainability issues already when designing demonstration routines [29].
4.4. Economic Efficiency
To assess the economic impact of operating a robot or a set of robots, we can estimate the cost associated with power consumption. To this end, we consult the European Union’s official electricity price statistics [47] and use the current average of 0.2126 EUR/kWh.
The results obtained through projection of valid measurements (cf. Table 7) indicate that whether or not a demo is running by default on the robot can significantly impact the annual cost and needs to be taken into account. On the other hand, the difference between IRT experiences using VR-based versus app-based telepresence solutions has only a minor impact. However, if the number of robots increases, the telepresence mode might also become a relevant factor with regard to the overall energy footprint. Due to the sporadic nature of the calibration process, it is excluded from the annual projection.
To put these results further into context, consider a typical desktop computer setup that uses an average of 200 Watt hours (Wh); the computer itself has an average per-hour consumption of 171 W, the network card uses 10 W, the printer uses 5 W, and the speakers use 20 W. Assuming that the computer is also operated for six hours a day, the annual consumption amounts to circa 450 kWh (i.e., 95.535 EUR/year). This corresponds to CO2 emissions of more than 130 kg per year, which is roughly 1.3 percent of the average total emissions of a Belgian national [48].
4.5. Social Efficiency
Using a robotics platform for remote presence and IRT in different assistive scenarios can create new jobs in (health)care and other interactive settings. In addition, beyond the current pandemic situation, it is foreseeable that IRT has the potential to enable new interactive applications and create a positive impact in various collective contexts and any type of event, even beyond educational or healthcare scenarios.
At the same time, it is necessary to increase the number of sensors and actuators associated with HRI in IRT to expand the interaction bandwidth and create alternative mechanisms, such as those favoring kinesthetic learning or those requiring dedicated physical feedback.
Again, this requires a careful cost–benefit analysis for the various factors associated with the deployment of these new technologies, particularly classic and resource-hungry approaches, such as the OpenCV object recognition (find_object_2D) or NuiTrack’s more modern approach based on deep learning. Table 3 shows that these applications exhibit nearly the same CPU consumption as that of the immersive system. In addition, it is necessary to consider that newer RGBD-range image cameras perform some of these algorithms on board. According to the specs sheet, they can have peaks of 0.7 Amps (more than our current immersive consumption), so manufacturers and developers need to select the type of camera with care.
5. Conclusions
The in-depth analysis of the VR-based and app-based IRT solutions revealed several interesting aspects related to the initial set of research questions.
In terms of applicability (RQ1), our results confirm the huge potential for immersive telepresence and the associated positive effects, as discussed in [10]. However, when including sustainability considerations (RQ2), different features and interaction modes need to be carefully weighed in a cost–benefit analysis. Particularly, employing AI-based technologies or other computationally expensive features can dramatically influence the cumulative energy consumption (RQ2.1) and, consequently, the system’s deployment costs (RQ2.3). Compared to these, immersive technologies, per se, only marginally affect the overall robot performance (RQ2.2), and they can help improve acceptance for operators, users, and bystanders alike without causing overly high costs.
Unless AI-based technologies become substantially more energy efficient, their footprint directly impacts feature sets of IRT systems that are operated continuously and over more extended periods. Similarly, demo routines should not only be created to maximize acceptance while omitting sustainability considerations. Even minor adjustments here can be hugely impactful and can help in deploying more affordable and practical solutions.
Social efficiency in education linked to public goods can only be realized when instruction is effective and learning is universal [49]. With this in mind, IRT can only benefit collectives and society on a larger scale if, on the one hand, teachers adapt lessons, assignments, and assessment methods to immersive interactive scenarios for the instruction to be effective. On the other hand, the required technologies need to be readily available to students for learning to be universal. Therefore, it is vital to not only apply and adapt IRT solutions to the curriculum to increase knowledge transfer and skill development, but to extend the use of IRT technologies in the classroom beyond academic approaches.
Integrating IRT systems with robotic platforms entails additional evaluations by manufacturers and developers alike in order to optimize efficiency and battery consumption. Such integration requires an in-depth and fine-grained analysis of all the processes running on the robot and the impact of each algorithm selected to perform specific tasks.
Furthermore, it is essential to analyze flexibility and potential pitfalls when considering robotics in general and IRT systems in particular [22]. Albeit guided by teachers, traditional classes are already highly dynamic settings, where alongside lessons, students ask questions in the classroom, i.e., the same location. The IRT solution and software embedded in the robot platform, as well as the IRT hardware and robot skills available to the students at home, determine the set of possible tasks that students can perform and need to be carefully adapted to the different scenarios.
Author Contributions
Conceptualization, J.B. and F.J.R.L.; methodology, J.B. and F.J.R.L.; software, J.B. and F.J.R.L.; validation, J.B. and F.J.R.L.; formal analysis, J.B. and F.J.R.L.; investigation, J.B.; resources, J.B.; data curation, F.J.R.L.; writing—original draft preparation, J.B. and F.J.R.L.; writing—review and editing, J.B. and F.J.R.L.; visualization, J.B. and F.J.R.L.; supervision, J.B.; project administration, J.B. and F.J.R.L.; funding acquisition, J.B. All authors have read and agreed to the published version of the manuscript.
Funding
This research received no external funding.
Institutional Review Board Statement
Not applicable.
Informed Consent Statement
Not applicable.
Data Availability Statement
The data presented in this study are available on request from the corresponding author.
Acknowledgments
The authors would like to thank Thomas Sauvage, Julien Sanchez, and Tom Sevestre from the University of Toulouse III, Paul Sabatier, who assisted in the development of the IRT prototypes in the context of an internship at the University of Luxembourg, and Ciarán Hagen and André Stemper, who were instrumental in collecting the data for the various measurements.
Conflicts of Interest
The authors declare no conflict of interest.
Abbreviations
The following abbreviations are used in this manuscript:
| AAC | Amps Alternating Current |
| AMOLED | Active-Matrix Organic Light-Emitting Diode |
| API | Application Programming Interface |
| AR | Augmented Reality |
| CPU | Central Processing Unit |
| DDR | Double Data Rate |
| LCD | Liquid-Crystal Display |
| DoF | Degree(s) of Freedom |
| HMD | Head-Mounted Display |
| HRI | Human–Robot Interaction |
| IRT | Immersive Robotic Telepresence |
| JSON | JavaScript Object Notation |
| LTS | Long-Term Support |
| NUC | Next Unit of Computing |
| OLED | Organic Light-Emitting Diode |
| RAM | Random Access Memory |
| RiE | Robotics in Education |
| ROS | Robot Operating System |
| SDT | Self-Determination Theory |
| TD | Transactional Distance |
| TFT | Thin-Film Transistor |
| VR | Virtual Reality |
References
- Belpaeme, T.; Ramachandran, A.; Scassellati, B.; Tanaka, F. Social Robots for Education: A Review. Sci. Robot. 2018, 3. [Google Scholar] [CrossRef] [Green Version]
- Clabaugh, C.; Matarić, M. Escaping Oz: Autonomy in Socially Assistive Robotics. Annu. Rev. Control Robot. Auton. Syst. 2019, 2, 33–61. [Google Scholar] [CrossRef]
- Belpaeme, T.; Baxter, P.; de Greeff, J.; Kennedy, J.; Read, R.; Looije, R.; Neerincx, M.; Baroni, I.; Zelati, M.C. Child-Robot Interaction: Perspectives and Challenges. In Proceedings of the 5th International Conference on Social Robotics (ICSR), Bristol, UK, 27–29 October 2013; pp. 452–459. [Google Scholar] [CrossRef]
- Toh, L.P.E.; Causo, A.; Tzuo, P.W.; Chen, I.M.; Yeo, S.H. A Review on the Use of Robots in Education and Young Children. J. Educ. Technol. Soc. 2016, 19, 148–163. [Google Scholar]
- Miller, D.P.; Nourbakhsh, I. Robotics for Education. In Springer Handbook of Robotics; Springer: Cham, Switzerland, 2016; pp. 2115–2134. [Google Scholar] [CrossRef]
- Mubin, O.; Stevens, C.J.; Shahid, S.; Al Mahmud, A.; Dong, J. A Review of the Applicability of Robots in Education. Technol. Educ. Learn. 2013, 1, 1–7. [Google Scholar] [CrossRef] [Green Version]
- Jecker, J.D.; Maccoby, N.; Breitrose, H. Improving Accuracy in Interpreting Non-Verbal Cues of Comprehension. Psychol. Sch. 1965, 2, 239–244. [Google Scholar] [CrossRef]
- Okon, J.J. Role of Non-Verbal Communication in Education. Mediterr. J. Soc. Sci. 2011, 2, 35–40. [Google Scholar]
- Crooks, T.J. The Impact of Classroom Evaluation Practices on Students. Rev. Educ. Res. 1988, 58, 438–481. [Google Scholar] [CrossRef]
- Botev, J.; Rodríguez Lera, F.J. Immersive Telepresence Framework for Remote Educational Scenarios. In Proceedings of the International Conference on Human-Computer Interaction, Copenhagen, Denmark, 19–24 July 2020; pp. 373–390. [Google Scholar] [CrossRef]
- Beam. Available online: https://suitabletech.com/products/beam (accessed on 15 March 2021).
- Double. Available online: https://www.doublerobotics.com (accessed on 15 March 2021).
- Ubbo. Available online: https://www.axyn.fr/en/ubbo-expert/ (accessed on 15 March 2021).
- Zhang, M.; Duan, P.; Zhang, Z.; Esche, S. Development of Telepresence Teaching Robots With Social Capabilities. In Proceedings of the ASME 2018 International Mechanical Engineering Congress and Exposition (IMECE), Pittsburgh, PA, USA, 9–15 November 2018; pp. 1–11. [Google Scholar] [CrossRef]
- Cha, E.; Chen, S.; Matarić, M.J. Designing Telepresence Robots for K-12 Education. In Proceedings of the 26th IEEE International Symposium on Robot and Human Interactive Communication (RO-MAN), Lisbon, Portugal, 28 August–1 September 2017; pp. 683–688. [Google Scholar] [CrossRef]
- Gallon, L.; Abenia, A.; Dubergey, F.; Négui, M. Using a Telepresence Robot in an Educational Context. In Proceedings of the 10th International Conference on Frontiers in Education: Computer Science and Computer Engineering (FECS), Las Vegas, NV, USA, 29 July–1 August 2019; pp. 16–22. [Google Scholar]
- Lei, M.L.; Clemente, I.M.; Hu, Y. Student in the Shell: The Robotic Body and Student Engagement. Comput. Educ. 2019, 130, 59–80. [Google Scholar] [CrossRef]
- Kwon, C. Verification of the Possibility and Effectiveness of Experiential Learning Using HMD-based Immersive VR Technologies. Virtual Real. 2019, 23, 101–118. [Google Scholar] [CrossRef] [Green Version]
- Du, J.; Do, H.M.; Sheng, W. Human-Robot Collaborative Control in a Virtual-Reality-Based Telepresence System. Int. J. Soc. Robot. 2020, 1–12. [Google Scholar] [CrossRef]
- Matsumoto, K.; Langbehn, E.; Narumi, T.; Steinicke, F. Detection Thresholds for Vertical Gains in VR and Drone-based Telepresence Systems. In Proceedings of the IEEE Conference on Virtual Reality and 3D User Interfaces (VR), Atlanta, GA, USA, 22–26 March 2020; pp. 101–107. [Google Scholar] [CrossRef]
- Kim, D.H.; Go, Y.G.; Choi, S.M. An Aerial Mixed-Reality Environment for First-Person-View Drone Flying. Appl. Sci. 2020, 10, 5436. [Google Scholar] [CrossRef]
- Kamińska, D.; Sapiński, T.; Wiak, S.; Tikk, T.; Haamer, R.E.; Avots, E.; Helmi, A.; Ozcinar, C.; Anbarjafari, G. Virtual Reality and its Applications in Education: Survey. Information 2019, 10, 318. [Google Scholar] [CrossRef] [Green Version]
- Allcoat, D.; von Mühlenen, A. Learning in Virtual Reality: Effects on Performance, Emotion and Engagement. Res. Learn. Technol. 2018, 26, 2140. [Google Scholar] [CrossRef] [Green Version]
- Kang, S.; Kang, S. The Study on The Application of Virtual Reality in Adapted Physical Education. Clust. Comput. 2019, 22, 2351–2355. [Google Scholar] [CrossRef]
- Scaradozzi, D.; Screpanti, L.; Cesaretti, L. Towards a Definition of Educational Robotics: A Classification of Tools, Experiences and Assessments. In Smart Learning with Educational Robotics: Using Robots to Scaffold Learning Outcomes; Daniela, L., Ed.; Springer International Publishing: Cham, Switzerland, 2019; pp. 63–92. [Google Scholar] [CrossRef]
- Fernández-Llamas, C.; Conde, M.Á.; Rodríguez-Sedano, F.J.; Rodríguez-Lera, F.J.; Matellán-Olivera, V. Analysing the Computational Competences Acquired by K-12 Students when Lectured by Robotic and Human Teachers. Int. J. Soc. Robot. 2017, 12, 1009–1019. [Google Scholar] [CrossRef]
- Daniela, L.; Lytras, M.D. Educational Robotics for Inclusive Education. Technol. Knowl. Learn. 2019, 24, 219–225. [Google Scholar] [CrossRef] [Green Version]
- Li, T.; John, L.K. Run-time Modeling and Estimation of Operating System Power Consumption. In Proceedings of the ACM International Conference on Measurement and Modeling of Computer Systems (SIGMETRICS), San Diego, CA, USA, 9–14 June 2003; pp. 160–171. [Google Scholar] [CrossRef]
- Abukhalil, T.; Almahafzah, H.; Alksasbeh, M.; Alqaralleh, B.A. Power Optimization in Mobile Robots Using a Real-Time Heuristic. J. Robot. 2020, 2020, 5972398. [Google Scholar] [CrossRef]
- QTrobot. Available online: https://luxai.com/qtrobot-for-research/ (accessed on 15 March 2021).
- Mei, Y.; Lu, Y.H.; Hu, Y.C.; Lee, C.G. A Case Study of Mobile Robot’s Energy Consumption and Conservation Techniques. In Proceedings of the 12th International Conference on Advanced Robotics (ICAR), Seattle, WA, USA, 18–20 July 2005; pp. 492–497. [Google Scholar] [CrossRef] [Green Version]
- Acar, H.; Alptekin, G.; Gelas, J.P.; Ghodous, P. The Impact of Source Code in Software on Power Consumption. Int. J. Electron. Bus. Manag. 2016, 14, 42–52. [Google Scholar]
- Ngo, A. Intel NUC Energy Management. 2018. Available online: https://www.notebookcheck.net/Intel-NUC-Kit-NUC8i7BEH-i7-8559U-Mini-PC-Review.360356.0.html#toc-energy-management (accessed on 15 March 2021).
- Intel RealSense Datasheet. 2020. Available online: https://www.intelrealsense.com/wp-content/uploads/2020/06/Intel-RealSense-D400-Series-Datasheet-June-2020.pdf (accessed on 15 March 2021).
- Quigley, M.; Conley, K.; Gerkey, B.; Faust, J.; Foote, T.; Leibs, J.; Wheeler, R.; Ng, A.Y. ROS: An Open-source Robot Operating System. In Proceedings of the ICRA Workshop on Open Source Software, Kobe, Japan, 12–17 May 2009; Volume 3, p. 5. [Google Scholar]
- 3DiVi Inc. Nuitrack SDK. 2021. Available online: https://nuitrack.com (accessed on 12 March 2021).
- LuxAI. QTrobot Interface. 2020. Available online: https://wiki.ros.org/Robots/qtrobot (accessed on 12 March 2021).
- Labbe, M. find_object_2d. 2016. Available online: https://wiki.ros.org/find_object_2d (accessed on 12 March 2021).
- Codd-Downey, R.; Forooshani, P.M.; Speers, A.; Wang, H.; Jenkin, M.R.M. From ROS to Unity: Leveraging Robot and Virtual Environment Middleware for Immersive Teleoperation. In Proceedings of the 2014 IEEE International Conference on Information and Automation (ICIA), Hailar, China, 28–30 July 2014; pp. 932–936. [Google Scholar]
- Roldán, J.J.; Peña-Tapia, E.; Garzón-Ramos, D.; de León, J.; Garzón, M.; del Cerro, J.; Barrientos, A. Multi-robot Systems, Virtual Reality and ROS: Developing a New Generation of Operator Interfaces. In Robot Operating System (ROS): The Complete Reference (Volume 3); Koubaa, A., Ed.; Springer International Publishing: Cham, Switzerland, 2019; pp. 29–64. [Google Scholar] [CrossRef]
- O’Dea, S. Android: Global Smartphone OS Market Share 2011–2018, by Quarter. 2020. Available online: https://0-www-statista-com.brum.beds.ac.uk/statistics/236027/global-smartphone-os-market-share-of-android/ (accessed on 15 March 2021).
- Kumar, A. ROS Profiler, GitHub Repository. 2020. Available online: https://github.com/arjunskumar/rosprofiler/blob/master/src/rosprofiler/profiler.py (accessed on 15 March 2021).
- Cabibihan, J.J.; So, W.C.; Pramanik, S. Human-recognizable Robotic Gestures. IEEE Trans. Auton. Ment. Dev. 2012, 4, 305–314. [Google Scholar] [CrossRef]
- Cabibihan, J.J.; So, W.C.; Saj, S.; Zhang, Z. Telerobotic Pointing Gestures Shape Human Spatial Cognition. Int. J. Soc. Robot. 2012, 4, 263–272. [Google Scholar] [CrossRef] [Green Version]
- Buildcomputers. Power Consumption of PC Components in Watts. Available online: https://www.buildcomputers.net/power-consumption-of-pc-components.html (accessed on 15 March 2021).
- Mace, J. Rosbridge Suite. 2017. Available online: http://wiki.ros.org/rosbridge_suite (accessed on 15 March 2021).
- Eurostat—Statistics Explained. Electricity Price Statistics. Available online: https://ec.europa.eu/eurostat/statistics-explained/index.php/Electricity_price_statistics (accessed on 15 March 2021).
- Energuide. How Much Power Does a Computer Use? And How Much CO2 Does That Represent? Available online: https://www.energuide.be/en/questions-answers/how-much-power-does-a-computer-use-and-how-much-co2-does-that-represent/54/ (accessed on 15 March 2021).
- Labaree, D.F. Public Goods, Private Goods: The American Struggle over Educational Goals. Am. Educ. Res. J. 1997, 34, 39–81. [Google Scholar] [CrossRef]
Figure 1.
Immersive telepresence approaches that offer the operator different views and interaction modes: 3D/stereoscopic, motion-focused (VR, top right) versus 2D, touch-focused (App, bottom right).
Figure 1.
Immersive telepresence approaches that offer the operator different views and interaction modes: 3D/stereoscopic, motion-focused (VR, top right) versus 2D, touch-focused (App, bottom right).

Figure 2.
QTrobot features and hardware specifications.

Figure 3.
Camera render views of the different IRT solutions.

Figure 4.
Cumulative power consumption over time in the different experimental modes (Amps).

Figure 5.
Mean CPU load over time during the experiments (percent).

Figure 6.
Mean CPU load over time in the different experimental modes (percent).

Figure 7.
Mean memory consumption over time during the experiments (gigabytes).


Table 1.
Cumulative power consumption in different modes.
| Power [W] | ||||||||
|---|---|---|---|---|---|---|---|---|
| Baseline | App-Based IRT | VR-Based IRT | ||||||
| Idle | Idle/NUI | Demo | Demo/NUI | Calibration | Natural | Calibration | Natural | |
| Valid | 3 | 8 | 1 | 2 | 5 | 5 | 10 | 5 |
| Missing | 0 | 0 | 0 | 0 | 0 | 0 | 0 | 0 |
| Mean | 59.684 | 105.774 | 69.641 | 110.627 | 111.811 | 110.224 | 113.051 | 121.638 |
| Std. Deviation | 1.469 | 1.753 | NaN | 0.063 | 1.285 | 0.768 | 1.359 | 0.885 |
| Minimum | 58.660 | 102.174 | 69.641 | 110.582 | 110.051 | 109.260 | 110.705 | 120.701 |
| Maximum | 61.368 | 107.349 | 69.641 | 110.671 | 113.662 | 111.212 | 115.155 | 122.493 |
Table 2.
CPU consumption associated with each routine.
| Mean CPU Load [%] | ||||||||
|---|---|---|---|---|---|---|---|---|
| Baseline | App-Based IRT | VR-Based IRT | ||||||
| Idle | Idle/NUI | Demo | Demo/NUI | Calibration | Natural | Calibration | Natural | |
| Valid | 30 | 60 | 36 | 56 | 156 | 149 | 264 | 122 |
| Missing | 234 | 204 | 228 | 208 | 108 | 115 | 0 | 142 |
| Mean | 10.982 | 223.574 | 13.885 | 217.771 | 240.862 | 235.832 | 255.595 | 249.095 |
| Std. Deviation | 0.762 | 2.692 | 3.026 | 24.369 | 13.034 | 8.510 | 16.223 | 9.529 |
| Minimum | 9.530 | 218.030 | 8.541 | 138.965 | 216.535 | 220.540 | 185.175 | 231.063 |
| Maximum | 12.590 | 230.505 | 23.085 | 248.000 | 281.030 | 259.950 | 287.545 | 276.020 |
Table 3.
Scenario-specific overview for the demo, NUI.
| Mean CPU Load [%] | |||
|---|---|---|---|
| /find_object_2d | /qt_emotion_app | /qt_nuitrack_app | |
| Mean | 158.601 | 0.142 | 55.990 |
| Std. Deviation | 27.326 | 0.264 | 7.221 |
| Minimum | 79.995 | 0.000 | 46.990 |
| Maximum | 178.980 | 1.000 | 72.540 |
Table 4.
Memory consumption in the different experimental modes (megabytes).
| Memory [MB] | ||||||||
|---|---|---|---|---|---|---|---|---|
| Baseline | App-Based IRT | VR-Based IRT | ||||||
| Idle | Idle/NUI | Demo | Demo/NUI | Calibration | Natural | Calibration | Natural | |
| Valid | 60 | 31 | 56 | 36 | 156 | 150 | 264 | 122 |
| Missing | 204 | 233 | 208 | 228 | 108 | 114 | 0 | 142 |
| Mean | 208.1 | 820.0 | 268.2 | 873.6 | 803.2 | 884.8 | 1658.2 | 1464.4 |
| Std. Deviation | 36.3 | 4.5 | 6.0 | 10.2 | 21.0 | 28.5 | 234.9 | 34.6 |
| Minimum | 12.0 | 796.2 | 233.3 | 821.6 | 764.5 | 828.4 | 1171.3 | 1414.7 |
| Maximum | 214.7 | 822.6 | 269.3 | 877.0 | 827.0 | 945.9 | 2462.6 | 1492.2 |
Table 5.
Rosbridge effects of VR-based and app-based IRT.
| Mean CPU Load [%] | Memory [MB] | |||||||
|---|---|---|---|---|---|---|---|---|
| Calibration, App | Calibration, VR | Natural, App | Natural, VR | Calibration, App | Calibration, VR | Natural, App | Natural, VR | |
| Valid | 156 | 164 | 150 | 121 | 156 | 278 | 150 | 121 |
| Missing | 0 | 114 | 0 | 0 | 0 | 0 | 0 | 0 |
| Mean | 5.398 | 10.735 | 4.939 | 13.361 | 9.728 × 10 | 4.017 × 10 | 1.608 × 10 | 8.442 × 10 |
| Mode | 6.005 | 11.000 | 4.995 | 13.505 | 1.011 × 10 | 8.041 × 10 | 1.538 × 10 | 8.371 × 10 |
| Std. Deviation | 0.587 | 0.938 | 0.583 | 1.027 | 6.400 × 10 | 4.603 × 10 | 1.527 × 10 | 512,456.718 |
| Minimum | 3.990 | 7.455 | 2.995 | 10.000 | 8.214 × 10 | 6.188 × 10 | 1.538 × 10 | 8.343 × 10 |
| Maximum | 7.015 | 12.030 | 6.015 | 15.010 | 1.013 × 10 | 1.226 × 10 | 2.162 × 10 | 8.507 × 10 |
Table 6.
Effects of rosbag recording on power consumption (Watts).
| Power [W] | ||||
|---|---|---|---|---|
| Baseline, Idle/NUI | Baseline, Idle | |||
| RosBag | No_RosBag | RosBag | No_RosBag | |
| Valid | 6 | 4 | 3 | 1 |
| Missing | 0 | 0 | 0 | 0 |
| Mean | 106.736 | 106.758 | 63.345 | 58.660 |
| Std. Deviation | 3.430 | 0.355 | 5.577 | NaN |
| Minimum | 102.174 | 106.372 | 59.026 | 58.660 |
| Maximum | 110.671 | 107.205 | 69.641 | 58.660 |
Table 7.
Estimated annual cost of a robot operated six hours/day in different modes (EUR).
| EUR/Year | ||||||
|---|---|---|---|---|---|---|
| Baseline | Telepresence | |||||
| Idle | NUI | Demo | NUI | VR-Based | App-Based | |
| Valid | 3 | 8 | 1 | 2 | 15 | 10 |
| Mean | 27.749 | 49.178 | 32.379 | 51.434 | 53.892 | 51.616 |
| Minimum | 27.273 | 47.505 | 32.379 | 51.414 | 51.471 | 50.799 |
| Maximum | 28.532 | 49.911 | 32.379 | 51.455 | 56.951 | 52.846 |
Publisher’s Note: MDPI stays neutral with regard to jurisdictional claims in published maps and institutional affiliations. |
© 2021 by the authors. Licensee MDPI, Basel, Switzerland. This article is an open access article distributed under the terms and conditions of the Creative Commons Attribution (CC BY) license (https://creativecommons.org/licenses/by/4.0/).
Share and Cite
MDPI and ACS Style
Botev, J.; Rodríguez Lera, F.J. Immersive Robotic Telepresence for Remote Educational Scenarios. Sustainability 2021, 13, 4717. https://0-doi-org.brum.beds.ac.uk/10.3390/su13094717
AMA Style
Botev J, Rodríguez Lera FJ. Immersive Robotic Telepresence for Remote Educational Scenarios. Sustainability. 2021; 13(9):4717. https://0-doi-org.brum.beds.ac.uk/10.3390/su13094717
Chicago/Turabian StyleBotev, Jean, and Francisco J. Rodríguez Lera. 2021. "Immersive Robotic Telepresence for Remote Educational Scenarios" Sustainability 13, no. 9: 4717. https://0-doi-org.brum.beds.ac.uk/10.3390/su13094717
Note that from the first issue of 2016, this journal uses article numbers instead of page numbers. See further details here.