
Key Approaches, Risks, and Product Performance in Managing the Development Process of Complex Products Sustainably


1
CFisUC, Faculty of Sciences and Technology, The University of Coimbra, Rua Larga, P-3004 516 Coimbra, Portugal
2
Department of Industrial Engineering, College of Engineering, King Saud University, Riyadh 11421, Saudi Arabia
3
Raytheon Chair for Systems Engineering, Advanced Manufacturing Institute, King Saud University, Riyadh 11421, Saudi Arabia
*
Author to whom correspondence should be addressed.
Sustainability 2021, 13(9), 4727; https://0-doi-org.brum.beds.ac.uk/10.3390/su13094727
Submission received: 8 January 2021
/
Revised: 6 April 2021
/
Accepted: 10 April 2021
/
Published: 23 April 2021
(This article belongs to the Special Issue Lean Manufacturing Strategies and Energy Management for Industry 4.0)
Abstract
:In the Industry 4.0 environment, being sustainably competitive is essential in global markets. In an endeavor to optimize the added value in the design process of complex products such as robots, managing the development process of such products is studied. The present study identifies the level of product performance that yields maximum return on product development in Industry 4.0. The study also identifies and reviews the key approaches to understanding and managing the design process of such complex products. It has been found that the hybrid approach is the most efficient approach. The study proposes an approach to effectively manage risk in the product design process that hybridizes attributes of both the lean and agile design paradigms. The proposed approach has been validated using five case studies with 99% level of statistical confidence. The results of this study enable efficient development of complex products such as robotic systems towards realizing sustainable competitiveness.
1. Introduction
Industry 4.0 is a strategy for being competitive in global markets providing the integration of lean production systems with efficient and dynamic solutions, and enhancing process flows and effectiveness, as well as the efficiency of machinery. In such a competitive environment, the product design process (PDP) is characterized by multiple intertwined factors ranging from product characteristics to organizational capabilities. Thus, in order to compete successfully in global markets, products should be produced on time, within budget, meeting customer requirements, and meeting organizational requirements [1]. The major problem which leads particularly to decrease in sales despite implementation of statistical quality control techniques and quality improvements is failure to satisfy customer requirements [2]. According to recent product design research, late introduction of new products is the single largest contributor to the loss of companies’ potential profit in industrial countries such as the UK [3]. In addition, recent statistics on new products worldwide have shown that for every ten ideas three will be developed, 1.3 will be launched and only one will make any profit [4]. This is backed by two facts regarding the profitability equation, the quotient of the total revenue minus the cost of goods sold: (i) the revenue component of the profitability equation is significantly determined by the market competitiveness condition and supply-demand equilibrium, (ii) the design and manufacturing operations significantly influence and shape the cost component of this equation [5]. Thus, the criticality of the design process should be analyzed in context.
The design process and product life cycle are inter-linked. The product life cycle reflects how a product progresses from introduction, through growth and maturity to decline. Although designers become involved before the introduction stage, the impact of the design process affects the stages of introduction, growth and maturity. Designers become involved again when a product is in decline to decide either to extend its life cycle or to move on to a new product/project. The need for design processes for realizing efficient management of the product lifecycle has been investigated by Panchal et al. [6], who highlighted the importance of leveraging the design process in addressing the product lifecycle considerations. Challenges were identified that are inherent in the design process. Panchal also identified key elements for enabling the integrated design of products and their underlying design processes in a systematic fashion pointing out the importance of modeling the design process. In accord with these studies, Bernard et al. [7], pointed out that the design process is a critical stage in the product lifecycle. Decisions taken in the design process impact 80% of the overall cost and performance of products throughout the entire lifecycle.
Another critical emphasis in the design process is maintainability. For complex products, improper design can result in making operation and maintenance costs as high as the initial costs. Thus, incorporating maintainability planning within the design process is critical for ensuring a successful product. The operational engineering availability and maintainability should therefore be considered not only in the detailed design phase but also well before that, in the preliminary design phase. In fact, designing for reliability is a top-down approach that starts from the level of system design in the design process. Yu et al. [8] proposed a maintainability layout design for complex equipment. They pointed out that with the increase in equipment complexity, the probability of equipment failure is dramatically increased. They indicated that most of the currently existing maintainability designs are qualitative. The authors thus used a quantitative method of maintainability design for guidance. Ding et al. [9] pointed out that maintainability is an important characteristic that is totally enabled by the product design process. They summarized maintainability design criteria and the measurement index used in product maintainability analysis, and proposed a product maintainability design method by integrating the product feature model, maintainability design criteria and measurement index.
A further critical emphasis in the design process is recyclability. Recyclability is another important aspect that significantly affects the management of the development process of complex products sustainably. Product recyclability is too significant to be enforced by law in industry. In fact, the European “Take-Back Law” requires vehicles’ manufacturers and other manufacturers to take back their products which do not comply with recyclability standards. This becomes more significant when the product contains advanced materials, such as thermoset polymeric composite materials, whose recyclability is a challenge. Thus, design for recycling has become a goal of manufacturers in industry [10]. Peters et al. [11] pointed out that most products are not designed with recycling taken into consideration. They proposed a tool to be used in the design process for assessing the design concept at an early stage with respect to recyclability, indicating that the Design for Recyclability method has three main components: a set of design guidelines, a recycling performance evaluation method, and prioritized improvement suggestions. Li et al. [12] indicated the importance of recyclability and proposed the evaluation of product recyclability in the design process using a time-series forecasting methodology. This proposed tool provides designers with decision support for enabling recyclability at an early stage in the product life cycle.
The current challenge in the design process (DP) is thus to improve the value added to customers while shortening the product development time [4]. This is particularly true in light of what Browning et al. [13] reported that determining how and when value is added in the product development process (PDevP) is problematic. Therefore, this research starts by investigating the relationship between return on product development (PD) and product performance (PP) level in the PDevP (Section 5.1). It then investigates risk management (RM) in the PDevP since the returns on PD are influenced by risk (Section 5.2). Next, the paper investigates the key approaches to understanding and to managing the PDevP since the RM plan can help in realizing the sought harmony between design activities and strategies (Section 5.3). Finally, case studies for validation (Section 6) and the statistical analysis of the results of validation then follow (Section 7). The present paper is an exploratory study that involves case studies for investigating these research objectives.
2. Materials and Methods
This research is an exploratory study that involves five case studies for investigating and validating a proposed design approach. To investigate the truth of the objectives of this research mentioned in the previous section, the following hypothesis is statistically tested in the present paper: “When most companies adopt the hybrid lean-agile approach, the aggregate performance of companies becomes closer to best performance”. To examine a limited number of variables, the case study research method involves a longitudinal examination of a case. It provides a systematic way of looking at events, collecting data, and analyzing information. Case studies provide an empirical inquiry that investigates a phenomenon within its real-life context. In the present paper, a statistical analysis follows the case study in order to test a hypothesis and to further provide quantitative evidence on significance. Such a quantitative case-study provides a statistical framework for making inferences.
In the present research paper, the basis of the case study-based analysis is deductive research and it includes the following steps: (1) determining the research question, (2) selecting the cases and determining the techniques of data gathering and analysis, (3) collecting data, (4) evaluating and analyzing the data, (5) reporting the result of the analysis. Figure 1 provides a block diagram for describing this research approach.
As to the first step in the present paper, the research question is set based on a literature review. This question is related to the hybrid approach that hybridizes attributes of both the lean and agile design paradigms. This question is indicated in the hypothesis formulated in this section and in “Section 7”. A research gap has been identified for investigating whether companies that adopt the hybrid approach in the DP become more successful than those companies that do not. In the second step, five companies are studied regarding the approaches adopted in managing the DP. These five companies are a representative sample of key manufacturing sectors in industry, since statistically the minimum representative sample size is 5 [14]. Data were collected through questionnaires and open interviews using a semi-structured script, with R&D managers and employees from each of these companies. The participants were selected to represent the stakeholders and those who influence the observed events. As to the third step, the data are collected from empirical case studies conducted on industrial companies and reported in the literature [15,16]. Two key referenced papers on case studies that suit the specific focus of the present paper, that are related to each other, that are highly cited and that are authored by leading research authorities, are adopted and utilized in the present paper:
(I) On the total quality management (TQM) practices in R&D-based companies [15]. This study validated the questionnaire on TQM practices in a sample of R&D-based companies;
(II) On the remaining practices in R&D-based companies [16]. This study focused on all practices in a smaller sample of R&D-based companies and adopted the validated questionnaire on TQM practices in the sample of R&D-based companies used by [15].
These two key referenced papers addressed all relevant practices in R&D-based companies. The focus of the statistical validation of the present study is to utilize the results of these two referenced, related and highly cited papers in order to test the hypothesis of the present paper. It is scientifically acceptable to take data from literature on the companies that suit the scope of the present study, i.e., companies that invest in R&D and that produce tangible products in key manufacturing sectors in industry. Therefore, not all of the 11 firms presented in the referenced case study [16] are eligible to be included in the present paper.
In the fourth step, the collected data are analyzed statistically. There were 632 R&D units to which the questionnaire was sent via postal mail. There were 112 received questionnaires that were identified as valid, which constitute the backbone of the sample in the statistical analysis for validation [15]. This indicates about a 20% response rate which is reasonable. The respective number of validly answered questionnaires received from this sample of R&D units in industry is given in Table 1. The industrial sectors adopted in the present paper as key sectors in industry are also the focus of the two referenced papers [15,16].
It is noteworthy that an example of such complex products is robots, as implied in Table 1 in the Mechanical industry in the Machinery industrial sector. The present paper is not intended to be a proof of the generalization of the results, but rather is exploratory research that provides evidence towards establishing a framework for inference. It is noteworthy that randomization in this regard is a randomized controlled sampling method, i.e. simple random sampling. This randomization gives items of particular characteristics the same probability of selection over all trials. Thus, this is in accord with the definition of the technical term “randomization”, which is “making no difference in selection from a group of things”. This applies to the research data gathered and presented in the key referenced paper [16] in the sense that the authors made no difference in selection among the companies that met the basic criterion of being “R&D-based companies”. The authors of this key referenced paper indicated this random selection by stating that these companies operate in different key manufacturing sectors in industry [16]. When the authors of the key referenced paper [16] mentioned that the goal of their paper was not generalization statistically is true in the sense that their data and results do not cover all companies in all industrial sectors. In addition, adopting the criterion that the companies from which the selection is made must be “R&D-based companies” makes the study more focused. This does not contradict randomization, i.e. making no difference in selection, which has been implemented onto the companies that met the basic criterion of being “R&D-based companies”. For instance, there was no difference in selection based on religion or color. The research aim of “not a generalization” mentioned in the key referenced paper [16] makes the present research paper complementary by integratively adding a further value to the gathered research data and case studies. The statistical analysis made in the present paper based on the data gathered by Bigliardi & Galati makes the present paper a continuation of their highly cited research work, filling a research gap.
3. Dissemination and Novelty
The present paper focuses on the development of complex new products, such as robots, and investigates how their performance can be related to risks in Industry 4.0. The novelty and disseminated contribution of this paper to the advancement of knowledge in this research field are reflected in the following points:
- (i)
- Identifying the level of performance of complex products that yields maximum return on PD in Industry 4.0;
- (ii)
- Proposing an approach to effectively manage risk in the complex PDevP that hybridizes attributes of both the lean and agile design paradigms in Industry 4.0;
- (iii)
- Identifying the key approaches to understanding and to managing the complex PDevP in Industry 4.0;
- (iv)
- Proposing the most efficient approach to managing the complex PDevP in Industry 4.0.
4. Sustainability and Product Development Process: A Brief Review
Managing the development process of complex products sustainably is significantly important, not only from the engineering, quality, manufacture, and operational perspectives but also from the economical, managerial, and environmental perspectives. The sustainability of the design process of complex products is the development process that is supported at every stage in the value chain of the product.
Improved sustainability is expected to be realized in this regard in terms of longer service life with maintainability and serviceability, less power consumption, an environmentally friendly product with small emissions footprint, maintainability and recyclability. Improved sustainability would, in an environmentally friendly manner, strengthen competitiveness and growth of the organization that adopts and implements this framework. Sustainability has two aspects to be addressed in the product development process: in the supply chain and in the demand chain.
In the supply chain, Al-Zabidi et al. [17] proposed an approach to assess sustainable agility in a manufacturing organization. They highlighted the relationships between sustainable supply-chain capabilities, enablers, and attributes. They reported that in order to maintain sustainability in the supply chain, priority should be given to: (1) enhancing maintainability and serviceability for enabling flexibility and low cost, (2) development and integration of the core competencies for dealing with cross-functional and cross-enterprise issues in the supply chain. They reported that the design and fabrication process is one of the key factors that shape the decision making criteria for maintaining a sustainable supply chain. Emovon et al. backed this conclusion [18]. Al-Zabidi et al. [17] pointed out that digitalization in product design is one of the sustainable attributes that enable the realization of a sustainable supply chain. Al-Zabidi et al. [17] also pointed out that quality design is a key attribute that is implemented in the design process in order to enable a sustainable supply chain. Several studies have seconded this conclusion [19,20,21].
In the supply chain, the relationship between the environmental footprint and the United Nations’ Sustainable Development Goals has been investigated by Vanham, et al. [22]. They identified a family of environmental footprints that can be used for the assessment of environmental sustainability. They suggested a methodology for assessing how the family of environmental footprints can comply with the United Nations’ Sustainable Development Goals. They also proposed a quantification of the environmental pressures along the supply chain and to relate these to the water–energy–food ecosystem.
In the demand chain, Zimon et al. [23] identified the drivers of sustainable supply chain management that comply with the sustainable development goals. They reported that there are three drivers of sustainable supply chain management implementation: (1) internal drivers within the company including management commitment, organizational involvement, supportive culture, productivity improvement, and waste elimination; (2) demand chain drivers related to customers such as reverse logistics, business social compliance, environmental regulation compliance, customer and supplier involvement; (3) demand chain drivers related to third parties such as regulatory requirements, institutional pressures, international environmental regulations and green warehouses requirements, industrial competition, corporate reputation, and social responsibility. Rosati et al. [24] identified the institutional factors that lead to complying with the United Nations’ Sustainable Development Goals. They reported that the organizations complying with these goals are more likely to have their value chain located in countries with higher levels of climate change vulnerability, national corporate social responsibility, and spending on tertiary education. Fonseca et al. [25] defined the Circular Economy (CE) as an economic system that aims to conciliate economic and environmental performance, by adopting an innovative approach to address the relationship between business and the environment. They investigated a CE model that has been advocated and supported in Europe, proving that this economic system leads to profitability and value creation throughout the value chain. They pointed out that successful implementation of CE activities faces the challenge of the need for both strongly supportive supply chain agents and demand chain customers. In the interest of adding to the advancement of knowledge in this field, the results of the present research on the key approaches, risks and product performance in managing the sustainably of the development process for complex products are presented in the following section.
5. Results
5.1. Product Performance Level and Return on Product Development
Product-oriented research and process-oriented research are the two major streams of research in product design management. Both of these two streams attempt to maximize benefits and to minimize risks to the PD organizations. These two streams aim to minimize variations in performance caused by variations in uncontrollable noise parameters or by variations in the design parameters [26]. In product-oriented design research, the emphasis is placed on the PP technical attributes, such as reliability. The product-oriented design research aims at improving the quality of products by means of statistical engineering through minimizing loss in quality as suggested by Taguchi and Clausing [27,28]. In process-oriented design research, the emphasis is placed on the performance of the DP itself, such as lead time and development cost.
Striking a balance between the conflicting design requirements in the PDP would increase the return on PD. This is particularly true in light of the fact that for a markedly significant percentage of products, focusing on PP improvement would lead to diminishing the return on PD beyond a certain level of improvement of PP, as indicated in Figure 2. Such a certain level of PP is the customers’ acceptable level of quality, i.e., the inflection point A on Figure 2. At this point, all customer needs are fulfilled and beyond which the return on improving PP will diminish. Figure 3 shows that point A is the optimum point to be targeted by designers for minimizing the loss of diminishing return on PP improvement.
If the PP has been improved further than point A on Figure 2, by including common desires among customers, the improvement in PP should not exceed point B, which is the level of PP that yields maximum return on PD. At point B, the slope of the tangent to the curve starts to become zero and no further return on PD can be thus attained by further improving the PP [29]. This proposed relation between PP and return on PD indicated in Figure 2, is similar to the well-established innovation life cycle S-curve [30]; yet the proposed relation addresses a different perspective. This similarity therefore provides further support that backs the proposed relation. Point A in Figure 2 is the optimum point to be targeted by designers for minimizing the loss of diminishing return on PP improvement as shown in Figure 3.
The returns on PD indicated at points A and B in Figure 2 are influenced by risk. Thus, RM in the PDevP is further investigated in the succeeding section.
5.2. Proposed Approach to Managing Risk in the Product Development Process
Efficient management of the PDevP entails not only maximizing value to stakeholders but also minimizing risk in this process. Thus, in addition to the preceding section which aims at maximizing value to stakeholders, this research proposes an approach to managing risk in the PDevP. The present study hybridizes both the lean and agile design paradigms, benefiting from the attributes of both in order to manage risk in the PDevP.
Managing risk in the DP concerns design managers and designers. Baxter [4] argued that risks will always remain but with good management they can be minimized; most importantly, the costs of failure can be significantly reduced by identifying unsuccessful products before too much money is committed to them. Baxter found that the cornerstone of successful innovation is the management of risk through the following two steps: (1) minimizing the risk of a new product failing by ensuring that it satisfies customers, satisfies its functional requirement, has reliable quality, and is cost-effective; (2) minimizing the wastage of resources on failure by killing-off products as soon as they do not meet the objective. Paying attention to technological uncertainty slashes the risk of failure to realize the operational outcome that follows from organizational process factors. Likewise, paying attention to market and environmental uncertainty slashes the risk of failure to realize market success due to the operational outcome [31].
Globalization and increasing competition in businesses result in a turbulent environment where customers expect quicker product delivery at cheaper prices with better perceived quality [32]. Booz et al. [33] empirically found that 46% of resources allocated to New Product Development (NPD) are spent on canceled products or products that are inefficient in adequately yielding financial return. In an endeavor to overcome product failures, the RM should be considered as a central element of the NPD process to reduce risk and thereby to increase the likelihood of success of NPD projects [34,35]. However, according to a cross organizational case study conducted by Raz et al. [36], only few NPD projects use any kind of RM practices. In addition, RM practices in NPD projects have been investigated intensively; the key characteristics of RM processes are not clearly understood among practitioners and researchers [37,38].
Risk can be differentiated from uncertainty in NPD by considering risk as: “effect of uncertainty on an objective”. Following from this definition, risk can be classified as either subjective or objective depending on whether that uncertainty is subjective or objective in nature and on whether its effect is subjective or objective [39,40]. The types of risk in NPD are technological risks, marketing risks, and organizational risks [40]. Each of these types of risk can be subjective or objective and influence the typical targets of PD. These typical targets are high perceived quality of product, low development cost, short development time, and low product cost. Each of these typical targets generates risks in varying degrees throughout the phases of the NPD process [39]. The key activities in the process of managing such risks are identification, analysis, assessment, and treatment of risk [40]. The NPD RM process thus usually starts with defining possible sources of uncertainty and defining objectives. These objectives often focus on project-level metrics such as schedule, product-related metrics such as time-to-market, or corporate-level metrics such as market share. A PD value stream map is usually used to visualize the NPD process in order to spot possible uncertain events. Cause-and-effect scenarios are then built based on the identified uncertain events. These cause-and-effect scenarios are then mapped against objectives in order to assess their impact, constructing a probability-based risk criticality rating. Projects are then ranked according to their exposure to uncertainty and to the ratio of expected risk over the return balance of the project. Risk treatment then follows which includes reduction of uncertainties using quality management, design automation, and early supplier integration [40]. The interplay between the RM process activities and the NPD process activities varies throughout the phases of the NPD process. The two key challenges of RM in NPD projects are to find the optimum balance between: (i) the cost of carrying risks versus the cost of mitigating risks, (ii) the risk that is taken versus the expected return on investment from the NPD project. Despite the significant influence of suppliers on NPD, supplier-related risks in NPD projects are not well addressed in the literature [40].
The present research therefore proposes a three-phase RM action plan to minimize risk in the PDevP. The first phase of this plan should precede the development process. In this phase, SWOT (i.e., Strengths, Weaknesses, Opportunities, Threats) analysis for the product design company is conducted; optimization then follows between the cost of carrying risks versus the cost of mitigating risks as well as between the risk taken and the return on investment, and strategic partnership with key technology providers is established, which reflects the organizational aspect of RM. The second phase of this plan should be conducted during the DP. In this phase, the design managers should ensure that the product satisfies the customer, satisfies its functional requirement, has reliable quality, and is cost-effective, which collectively reflect the technological aspect of RM. The attained level of PP must not surpass point B on Figure 2. The third and last phase of this plan should succeed the end of the PDevP. In the third phase, Failure Modes and Effects Analysis (FMEA) is conducted and ultimately products which do not meet the set target are killed off promptly whenever this appears. This phase of the plan reflects the marketing aspect of the RM. This RM action plan can help in realizing the sought harmony between the design activities and strategies. Having seen this, let us now take a closer look at the key approaches to understanding and to managing the PDevP.
5.3. Key Approaches to Understanding and to Managing the Complex Products Development Process
By reviewing the literature on the PDevP, it has been found that there are primarily six approaches that are used in understanding and managing the PDevP. These approaches are: (1) strategic, resource-based and sustainability-oriented approach; (2) financial and cost-oriented approach; (3) PD time duration-oriented approach; (4) technical and problem solving approach; (5) social sciences and knowledge-based approach; (6) hybrid approach. These approaches will be investigated in this section.
5.3.1. Strategic, Resource-Based and Sustainability-Oriented Approach
Improvement in product attributes is primarily a comparative advantage for any PD organization. In strategic management, the strategic marketing decision is to determine: (i) timing of introducing the product, (ii) whether the new product is a new version of an existing product, a sequence of products with overlapping lifecycles or a new product generation, (iii) target performance level [41]. Meanwhile, the strategic development decision is to allocate time and resources across the product design phases [42]. Hence, the relationship among the PDevP, return on PD, and strategic business goals of the PD organization is significant. Several studies explored the aspects of the strategic, resource-based and sustainability-oriented perspective of product design and development.
The strategic perspective of the design of products has received research and industrial interests. Clark and Fujimoto [43] investigated the design of products and identified three elements of competitiveness and concluded that what distinguish Japanese firms are: (i) capability in manufacturing, (ii) rapid development, (iii) efficient development.
The role of resources in NPD is not widely emphasized. The Stage-Gate model developed by Cooper described a recipe for developing new products more successfully [44] that can help in identifying which of several independent factors are correlated with the success of the NPD project. In the Stage-Gate model, resources are considered as given and predictability is utilized to reduce the NPD failure rate, and thereby to improve NPD performance [44]. Several practices have been associated with effective portfolio management including: (1) maximizing the value of the portfolio, (2) prioritizing certain projects, (3) seeking balance in the portfolio in terms of a number of parameters, e.g., long-term projects versus short-term projects, (4) strategically aligning the portfolio with the overall organizational strategy, (5) having a formal systematic management system in place to select the correct projects and allocate necessary resources [45]. Contrary to Cooper’s approach, the resource-based view of the firm places considerable emphasis on resources. Given the fact that resources are heterogeneously distributed across firms, firms with valuable, inimitable and non-substitutable resources can thus achieve sustainable competitive advantages [46]. Paladino [47] further explored the effect of both market orientation and resource-based strategies on the success of design firms. This study concluded that PD managers should address customers’ values within the limits of the provision of resources.
More often than not, innovations legitimacy is sought in contexts where the logic of business prosperity does not resonate with environmental sustainability. In facing the challenges of reducing environmental impacts, design teams are attending more to the environmental, social and economic implications of their design activities and products. The bottom line of design sustainability is moving quickly towards generating solutions and innovations that are based on effective utilization of resources, such as energy consumption, and are intended to co-create positive impacts for society and the environment [48]. This is particularly true in the environment of Industry 4.0 which has a significant impact on the innovation of machinery and the production of the finished products [48]. The strengths and weaknesses of this approach are listed in Table 2.
As can be gathered from Table 2, this approach is unique in focusing on reducing the environmental risk. The relative ease of the implementation of this approach is because it does not significantly take into account the knowledge-based aspect of the NPD. Having explored the strategic, resource-based and sustainability-oriented approach, let us now explore the second approach to understanding and to managing the PDevP.
5.3.2. Cost-Oriented Approach
Cost-effective design is another approach in managing the DP. Cost-oriented PD places emphasis not only on the design of components but also on the life cycle cost. This life cycle cost includes the cost of ownership encompassing design, production, operation, maintenance, reconfiguration, and recycling. In this approach, standard components and advanced technologies can help in reducing the cost. Thus, the emphasis in this approach that is adopted by numerous studies is not placed on cheap components but rather on the cost-effectiveness of the life-cycle. The cost-effectiveness of products is highly important to the extent that technically promising products can be slashed because of lack of cost-effectiveness [49]. Backing this approach, Provatidis and Venetsanos [50] reached the conclusion that structural cost minimization is as important as layout optimization. Highlighting a rational stream of financial performance in NPD, Myers and Marquis [51] investigated the determinants of financial performance of the product. They addressed the organizational aspect of RM elaborating on how different players, processes, and structures affect the financial performance of the product [52].
Cost-oriented PD acts as a catalyst for cost reduction in manufacturing processes and for establishing intelligent maintenance systems [53]. In support of this approach, Hundal [54] found that estimating costs and systematic design are critically important in the DP. The findings of Cooper and Slagmulder [55] supported this argument and recommended starting cost management effectively at the development stage since almost 90% of the costs of a product are determined in the development process. They found that cost management during the DP is based on target costing and value engineering. Further, Dvořáková et al. [56] proposed the optimization corporate cash flow through cash flow planning and forecasting. They found that this results in improved sustainability of business performance in industrial companies. The strengths and weaknesses of this approach are listed in Table 3.
As can be gathered from Table 3, this approach is unique in setting the focus on reducing business risk with respect to financial aspects and cash flow. The relative easiness of the implementation of this approach is because it does not significantly take into account the other aspects of the NPD. Those other aspects include resource-based & sustainability-related aspect, development time duration, technicality & problem solving, and social science & knowledge-based aspects. This paves the way to investigate the next approach to understanding and managing the PDevP.
5.3.3. Time Duration-Oriented Approach
The PD time duration is one of the most critical concerns to design managers. Among the studies that explore the time duration-oriented perspective of the PDevP is that made by Baughey [57] on exploring the potential of 3D modeling in Product Lifecycle Management. Advanced design software can generate photo-realistic images that facilitate the conceptual design phase in the PDevP, such as 3D Product Lifecycle Management [57]. A physical 3-dimensional prototype of a component can help in functionality testing and assembly trials, speeding up the design approval process.
In an endeavor to explore how time can be compressed in the PDevP, Beesley [58] found that time compression is a key source of competitive advantage that is underutilized in large firms. Thus, time compression with respect to the supply chain principles and “design for logistics” was explored. The study introduced a proposed method of using time-based process mapping. Backing this, Cohen et al. [59] proposed a model of DP that captures the tradeoff between new product design cycle time compression and improvements in PP. They determined the minimal speed of product improvement required for yielding profits.
In an endeavor to explore the relationship between product success and speed-to-market, Chen et al. [60] investigated whether being fast under uncertainty is better. They highlighted that market uncertainty, rather than technological uncertainty, is the key parameter in the speed–success relationship during low market uncertainty. Backing this rapid design perspective, Liou et al. [61] emphasized the importance of simulation and modelling and prototyping to time compression, and suggested direct laser deposition to this end. Further, Eppinger [62] found that minimizing design iterations is highly important in equilibrating the maximization of complex product functionality with the minimization of waste. He suggested the Design Structure Matrix (DSM) for representing design complexity in terms of design iterations needed in order to reach the design solution whilst conforming to design constraints. The strengths and weaknesses of this approach are listed in Table 4.
As can be gathered from Table 4, this approach is unique in reducing marketing risk, such as being late for the introduction of the product to targeted market and demand. The relative easiness of implementation of this approach is because it does not significantly take into account the other aspects of the NPD. These other aspects include resource-based & sustainability-related aspects, development cost, technicality & problem solving, and social science & knowledge-based aspects. Having explored this approach, let us now investigate how the technical perspective can help in better managing the PDevP.
5.3.4. Technical and Problem Solving Approach
The technical-oriented perspective indicates a specific engineering solution to a specific technical engineering problem. Thus, the aim of this approach is to find such a technical solution. The research studies in this area address all types of technical problems. Highlighting the problem solving stream in the DP, Imai et al. [63] studied successful Japanese products in the 1980s [51].
In order to efficiently develop design concepts, Terninko et al. [64] developed an approach focusing on structured creativity for problem solving. Eris [65] proposed a model of design thinking that transforms design requirements into concepts and those design concepts in turn into design specifications using a question-based approach. In a similar line of reasoning, axiomatic design was developed for identifying the most suitable parameters in the DP for functional requirements [66,67]. However, the approach of axiomatic design assumes the equal importance of all design activities and assumes as well the correlation between all design activities and product success.
Since the 1990s robotics-related technical oriented issues have been among the most dominant technical oriented issues in the design literature. Hardt et al. [68] proposed design optimization of a walking robot and adopted nonlinear optimization for a multi-legged robot. Castillo et al. [69] investigated Genetic Algorithm (GA) for the offline point-to-point path planning in a mobile robot. In that study, this design approach was based on generating “valid” paths for a robot to move from a starting point to a destination navigating through obstacles. The strengths and weaknesses of this approach are listed in Table 5.
As can be gathered from Table 5, this approach is unique in setting the focus on reducing technical risk, such as the difficulty of upgrading. The relative easiness of the implementation of this approach is because it does not significantly take into account the other aspects of the NPD. These other aspects include resource-based & sustainability-related aspect, development costs, development time duration, and social science & knowledge-based aspects. Going beyond this technical perspective, the social science and knowledge-based perspective is the next approach to be explored for better management of the DP.
5.3.5. Social Science and Knowledge-Based Approach
This approach explores the DP from a social science perspective and has been developed since the 1990s when Bloch [70] found that the physical form of products is a determinant of their success in the marketplace. This study presented how the design of products is related to customers’ psychological and behavioral responses, and what their strategic implications are. Backing this, Nishiguchi [71] developed social bases for efficient DP, showing how to manage the DP within the design organization, and how to coordinate this process with suppliers. Pioneering a communication and team development-based stream in NPD, Allen [72] emphasized the role of communication and team development in the DP [51].
Among the key areas in this approach are information hiding and communication. Yassine et al. [73] explored these areas and found that hiding leads to recurrence of problems in the PDevP and termed this the “churn effect”. They presented a model of dynamic work transformation to characterize the conditions of churn. Hence, this dynamic model enables design managers to investigate the effects of managerial actions for continuous improvement. From a social science standpoint, in order to eliminate such information hiding in the DP, Maier et al. [74] statistically correlated the factors influencing communication in the design of a complex product. They managed to specify the core factors amongst these.
Knowledge management (KM) emerged as a promising research direction in this approach. The categories in knowledge assets in the NPD process as intangible assets include human capital, such as cognitive abilities, structural abilities, such as testing and codifying solutions, and relational capital, such as evaluating solutions by company stakeholders [75]. Nonaka and Takeuchi [76] associated the success of Japanese companies with their ability to organizationally create new knowledge, to convert tacit knowledge created through metaphor and analogy into explicit knowledge contained in manuals, and to use this knowledge to produce successful products and technologies. Addressing the organizational aspect of RM, they additionally found that the best management style to create knowledge organizationally is neither top-down nor bottom-up, but rather “middle-up-down,” in which the middle managers form a bridge between the top management and the realities at the frontline. There is also a group of studies, such as [77], which designs software architecture framework developments for KM systems, categorizing NPD knowledge items and linking knowledge items and their repositories systematically. Although these frameworks state clear relationships between knowledge items and NPD phases, they generally focus on explicit knowledge items such as CAD components. The strengths and weaknesses of this approach are listed in Table 6.
As can be gathered from Table 6, this approach is unique in facilitating the market success of the firm based on customer focus. The relative easiness of the implementation of this approach is because it does not significantly take into account the other aspects of the NPD. These other aspects include resource-based & sustainability-related aspects, development cost, development time duration, and technicality & problem solving aspects. Having covered this, a question might now be asked: “Is there an approach to managing the PDevP that takes the five perspectives discussed so far into consideration?” The next subsection will answer this question.
5.3.6. Hybrid Approach
The hybrid approach is the most comprehensive perspective in manipulating the various aspects of the DP. It hybridizes the other perspectives in order to integratively manage the DP. Among the studies that adopt this hybrid perspective is that made by Huang [78] that highlighted the integrative trade-off between design techniques, such as design for manufacture and design for assembly. Hybridizing some of the five previously mentioned product design approaches, Cross [79] developed a design method that takes into account constraints including time, budget, and material properties and addresses problem solving and optimization. Following those findings, Elmoselhy [80,81] conducted an empirical study to investigate the relation between PDevP and performance. The internal parameters of the DP proved to significantly influence the PP measures.
Integrating information, automation, and value chain from product design to the manufacturing floor should be the route to design and manufacturing flexibility. Minimizing operational cost and risk, computer-aided manufacturing (CAM) in industry 4.0 offers a meritorious advantage in each of the four key areas of manufacturing: information flow, process coordination, efficient utilization of resources, and flexibility [82]. This merit leads to a shorter product development cycle and thus higher profitability. It has been found that a hybrid lean-agile design approach strikes a balance between the five pillars of the integrated DP which are attributes, development time, development cost, customer value, and the enterprise’s business goals for the product. Manufacturing flexibility is recommended to be achieved by adopting level-2 automation by having the cycling sub-process automated, providing scalability of its machines, convertibility of its machines, and the ability of diagnosing its machines. A manufacturing system should be designed to flow and its recommended level of automation strikes a balance between the five parameters of automation: productive efficiency, uptime, changeover time, flexibility, and cost. The strengths and weaknesses of this approach are listed in Table 7.
As can be gathered from Table 7, although this approach strikes an optimum balance among all the aspects of NPD, the management of its implementation needs multi-talented and knowledgeable people. In order to validate the proposed approach of hybrid lean-agile design, case studies have been conducted.
6. Case Studies for Validation
In this case study, five companies have been analyzed regarding each of the above-mentioned approaches. These five companies have been considered since they met the basic criterion which is to be a “R&D-based company” in the key manufacturing sectors in industry. There was no difference in selection, for instance based on religion or color. The description of these companies is presented in Table 8 [16].
For each of these companies, the events that were observed on the strategic, resource-based and sustainability-oriented approach include: Setting and Implementing R & D Strategy, Conforming to quality specifications, and Entering new markets. The events that were observed on the cost-oriented approach include: Employees flexibility, and Adhering to financial standards. The events that were observed on the time duration-oriented approach include: Speed of PD, and Number of new products. The events that were observed on the technical and problem solving approach include: Partnering with suppliers to identify needs and requirements, Involving customers in PDevPs, and Performance of products. The events that were observed on the social science and knowledge-based approach include: Availability of up-to-date data and information, Implementing effective reporting practices, “Fool-proof” process design, Maintaining a close relationship with customers, Involving employees in R&D decision making, and Use of latest technologies.
Data were collected through questionnaires and open interviews using a semi-structured script, with R&D management from each of the five companies. In the first part of the interviews with the management of the R & D units in this sample of companies, respondents were asked to answer verbal questions on the aspects mentioned in Table 9, Table 10, Table 11, Table 12 and Table 13. In the second part, respondents were asked to answer a series of questions dealing with the TQM factors and practices [15,16]. “Success” herein means the market success of the firm and that is based on product quality and customer focus. The level of adoption that each of these companies has reached regarding each of the above-mentioned approaches is presented in Table 9, Table 10, Table 11, Table 12 and Table 13. The scale of evaluation of adoption of each practice within each of the above-mentioned approaches is a 5-point scale, i.e., level 5 is the highest level that can be ultimately reached. Table 9, Table 10, Table 11, Table 12 and Table 13 present these levels of adoption. Table 9 presents the level of adoption of the strategic, resource-based and sustainability-oriented approach in these five companies. The level of adoption of the cost-oriented approach in these five companies is shown in Table 10. The level of adoption of the time duration-oriented approach is presented in Table 11. The level of adoption of the technical and problem solving approach is shown in Table 12. The level of adoption of the social science and knowledge-based approach is presented in Table 13.
The key referenced papers in these highly cited case studies used the arithmetical mean and the statistically significant test [15,16]. It is noteworthy that the arithmetical mean is a statistical method in this regard for measuring the central tendency of the level of meeting the ultimate targeted performance by these companies. The arithmetical mean is a suitable statistical method in this regard, for several reasons: (i) it is insensitive to the order of companies in the dataset, (ii) it is the most efficient method of averaging for representing the central tendency in the present dataset in comparison with the median, mid-range and mode. The present paper is focused on tangible complex products that are processed in R&D-based companies in key manufacturing sectors. It is thus reasonable to compute the mean in this regard. It is also reasonable to use the statistical significance test in this regard.
Based on the Mean value of adopting Practices, Table 9, Table 10, Table 11, Table 12 and Table 13 imply that companies I, II, and III are much more successful than companies IV and V. Table 9, Table 10, Table 11, Table 12 and Table 13 show that only the companies that have adopted the hybrid approach have been successful in all of the five aspects. The next section presents the statistical analysis of the results of this validation.
7. Statistical Analysis of the Results of Validation
The case studies have been conducted in order to test the hypothesis that: “When most of the companies adopt the hybrid lean-agile approach, the aggregate performance of companies becomes closer to the best performance”. In order to test the significance of the results of the case studies, an inferential statistics-based analysis is conducted in this section. It is assumed that the interval variable is a random variable that is normally distributed (xi) and represents the average of the adoption of the approaches presented in Table 9, Table 10, Table 11, Table 12 and Table 13 as shown in Table 14.
The hypothesis is now formulated mathematically comparing the mean of the dataset () with the ultimate corresponding value of performance (μo), which is the ultimate value of performance corresponding to the ultimate adoption of the approaches presented in Table 9, Table 10, Table 11, Table 12 and Table 13. This hypothesis is mathematically formulated as follows:
Moderate departure from normality should not significantly affect the results. The test statistic, tx, is hence evaluated as follows:
where:
is the standard deviation of the dataset of the interval variable xi,
ᴧ is the number of records in the sample.
Thus, using Table 14 and for ᴧ equals 5, the standard deviation, sx, is equal to “0.917” following from Equation (4). Hence, following from Equation (3), tx is equal to “−2.78”. At the most conservative level of significance, αo, is equal to “0.01”, since this is a two-sided test, and both the mean and variance are estimated, from the t-distribution we find that equals “4.6” for ᴧ equals 5. Therefore, is greater than tx. Therefore, we cannot reject the null hypothesis. Thus, the null hypothesis, Equation (1), is significant at the level of confidence of 99%. The result of statistically testing this hypothesis therefore proves that when companies adopt the hybrid lean-agile approach, the aggregate performance of the companies becomes closer to best performance.
8. Discussion
While other studies in the NDP literature, such as [84], investigated the characteristics of innovative firms, such as their size and financial resources, the present research has identified the level of PP that yields maximum return on PD in such a competitive environment as Industry 4.0. The study has also identified the six key approaches to understanding and to managing the PDevP. These key approaches are (1) strategic, resource-based and sustainability-oriented perspective; (2) cost accounting and financial perspective; (3) PD time duration-oriented perspective; (4) social sciences and knowledge-based perspective; (5) technical and problem solving perspective; (6) hybrid approach of the aforementioned five approaches.
Following the social science and knowledge-based approach, many organizations have implemented enterprise-wide knowledge management initiatives with the aim of transforming organizational knowledge assets into core competencies in order to gain competitive advantage [85,86]. Therefore, business-critical tacit knowledge has become more visible, more appropriately distributed, and adequately codified [87]. The adopted approach in this study enables business-critical tacit knowledge to be shared efficiently.
Following the strategic, resource-based and sustainability-oriented approach, organizations are increasingly recognizing that intangible assets are the key strategic resources and that tangible assets have frequently become transient commodities. Organizations thus need to efficiently manage their intellectual resources in order to gain and sustain a competitive advantage [86]. Since it is critical for organizations to recognize whether they are using their intangible resources efficiently for value creation, an increasing number of researchers have been addressing the assessment of intellectual capital [88,89,90,91,92,93,94]. This assessment should be followed by the determination of which KM activities are required to obtain the desired intellectual capital results [88]. Among the key means for firms to acquire knowledge-assets is via intra-organizational processes [92]. This is particularly true in light of the fact that researchers analyzed the NPD by moving from the traditional approach of considering the NPD as a planning process of strategic and organizational aspects to a cognitive approach which handles NPD as a process and relies on learning and strategic knowledge management [95,96,97]. In addition, numerous studies have investigated the role of specific knowledge assets in the NPD process, such as the relationships a company has [98]. The adopted approach in this study enables intra-organizational processes based on learning. In addition, it enables efficient utilization of the available resources, such as energy consumption.
The present study has identified the PP level in the PDevP that yields maximum return on PD as indicated in Figure 2. The study has indicated that point A in Figure 2 is the optimum point to be targeted by designers for minimizing the loss of diminishing return on PP improvement as depicted in Figure 3. The idealized model presented in Figure 2 and Figure 3 and supported by evidence from the literature paves the way for further investigation in future research papers. In the five case studies presented herein: (i) performance has been measured in terms of “Performance of Products” in Table 12, (ii) returns have been measured in terms of “Financial Performance” in Table 10. It is scientifically acceptable to use data from a published case study available in the literature to validate the results of another research work, such as the highly cited research published in top scientific research journals [99]. Extracting the dataset from a highly cited paper to validate the research results of another research work is even more reliable than creating our own dataset from our own experiments, because no bias in this regard exists since the authors are not the source of the dataset. This research methodology is particularly useful in NPD research.
The task of NPD becomes increasingly complex as it has to satisfy and integrate the preferences of stakeholders to formulate an optimal set of specifications in a competitive arena and a turbulent environment [100]. Thus, it requires not only knowledge from various disciplines such as marketing and manufacturing [101] but also an integration of various functions such as R&D and planning [32]. The task becomes more challenging as companies are increasingly placing an emphasis on their core competencies and outsourcing non-core competencies to third parties [102]. On the one hand, where these partners along the supply chain bring improvements and further business opportunities in the NPD process, they present additional complexities and risks on the other [102]. Although NPD is considered a source of competitive advantage [35], these complexities and risks render it a risky endeavor [103,104]. The adopted approach in this study tackles these complexities and mitigates these risks [105,106,107].
The first phase of the RM proposed action plan takes place before the beginning of the PDP in which SWOT analysis is conducted. The second phase of this plan is during the PDevP in which the design managers should ensure that the product satisfies the customer, satisfies its functional requirement, has reliable quality, and is cost-effective, which reflects the technological aspect of RM. The third and last phase of this plan is after the end of the PDP in which FMEA is conducted and ultimately products which do not meet the objective are killed off as soon as possible, which reflects the marketing aspect of RM. The RM plan proposed in the present paper is an extension of the RM plan proposed by Baxter [4].
It is noteworthy that randomized controlled sampling was applicable to the research data gathered and presented in the paper [16] in the sense that the authors made no difference in selection among the companies that met the basic criterion of their research, which is to be “R&D-based companies”. Adopting the criterion that the companies from which the selection is made must be “R&D-based companies”, is scientifically acceptable in the sense that it makes the study more focused. The claim of the research approach of “not a generalization” mentioned in [16] makes the present research paper a complementary piece of research that integratively adds further value to the research data gathered by Bigliardi & Galati and the case study. The statistical analysis made in the present paper based on the data gathered by Bigliardi & Galati makes the present research paper a continuation of their research work filling a research gap. The results of the present study would expectedly help in enabling the paradigm shift from Industry 4.0 to Industry 5.0, which is driven by being environmentally friendly, to realize the United Nations’ Sustainable Development Goals.
9. Conclusions
The present paper has presented a way of managing the development process of complex products sustainably in such a competitive environment as that of Industry 4.0. The study has presented the relationship between PP level and return on PD in a way that is similar to the well-established innovation life cycle S-curve. The paper has shown that the point of minimum loss of diminishing return (Point A in Figure 2) should be targeted by designers for optimizing the return on PP improvement. The paper has identified the level of performance of complex products such as robots that yields maximum return on PD. Since the returns on PD are influenced by risk, a RM action plan has been presented in order to minimize risk in the DP. By reviewing the literature on the PDevP, this study has pointed out that there are six key approaches to understanding and to managing the DP. It has been found that the hybrid approach is the most efficient approach to managing and to efficiently determining how and when value is added in a complex product’s development process. The hybrid approach is the best approach to minimize the overall risk and thus to streamline the implementation of the proposed action plan. The case studies that have been conducted have shown with 99% level of confidence that the companies that adopt the hybrid approach become much more successful than those companies that do not adopt the hybrid approach. The present research paper opens a research avenue for further investigating the PP levels that yield maximum and minimum return on PD in such a competitive environment as Industry 4.0. In addition, the paper opens up a research direction for the empirical industrial implementation of the proposed RM approach in the DP of complex products in the manufacturing sector. The results of this research are limited to: (i) the product development process, (ii) complex products, (iii) the manufacturing sector. Future research in this regard includes further validation of the inference of the statistical results for R&D-based companies in the key manufacturing sectors in industry.
Author Contributions
Conceptualization, S.A.M.A.; methodology, S.A.M.A.; software, S.A.M.A.; validation, S.A.M.A.; formal analysis, S.A.M.A.; investigation, S.A.M.A.; data curation, S.A.M.A.; writing—original draft preparation, S.A.M.A.; writing—review and editing, M.S.A.; supervision, M.S.A.; funding acquisition, M.S.A. All authors have read and agreed to the published version of the manuscript.
Funding
The authors are grateful to the Raytheon Chair for Systems Engineering for funding.
Institutional Review Board Statement
Not applicable.
Informed Consent Statement
Not applicable.
Data Availability Statement
The data presented in this study are available on request from the corresponding author.
Acknowledgments
The authors are grateful to the Raytheon Chair for System Engineering for funding. The University of Cambridge, UK, is thanked for providing facilities for this research. In addition, the support provided by the University of Coimbra, Portugal, and the Foundation for Science and Technology (FCT) is acknowledged.
Conflicts of Interest
The authors declare no conflict of interest.
References
- The British Standards Institution. BS 7000-1:2008 Design Management Systems: Guide to Managing Innovation; The Britis Standards Institution: London, UK, 2008. [Google Scholar]
- Pyzdek, T.; Keller, P.A. Quality Engineering Handbook; CRC Press: Boca Raton, FL, USA, 2003. [Google Scholar]
- Clarkson, J.P.; Eckert, C. Design Process Improvement: A Review of Current Practice; Springer: Berlin, Germany, 2005. [Google Scholar]
- Baxter, M.R. Product Design: Practical Methods for the Systematic Development of New Products; Chapman and Hall: London, UK, 1995. [Google Scholar]
- Stevenson, W.J. Operations Management; McGraw-Hill Companies Inc.: New York, NY, USA, 2002. [Google Scholar]
- Panchal, J.H.; Fernández, M.G.; Paredis, C.J.J.; Allen, J.K.; Mistree, F. Designing Design Processes in Product Lifecycle Management: Research Issues and Strategies. In Proceedings of the DETC’04: ASME 2004 Design Engineering Technical Conferences and Computer and Information in Engineering Conference, Salt Lake City, UT, USA, 28 September–2 October 2004. [Google Scholar]
- Alain, B.; Coatanea, E.; Christophe, F.; Laroche, F. Design: A key stage of product lifecycle. Procedia CIRP 2014, 21, 3–9. [Google Scholar]
- Yu, D.; Wang, C.L.; Wu, Y.Q. Study on the maintainability layout design about complicated equipment. In Proceedings of the 2016 Prognostics and System Health Management Conference (PHM-Chengdu), Denver, CO, USA, 3–6 October 2016. [Google Scholar] [CrossRef]
- Ding, Y. Product Maintainability Design method and support tool based on feature model. J. Softw. Eng. Appl. 2009, 2, 165–172. [Google Scholar] [CrossRef] [Green Version]
- Maier, C.; Calafut, T. Polypropylene: The Definitive User’s Guide and Databook; Elsevier: Amsterdam, The Netherlands, 1998. [Google Scholar]
- Peters, H.; Toxopeus, M.; Jauregui-Becker, J.; Dirksen, M. Prioritizing ‘Design for Recyclability’ guidelines, bridging the gap between recyclers and product developers. In Proceedings of the 19th CIRP International Conference on Life Cycle Engineering, Berkeley, CA, USA, 23–25 May 2012. [Google Scholar]
- Li, Z.; Lai, X.; Huang, Y.; Barenji, A.V. Evaluation of product recyclability at the product design phase: A time-series forecasting methodology. Int. J. Comput. Integr. Manuf. 2018, 31. [Google Scholar] [CrossRef]
- Browning, T.R.; Deyst, J.J.; Eppinger, S.D. Adding value in product development by creating information and reducing risk. Trans. Eng. Manag. 2002, 49, 443–458. [Google Scholar] [CrossRef] [Green Version]
- Alder, H.L.; Roessler, E.B. Introduction to Probability and Statistics; W.H. Freeman and Company, Macmillan: Gordonsville, VA, USA, 1962. [Google Scholar]
- Prajogo, D.I.; Hong, S.W. The effect of TQM on performance in R & D environment: A perspective from South Korean firms. Technovation 2008, 28, 855–863. Available online: https://research.monash.edu/en/publications/the-effect-of-tqm-on-performance-in-rampd-environments-a-perspect (accessed on 21 April 2021).
- Bigliardi, B.; Galati, F. The implementation of TQM in R&D environments. J. Technol. Manag. Innov. 2014, 9, 157–171. [Google Scholar] [CrossRef] [Green Version]
- Ayoub Al-Zabidi, A.U.R.; Mohammed, A. An approach to assess sustainable supply chain agility for a manufacturing organization. Sustainability 2021, 13, 1752. [Google Scholar] [CrossRef]
- Emovon, I.; Okpako, O.S.; Edjokpa, E. Application of Fuzzy MOORA method in the design and fabrication of an automated hammering machine. World J. Eng. 2020, 18, 37–49. [Google Scholar] [CrossRef]
- Vinodh, S.; Devadasan, S.R.; Vimal, K.E.K.; Kumar, D. Design of agile supply chain assessment model and its case study in an indian automotive components manufacturing organization. J. Manuf. Syst. 2013, 32, 620–631. [Google Scholar] [CrossRef]
- Vinodh, S.; Prakash, N.H.; Selvan, K.E. Evaluation of agility in supply chains using fuzzy association rules mining. Int. J. Prod. Res. 2011, 49, 6651–6661. [Google Scholar] [CrossRef]
- Iskanius, P. An Agile Supply Chain for a Project-Oriented Steel Product Network; University of Oulu: Oulu, Finland, 2006; ISBN 978-951-42-8148-8. [Google Scholar]
- Vanham, D.; Leip, A.; Galli, A.; Kastner, T.; Bruckner, M.; Uwizeye, A.; van Dijk, K.; Ercin, E.; Dalin, C.; Brandao, M.; et al. Environmental footprint family to address local to planetary sustainability and deliver on the SDGs. Sci. Total Environ. 2019, 693, 133642. [Google Scholar] [CrossRef] [PubMed]
- Dominik, Z.; Jonah, T.; Sroufe, R. Drivers of sustainable supply chain management: Practices to alignment with unsustainable development goals. Int. J. Qual. Res. 2019, 14, 219–236. [Google Scholar]
- Rosati, F.; Faria, L. Addressing the SDGs in sustainability reports: The relationship with institutional factors. J. Clean. Prod. 2019, 215, 1312–1326. [Google Scholar] [CrossRef]
- Fonseca, L.M.; Domingues, J.P.; Pereira, M.T.; Martins, F.F.; Zimon, D. Assessment of circular economy within portuguese organizations. Sustainability 2018, 10, 2521. [Google Scholar] [CrossRef] [Green Version]
- Chalupnik, M.J.; Eckert, C.M.; Clarkson, P.J. Modelling design processes to improve robustness. In Proceedings of the 6th Integrated Product Development Workshop Proc., IPD 2006, Schonebeck/Bad Salzelmen b., Magdeburg, Germany, 18–20 October 2006. [Google Scholar]
- Taguchi, G.; Clausing, D. Robust quality. Harv. Bus. Rev. 1990, 68, 65–75. [Google Scholar]
- Taguchi, G.; Elsayed, E.A. Quality Engineering in Production Systems; Mcgraw-Hill College: New York, NY, USA, 1988. [Google Scholar]
- Rust, R.T.; Zahorik, A.J.; Keiningham, T.L. Return on quality (ROQ): Making service quality financially accountable. J. Mark. 1995, 59, 58–70. [Google Scholar] [CrossRef]
- Longenecker, J.G.; Moore, C.W.; Palich, L.E.; Petty, J.W. Small Business Management: An Entrepreneurial Emphasis; Cengage Learning: Boston, MA, USA, 2005. [Google Scholar]
- Tatikonda, M.V.; Montoya-Weiss, M.M. Integrating operations and marketing perspectives of product innovation: The influence of organizational process factors and capabilities on development performance. Manag. Sci. 2001, 47, 151–172. [Google Scholar] [CrossRef]
- Ulrich, K.T.; Eppinger, S.D. Product Design and Development; McGraw-Hill: New York, NY, USA, 2001. [Google Scholar]
- Hamilton, B.A. New Product Management for the 1980′s; Booz, Allen & Hamilton, Inc.: New York, NY, USA, 1982. [Google Scholar]
- Bassler, D.; Oehmen, J.; Seering, W.P.; Ben-Daya, M. A comparison of the integration of risk management principles in product development approaches. In Proceedings of the International Conference on Engineering Design Proc., ICED 2011, Copenhagen, Denmark, 15–18 August 2011. [Google Scholar]
- Mu, J.; Peng, G.; Maclachlan, D.L. Effect of risk management strategy on NPD performance. Technovation 2009, 29, 170–180. [Google Scholar] [CrossRef]
- Raz, T.; Shenhar, A.J.; Dvir, D. Risk management, project success, and technological uncertainty. R&D Manag. 2002, 32, 101–109. [Google Scholar]
- Tang, C.S. Perspectives in supply chain risk management. Int. J. Prod. Econ. 2006, 103, 451–488. [Google Scholar] [CrossRef]
- Olechowski, A.; Oehmen, J.; Seering, W.; Ben-Daya, M. Characteristics of successful risk management in product design. In Proceedings of the International Design Conference, Design, Dubrovnik, Croatia, 21–24 May 2012. [Google Scholar]
- International Organization for Standardization. ISO Guide 73:2009—Risk Management—Vocabulary; International Organization for Standardization: Geneva, Switzerland, 2009. [Google Scholar]
- Oehmen, J.; Rebentisch, E. Risk Management in Lean PD, Lean Advancement Initiative; Massachusetts Institute of Technology: Cambridge, MA, USA, 2010. [Google Scholar]
- Cai, L.; Yu, X.; Liu, Q.; Nguyen, B. Radical innovation, market orientation, and risk–taking in chinese new ventures: An exploratory study. Int. J. Technol. Manag. 2015, 67, 47–76. [Google Scholar] [CrossRef]
- Bayus, B.L. Speed-to-market and new product performance trade-offs. J. Prod. Innov. Manag. 1997, 14, 485–497. [Google Scholar] [CrossRef]
- Clark, K.B.; Fujimoto, T. Product development and competitiveness. J. Jpn. Int. Econ. 1992, 6, 101–143. [Google Scholar] [CrossRef]
- Cooper, R.G. Winning at New Products; Addison-Wesley: New York, NY, USA, 2001. [Google Scholar]
- Cooper, R.G.; Edgett, S.J.; Kleinschmidt, E.J. Benchmarking NPD best practices II. Res. Technol. Manag. 2004, 47, 50–59. [Google Scholar] [CrossRef]
- Barney, J. Firm resources and sustained competitive advantage. J. Manag. 1991, 17, 99–120. [Google Scholar] [CrossRef]
- Paladino, A. Investigating the drivers of innovation and new product success: A comparison of strategic orientations. J. Prod. Innov. Manag. 2007, 24, 534–553. [Google Scholar] [CrossRef]
- Murmura, F.; Bravi, L.; Santos, G. Sustainable process and product innovation in the eyewear sector: The role of Industry 4.0 enabling technologies. Sustainability 2021, 13, 365. [Google Scholar] [CrossRef]
- Chatzikomis, C.I.; Spentzas, K.N. Comparison of a vehicle equipped with electronic stability control (ESC) to a vehicle with four wheel steering (4WS). Forsch Ing. 2014, 78, 13–25. [Google Scholar] [CrossRef]
- Provatidis, C.G.; Venetsanos, D.T. Cost minimization of 2D continuum structures under stress constraints by increasing commonality in their skeletal equivalents. Forsch Ing. 2006, 70, 159–169. [Google Scholar] [CrossRef]
- Myers, S.; Marquis, D.G. Successful Industrial Innovations: A Study of Factors Underlying Innovation in Selected Firms; National Science Foundation: Alexandria, VA, USA, 1969. [Google Scholar]
- Brown, S.L.; Eisenhardt, K.M. Product development: Past research, present findings, and future directions. Acad. Manag. Rev. 1995, 20, 343–378. [Google Scholar] [CrossRef] [Green Version]
- Klaus, E.; Kiewert, A.; Lindemann, U. Cost-Effective Design; Springer: Berlin, Germany, 2007. [Google Scholar]
- Hundal, M. Systematic Mechanical Designing: A Cost and Management Perspective: Cost-Based Mechanical Design & Product Development; ASME Books: New York, NY, USA, 1997. [Google Scholar]
- Cooper, R.; Slagmulder, R. Target Costing and Value Engineering; Productivity Press: New York, NY, USA, 1997. [Google Scholar]
- Dvořáková, L.; Kronych, J.; Malá, A. Cash flow management as a tool for corporate processes optimization. Smart Sci. 2018, 6, 330–336. [Google Scholar] [CrossRef]
- Baughey, K. The future of automotive design & development: 3D for all. SAE Int. J. Mater. Manuf. 2009, 2, 258–264. [Google Scholar]
- Beesley, A. Time compression in the supply chain. Ind. Manag. Data Syst. 1996, 96, 12–16. [Google Scholar] [CrossRef]
- Cohen, M.A.; Eliashberg, J.; Ho, T. New product development: The performance and time-to-market trade-off. J. Strateg. Res. 1996, 42, 173–186. [Google Scholar]
- Chen, J.; Reilly, R.R.; Lynn, G.S. The impacts of speed-to-market on new product success: The moderating effects of uncertainty. Trans. Eng. Manag. 2005, 52, 199–212. [Google Scholar] [CrossRef]
- Liou, F.; Slattery, K.; Kinsella, M.; Newkirk, J.; Chou, H.; Landers, R. Applications of a hybrid manufacturing process for fabrication of metallic structures. Rapid Prototyp. J. 2007, 13, 236–244. [Google Scholar] [CrossRef]
- Eppinger, S.D. Innovation at the speed of information. Harv. Bus. Rev. 2001, 79, 149–158. [Google Scholar]
- Imai, K.; Ikujiro, N.; Takeuchi, H. Managing the new product development process: How Japanese learn and unlearn. In The Uneasy Alliance: Managing the Productivity-Technology Dilemma; Hayes, R.H., Clark, K.L., Eds.; Harvard Business School Press: Boston, MA, USA, 1985; pp. 337–375. [Google Scholar]
- Terninko, J.; Zusman, A.; Zlotin, B. Systematic Innovation: An Introduction to TRIZ (Theory of Inventive Problem Solving); CRC Press: Boca Raton, FL, USA, 1998. [Google Scholar]
- Eris, O. Effective Inquiry for Innovative Engineering Design: From Basic Principles to Applications; Springer: Berlin, Germany, 2004. [Google Scholar]
- Guenov, M.D.; Barker, S.G. Application of axiomatic design and design structure matrix to the decomposition of engineering systems. Syst. Eng. 2005, 8, 29–40. [Google Scholar] [CrossRef]
- Hong, E.; Park, G. Modular design method based on simultaneous consideration of physical and functional relationships in the conceptual design stage. J. Mech. Sci. Technol. 2014, 28, 223–235. [Google Scholar] [CrossRef]
- Hardt, M.; Stryk, O.; Wollherr, D.; Buss, M. Design of an autonomous fast-walking humanoid robot. In Proceedings of the International Conference on Climbing and Walking Robots, Paris, France, 25–27 September 2000; pp. 391–398. [Google Scholar]
- Castillo, O.; Trujillo, L.; Melin, P. Multiple objective genetic algorithms for path-planning optimization in autonomous mobile robots. Soft Comput. 2007, 11, 269–279. [Google Scholar] [CrossRef]
- Bloch, P.H. Seeking the ideal form: Product design and consumer response. J. Mark. 1995, 59, 16–30. [Google Scholar] [CrossRef] [Green Version]
- Nishiguchi, T. Managing Product Development; Oxford University Press: Oxford, UK, 1996. [Google Scholar]
- Allen, T.J. Managing the Flow of Technology; MIT Press: Cambridge, MA, USA, 1977. [Google Scholar]
- Yassine, A.; Joglekar, N.; Braha, D.; Eppinger, S.; Whitney, D. Information hiding in product development: The design churn effect. Res. Eng. Des. 2003, 14, 145–161. [Google Scholar] [CrossRef]
- Maier, A.M.; Kreimeyer, M.; Hepperle, C.; Eckert, C.M.; Lindemann, U.; Clarkson, P.J. Exploration of correlations between factors influencing communication in complex product development. Concurr. Eng. 2008, 16, 37–59. [Google Scholar] [CrossRef] [Green Version]
- Pike, S.; Roos, G.; Marr, B. Strategic management of intangible assets and value drivers in R&D organizations. R&D Manag. 2005, 35, 111–124. [Google Scholar]
- Nonaka, I.; Takeuchi, H. The Knowledge-Creating Company: How Japanese Companies Create the Dynamics of Innovation; Oxford University Press: Oxford, UK, 1995. [Google Scholar]
- Baxter, D.; Roy, R.; Doultsinou, A.; Gao, J.; Kalta, M. A knowledge management framework to support product-service systems design. Int. J. Comput. Integr. Manuf. 2009, 22, 1073–1088. [Google Scholar] [CrossRef] [Green Version]
- Huang, G.O. Design for X: Concurrent Engineering Imperatives; Springer: Berlin, Germany, 1996. [Google Scholar]
- Cross, N. Developments in Design Methodology; John Wiley and Sons Limited: Hoboken, NJ, USA, 1984. [Google Scholar]
- Elmoselhy, S.A.M. Empirically investigating a hybrid lean-agile design paradigm for mobile robots. J. Intell. Syst. 2014, 24, 117–134. [Google Scholar] [CrossRef] [Green Version]
- Elmoselhy, S.A.M. Mobile robots design guideline based on an empirical study of the mobile robots design process. Int. Rev. Mech. Eng. 2014, 8, 489–494. [Google Scholar]
- Elmoselhy, S.A. Computer aided manufacturing for mass-production of non-conventional shapes made of the alloying of a heterogeneous composite metallic glass matrix with nano-meter sized elements. Adv. Mech. Eng. 2015, 7. [Google Scholar] [CrossRef] [Green Version]
- Keller, G. Statistics for Management and Economics, 9th ed.; Cengage Learning: Mason, OH, USA, 2012. [Google Scholar]
- Souitaris, V. Research on the determinants of technological innovation: A contingency approach. Int. J. Innov. Manag. 1999, 3, 287–305. [Google Scholar] [CrossRef]
- Wu, W.W. Choosing knowledge management strategies by using a combined ANP and DEMATEL approach. Expert Syst. Appl. 2008, 35, 828–835. [Google Scholar] [CrossRef]
- Elmoselhy, S.A.M. Design for Profitability: Guidelines to Cost Effectively Manage the Development Process of Complex Products; CRC Press: Boca Raton, FL, USA, 2015. [Google Scholar]
- Hofer-alfeis, J. Knowledge management solutions for the leaving expert issue. J. Knowl. Manag. 2008, 12, 44–54. [Google Scholar] [CrossRef]
- Wiig, K.M. Knowledge management: An introduction and perspective. J. Knowl. Manag. 1997, 1, 6–14. [Google Scholar] [CrossRef]
- Haanes, K.; Lowendhal, B. The unit of activity: Towards an alternative to the theories of the firm. In Strategy, Structure and Style; Thomas, H., O’Neal, D., Ghertman, M., Eds.; John Wiley & Sons: Hoboken, NJ, USA, 1997; pp. 201–218. [Google Scholar]
- Petrash, G. Dow’s journey to a knowledge value management culture. Eur. Manag. J. 1996, 14, 365–373. [Google Scholar] [CrossRef]
- Sveiby, K.E. A knowledge based theory of the firm to guide strategy formulation. J. Intellect. Cap. 2001, 2, 344–358. [Google Scholar] [CrossRef] [Green Version]
- Davenport, T.H.; Prusak, L. Working Knowledge: How Organizations Manage What They Know; Harvard Business School Press: Boston, MA, USA, 1998. [Google Scholar]
- Grant, R.M. The resource-based theory of competitive advantage: Implication for strategy formulation. Calif. Manag. J. 1991, 33, 114–135. [Google Scholar] [CrossRef] [Green Version]
- Leonard-Barton, D. Wellsprings of Knowledge; Harvard Business School Press: Boston, MA, USA, 1995. [Google Scholar]
- Shani, A.B.; Sena, J.A.; Olin, T. Knowledge management and new product development: A study of two companies. Eur. J. Innov. Manag. 2003, 6, 137–149. [Google Scholar] [CrossRef]
- Kline, S.; Rosemberg, N. An overview of innovation. In The Positive Sum Strategy; Landau, R., Rosemberg, N., Eds.; National Academic Press: Washington, WA, USA, 1986. [Google Scholar]
- Verona, G. A resource based view of product development. Acad. Manag. Rev. 1999, 24, 132–142. [Google Scholar] [CrossRef]
- Ding, H.; Peters, L.S. Inter-firm knowledge management practices for technology and new product development in discontinuous innovation. Int. J. Technol. Manag. 2000, 20, 588–600. [Google Scholar] [CrossRef]
- O’Donnell, K.P.; Chen, X. Temperature dependence of semiconductor band gaps. Appl. Phys. Lett. 1991, 58, 2924. [Google Scholar] [CrossRef] [Green Version]
- Sommer, S.C.; Loch, C.H.; Pich, M.T. Project Risk Management in New Product Development. In The Handbook of New Product Development Management; Loch, C.H., Kavadias, S., Eds.; Elsevier: Oxford, UK, 2008; pp. 439–465. [Google Scholar]
- Ahmadi, R.; Wang, R.H. Managing development risk in product design processes. Oper. Res. 1999, 47, 235–246. [Google Scholar] [CrossRef]
- Thomas, E.J. Supplier involvement in new product development and innovation: Taking stock and looking to the future. J. Purch. Supply Manag. 2009, 15, 187–197. [Google Scholar]
- Oehmen, J.; Ben-Daya, M.; Seering, W.; Al-Salamah, M. Risk management in product design: Current state, conceptual model and future research. In Proceedings of the ASME 2010 International Design Engineering Technical Conferences and Computers and Information in Engineering Conference, Montreal, QC, Canada, 15–18 August 2010; pp. 1033–1041. [Google Scholar]
- Ducrée, J. Efficient development of integrated Lab-On-A-Chip systems featuring operational robustness and manufacturability. Micromachines 2019, 10, 886. [Google Scholar] [CrossRef] [PubMed] [Green Version]
- Elmoselhy, S.A.M. Hybrid lean-agile manufacturing system technical facet in automotive sector. J. Manuf. Syst. 2013, 32, 488–509. [Google Scholar] [CrossRef]
- Elmoselhy, S.A.M. Hybrid lean-agile manufacturing system strategic facet in automotive sector. SAE Trans. Int. J. Mater. Manuf. 2015, 8, 153–171. [Google Scholar] [CrossRef]
- Elmoselhy, S.A.M. Implementing the hybrid lean-agile manufacturing system strategically in automotive sector. SAE Trans. Int. J. Mater. Manuf. 2015, 8, 592–601. [Google Scholar] [CrossRef]
Figure 1.
Block diagram describing the research approach.

Figure 2.
Product performance versus product design companies’ profitability.

Figure 3.
Loss of diminishing return on product performance improvement.


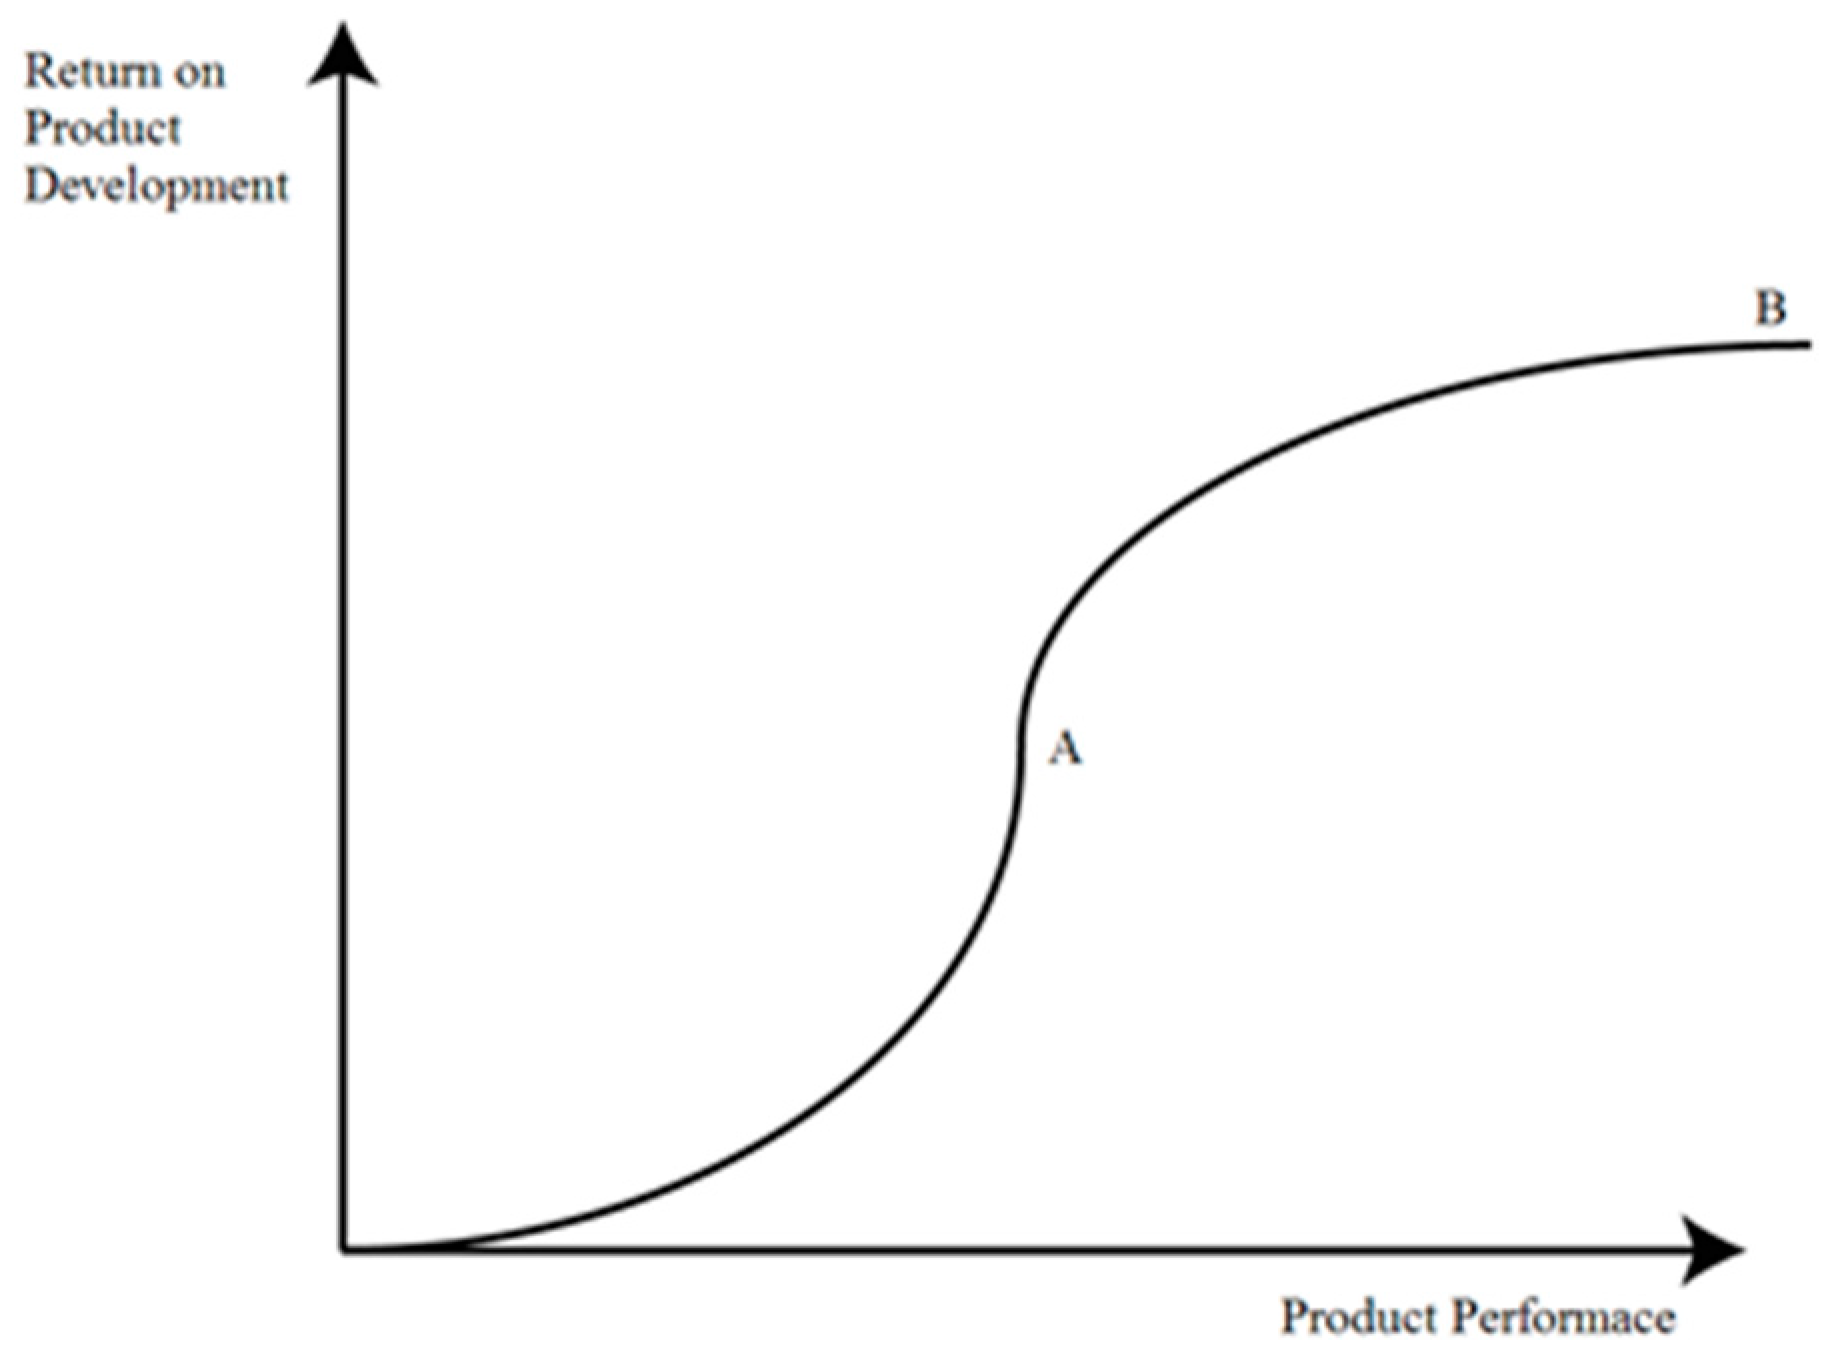
Table 1.
The number of validly answered questionnaires received from key manufacturing sectors in industry [15].
Table 1.
The number of validly answered questionnaires received from key manufacturing sectors in industry [15].
| Industrial Sector | Key Manufacturing Industry within the Sector | Number of Validly Answered Questionnaires Received |
|---|---|---|
| Food | Food machinery | 8 |
| Machinery | Mechanical | 34 |
| Energy | Automotive | 26 |
| Electrical/Electronics | Telecommunications | 29 |
| Pharmaceutical/Bio-materials | Pharmaceutical/Bio-materials | 15 |
| Total | 112 |
Table 2.
Strengths and weaknesses of the strategic, resource-based and sustainability-oriented approach.
Table 2.
Strengths and weaknesses of the strategic, resource-based and sustainability-oriented approach.
| Strengths | Weaknesses |
|---|---|
| 1. It addresses the strategic, resource-based, and sustainability aspects of New Product Development (NPD). | 1. It does not take into account the knowledge-based aspect of NPD. |
| 2. It is relatively easy to implement. | 2. It increases marketing risk, such as being late for the introduction of the product to targeted market and demand. |
| 3. It reduces the environmental risk. |
Table 3.
Strengths and weaknesses of the cost-oriented approach.
| Strengths | Weaknesses |
|---|---|
| 1. It addresses the cost-related aspect of NPD. | 1. It does not take into account the other aspects of NPD. |
| 2. It is relatively easy to implement. | 2. It increases marketing risk, such as being late for the introduction of the product to targeted market and demand, |
| 3. It reduces business risk with respect to financial aspects and cash flow. | 3. It increases technical risk, such as obsolescence of technology and difficulty of upgrading. |
Table 4.
Strengths and weaknesses of the time duration-oriented approach.
| Strengths | Weaknesses |
|---|---|
| 1. It addresses the time duration aspect. | 1. It does not take into account the other aspects of NPD. |
| 2. It is relatively easy to implement. | 2. It increases business risk with respect to financial aspects and cash flow. |
| 3. It reduces marketing risk, such as being late for the introduction of the product to targeted market and demand. |
Table 5.
Strengths and weaknesses of the technical and problem solving approach.
| Strengths | Weaknesses |
|---|---|
| 1. It addresses the technical & problem solving aspect of NPD. | 1. It does not take into account the other aspects of NPD. |
| 2. It is relatively easy to implement. | 2. It increases business risk with respect to financial aspects and cash flow. |
| 3. It reduces technical risk, such as the difficulty of upgrading. | 3. It increases marketing risk, such as being late for the introduction of the product to targeted market and demand. |
| 4. It facilitates the market success of the firm due to product quality. |
Table 6.
Strengths and weaknesses of the social science & knowledge-based approach.
| Strengths | Weaknesses |
|---|---|
| 1. It addresses the social science & knowledge-based aspect of NPD. | 1. It does not take into account the other aspects of NPD. |
| 2. It is relatively easy to implement. | 2. It increases business risk with respect to financial aspects and cash flow. |
| 3. It facilitates the market success of the firm based on customer focus. | 3. It increases marketing risk, such as being late for the introduction of the product to targeted market and demand. |
Table 7.
Strengths and weaknesses of the hybrid approach.
| Strengths | Weaknesses |
|---|---|
| 1. It addresses all the aspects of NPD. | 1. It needs multi-talented and knowledgeable people for the management of its implementation. |
| 2. It strikes an optimum balance among all the aspects of NPD. | |
| 3. The hybrid approach is the best approach to minimize the overall risk and thus to streamline the implementation of the proposed action plan. | |
| 4. It facilitates the market success of the firm based on both product quality and customer focus. |
Table 8.
Descriptive characteristics of the five companies [16].
Table 8.
Descriptive characteristics of the five companies [16].
| Company | Year of Establishment | Industry | Number of Employees | Turnover per Year |
|---|---|---|---|---|
| Company I | 1994 | Food machinery | 40 | <2 million Euro |
| Company II | 1976 | Mechanical | 143 | 10–25 million Euro |
| Company III | 2007 | Automotive | 142 | 10–25 million Euro |
| Company IV | 2000 | Telecommunications | 7 | <2 million Euro |
| Company V | 1997 | Pharmaceutical | 146 | <2 million Euro |
Table 9.
The level of adoption of the strategic, resource-based and sustainability-oriented approach.
Table 9.
The level of adoption of the strategic, resource-based and sustainability-oriented approach.
| Aspect | Practice | Company I | Company II | Company III | Company IV | Company V |
|---|---|---|---|---|---|---|
| Strategic, Resource-based and Sustainability-oriented Aspect | Setting and Implementing R & D Strategy | 3.8 | 3.3 | 3.2 | 2.5 | 3 |
| Conformance to specifications | 5 | 5 | 5 | 4 | 3 | |
| Novelty | 4 | 5 | 4 | 2 | 2 | |
| Early market entrants | 4 | 5 | 3 | 2 | 3 | |
| Mean | 4.2 | 4.6 | 3.8 | 2.6 | 2.75 |
Table 10.
The level of adoption of the cost-oriented approach.
| Aspect | Practice | Company I | Company II | Company III | Company IV | Company V |
|---|---|---|---|---|---|---|
| Cost-oriented Aspect | Employees flexibility and multi-skilling | 5 | 5 | 5 | 3 | 4 |
| Financial performance | 4.2 | 4 | 3.7 | 2.3 | 2 | |
| Mean | 4.6 | 4.5 | 4.4 | 2.7 | 3 |
Table 11.
The level of adoption of the time duration-oriented approach.
| Aspect | Practice | Company I | Company II | Company III | Company IV | Company V |
|---|---|---|---|---|---|---|
| Speed of PD | 4 | 4 | 4 | 3 | 2 | |
| Number of new products | 5 | 5 | 4 | 2 | 2 | |
| Mean | 4.5 | 4.5 | 4 | 2.5 | 2 |
Table 12.
The level of adoption of the technical and problem solving approach.
| Aspect | Practice | Company I | Company II | Company III | Company IV | Company V |
|---|---|---|---|---|---|---|
| Technical and Problem Solving Aspect | Partnering with suppliers to identify needs and requirements | 5 | 5 | 5 | 4 | 3 |
| Involve customers in PDevPs | 4 | 5 | 5 | 2 | 3 | |
| Performance of products | 5 | 5 | 4 | 3 | 3 | |
| Mean | 4.7 | 5 | 4.7 | 3 | 3 |
Table 13.
The level of adoption of the social science and knowledge-based approach.
| Aspect | Practice | Company I | Company II | Company III | Company IV | Company V |
|---|---|---|---|---|---|---|
| Social Science and Knowledge-based Aspect | Up-to-date data and information are readily available | 4 | 4 | 3 | 4 | 3 |
| Implementing effective reporting practices | 4 | 4 | 4 | 3 | 2 | |
| “Fool-proof” process design | 5 | 5 | 4 | 3 | 3 | |
| Quality work environment | 4 | 4 | 4 | 3 | 2 | |
| Maintain a close relationship with customers | 5 | 4 | 4 | 3 | 2 | |
| Involving employees in R&D decision making | 3 | 4 | 4 | 4 | 5 | |
| Use of latest technologies | 4 | 5 | 4 | 2 | 3 | |
| Mean | 4.1 | 4.3 | 3.9 | 3.1 | 2.8 |
Table 14.
The interval variable representing the average of the adoption of the approaches presented in Table 8, Table 9, Table 10, Table 11 and Table 12.
| xi | |
|---|---|
| Company I | (4.2 + 4.6 + 4.5 + 4.7 + 4.1)/5 = 4.42 |
| Company II | (4.6 + 4.5 + 4.5 + 5 + 4.3)/5 = 4.58 |
| Company III | (3.8 + 4.4 + 4 + 4.7 + 3.9)/5 = 4.16 |
| Company IV | (2.6 + 2.7 + 2.5 + 3 + 3.1)/5 = 2.76 |
| Company V | (2.75 + 3 + 2 + 3 + 2.8)/5 = 2.71 |
| = 3.726 |
Publisher’s Note: MDPI stays neutral with regard to jurisdictional claims in published maps and institutional affiliations. |
© 2021 by the authors. Licensee MDPI, Basel, Switzerland. This article is an open access article distributed under the terms and conditions of the Creative Commons Attribution (CC BY) license (https://creativecommons.org/licenses/by/4.0/).
Share and Cite
MDPI and ACS Style
Almoslehy, S.A.M.; Alkahtani, M.S. Key Approaches, Risks, and Product Performance in Managing the Development Process of Complex Products Sustainably. Sustainability 2021, 13, 4727. https://0-doi-org.brum.beds.ac.uk/10.3390/su13094727
AMA Style
Almoslehy SAM, Alkahtani MS. Key Approaches, Risks, and Product Performance in Managing the Development Process of Complex Products Sustainably. Sustainability. 2021; 13(9):4727. https://0-doi-org.brum.beds.ac.uk/10.3390/su13094727
Chicago/Turabian StyleAlmoslehy, Salah Ahmed Mohamed, and Mohammed Saad Alkahtani. 2021. "Key Approaches, Risks, and Product Performance in Managing the Development Process of Complex Products Sustainably" Sustainability 13, no. 9: 4727. https://0-doi-org.brum.beds.ac.uk/10.3390/su13094727
Note that from the first issue of 2016, this journal uses article numbers instead of page numbers. See further details here.