
Incentive Contracts for Sustainable Growth of Small or Medium-Sized Enterprise


1
College of Economics, Sungkyunkwan University, Seoul 03063, Korea
2
Financial Supervisory Service, Seoul 07321, Korea
*
Author to whom correspondence should be addressed.
Sustainability 2021, 13(9), 4964; https://0-doi-org.brum.beds.ac.uk/10.3390/su13094964
Submission received: 16 March 2021
/
Revised: 26 April 2021
/
Accepted: 26 April 2021
/
Published: 28 April 2021
(This article belongs to the Special Issue The Future and Sustainability of Financial Markets)
Abstract
:This study analyzes incentive contracts in public procurement supply chains using a game-theoretic approach. Specifically, we compare a structure in which the host company is a large enterprise and the partner company is a small or medium-sized enterprise (SME) to a structure in which the host is an SME and the partner is a large enterprise. For each structure, we examine whether an incentive contract improves supply chain performance and confirm that the performance improvement effect is greater when the host company is an SME. Our analysis has several policy implications. SMEs are less likely to be selected as host companies for large-scale procurement projects, limiting their growth opportunities. Thus, to enable SMEs’ sustainable growth through large-scale procurement projects, the governments can allocate a portion of public procurement to SMEs. The introduction of incentive contracts elicits sustainable cooperation from large companies when an SME is the host company in a public procurement supply chain.
Keywords:
corporate social responsibility; creating shared value; incentive contract; public procurement; supply chain; sustainable growthJEL Classification:
D4; H5; L1; M11. Introduction
A supply chain’s structure significantly impacts the participating companies’ interests. In the case of a large-scale procurement project, being selected as a host company is more helpful to a company’s growth than participating as a partner company is. However, in large-scale businesses, large companies are generally selected as host companies for procurement projects because large companies, unlike small and medium-sized enterprises (SMEs), have sufficient production facilities and materials and maintain high reputations. Furthermore, because prior experience being selected as a procurement company is used as an evaluation criterion, small start-ups face limitations to their growth. Thus, SMEs have limited growth opportunities, even if they have innovative technologies. To increase overall social welfare, SMEs should grow sustainably. To promote this growth, it is necessary to facilitate SMEs’ selection as procurement companies. To this end, the U.S. and Korea are implementing policies that entrust a portion of public procurement to SMEs. The U.S. has introduced a mentor-protege program to achieve this goal. An example is SMEs signing procurement contracts with the government directly in the public procurement market and then subcontracting some of them to large corporations. In Korea, this program has been transformed into a public procurement win-win cooperation support program. In particular, the Korean program, unlike the American program, focuses on the joint growth of SMEs and large corporations. The Korean program promotes technological innovation through sustainable cooperation between companies. In addition, the Korean program introduces elements of social contributions, such as technology and manufacturing support through mentoring programs between large and small enterprises.
These programs can be viewed as a creating shared value (CSV) strategy that facilitates SMEs’ sustainable growth using large companies’ technologies and manufacturing facilities. As the impact of corporate decision-making on society as a whole has recently grown, a consensus has arisen that companies should consider both their social responsibility and their economic value. As a result, an active movement aims to promote social contribution activities. CSV has emerged as an alternative that addresses the limitations of corporate social responsibility (CSR) [1]. CSR refers to enterprises’ social activities and implies that companies not only play their economic roles but also strive to create social value. Furthermore, CSR is a business strategy by which a company promotes a positive image of itself through non-profit activities, such as charity, environmental protection, and donation activities, allowing it to earn greater long-term profits. CSV is a new business strategy that aims to increase corporate profits by creating both economic and social values, whereas CSR is a type of charitable act [2].
However, it is unclear whether a large corporation with greater bargaining power will provide a stable supply of intermediate goods to create shared value when an SME is a host procurement company [3]. A large corporation is unlikely to make much effort to stably provide intermediate goods for its own benefit. The programs’ decision-making structure is decentralized because SMEs sign procurement contracts with public institutions and subcontract their contracts to large companies. Within this decision-making structure, large companies and SMEs both aim to maximize their own profits. A decentralized decision-making structure negatively affects utility across the entire supply chain [4]. Thus, large companies may supply low-quality intermediate goods and may fail to transfer the necessary technologies or support manufacturing. This study, therefore, reviews incentive contracts as a potential solution to this problem. An incentive contract can improve supply chain efficiency by enabling final goods producers to provide incentives to intermediate goods producers. If it is confirmed that incentive contracts induce large companies to help SMEs, adding an incentive contract to the policy allocating public procurement to SMEs could promote the sustainable growth of SMEs.
Previous analyses of incentive contracts seemingly do not consider the sizes of the final producers and intermediate producers. However, SMEs are selected as procurement companies by the support of government policy. We analyze the effects of introducing incentive contracts depending on the supply chain structure (i.e., the host-partner relationship considering firm sizes). Unlike previous studies, our analysis suggests that the effects of incentive contracts may vary depending on this structure. In this study, we define the performance score of the entire supply chain and the profit function of each company and derive an equilibrium based on a game theory. The entire supply chain’s performance score affects the final goods producer’s income. The market situation can be defined in different ways depending on the relationships between certain parameters, such as cost and sales income, and we derive a different equilibrium for each market situation. We compare the results for different market conditions by dividing them into cases in which large corporations produce final goods and SMEs supply intermediate goods and vice versa. The analysis results show that when SMEs produce final goods and large enterprises supply intermediate goods, the entire supply chain’s performance score is significantly improved when performance fees are introduced. In the opposite case, however, the impact on performance is lower. These results mean that the performance-sharing system is a way to increase the efficiency of public procurement policies favoring SMEs. Previous studies show that supply chain companies engage in inefficient production activities and analyze revenue-sharing and profit-sharing plans, among others, as countermeasures to this inefficiency [5,6]. However, these plans do not provide effective action plans for large companies; such companies have no incentive to include performance-sharing systems for SMEs, which lack negotiation power and technology, in their contracts. Thus, this study aims to analyze the behavior principles of large companies and SMEs under decentralized decision-making to identify problems in the supply chain and suggest specific solutions, including a performance-sharing system.
The remainder of this paper is organized as follows. Section 2 reviews the previous literature. Section 3 presents the model design for this study based on a game-theoretic model. Section 4 derives the equilibria according to the presence or absence of an incentive contract based on the model designed in Section 3. This section also compares the effects of incentive contracts on supply chain performance for different supply chain structures. Section 5 presents policy implications based on our results. Section 6 summarizes the study and presents conclusions.
2. Literature Review
Social demand for CSR and CSV is increasing, but concerns that they may negatively impact companies’ profitability have been raised. Previous studies show that companies’ CSR activities increase both their value and their costs [7,8]. In contrast, CSV allows businesses to pursue economic and social value simultaneously [9]. CSR is primarily a type of charitable act, whereas CSV is a new business strategy that aims to increase corporate profits by creating both economic and social value. CSV evolved from CSR and can lead to mutual growth in that the CSV not only generates profits and but also addresses the local community’s social and economic problems [10]. This mutual growth induces companies to participate. Previous studies of CSR and CSV investigate the effects of CSR activities on companies [11,12,13,14,15] and companies’ motivations to participate in CSR [16,17,18,19,20,21]. Companies that actively engage in CSR and CSV positively affect the efficiency of the supply chain [22,23]. Furthermore, cooperation between large and small enterprises can significantly impact technological innovation [24,25].
The SME-led public procurements in Korea and the U.S. providing public procurement opportunities to SMEs are also a kind of CSV activity. However, in public procurement, if an SME takes over the host company role with a large company as a partner, the large company may not sufficiently support the SME [26]. Thus, a contract that provides incentives to partner companies may be appropriate in this setting. Prior research on incentive contracts mainly analyzes the effects of incentive contract models and asymmetric information on supply chain efficiency. Prior studies have developed several incentive contract models. Under a revenue-sharing contract, the assembler pays a share of the final product’s sales revenue to the supplier as an incentive when the supplier charges for intermediate goods [27]. Under a profit-sharing contract, the assembler pays a share of the profits, calculated by subtracting costs from the final product’s sales revenue to the supplier providing the intermediate goods [28,29]. Shao and Ji (2006) [30] show that the competitive conditions in the product market influence the use of profit-sharing contracts. Baiman, Fischer, and Rajan (2000) [31] and Chen and Jeter (2008) [4] find that information asymmetry affects supply chain efficiency; thus, efficiency improves as the incentive includes more shared information. However, these studies do not consider whether the effects of incentive contracts differ according to the host company’s size. Accordingly, this study uses a game-theoretic approach to determine whether these effects change depending on the size of the host company.
3. Model Design
This study expands the game-theoretic models of Jo and Ryu (2020), Sloev and Nastych (2016), and Ottaviano and Thisse (2011) [32,33,34] to analyze the behavior principles of companies in a supply chain. Specifically, the supply chain consists of a host company and a partner company. The host company comprehensively directs the production of the final product, and the partner company assists the host company by supporting production facilities or providing intermediate goods. We analyze two supply chain structures. In the first structure, a large company is the host company, and an SME is the partner company. In the second structure, an SME is the host company, and a large company is the partner company. We evaluate the overall improvement in supply chain performance using performance scores, consisting of innovation and stability components. Innovation refers to how innovative the product produced through the supply chain is relative to conventional products. The host company can improve innovation. Stability refers to how consistently the production facilities and intermediate goods are supplied, and it can be improved by the partner company. We define the variable representing the innovation improvement as and the variable representing the stability improvement as ; the performance score, , is given by Equation (1). In this case, is the weight given to the innovation improvement.
I and S represent the degrees to which innovation and stability, respectively, are improved, and they are calculated as one plus the value of the improvement ratio. Accordingly, they are defined in the interval (1,2). B, defined as the weighted average of I and S, also takes values in (1,2). We assume that I and S take values of either 1 or 2. However, if we instead assume that I and S can take any value within (1,2), the key conclusion remains unchanged. When B is greater, the sales revenue of the final product is greater. When the existing revenue is R and the supply chain is improved by B, the final product sales revenue is defined as RB. We make the following assumptions about the two companies’ profits in the absence of an incentive contract. First, the host company earns income equal to the sales revenue of the improved final good. The host company also incurs two costs: (i) the cost to produce the final product and (ii) the payment to the partner company for facility support and intermediate goods. The cost of producing the final product increases as the innovation improvement increases and decreases as the stability improvement increases. Defining the host company’s initial cost of production as , we assume that the production cost becomes as the supply chain improves. The payment to the partner company is , which takes a value of or , where . Thus, , the host company’s profit without an incentive contract, is given by Equation (2).
Second, the partner company earns income equal to P, which is the payment from the host company. Defining the partner company’s initial cost before any supply chain improvements as , we assume that its cost after the improvements is . Accordingly, , the partner company’s profit, is shown in Equation (3).
An incentive contract changes the payment that the host company pays to the partner company. With an incentive contract, the host company pays the partner company an additional price equal to the supply chain performance score. Thus, the two firms’ profits, in this case, are given by Equations (4) and (5).
The host company chooses I and P to maximize its profits, and the partner company chooses S to maximize its profits. We assume that the two companies make their decisions simultaneously. We organize each company’s payoffs according to their strategies, find the optimal strategy, and derive the Nash equilibrium. In this study, the initial costs, and , are parameters that reflect the companies’ characteristics. is lower when innovation is higher. Larger companies are more likely to have lower values. However, as innovative start-ups have become more common in recent years, SMEs can also have low values. is lower when the supply is more stable. In other words, a company that has sufficient production facilities and can smoothly supply intermediate goods has a low value. It is reasonable to assume that decreases in proportion to company size because larger companies are more likely to have sufficient facilities and materials. Unlike , is not usually low for SMEs.
The weight of the innovation improvement in the performance score, w, is a parameter that reflects a business’s characteristics. In the case of industries that require substantial innovation, w is expected to be high. The mentor-protege program in the U.S. primarily targets architectural projects, and architecture is relatively less affected by innovation. However, Korea’s public procurement win-win cooperation support program mainly targets innovative industries, such as IT-based industries and industries associated with the fourth industrial revolution. In this regard, Korea’s program seems to have a relatively high value of w.
4. Model Analysis
4.1. Case1: Without Incentive Contracts
If there is no incentive contract, each company’s strategy and payoffs can be summarized as in Table 1.
Table 1 shows that because , the partner company’s dominant strategy is always S = 1. When the partner company’s strategy is S = 1, the host company’s dominant strategy varies according to its initial cost. If is sufficiently small (i.e., ), then the host company’s dominant strategy is (I,P) = (2,). Conversely, if is not sufficiently small (i.e., ), then its dominant strategy is (I,P) = (1,). In other words, if the host company has sufficient innovation capability, it has an incentive to improve the innovativeness of the supply chain; otherwise, it has no such incentive. Thus, when a large company or an SME with sufficient innovation capability is the host company, supply chain performance can be improved. However, because there is no incentive contract, the partner company does not improve stability, and the host company pays lower costs. Thus, the supply chain performance is not as high without incentive contracts.
4.2. Case2: With Incentive Contracts
If there is an incentive contract, each company’s strategy and payoffs can be summarized as in Table 2.
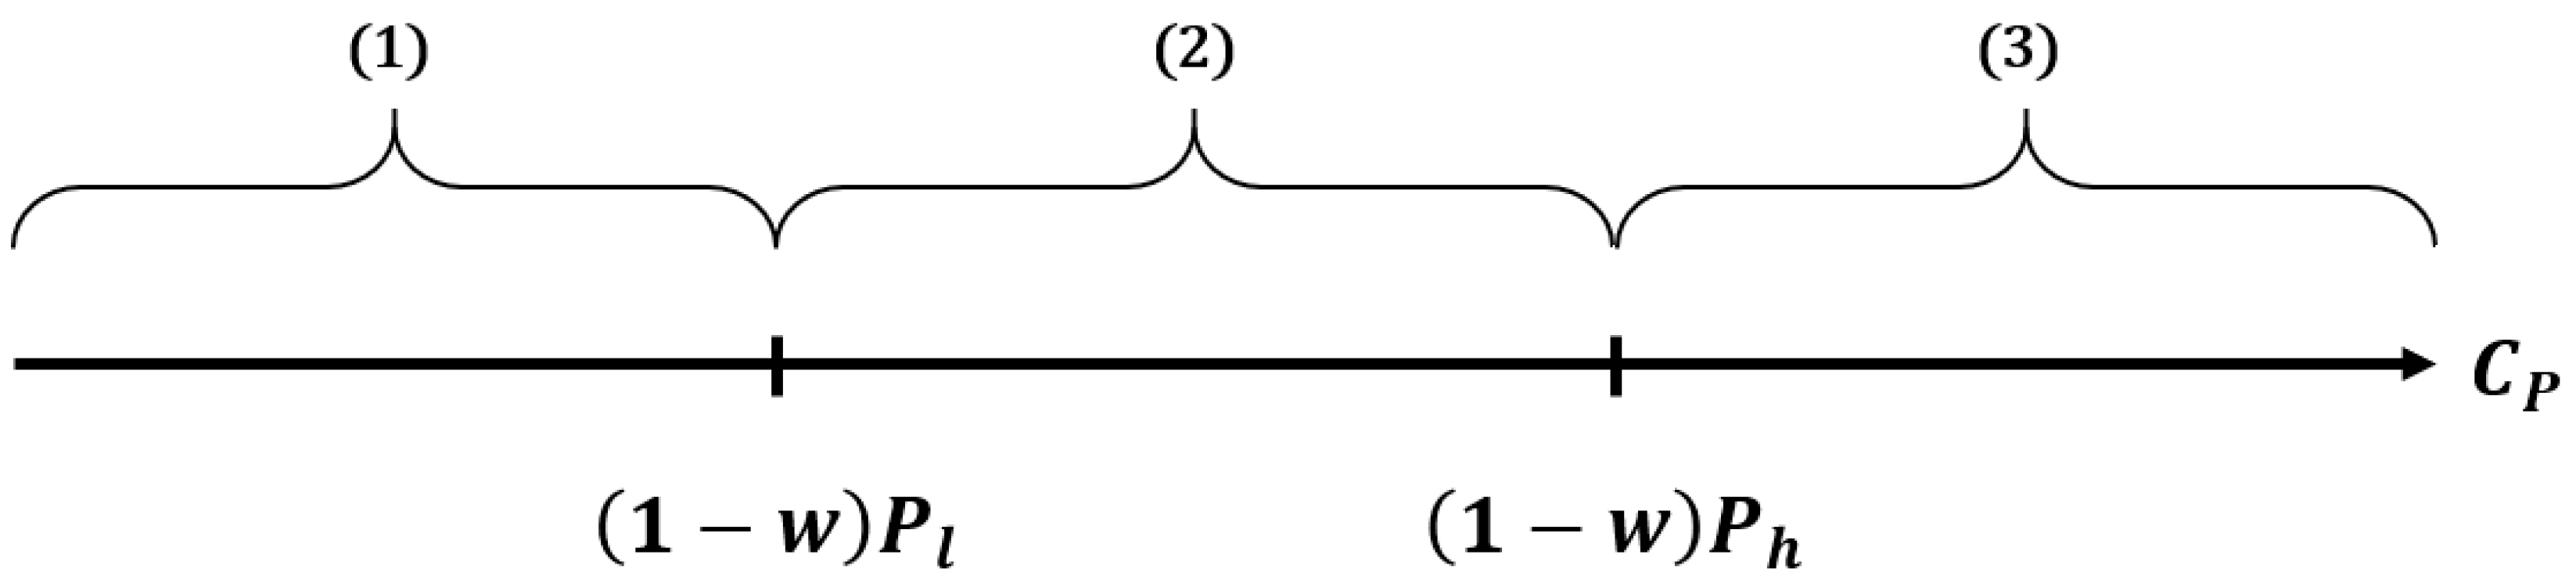
With an incentive contract, the partner company’s optimal strategy also depends on certain conditions. Figure 1 shows the dominant strategy of the partner company for different initial cost conditions.
The cost ranges can be summarized as follows.
- (1)
- : Small stability cost.
- (2)
- : Moderately low stability cost.
- (3)
- : Large stability cost.
Table 3 summarizes the partner company’s dominant strategies for each cost condition.
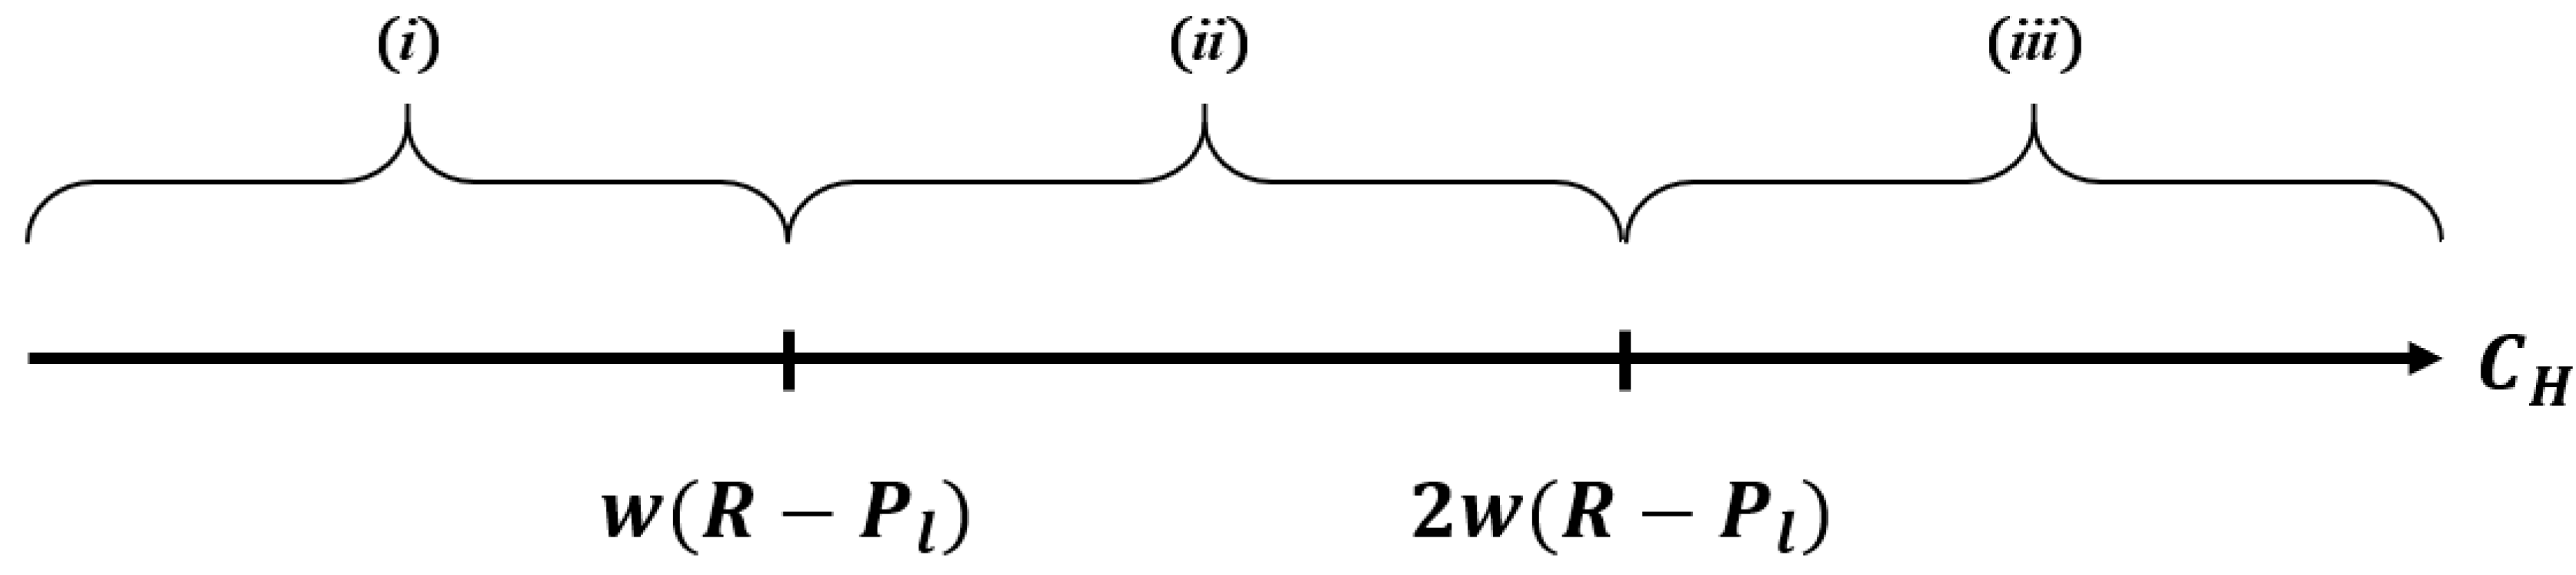
Similarly, the host company has different optimal strategies depending on the initial cost. Figure 2 shows the host company’s dominant strategy for different initial innovation costs.
The cost ranges can be summarized as follows.
- (i)
- : Small innovation cost.
- (ii)
- : Moderately low innovation cost.
- (iii)
- 2: Large innovation cost.
Table 4 summarizes the host company’s dominant strategies for each condition.
Table 5 shows the equilibria and each company’s dominant strategy according to the cost conditions.
The implications of the analytical results in this section are as follows. First, the cost paid by the host company to the partner company is always low (). In addition, the partner company does not maintain a high level of stability unless the initial cost of stability is sufficiently low. This result suggests that the partner company’s cost structure is more important to improving stability than the cost paid by the host company to the partner company is. Additionally, comparing the case with no incentive contract to the case with an incentive contract, we obtain the following results. If the host company is a large company, is sufficiently small. In this case, the equilibrium without an incentive contract is ((I,P),S) = ((2,),1). With an incentive contract, however, is likely to meet condition (i). Because the partner company is an SME, is likely to meet condition (2) or (3). Thus, the equilibrium does not change even though an incentive contract is introduced. The intuition for this result is that even if an incentive contract is offered, an SME cannot improve stability owing to its lack of capacity. Thus, if the host company is a large company, incentive contracts do not improve supply chain performance.
Next, we consider the analysis if the host company is an SME. First, if the host company is an SME with low innovation capacity, is large. In this case, the equilibrium with no incentive contract is ((I,P),S) = ((1,),1). With an incentive contract, is likely to meet condition (iii). Because the partner company is a large company, is likely to meet condition (1). Thus, the equilibrium is ((I,P),S) = ((1,),2). In this case, the supply chain performance score increases by 1-w. This result arises because even if the SME cannot improve its innovativeness, the large company can improve stability with an incentive contract. Second, in the case in which the host SME has innovative capabilities, is sufficiently small. In this case, the equilibrium without an incentive contract is ((I,P),S) = ((2,),1). With an incentive contract, however, is likely to meet condition (i) or (ii). Because the partner company is a large company, is likely to meet condition (1). Thus, the equilibrium is ((I,P),S) = ((2,),2). In this case, the supply chain performance score increases by 1-w. This result arises because, as in the previous case, the large company can improve stability regardless of whether the SME can improve innovation. Thus, we confirm that, if the SME is the leading company for procurement, the performance improvement effect of an incentive contract is greater.
Existing studies generally find that incentive contracts improve supply chain performance [6,27,28,29,30,31,32,33,34]. In contrast, our model shows that supply chain performance does not improve with an incentive contract when the host company is large. However, it does improve with an incentive contract when the host company is an SME. Thus, our study confirms that the effects of incentive contracts vary depending on the supply chain structure.
5. Policy Implications
SME-led public procurement with an incentive contract supported by a large company can be a win-win system based on collaborations between large and small enterprises that jointly share their achievements. Sharing cooperative profits enhances supply chain performance [35,36,37,38,39]. Ensuring long-term cooperation can induce SMEs’ sustainable growth [40,41,42]. Thus, an incentive contract can improve a supply chain’s efficiency, especially when the host company is small. Under an incentive contract, the host company provides additional profits to the partner company based on the results of a performance evaluation. The host and partner companies sign this contract after agreeing on a performance evaluation method and a ratio of performance allocation.
Large enterprises can expect to improve their corporate value not only by participating in public procurement but also by enhancing their images. Thus, many large enterprises will want to participate in SME-led public procurement. The government can select a large partner company through an evaluation system. Large companies with high scores for each business are selected as partners. If the government includes previous experiences of social activities in the evaluation criteria, it may meet the purpose of the system to help SMEs grow. The governments can also encourage large companies’ participation by evaluating their activities in SME-led public procurement. The evaluation results remain valid from the date of evaluation until the end of the project, and companies can participate in public procurement projects again after their contracts are completed and re-examined. In addition to basic production-related factors, such as process and quality improvements for SMEs, the main evaluation criteria relate to whether large companies fully support SMEs’ overall growth, including providing mentoring education. The government can also promote technological development by giving government grants for the R&D investments of both SMEs and large corporations [43,44,45]. If R&D is activated across large and small companies, SMEs’ productivity and competitiveness can improve [46,47]. The creation of shared value through SMEs’ procurement with incentive contracts can enhance SMEs’ productivity and maintain cooperative business relationships, which ultimately allows large and small businesses to grow simultaneously.
6. Conclusions
This study analyzes the performance improvement effects of incentive contracts according to the supply chain structure using a game-theoretic approach. An incentive contract’s ability to provide supply chain improvements may vary depending on the power of the host company. We compare a structure in which a large company is the host of a procurement project and an SME is the partner company with a structure in which an SME is a host and a large company is a partner. We analyze the differences in supply chain performance by structure before and after the introduction of incentive contracts. We assume that supply chain performance consists of innovation and stability and that the host and partner companies can improve the former and latter components of performance, respectively. Our analysis results show that incentive contracts within a supply chain have greater performance improvement effects when the host company is an SME. This finding is significant in that it presents a different perspective from previous studies, which focus on incentive contracts’ structures and information. Additionally, this study is unique in that it considers the structure in which an SME is the host company of a procurement project, whereas previous studies consider only the case in which the host company is large.
In addition, this analysis illustrates a way to improve policies that allocate public procurement to SMEs, such as the mentor-protege program in the U.S. and the public procurement win-win cooperation support program in Korea. These policies require SMEs to be selected as host companies to support SMEs’ sustainable growth. In this scenario, however, a large partner company does not have sufficient incentives to support a host SME, and an incentive contract is needed. If an incentive contract motivates large corporations to help SMEs by improving supply chain stability, supply chain efficiency will increase, and SMEs can obtain opportunities for sustainable growth.
To simplify the analysis, the current study assumes that individual companies have discrete selection variables. This study also has some other limitations, such as constructing the model as a one-shot game. Supply chain structures with incentive contracts and public procurement can be analyzed from more diverse perspectives in future studies if individual companies’ selection variables are made continuous and if the game is expanded to a multi-period model.
Author Contributions
Proposal & original idea, J.J.; conceptualization, D.P. and D.R.; modeling D.P. and J.J.; methodology, D.P.; validation, D.R.; resources, D.R.; literature review, D.P. and J.J.; economic & business implication, D.R.; writing—original draft preparation, D.P., J.J., and D.R.; writing—review & editing, D.R.; discussion, D.P. and D.R.; project administration, D.R.; All authors have read and agreed to the published version of the manuscript.
Funding
This research received no external funding.
Institutional Review Board Statement
Not applicable.
Informed Consent Statement
Not applicable.
Data Availability Statement
Not applicable.
Acknowledgments
We are grateful for the valuable comments of five anonymous referees. This work was supported by the Ministry of Education of the Republic of Korea and the National Research Foundation of Korea (NRF-2020S1A5A2A01045882).
Conflicts of Interest
The authors declare no conflict of interest.
References
- Moon, H.C.; Parc, J.; Yim, S.H.; Park, N. An extension of Porter and Kramer’s creating shared value (CSV): Reorienting strategies and seeking international cooperation. J. Int. Area Stud. 2011, 18, 49–64. [Google Scholar]
- Jin, C.H. The effects of creating shared value (CSV) on the consumer self–brand connection: Perspective of sustainable development. Corp. Soc. Responsib. Environ. Manag. 2018, 25, 1246–1257. [Google Scholar] [CrossRef]
- Kähkönen, A. The influence of power position on the depth of collaboration. Supply Chain Manag. Int. J. 2014, 19, 17–30. [Google Scholar] [CrossRef]
- Chen, H.; Jeter, D. The role of auditing in buyer-supplier relations. J. Contemp. Account. Econ. 2008, 4, 1–17. [Google Scholar] [CrossRef]
- Cachon, G.P.; Lariviere, M.A. Supply chain coordination with revenue-sharing contracts: Strengths and limitations. Manag. Sci. 2005, 51, 30–44. [Google Scholar] [CrossRef] [Green Version]
- Van der Veen, J.A.; Venugopal, V. Using revenue sharing to create win–win in the video rental supply chain. J. Oper. Res. Soc. 2005, 56, 757–762. [Google Scholar] [CrossRef]
- Habib, A.; Hasan, M.M. Corporate social responsibility and cost stickiness. Bus. Soc. 2019, 58, 453–492. [Google Scholar] [CrossRef]
- Krüger, P. Corporate goodness and shareholder wealth. J. Financ. Econ. 2015, 115, 304–329. [Google Scholar] [CrossRef]
- Porter, M.E.; Kramer, M.R. Creating shared value: How to reinvent capitalism and unleash a wave of innovation and growth. Harv. Bus. Rev. 2011, 89, 62–77. [Google Scholar]
- Kim, R.C. Can creating shared value (CSV) and the United Nations Sustainable Development Goals (UN SDGs) collaborate for a better world? Insights from East Asia. Sustainability 2018, 10, 4128. [Google Scholar] [CrossRef] [Green Version]
- Cavaco, S.; Crifo, P. CSR and financial performance: Complementarity between environmental, social and business behaviours. Appl. Econ. 2014, 46, 3323–3338. [Google Scholar] [CrossRef]
- Cheung, Y.L.; Tan, W.; Ahn, H.J.; Zhang, Z. Does corporate social responsibility matter in Asian emerging markets? J. Bus. Ethics 2010, 92, 401–413. [Google Scholar] [CrossRef]
- Oh, W.; Park, S. The relationship between corporate social responsibility and corporate financial performance in Korea. Emerg. Mark. Financ. Trade 2015, 51, 85–94. [Google Scholar] [CrossRef]
- Ryu, D.; Ryu, D.; Hwang, J.H. Corporate social responsibility, market competition, and shareholder wealth. Invest. Anal. J. 2016, 45, 16–30. [Google Scholar] [CrossRef]
- Servaes, H.; Tamayo, A. The impact of corporate social responsibility on firm value: The role of customer awareness. Manag. Sci. 2013, 59, 1045–1061. [Google Scholar] [CrossRef] [Green Version]
- Babiak, K.; Trendafilova, S. CSR and environmental responsibility: Motives and pressures to adopt green management practices. Corp. Soc. Responsib. Environ. Manag. 2011, 18, 11–24. [Google Scholar] [CrossRef]
- Barnea, A.; Rubin, A. Corporate social responsibility as a conflict between shareholders. J. Bus. Ethics 2010, 97, 71–86. [Google Scholar] [CrossRef]
- Bénabou, R.; Tirole, J. Individual and corporate social responsibility. Economica 2010, 77, 1–19. [Google Scholar] [CrossRef] [Green Version]
- Chung, C.Y.; Cho, S.J.; Ryu, D.; Ryu, D. Institutional blockholders and corporate social responsibility. Asian Bus. Manag. 2019, 18, 143–186. [Google Scholar] [CrossRef]
- Kim, H.; Park, K.; Ryu, D. Corporate environmental responsibility: A legal origins perspective. J. Bus. Ethics 2017, 140, 381–402. [Google Scholar] [CrossRef]
- Ogunfowora, B.; Stackhouse, M.; Oh, W.Y. Media depictions of CEO ethics and stakeholder support of CSR initiatives: The mediating roles of CSR motive attributions and cynicism. J. Bus. Ethics 2018, 150, 525–540. [Google Scholar] [CrossRef]
- Ayuso, S.; Roca, M.; Colomé, R. SMEs as “transmitters” of CSR requirements in the supply chain. Supply Chain Manag. Int. J. 2013, 18, 497–508. [Google Scholar] [CrossRef]
- Chi, T. Building a sustainable supply chain: An analysis of corporate social responsibility (CSR) practices in the Chinese textile and apparel industry. J. Text. Inst. 2011, 102, 837–848. [Google Scholar] [CrossRef]
- Hagedoorn, J. Understanding the rationale of strategic technology partnering: Interorganizational modes of cooperation and sectoral differences. Strateg. Manag. J. 1993, 14, 371–385. [Google Scholar] [CrossRef]
- Kumar, K.; Van Dissel, H.G. Sustainable collaboration: Managing conflict and cooperation in interorganizational systems. MISQuarterly 1996, 20, 279–300. [Google Scholar] [CrossRef] [Green Version]
- Lonsdale, C. Locked-in to supplier dominance: On the dangers of asset specificity for the outsourcing decision. J. Supply Chain Manag. 2001, 37, 22–27. [Google Scholar] [CrossRef]
- Qin, Z.; Yang, J. Analysis of a revenue-sharing contract in supply chain management. Int. J. Logist. Res. Appl. 2008, 11, 17–29. [Google Scholar] [CrossRef]
- Jaber, M.Y.; Osman, I.H. Coordinating a two-level supply chain with delay in payments and profit sharing. Comput. Ind. Eng. 2006, 50, 385–400. [Google Scholar] [CrossRef]
- Weinstein, M. Profit-sharing contracts in Hollywood: Evolution and analysis. J. Leg. Stud. 1998, 27, 67–112. [Google Scholar] [CrossRef] [Green Version]
- Shao, X.; Ji, J. Coordination with profit-sharing contracts in an assemble-to-order system. In Proceedings of the 2006 International Conference on Management Science and Engineering, Lille, France, 5–7 October 2006; pp. 476–480. [Google Scholar]
- Baiman, S.; Fischer, P.E.; Rajan, M.V. Information, contracting, and quality costs. Manag. Sci. 2000, 46, 776–789. [Google Scholar] [CrossRef]
- Jo, J.; Ryu, D. Public procurement win-win cooperation support system with benefit sharing. J. Regul. Stud. 2020, 29, 225–250. [Google Scholar]
- Sloev, I.; Nastych, M. Coordination within a supply chain with a profit sharing contract. SSRN Electron. J. 2016. [Google Scholar] [CrossRef]
- Ottaviano, G.I.P.; Thisse, J.-F. Monopolistic competition, multiproduct firms and product diversity. Manch. Sch. 2011, 79, 938–951. [Google Scholar] [CrossRef]
- Anderson, E.; Weitz, B. The use of pledges to build and sustain commitment in distribution channels. J. Mark. Res. 1992, 29, 18–34. [Google Scholar] [CrossRef]
- Bridoux, F.; Stoelhorst, J.W. Microfoundations for stakeholder theory: Managing stakeholders with heterogeneous motives. Strateg. Manag. J. 2014, 35, 107–125. [Google Scholar] [CrossRef]
- Dwyer, F.R.; Schurr, P.H.; Oh, S. Developing buyer-seller relationships. J. Mark. 1987, 51, 11–27. [Google Scholar] [CrossRef]
- Dyer, J.H.; Chu, W. The role of trustworthiness in reducing transaction costs and improving performance: Empirical evidence from the United States, Japan, and Korea. Organ. Sci. 2003, 14, 57–68. [Google Scholar] [CrossRef] [Green Version]
- Morgan, R.M.; Hunt, S.D. The commitment-trust theory of relationship marketing. J. Mark. 1994, 58, 20–38. [Google Scholar] [CrossRef]
- FitzRoy, F.R.; Kraft, K. Cooperation, productivity, and profit sharing. Q. J. Econ. 1987, 102, 23–35. [Google Scholar] [CrossRef]
- Jarimo, T.; Kulmala, H.I. Incentive profit-sharing rules joined with open-book accounting in SME networks. Prod. Plan. Control 2008, 19, 508–517. [Google Scholar] [CrossRef] [Green Version]
- Kruse, D.L. Profit sharing and productivity: Microeconomic evidence from the United States. Econ. J. 1992, 102, 24–36. [Google Scholar] [CrossRef]
- Cin, B.C.; Kim, Y.J.; Vonortas, N.S. The impact of public R&D subsidy on small firm productivity: Evidence from Korean SMEs. Small Bus. Econ. 2017, 48, 345–360. [Google Scholar]
- Hottenrott, H.; Lopes-Bento, C. (International) R&D collaboration and SMEs: The effectiveness of targeted public R&D support schemes. Res. Policy 2014, 43, 1055–1066. [Google Scholar]
- Karhunen, H.; Huovari, J. R&D subsidies and productivity in SMEs. Small Bus. Econ. 2015, 45, 805–823. [Google Scholar]
- Hall, B.H.; Lotti, F.; Mairesse, J. Innovation and productivity in SMEs: Empirical evidence for Italy. Small Bus. Econ. 2009, 33, 13–33. [Google Scholar] [CrossRef] [Green Version]
- Hölzl, W. Is the R&D behaviour of fast-growing SMEs different? Evidence from CIS III data for 16 countries. Small Bus. Econ. 2009, 33, 59–75. [Google Scholar]
Figure 1.
The dominant strategy of the partner company according to the initial cost of stability.

Figure 2.
The dominant strategy of the host company according to the initial cost of innovation.


Table 1.
Companies’ payoffs without incentive contract.
| S = 1 | ||||
| S = 2 |
Note: This table summarizes companies’ payoffs by strategy when no incentive contract is in place. I is the degree of innovation improvement, P is the price paid to the partner company, and (I, P) is the host company’s strategy. S is the partner company’s strategy, that is, the degree of improvement in terms of stability. In each cell, and represent the profits of the host and partner companies, respectively. R is sales income, and and are the costs of the host and partner companies, respectively.
Table 2.
Companies’ payoffs with an incentive contract.
| S = 1 | ||||
| S = 2 |
Note: This table summarizes companies’ payoffs by strategy when no incentive contract is in place. I is the degree of innovation improvement, P is the price paid to the partner company, and (I, P) is the host company’s strategy. S is the partner company’s strategy, that is, the degree of improvement in terms of stability. In each cell, and represent the profits of the host and partner companies, respectively. R is sales income, and and are the costs of the host and partner companies, respectively.
Table 3.
Partner company’s dominant strategies by cost condition.
| (1) | 2 | 2 | 2 | 2 |
| (2) | 2 | 1 | 2 | 1 |
| (3) | 1 | 1 | 1 | 1 |
Note: This table summarizes the partner company’s optimal strategies according to different cost conditions. The value in each cell describes the value of the stability variable, S, that maximizes the partner company’s profits given the cost conditions and the host company’s strategy.
Table 4.
Host company’s dominant strategies by cost condition.
| S = 1 | S = 2 | |
|---|---|---|
| (ⅰ) | (2, | (2, |
| (ⅱ) | (1, | (2, |
| (ⅲ) | (1, | (1, |
Note: This table summarizes the host company’s optimal strategies according to different cost conditions. The value in each cell describes the host company’s strategy, 3, that maximizes its profits given the cost conditions and the partner company’s strategy.
Table 5.
Equilibria and supply chain performance scores.
| (I, P) | S | B | ||
|---|---|---|---|---|
| (1) | (ⅰ) | (2, | 2 | 2 |
| (1) | (ⅱ) | (2, | 2 | 2 |
| (1) | (ⅲ) | (1, | 2 | 2 − w |
| (2) | (ⅰ) | (2, | 1 | 1 + w |
| (2) | (ⅱ) | (1, | 1 | 1 |
| (2) | (ⅲ) | (1, | 1 | 1 |
| (3) | (ⅰ) | (2, | 1 | 1 + w |
| (3) | (ⅱ) | (1, | 1 | 1 |
| (3) | (ⅲ) | (1, | 1 | 1 |
Note: This table summarizes the costs, equilibrium strategies, and supply chain performance scores. The first column is the stability cost condition, and the second column is the innovation cost condition. The third and fourth columns refer to the equilibrium strategy for each condition, and the last column is the supply chain performance score in equilibrium.
Publisher’s Note: MDPI stays neutral with regard to jurisdictional claims in published maps and institutional affiliations. |
© 2021 by the authors. Licensee MDPI, Basel, Switzerland. This article is an open access article distributed under the terms and conditions of the Creative Commons Attribution (CC BY) license (https://creativecommons.org/licenses/by/4.0/).
Share and Cite
MDPI and ACS Style
Park, D.; Jo, J.; Ryu, D. Incentive Contracts for Sustainable Growth of Small or Medium-Sized Enterprise. Sustainability 2021, 13, 4964. https://0-doi-org.brum.beds.ac.uk/10.3390/su13094964
AMA Style
Park D, Jo J, Ryu D. Incentive Contracts for Sustainable Growth of Small or Medium-Sized Enterprise. Sustainability. 2021; 13(9):4964. https://0-doi-org.brum.beds.ac.uk/10.3390/su13094964
Chicago/Turabian StylePark, Daehyeon, Jinhyeong Jo, and Doojin Ryu. 2021. "Incentive Contracts for Sustainable Growth of Small or Medium-Sized Enterprise" Sustainability 13, no. 9: 4964. https://0-doi-org.brum.beds.ac.uk/10.3390/su13094964
Note that from the first issue of 2016, this journal uses article numbers instead of page numbers. See further details here.