1. Introduction
In the EU, the production of so-called “seafood” products, or fisheries and aquaculture products, has been subjected to an autonomous policy since 1983, with the establishment of the Common Fisheries Policy (CFP). Further to various developments and three major revisions, the CFP has a double characteristic with respect to competencies: exclusive competency of the European Union concerning the conservation of the natural resources and shared competency for all other aspects. This is the case, for instance, of the financial structural instrument of the CFP, including when applied to inland aquaculture, the research object of this paper.
The question of granting public aid constitutes an important element of the state interventionism in the sphere of economics and one of the parts of the European Union’s competition policy. The state’s impact on the economy is the subject of an ongoing debate involving theorists of economics who, on the one hand, support leaving economic problems to market forces and, on the other, remain in favor of active state participation [
1].
In the light of numerous and often radically different opinions in this respect, the prevailing view, especially in transition economies from Central and Eastern Europe, is that the role of the state in a modern economy is mostly to ensure observing the rules of economic freedom, respecting private property and unrestricted entrepreneurship. This does not mean that the state’s activity in the economy is completely rejected. However, the state interventionism should be limited and determined based on legitimate grounds as well as economic criteria [
2]. It is justified only if its activity limits market failure, ensuring—in Pareto’s understanding—the improvement of some entities’ situation, without worsening the situation of others [
3].
One symptom of the discussed state intervention is supporting the sector of small and medium enterprises (SMEs), and one of its forms is financial public aid. It undeniably affects not only the development of the supported economy sectors but, above all, the financial situation improvement of the enterprises operating in such environments. However, the state activity in this respect cannot function as the replacement of market mechanisms, but as a supporting and correcting factor in the areas which do not bring about satisfying effects [
2].
While there are clear tendencies to reduce the amount of aid allocated in order to limit market disruption, fisheries and aquaculture sectors still occupy an important place in terms of granting public aid. In the years 2000–2007, the total value of public aid granted by the member states to entrepreneurs operating in the fisheries and aquaculture sector amounted to around EUR 4 billion, before reaching EUR 4.3 billion for the period 2008–2013, and EUR 5.7 billion for the period 2014–2021 [
4].
The fisheries and aquaculture sector is largely represented by SMEs, operating in very competitive market conditions. Furthermore, this sector is particularly sensitive to price fluctuations resulting from the continuously changing economic, natural (climate changes, rainfall, temperature, diseases, etc.) and socio-cultural conditions. When addressing the impacts of public aid in the seafood sector, it should be kept in mind that the general question is about the social desirability of subsidies, which includes the competition distortion as well. That is why it is necessary to review the types of aids granted and an assessment of their impacts on the firms involved, in the light of three traditional financial ratios.
This paper focuses on the case of carp fish farming in Poland. Its main purpose is to propose an ex-post analysis of the subsidies actually granted during the 2012–2016 period, based on both public and private first-hand (accounting) data. It is structured as follows:
Section 2 presents the overview of the subject literature addressing the development of public aid in the EU aquaculture sector, from both theoretical and empirical views. Sustainable development issues are also addressed.
Section 3 focuses on the specificity of inland fisheries in the Barycz Valley, which is the largest carp breeding center, not only in Poland, but also in Europe.
Section 4 defines the material and methods, and describes the selected financial indicators used (i.e., financial liquidity, profitability, debt and increase in total assets in the years 2012–2016). For their calculation, the data obtained from fish farms representing both public and private sectors were used.
Section 5 presents results of selected financial analysis indicators and includes the discussion, and finally
Section 6 presents conclusions.
The novelty of this paper is the attempt to demonstrate that traditional financial performance ratios about the public aid are limited and cannot fully capture environmental and social benefits in the aquaculture sector.
2. The Concept and Premises of Public Aid in Fishery and Aquaculture Sector
2.1. Theoretical Background
The approach to the extent of state involvement in economic processes is subject to cyclical fluctuations, characteristic for the development of economic thought [
5,
6]. State aid is the tool for state intervention in market mechanisms. It is economically acceptable when the market is imperfect and inefficient. The subject literature distinguishes many situations referred to as market failures/imperfections, in which the state support for the free market mechanism is desirable to influence the decisions taken by the economic trade participants [
7]. In this case, a set of legal measures for the market supervision by the highest authority can be used. It results from the provisions of public law aimed at organizing competition in an orderly manner [
8,
9,
10], which is supposed to result in achieving the desired economic goals [
11,
12,
13].
According to some authors, public aid represents one of the state functions for the benefit of the economy. These functions also include economic rationing and planning, cyclical policy and the regulation of infrastructure sectors [
14,
15]. According to [
16], through its implementation the state manifests its responsibility for the proper functioning of the economy by providing the broadly understood benefits to the selected entrepreneurs or sectors. On the one hand, such support is a clear act of preference against other entities but, on the other, from the state perspective it is an instrument for their inclusion in achieving the objectives motivated by diverse public interests, in the form of, e.g., the development of lagging behind and underinvested regions, restructuring certain economy sectors, increasing workforce mobility or environment protection [
16,
17]. It means that such activities can be approached as an incentive for the development and modernization of the economy in the direction expected by the state, through “the provision of favorable financial conditions for taking effective advantage from (…) the freedom of economic activity” [
18].
Although using public funds by the state allows its indirect influence on the business activity carried out by entrepreneurs, still the incorrectly targeted aid adversely affects the sound entities, limiting their competitive capacity in favor of the inefficient ones. Granting state aid results in the distortion of competition, as it gives preference to those aid beneficiaries who receive additional funds they would not have obtained under typical market conditions [
19]. Therefore, the discussed aid should be limited in time and addressed only to solve the most important economic or social problems in the scale of the economy sector or the country region [
20].
Public aid is also closely correlated with the concept of sustainable development. The implementation of this concept [
21], covering three mutually complementary economic, social and environmental goals, requires applying various legal and economic instruments. Public aid [
22] remains one of the financial instruments supporting sustainable development. Public aid stimulating socio-economic development has a positive impact on sustainable development, including the aid in terms of environment protection and energy saving [
23], aid for the employment and training of employees [
24], aid for research, development and innovation [
25], aid for the development of small and medium-sized enterprises [
26] to support economic development of the least developed (economically lagging behind) regions, aid for renewable energy sources and the low-carbon economy, and also aid in infrastructural sectors, primarily in the transport sector [
27]. One of the significant aspects of public aid is also the fact that it can positively influence the sustainability of the entire aquaculture sector [
28]. It should be emphasized that aquaculture contributes to the world’s food security and helps to achieve the Sustainable Development Goals of the United Nations [
29,
30,
31].
2.2. The Empirical Development of Public Aids in the EU Seafood Sector
Public aid in the fisheries and aquaculture sector is included in the wider framework of the Common Fisheries Policy. The social and economic effects of public support are the same, regardless of whether it is funded by the entire EU or only some member states. In this regard, the European Commission considers that consistency and coherence are needed in the control of public aid under the Common Fisheries Policy.
In accordance with the provisions of Art. 38 (1) of the Treaty on the Functioning of the European Union [
32] and due to the fact that there are many similar features of fisheries and agriculture, e.g., the dependence of production on natural conditions and the dispersion of producers (fishermen) over a large area of operation and difficulties in concentrating capital, the products of fisheries and aquaculture were recognized initially (since 1957) as agricultural products. In the Case No. 141/78 [
33] the European Court of Justice (ECJ) stated that sea fishing has always been subject to the common agricultural policy, as evidenced by the fact that fish, crustaceans and molluscs are clearly listed in the Annex I to the Treaty establishing the European Community (TEC) 2002. The definition of fisheries products can be found, e.g., in the Council Regulation [
34].
The important legal act regulating the scope of public aid in fisheries is the Commission Regulation No. 736/2008 [
35] on the application of public aid to small and medium-sized enterprises active in the production, processing and marketing of fishery products. The aid covered by this exemption has to remain transparent, i.e., granted, for example, in the form of subsidies, loans, guarantee programs or fiscal measures and cannot be cumulative with the parallel aid granted under other provisions.
In the current financial perspective 2014–2020, the total value of aid resources coming from the European Maritime and Fisheries Fund, addressed to the European Union member states, amounts to EUR 5.75 billion [
4]. The countries with an extensive fishing capacity and a high percentage of employment in the enterprises operating within fisheries, aquaculture or processing sectors remain the beneficiaries of these funds.
The main beneficiaries are the enterprises functioning in Spain (20.2% of the total amount), France (10.2%) and Italy (9.3%). Poland was allocated EUR 531.2 million, i.e., slightly more than 9% of all funds and slightly less than the Italian allocation (EUR 537 million). The additional contribution of EUR 179 million was guaranteed to Polish entrepreneurs from the national budget, which sums up to the total of EUR 710.2 million. Poland was followed by such countries as Portugal (6.8%) and Greece (6.7%), Croatia (4.4%), the United Kingdom (4.2%), Germany (3.8%) and Denmark (3.6%), as well as Slovakia and Austria with the allocated amount of subsidies not exceeding 1% [
4] (
Figure 1).
The types of supports provided include not only the traditionally production-oriented fisheries sector (inland fishing, sea fishing, aquaculture), but also the Community-Led Local Development (Fisheries Sector Local Action Groups) and processing. The new support scheme (EMFF) includes fish market, data collection, control and enforcement of the Common Fisheries Policy and Integrated Maritime Policy.
Table 1 shows the value of submitted applications under the five priority axes of the Program and the level of contracted funds.
The use of public aid in the seafood sector has been highly analyzed, especially with regards to the type of subsidies involved. OECD for instance provided a wide review of so-called “financial supports to fisheries” and their implications in terms of sustainable development [
37]. This follows the more general concerns about potential environmentally harmful subsidies [
38], especially when overexploitation of the natural resources is at risk.
3. Inland Fisheries in the Barycz Valley
The tradition and culture of pond fish farming in Poland dates back to the 11th century. It was related to the activity carried out by the Cistercian order, which played an important role in the construction and use of pond facilities during that period. Over the centuries, fish farming methods were subject to extensive transformations (resulting, e.g., from their significant mechanization advancement), however, the fisheries production has still retained its traditional character. Its specificity lies in the low intensification of production (up to 1500 kg/ha), the large share of natural food in fish diet present in a pond (half of fish growth comes from plankton) or the use of mainly raw, natural cereals in fish feeding, which significantly increases their taste quality [
39].
The changes resulting from the transformation of the Polish economy had a special impact on the structure of fish farms. Państwowe Zakłady Budżetowe (
State Budgetary Establishments), the monopolists dominating before 1989 in the sector of freshwater fish farming (mainly carp), soon faced a dynamic competition in the form of small and medium-sized farms, which were capable of adapting better to the dynamically changing environmental conditions. Their flexibility and a relatively low share of fixed costs in total production resulted in the significant strengthening of their competitive position in the following years. In addition, they diversified their activities extensively, putting more emphasis on the development of fishing and gastronomy industry as well as recreation (primarily agritourism). Simultaneously, the access to the European Union funds opened a great opportunity for their further development [
40].
According to the data presented in the Community-Led Local Development Strategy (LDS) for the Barycz Valley, covering the years 2016–2022, there are 26 fishing entities operating in the Barycz Valley. Carp breeding is the regional specialty. In 2014, 271 people were permanently employed in the fisheries, and an additional 80 were employed as seasonal workers. The Ratio Fish Employment (RFE) of the area amounted to 2.1835 and was calculated based on the number of people employed in the fisheries sector per 1000 inhabitants. Most workers were employed in the company Stawy Milickie S.A. (over 220 people), with average annual production estimated in the range 1500–1800 tons/year (The Ministry of Agriculture and Rural Development 2018). Apart from this company, there are 3 large fishing farms employing more than 5 people on a permanent basis: a farm in Ruda Żmigrodzka (the area of Lower Silesia Voivodship) and two farms in Wielkopolskie Voivodship: Przygodzice and Możdżanów. The fisheries in the above mentioned farms remain the basic source of income. The detailed data referring to the fisheries in the Barycz Valley are presented in
Table 2 and illustrated in
Figure 2.
The company “Stawy Milickie S.A.” is the only public entity from the fisheries in Barycz Valley and, at the same time, is still an undisputed leader in carp production in the studied area. At the peak period of fishing ponds development, i.e., in the 18th century, their area was over 13,000 ha [
42]. In later periods, it was gradually reduced.
Since 1950, the Milicz ponds have been under the management of the State Farms. It was a period of intensive and comprehensive work over the ponds and their surroundings. At that time, heavy, specialized equipment was purchased, water reservoirs were deepened, dikes were renovated and fish production was significantly intensified. In 1963, the “Stawy Milickie” (The Milicz Ponds) nature reserve was established, covering the ponds of Ruda Milicka, Grabownica, Ruda Sułowska and Radziądz. In 1996, the property of Zakłady Rybackie (Fishing Company) was transferred to the Wrocław voivodship governor. As a result of a trilateral agreement between the Agricultural Property Agency, the Lower Silesia Voivodship and the Lower Silesia governor, based on the closed down “Stawy Milickie” State Budgetary Establishments the joint-stock company Stawy Milickie was established with the headquarters in Ruda Sułowska. In 2011, the then Minister of the Treasury signed a decision on the free transfer of a block of shares, of PLN 135.8 million total worth, to the Lower Silesia Voivodship. As a result of this decision, since November 16, 2011 the voivodship became the sole shareholder of the company. It is currently the largest center in Poland and Europe specializing in carp breeding. It covers 6114.637 ha; however, the pond area has been reduced by 1209.3 ha, compared to 2011 (almost half of the pond area owned by the company co-creates the “Stawy Milickie” Nature Reserve [
43]). Until the end of the 1980s, the Milicz Ponds had an unquestioned monopolistic position in the fish market in the region. However, the beginning of the 1990s brought about significant changes in this industry sector. New business entities emerged which, although could not compete with the “giant” in terms of the area, contribute significantly to the status quo change in the market of carp breeders in this region [
44]. The company has lost its leadership status in the area of fish production to, e.g., Dolina Karpia (The Carp Valley) in Zator.
The co-funding from the EU funds was a significant support for the activities carried out by the fishing farms located in the Barycz Valley (
Appendix A). It was intended both for the investments in the so-called “hard” infrastructure, allocated directly and indirectly to the fishing farms, and a “soft” one, including training addressed to fishermen and external stakeholders. It is also important that the obtained funds allowed the implementation of investments aimed at diversifying the activities of the fishing farms, which facilitated the transition from long to short supply chains in the market of the Milicz carp [
45].
4. Materials and Methods
4.1. Review of the Measures Funded
4.1.1. Data Collection Process
The source material was collected through a two-track empirical study. Data from the farm X (as a public enterprise they are obligated to make financial data public) were collected from the National Court Register in Poland in 2018 (publicly available data). The research covered issues related to financial statements, industry analysis, capital ties, arrears in payments, scoring, rating and others.
Data from the farm Y and farm Z were collected using survey questionnaires for the period from 2012 to 2017 (compatible with the X) carried out at the turn of June and July 2018 (see
Appendix B). Poland is not obliged to collect aquaculture economic data in accordance with the Commission Implementing Decision [
46]. The low level of social and human capital in this region makes it extremely difficult to obtain reliable data from the farmers. Farms Y and Z stand out from the rest with transparency and willingness to cooperate with scientists.
4.1.2. Typology of the Measures Funded
As indicated in the section above, the first step of the data collection process consists of listing all the projects co-funded by the EU funds and allocated to fisheries management in the Barycz Valley over the period 2007–2015 (
Appendix A). As it will be clarified in the Results section, only 6 firms received public funds from the EU during the research period, with 3 of them representing 85.3% of the total amount. As a result, and due to the difficulty of collecting first hand data (both financial and related to the exact objectives of the measures), it was decided to focus the analysis on these 3 farms (referred to as X, Y and Z).
In order to understand the potential effects of each project on the financial performances of the firms involved, it was decided to classify these projects into four categories, depending on the key purpose pursued and further consultations with the firms involved: education and social inclusion; preservation and maintenance of the environment; productivity-enhancement; diversification of production.
In order to fine-tune the analysis, an identification of the exact sub-measures involved was realized, in collaboration with the public entities in charge of monitoring EMFF subsidies. While some of the sub-measures identified could fully match with the four categories listed above (e.g., measures dedicated to preservation and maintenance of the environment, which are mostly reported under the sub-category 4.1.4), this is not always the case, due to the rather vague wording of some sub-categories.
4.2. Performance Ratios
The basis of the conducted empirical research was the financial situation assessment of the selected enterprises (beneficiaries of EFF and EMFF) involved in carp farming, located in the Barycz Valley.
As indicated above, 3 out of 26 entities were selected for the study, according to the methodology based on “the typical farm approach” [
47,
48,
49]. This methodology is not new to agricultural economics research: “The need to assess quickly the impacts of policy changes […] on farms […] still makes the typical farm approach to the analysis a very useful procedure” [
47]. The research scheme of the typical farm approach covers 5 steps:
Selection of the market and species,
Selection of the regions,
Definition of production systems,
Focus group with farmers, consultant and researchers,
Surveys.
These three fish farms constitute almost 85% of the pond area in the Barycz Valley (
Figure 2) and can be considered representative of the different production strategies, including the intensification level [
39]. The biggest one (leader) is the only public entity from the fisheries in Barycz Valley and two medium farms (private sector), using the same water resource, were assessed to get a reliable cross section of data.
The research was based on the data obtained from an enterprise operating in the public sector, for the purposes of comparative analysis marked as “enterprise X”, and two private sector enterprises, referred to as “enterprise Y” and “enterprise Z”. Their general characteristics are presented in
Table 3.
Beyond surveyed enterprises X, Y, Z, only one other enterprise (from the private sector) has a real impact on fisheries in the region, but it did not agree to participate in the research.
The research scope covers identifying the situation regarding the financial liquidity of the analyzed enterprises, their profitability, debt level and the increase in total assets in the years 2012–2016. The company X (the largest) provided the data only from this period. The survey of enterprises Z and Y, therefore, concerned only this period. However, 2012–2016 was a breakthrough period for the fishery sector in Barycz Valley, due to the largest amounts of public aid granted (see
Appendix B).
To confirm the results, regression analysis was used.
5. Results and Discussion
5.1. Review of the Measures Funded
All the 33 measures for which EMFF public support was requested over the period of analysis are listed in
Appendix A. They all pertain to the Union Priority 4, which is dedicated to Community-Led Local Development (CLLD) strategies. In other words, these measures aim to increase employment and promote territorial cohesion. This feature can be explained by the fact that in the Polish Operational Programme, no other actions were planned for the development of inland aquaculture. While the amounts dedicated to each Union Priorities (UP) are decided at the UE level in the EMFF, it is up to national member states to decide which UP they want to prioritize [
50,
51].
On these 33 measures, 6 were either withdrawn or rejected by the control authority. However, in order to analyze the type of actions planned, the 6 concerned measures are still listed and partly considered in the analysis, as they reflect the firms’ strategies.
In further details, the most frequent sub-measure involved was 4.1.4, which is dedicated to the preservation and maintenance of the environment.
Table 4 below presents the title of each of the sub-measures involved, as well as their relative occurrence.
Figure 3 below presents the amounts of money involved (in PLN) for each sub-category and for each of the 6 enterprises that requested public support.
In terms of cumulative amounts involved by sub-measure, the most important one is 4.1.4, with more than PLN 4 million, before 4.1.2, with around PLN 3.2 million (see
Table 5).
When using the typology based on the measures’ main purpose, the preservation and maintenance of the environment still appears the most important one, with almost PLN 4.9 million. The difference compared to the amount of the sub-measure 4.1.4 lies in the fact that several measures listed in the category 4.1.1 consist more of enhancing the environment (“maintaining attractiveness of fisheries areas”) than in productivity-enhancing actions (“strengthening competitiveness”). The same occurs with several 4.1.1 sub-measures targeting more education and inclusion objectives (“maintaining attractiveness of fisheries areas”) rather than productivity-enhancing actions. As for requests for public aid under 4.1.2, they refer to diversification and productivity-enhancement strategies, which is in line with the title of the sub-measure (“operations of restructuring or reorienting the economic activity or diversification of employment of people whose work is linked to the fisheries sector”), although this does not always take place through “creating additional jobs outside that sector” (see
Table 6).
When considering the wording of the sub-measures “strengthening competitiveness and maintaining attractiveness” (4.1.1), “restructuring or reorienting the economic activity or diversification” (4.1.2) and “increasing the value of the products of fisheries” (4.1.3), it could be concluded that the bulk of the requests for public aid (around PLN 7.8 million) are aimed at improving the economic performances of the firms involved. However, when considering the measures’ main purpose, it appears that only around PLN 4 million was clearly oriented towards this goal (productivity and diversification of production; 39% of the amount received), which might have some impact on the performance ratios presented below.
5.2. Performance Ratios
5.2.1. Financial Liquidity
The liquidity of enterprises was analyzed using the current liquidity ratios and the quick liquidity ratios calculated by the following formulas [
53]:
The current liquidity ratio shows the relationship of current assets to current liabilities and explains the enterprise’s potential ability to settle current liabilities [
54]. It should be emphasized that adopting the enterprise total current assets, and the inventories in particular, for the financial liquidity assessment may lead to incorrect conclusions regarding the assessment of the enterprise liquidity as it is difficult to liquidate inventories in the short term along with maintaining their actual value. In addition, inventories are valued in the balance sheet at purchase price or acquisition price, so their value may differ from the current market price, especially if they are stored for a long time. As a consequence, some inventories may expire which, in turn, makes selling them difficult or impossible. The subject literature defines the satisfactory ratio level in the range of 1.2–2, where a too high ratio value may mean a company financial overliquidity and inefficient use of current assets. In turn, a low ratio value shows problems with maintaining liquidity, and thus is interpreted as a financial threat to the enterprise.
Unlike the current financial liquidity ratio, quick financial liquidity does not take into account calculating inventories and short-term prepayments. These two components of current assets are ignored due to their lower degree of liquidity (longer realization time) than short-term investments and short-term receivables, which represent the assets characterized by high liquidity level. The ratio value in this case, according to the subject literature, should amount to approx. 1 [
53]. It has to be highlighted that in a positive situation the values of both ratios do not differ too much, otherwise it may indicate that the level of inventories in an enterprise is too high (see
Table 7).
Regarding the analyzed enterprises, it was observed that the value of both liquidity ratios in the case of private sector enterprises remained at a very high level, which resulted from a very low value of current liabilities. The values of financial liquidity ratios in “enterprise X” (public sector), were also high, especially in the years 2012–2013. This was due to high subsidies received by the enterprise in this period. In the following years, the financial liquidity was significantly lower; nevertheless, in 2016 the lowest ratio value was 2.61, which is still considered a good result.
In both cases, high financial liquidity ratios were caused, on the one hand, by low liabilities and, on the other, by high levels of cash primarily from subsidies. It should be emphasized that maintaining an excessively high level of cash is not favorable in the long term, as it results in the so-called opportunity costs. In turn, it may mean a cautious (conservative) approach towards managing enterprise finance [
55], which is particularly evident in the case of the private enterprises under study.
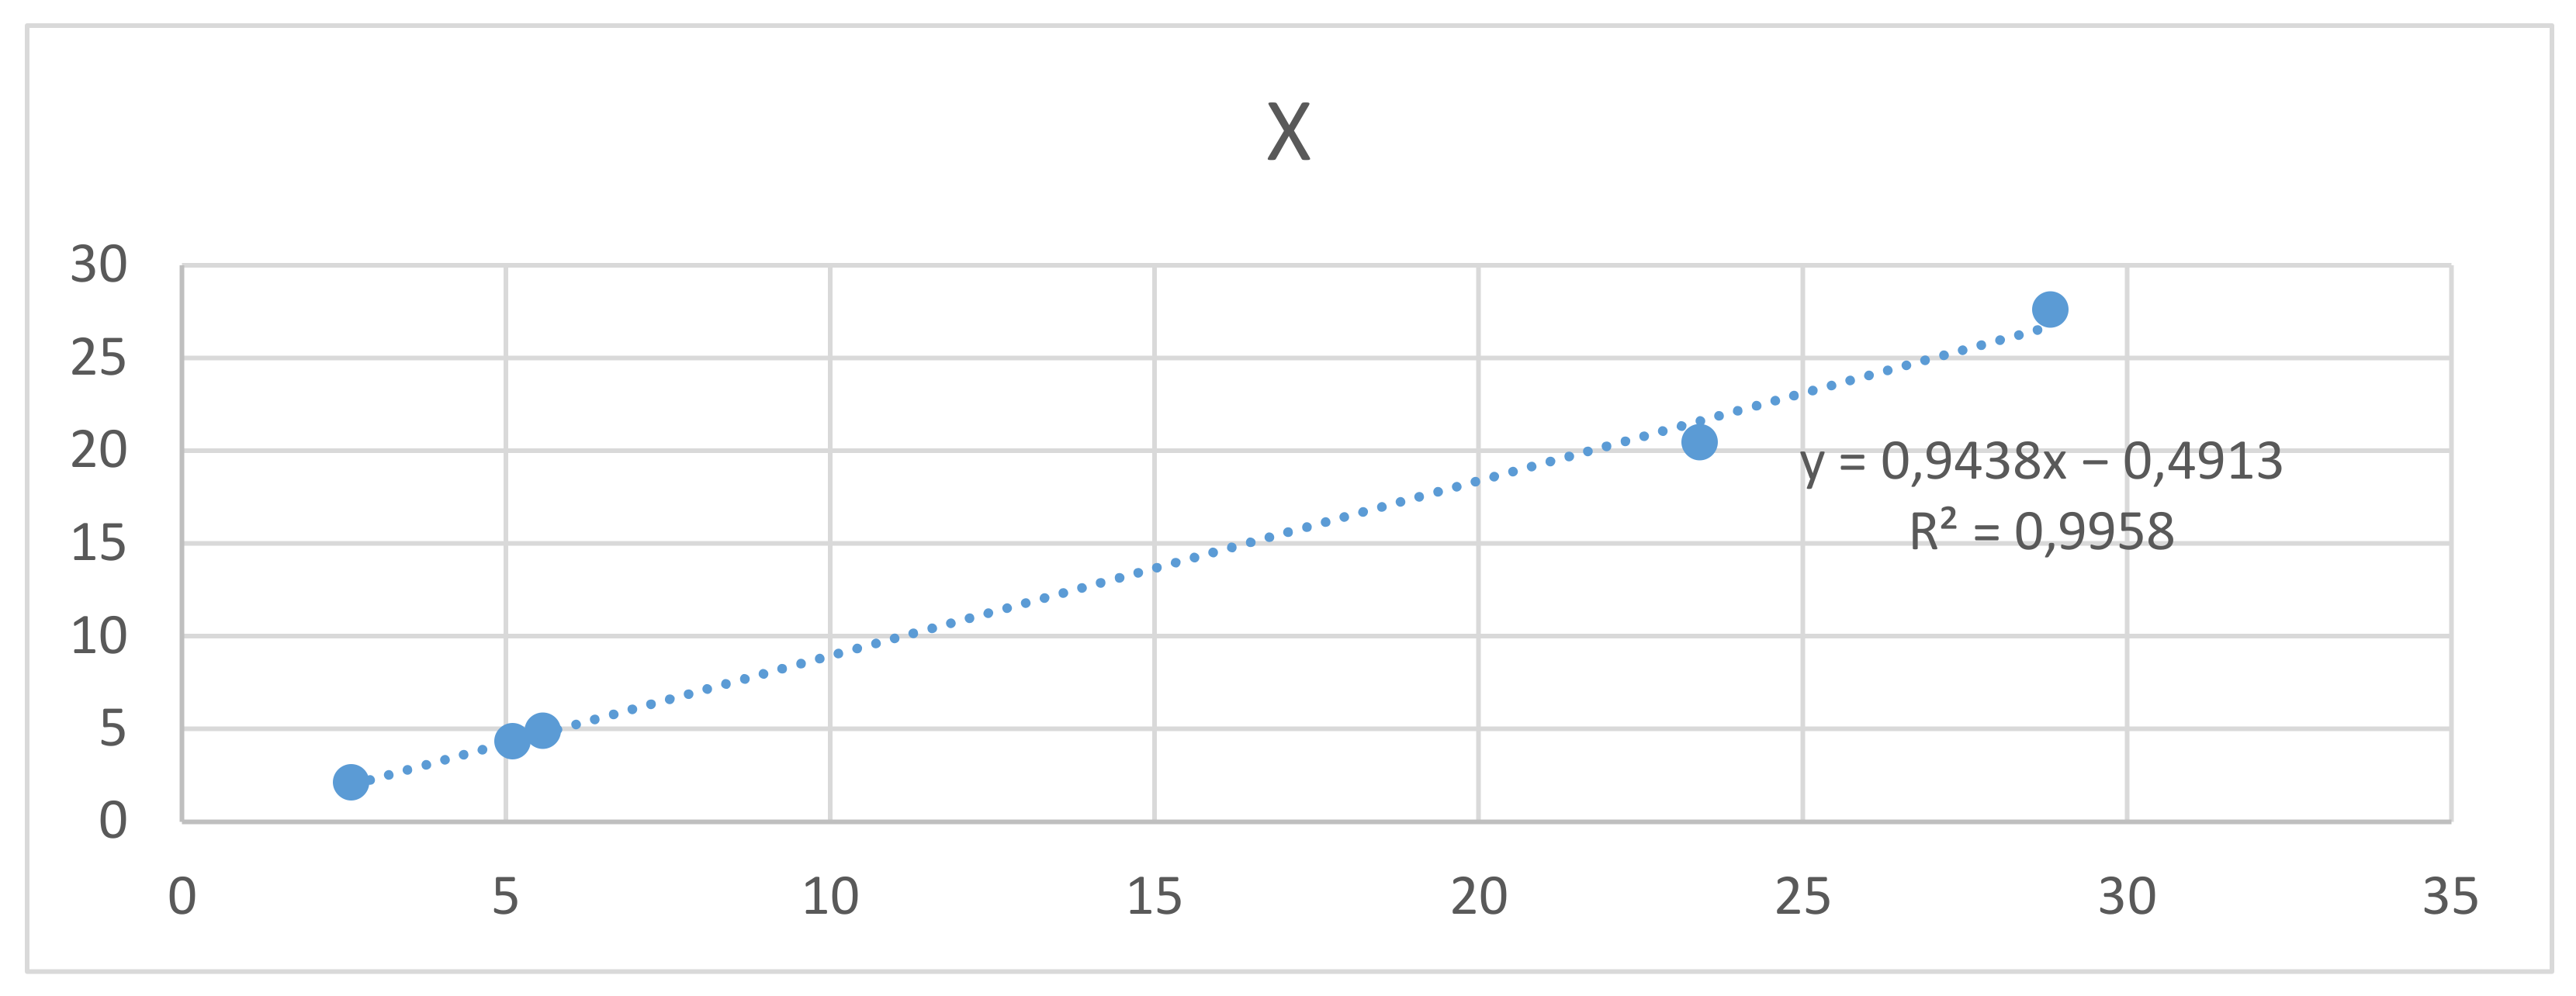
Regression analysis was used to examine the relationship between these variables. In the case of enterprise X, the determination coefficient R
2, which describes the matching model, reached 0.99. The regression model (
Figure 4) shows that an increase in current liquidity by one causes an increase in accelerated liquidity by 0.9438.
In the case of enterprise Y, due to the low number of observations, statistical analyses were not applicable. In the case of enterprise Z, the coefficient of determination is high as it reaches 0.98. An increase in current liquidity by one gives an increase in accelerated liquidity by 0.9989, which is higher than for enterprise X (
Figure 5).
5.2.2. Enterprise Profitability
Profitability ratios allow determining prospective financial liquidity of a company. The higher the profitability ratios in an enterprise, the larger the possibility of achieving a financial surplus, which can be allocated to future goals. Simultaneously, the financial viability of enterprises is determined based on the profitability ratios, as well as the possibility (and price) of obtaining external funding sources. Return on assets (ROA) and return on sales (ROS) were used to assess the level of enterprise profitability as defined by the following formulas:
ROA—return on assets
NP—net profit
A—total assets.
The analysis of profitability ratios in the period under study showed visible fluctuations in their level (see
Table 8). “Enterprise X” achieved net profit only in 2012 and 2013 and recorded losses in the subsequent years. A significant loss on sales raises major concerns. Operating costs throughout the entire analyzed period were almost three times higher than sales, and net profit in 2012 and 2013 was achieved only as a result of high subsidies.
The situation in enterprises representing the private sector was more favorable. In the analyzed period, “enterprise Y” recorded losses only in 2013 and 2015 and a profit in the remaining years. “Enterprise Y” reached the highest sales profitability in 2014, whereas “enterprise Z” reached it in 2012 and 2013 owing to the subsidies received in these years. Unfortunately, losses were recorded in the subsequent years.
The regression analysis showed that in the case of enterprise X, the model matching (coefficient of determination R
2) reached a high value of 0.99. The regression model (
Figure 6) showed that an increase of ROS by one causes an increase in ROA of 0.036.
In the case of enterprise Y, due to the low number of observations, statistical analyses were not applicable. In Z’s case, the coefficient of determination was moderately high (0.77) and is presented in
Figure 7.
5.2.3. Debt and Increase in Totals
A credit facility used by an enterprise is, on the one hand, a financial burden but, on the other, it allows using the so-called leverage effect as an incentive for earning higher profits by an enterprise in the future. The debt-to-asset ratio was used to assess the level of corporate debt in the following formula:
DR—debt ratio
ZO—total liabilities
A—total assets
and the increase in total assets of the enterprises in question, as compared to 2012, was analyzed.
The data presented in the
Table 9 below show that the level of debt-based assets, in the period under consideration, in the public sector enterprise was very low and it was practically absent in private enterprises. In turn, the analysis of property growth allows stating that private enterprises were systematically increasing their assets compared to 2012. The opposite is true for enterprises from the public sector. In this case, the analyzed enterprise recorded a decline in property growth along with a simultaneous debt increase.
The analysis of regression showed that in the case of enterprise X, the coefficient of determination was only 0.085. Such a model should be considered irrelevant and its parameters should not be used for any analysis. In the case of enterprise Y, due to the low number of observations, statistical analyses were not applicable. Similarly, it was not determined in the Z-case, due to the fact that the debt rate is not a random variable.
5.3. Discussion
The discussions on the impacts of public aid on the aquaculture sector are quite rare [
56]. This work, though to a minimal extent, fills this gap. While considering the sustainable development dimension [
21,
57,
58,
59] is well beyond the scope of this article, it is important from the point of view of the fishing industry’s future.
Inland fisheries in the Barycz Valley are a branch of the economy that is naturally associated with the paradigms of sustainable development. This is due to the fact that the Barycz Valley includes eight municipalities (nearly 100,000 inhabitants), of which half are rural, not very urbanized, municipalities. The rural population (usually poorly educated) is mainly employed in the fishery and agriculture sectors, which manifests in the development of a specific fishing culture in this region. The list of benefits that local residents derive from their fishing activities is long. In addition to traditional values such as food delivery and employment guarantees, it is also possible to show the development of fishing and recreation (e.g., agritourism), which is combined with the possibility of multi-functional development of rural areas.
The beneficial impact of fisheries management on the environment is manifested in the restoration of native fish species within their range and the creation of water reservoirs with retention functions. In addition, fishing activities in the Barycz Valley are conducted in natural and valuable areas, due to its inclusion on the list of Ramsar Convention on Wetlands of International Importance, especially as a habitat of water birds due to the presence of numerous ponds, wetlands, meadows and forests, which affect the development of biodiversity. Currently, most areas where fishing activities are conducted are covered by the NATURA 2000 program as special bird protection areas. They include the Barycz Refuge (82,026.4 ha), the Barycz Valley (55,516.8 ha) and the Lower Barycz Valley (3165.8 ha). It also covers the largest ornithological reserve “Milicz Ponds” and the largest Landscape Park in Poland, “Barycz Valley”.
On the one hand, the implementation of sustainable development principles is an important factor in the development of fishing farms, because it requires, for example, extensive farming, which clearly improves the taste of fish. On the other hand, it is associated with incurring additional costs associated with the occurrence of an increasing number of protected fish eaters that are decimating farms, which disturbs the process of optimizing sustainable development goals and contributes to conflicts between the ecology, economy and society.
As it can been observed in
Section 5.1, the measures funded indeed reflect this, with 10 measures dedicated to the maintenance or enhancement of the natural environment (from 33 measures, so almost a third) and 7 measures dedicated to education and social inclusion (24%).
The state aid programs have been created to compensate fish producers for the difficulties associated with using traditional production methods that help to improve environmental conditions and the development of biodiversity, as well as to promote ecological production practices. They cover a wide range of projects for the sustainable development of fisheries.
The research results showed that effective use of public aid will not only result from the overall financial situation of the enterprise but also from their openness to changing environmental conditions, willingness to invest in physical and human capital and knowledge sharing. It is also manifested in the aspect of business social responsibility. In the case of the surveyed fish farms, these types of features were characteristic of the ones operating in the private sector.
These results are consistent with the general trends regarding the issues of enterprise sustainable development [
60,
61,
62]. They can also contribute to a wider discussion on the usefulness, efficiency and coherence of state aid targeted at the fisheries and aquaculture sector in the new 2020–2027 perspective.
6. Conclusions
This research aimed at assessing the effectiveness of using public support funds by the selected enterprises operating in the field of carp breeding in the Barycz Valley. During the period analyzed, thirty-three requests for financial aid were made, all pertaining to the Union Priority 4, mostly for internal (Polish) political decisions.
However, notwithstanding the sub-measures officially involved, the requests for public aid were classified by the authors in four categories, depending on the key purpose pursued: education and social inclusion; preservation and maintenance of the environment; productivity enhancement; diversification.
While the last two categories are likely to have some direct impact on the production capacities, and thus on the financial performance ratios of the firms, this might not be the case for the two former categories. The private sector enterprises analyzed, for instance, recorded an increase in their assets compared to the base year. The increase in the assets value along with a simultaneous decrease in the liquidity ratio may prove undertaking investments in fixed assets. In terms of categories of measures involved, the shares dedicated to the last two categories, are respectively, 56% (X) and 44% (Y).
Conversely, 9 out of the 15 requests for the public sector firm’s financial aid are oriented towards the first two categories (60%). When considering the amounts involved, the share represented by the first two categories is even higher (67%; around PLN 4.2 million on 6.3 million for this company in total). As a result, “enterprise X” (public sector) recorded profits only in 2012 and 2013. The value of its assets, in the analyzed period, fluctuated compared to 2012, reaching the lowest value in 2016. The decrease in assets value indicates that the funds received in the form of public aid were more used to cover the current operating costs (e.g., “Maintaining biodiversity in the Stawy Milickie nature reserve”) rather than investments in fixed, tangible assets.
A part of this apparent lack of effectiveness can be explained by the fact that several measures are not oriented towards an increase in production capacities, but actually towards educational and environmental actions. In other words, it can be concluded from this research that traditional financial performance ratios cannot fully capture such environmental and social benefits provided by public aids, despite the fact that, at least for some of them, these measures are likely to improve the social welfare in the area.
When conducting ex-post analysis of financial supports, considering only the official title of the (sub) measures might thus generate a biased picture of the situation. Often, additional or fine-tuned typology, based on the exact purpose of the measure, can provide useful complementary information regarding the impacts of financial supports, not only on the firms, but also on the society as a whole.
Another finding of this research consists of the fact that very few inland aquaculture Polish farms have requested public aid, which can be explained by the fragmentation of the sector, as well by a lack of knowledge about the potential measures to be developed.
The authors believe that any research limitations attributed to the small sample size have been reduced by adopting “the typical farm approach” and should not, therefore, distract from the paper’s importance in filling a perceived gap in the literature.
Author Contributions
Conceptualization, M.R., B.l.G. and M.K.-M.; methodology M.R., B.l.G.; M.K.-M. and E.K.-S., formal analysis, M.R.; investigation, M.R.; resources, M.R. and K.R.; writing—original draft preparation, M.R., B.l.G., M.K.-M., K.R. and E.K.-S.; writing—review and editing, M.R. and B.l.G.; visualization, M.R.; project administration, M.R. All authors have read and agreed to the published version of the manuscript.
Funding
This research received no external funding.
Institutional Review Board Statement
Not applicable.
Informed Consent Statement
Informed consent was obtained from all subjects involved in the study.
Data Availability Statement
The data presented in this study are available on request from the corresponding author.
Acknowledgments
The authors would like to express their gratitude to all the respondents participating in the study.
Conflicts of Interest
The authors declare no conflict of interest.
Appendix A. Projects Co-Funded from the EU Funds in the Years 2007–2015 Allocated to Carp Farms in the Barycz Valley
| Project Title | Funding Value
[PLN] |
| Organization of trainings for students in the field of ecological education and fishing tradition using the necessary equipment to conduct workshops | 18,691.99 |
| Promotion of the tourist attractions including services and regional products of the Barycz Valley at fairs and other events using a mobile exhibition system | 18,138.40 |
| Promotion of the local cultural and historical heritage of the Barycz Valley through the publication: “Secrets of the Barycz Valley”, presenting unusual stories and fishing traditions of the region, exceptional regional products and unique natural values of the area | 21,446.75 |
| Construction and equipment of the fish processing plant in the company Stawy Milickie S.A. | 450,000.00 |
| Providing the company Stawy Milickie S.A. with the equipment for transporting and selling fish | 450,000.00 |
| Purchase of a new specialized fish transport vehicle and equipment for the direct sales market stall | 97,344.49 |
| Transportable fish gutter with a refrigerated vehicle | 60,625.69 |
| Purchase of the necessary equipment for the Social Fishing Guard of Kazimierz Grzemski Fishing Farm | 121,153.40 |
| Reorientation of an agro-fishing farm into direct sales of fishing products | 229,294.78 |
| Purchase of equipment and gear for the Social Fishing Guard of the Fishing Farm in Możdżanów | 139,501.88 |
| Adding value to fishing products and developing services for the local community by opening a mobile direct fish selling point | 87,120.00 |
| Strengthening competitiveness and maintaining the attractiveness of the areas dependent on fisheries by reconstructing the pond for the needs of the fishery including land development | 463,973.97 |
| Diversification and professionalization of economic activities focused on fish farming and opening of a new workplace | 61,656.50 |
| Construction of fisherman’s house with land development and purchase of equipment for the needs of developing the farm offer and direct sales | 296,400.00 |
| Construction of a building for gastronomic and tourist purposes including the equipment necessary to start the business for the implementation of an undertaking aimed at the reorientation of the conducted business activity | 450,000.00 |
| Development of the live fish sales system by purchasing specialized equipment for transporting and selling fish | 300,000.00 |
| Development of the system for selling fisheries products by purchasing the equipment for packaging and distribution of fish processing products | 285,186.00 |
| Maintaining biodiversity in the Stawy Milickie nature reserve | 842,640.90 |
| Construction of a small tourist and recreation infrastructure including the Museum of Fishing Traditions of the Milicz Ponds and the Barycz Valley in Ruda Sułowska | 1,500,000.00 |
| Equipping mobile educational stations for carrying out workshops focused on ecological education and popularizing fisheries for primary and secondary school students and also preparing a film about the history and fishing traditions of the Milicz Ponds and the Barycz Valley | 699,009.04 |
| Maintaining biodiversity in the Stawy Milickie nature reserve—Potasznia complex | 1,000,000.00 |
| “Stawy Milickie” safe nature reserve | 98,634.00 |
| Purchase of the equipment and gear for the Social Fishing Guard of J. K. Raftowicz Fishing Farm in Ruda Żmigrodzka | 166,111.00 |
| Diversification of the fishing farm activities for the purposes of integrated Milicz carp production | 276,906.00 |
| Establishment of a gastronomic and accommodation tourist base aimed at the economic activity reorienting and diversifying the employment of people working in the fisheries sector | 450,000.00 |
| Protection of pond dikes against beavers at the Fishing Farm in Ruda Żmigrodzka, the area covered by Natura 2000 | 735,039.00 |
| Reconstruction of the pond for the needs of a fishing ground, a scrubber building and a plot development to prepare a tourist offer based on the fishing traditions of the area | 624,420.20 |
| Purchase of the equipment and gear for the Social Fishing Guard at the fishing farms in Stawczyk | 149,014.00 |
| Construction of a wooden building—a hardstanding shed, lighting, fencing of the area and exits from the public road for the purposes of a direct sales point and its equipment including the purchase of a new specialized means of transporting fish with accessories and gear | 156,127.41 |
| Development of a small tourist infrastructure for the fishery service including the facility equipment to develop an offer based on the fishing and architectural traditions of the area | 874,572.67 |
| Purchase of a gastronomic trailer and a backhoe loader with equipment | 220,705.22 |
| Fishery service building and land development | 450,000.00 |
| Renovation of a warehouse at the fishing farm with its adaptation to retail sale | 300,000.00 |
| Purchase of machines and a means of transport for fish production | 228,065.23 |
| Diversification and professionalization of economic activities focused on fish farming and opening of a new workplace | 104,236.18 |
| Preservation and protection of the areas covered by special forms of nature protection, including Natura 2000 in the area of the Local Action Group Partnership for the Barycz Valley by purchasing equipment and gear for the Social Fishing Guard | 286,850.00 |
| Protection of pond dikes against beavers at the Fishing Farm in Ruda Żmigrodzka, the area covered by Natura 2000 | 955,947.76 |
| Renovation and adaptation of the tower for a vantage point with an exhibition presenting fishing culture | 161,853.54 |
| Purchase of a machine for clearing rivers and drainage ditches in the area of the Local Action Group Partnership for the Barycz Valley aimed at reservoirs and watercourses reclamation and maintenance | 459,000.00 |
| Construction of small infrastructure medium-sized barbecue shelter, roofing with a barbecue at the fishery and an information board for the fishing complex in Kaszów, Milicz municipality | 50,000.00 |
| Source: Based on [47]. |
Appendix B. Questionnaire for the Farm Y and Z
Balance:
Total assets:
Equity
- -
registered capital
- -
profit/loss
Liabilities
- -
Long-term liabilities, including:
- -
Loans
- -
Short-term liabilities, including:
- -
Loans
- -
Liabilities to contractors
Total liabilities:
Profit and loss account:
Sales revenue
Operating costs, including:
- -
Investments
- -
Depreciation
Other income, including:
Other operating cost:
Financial income
Financial costs, including:
- -
Interest
- -
Gross profit/Gross loss
- -
Income tax
Net profit/Net loss
References
- Stiglitz, J.E. The Economic Role of the State; Blackwell Publishers: Oxford, UK, 1989; p. 145. [Google Scholar]
- Kożuch, M. Pomoc Publiczna. Doświadczenia Wybranych Sektorów Gospodarki (Public Aid. Experiences of the Selected Economy Sectors); Cracow University of Economics: Cracow, Poland, 2017; p. 12. [Google Scholar]
- Stiglitz, J.E. Freefall: America, Free Markets, and the Sinking of the World Economy; W.W. Norton & Company: New York, NY, USA, 2010. [Google Scholar]
- European Commission. Aid to Fisheries and Aquaculture in Current Prices, State Aid Scoreboard 2018. Available online: https://ec.europa.eu/competition/state_aid/scoreboard/state_aid_scoreboard_2018.pdf (accessed on 4 May 2021).
- Tobin, J. Cycles in macroeconomic theory. Indian Econ. Rev. 2019, 54, 159–178. [Google Scholar] [CrossRef]
- Drucker, P.F. Toward the Next Economics. The Public Interest; National Affairs Inc.: Washington, DC, USA, 1990; Special Issue: The Crisis in Economic Theory; pp. 4–18. [Google Scholar]
- Mankiw, G.; Taylor, M.P. Economics; Cengage Learning EMEA: London, UK, 2006; p. 5. [Google Scholar]
- Chamberlin, E. Theory of Monopolistic Competition; Harvard University Press: Cambridge, UK, 1933. [Google Scholar]
- Bain, J. Barriers to New Competition: Their Character and Consequences in Manufacturing Industries; Harvard University Press: Cambridge, MA, USA, 1956. [Google Scholar]
- Stigler, G.J. A Theory of Oligopoly. J. Political Econ. 1964, 72, 44–61. [Google Scholar] [CrossRef]
- Keynes, J. The General Theory of Employment, Interest and Money. Available online: https://www.files.ethz.ch/isn/125515/1366_KeynesTheoryofEmployment.pdf (accessed on 4 May 2021).
- Nicolaides, P. The Economics of Granting and Controlling State Aid. In EC State Aids; Hancher, L., Ottervanger, T., Slot, P.J., Eds.; Sweet & Maxwell: London, UK, 2006; p. 18. [Google Scholar]
- Kaupa, C. The More Economic Approach? A Reform based on Ideology? Eur. State Aid Law Q. 2009, 8, 12. [Google Scholar] [CrossRef]
- Utton, M. The Likely Impact of Deregulation on Industrial Structures and Competition in the Community; European Commission: Luxembourg, 1987; Final Report by Economists Advisory Group Ltd.; p. 19. [Google Scholar]
- Eaton, J.; Grossman, G.M. Optimal Trade and Industrial Policy under Oligopoly. Q. J. Econ. 1986, 101, 383–406. [Google Scholar] [CrossRef] [Green Version]
- Borkowski, A. Pomoc publiczna jako funkcja państwa wobec społecznej gospodarki rynkowej (Public Aid as a function of the state in relation to social market economy). Przegląd Prawa Adm. (Rev. Law Adm.) 2017, 103, 13–24. [Google Scholar]
- Szydło, M. Wolność Działalności Gospodarczej Jako Prawo Podstawowe (Freedom of Economic Activity as the Fundamental Right); Branta: Bydgoszcz, Poland, 2011. [Google Scholar]
- Szydło, M. Pomoc Publiczna dla Przedsiębiorców i Jej Nadzorowanie (Public Aid for Entrepreneurs and Its Supervision); Borkowski, A., Ed.; Administracyjne Prawo Gospodarcze (Administrative Business Law): Wrocław, Poland, 2009; pp. 530–532. [Google Scholar]
- Schina, D. State Aids under the EEC Treaty, Articles 92 to 94; ESC: Oxford, UK, 1987; p. 13. [Google Scholar]
- Dupont, A.S.; Tumasonyte, E. Regional aid. In EU Competition Law: Vol IV: State Aid; Mederer, W., Pesaresi, N., Van Hoof, M., Eds.; Claeys & Casteels Publishing: Leuven, Belgium, 2008; p. 1011. [Google Scholar]
- Report of the United Nations Conference on Environment and Development. Available online: https://www.un.org/esa/documents/ga/conf151/aconf15126-1.htm (accessed on 4 May 2021).
- Werner, P.; Verouden, V. EU State Aid Control: Law and Economics; Kluwer Law International: Amsterdam, The Netherlands, 2016. [Google Scholar]
- Sjåfjell, B.; Wiesbrock, A. Sustainable State Aid: A Full Environmental Integration into the EU’s State Aid Rules? Available online: https://papers.ssrn.com/sol3/papers.cfm?abstract_id=2535277 (accessed on 4 May 2021).
- Ali-Yrkkö, J. Impact of Public R&D Financing on Employment. Available online: https://www.econstor.eu/bitstream/10419/63818/1/487847199.pdf (accessed on 4 May 2021).
- Rutkiewicz, K. STATE AID FOR RESEARCH, DEVELOPMENT AND INNOVATION IN THE EUROPEAN UNION COMPETITION POLICY. Èkon. Prawo 2015, 14, 19–32. [Google Scholar] [CrossRef] [Green Version]
- Sherr, I.; Miclotte, K.; Fawcett-Feuillette, R. Support of Small and Medium-Sized Enterprises under European State Aid Law. In Small and Medium-Sized Enterprises in International Economic Law; Rensmann, T., Ed.; Oxford University Press: Oxford, UK, 2017. [Google Scholar]
- Biondi, A.; Eeckhout, P.; Flynn, J. The Law of State Aid in the European Union. Available online: https://0-oxford-universitypressscholarship-com.brum.beds.ac.uk/view/10.1093/acprof:oso/9780199265329.001.0001/acprof-9780199265329 (accessed on 4 May 2021).
- Greenfeld, A.; Becker, N.; Bornman, J.F.; dos Santos, M.J.; Angel, D. Consumer preferences for aquaponics: A comparative analysis of Australia and Israel. J. Environ. Manag. 2020, 257, 109979. [Google Scholar] [CrossRef]
- Brummett, R.E.; Beveridge, M.C.M.; Cowx, I.G. Functional aquatic ecosystems, inland fisheries and the Millennium Development Goals. Fish. Fish. 2012, 14, 312–324. [Google Scholar] [CrossRef]
- Food and Agriculture Organization (FAO). The State of World Fisheries and Aquaculture 2018—Meeting the Sustainable Development Goals. Available online: http://www.fao.org/3/i9540en/i9540en.pdf (accessed on 4 May 2021).
- Bridson, P.B.; Stoner, J.M.; Fransen, M.H.; Ireland, J. The aquaculture sustainability continuum—Defining an environmental performance framework. Environ. Sustain. Indic. 2020, 8, 100050. [Google Scholar] [CrossRef]
- Consolidated Version of the Treaty on the Functioning of the European Union, Art. 38 Para. 1. Available online: https://eur-lex.europa.eu/legal-content/EN/TXT/?uri=celex%3A12012E%2FTXT (accessed on 4 May 2021).
- European Court of Justice, No. 141/78 (ECR 1978, 417). Judgment of the Court of 4 October 1979. French Republic v United Kingdom of Great Britain and Northern Ireland. Sea Fisheries. Case 141/78., European Court Reports 1979 -02923. Available online: https://eur-lex.europa.eu/legal-content/EN/TXT/?uri=CELEX%3A61978CJ0141 (accessed on 4 May 2021).
- Council Regulation EC, No. 104/2000 of 17 December 1999 on the Common Organisation of the Markets in Fishery and Aquaculture Products. Available online: https://eur-lex.europa.eu/legal-content/en/ALL/?uri=CELEX%3A32000R0104 (accessed on 4 May 2021).
- Commission Regulation (EC) No 736/2008 of 22 July 2008 on the Application of Articles 87 and 88 of the Treaty to State Aid to Small and Medium-Sized Enterprises Active in the Production, Processing and Marketing of Fisheries Products. Available online: https://eur-lex.europa.eu/LexUriServ/LexUriServ.do?uri=OJ:L:2008:201:0016:0028:EN:PDF (accessed on 4 May 2021).
- European Maritime and Fisheries Fund—Operational Programme for Poland. Available online: https://ec.europa.eu/oceans-and-fisheries/publications/european-maritime-and-fisheries-fund-2014-2020_en (accessed on 4 May 2021).
- OECD. Financial Support to Fisheries, Implications for Sustainable Development. 2006. Available online: https://0-www-oecd--ilibrary-org.brum.beds.ac.uk/agriculture-and-food/financial-support-to-fisheries_9789264036642-en (accessed on 17 February 2021).
- OECD. Environmentally Harmful Subsidies, Policy Issues and Challenges. 2003. Available online: https://www.cbd.int/financial/fiscalenviron/g-subsidyharmful-oecd.pdf (accessed on 17 February 2021).
- Raftowicz, M.; le Gallic, B. Inland aquaculture of carps in Poland: Between tradition and innovation. Aquaculture 2020, 518, 1–8. [Google Scholar] [CrossRef]
- Raftowicz-Filipkiewicz, M. Konkurencyjność małych gospodarstw rybackich na Dolnym Śląsku na przykładzie GR „Ruda Żmigrodzka” (Competitiveness of Small Fish arms in Lower Silesia, the case of “Ruda Żmigrodzka” Fish Farm). Rocz. Nauk. Stowarzyszenia Ekon. Rol. Agrobiz. (Ann. Assoc. Agric. Agribus. Econ.) 2011, 13, 387–391. [Google Scholar]
- Community-led Local Development Strategy (LDS) for the Barycz Valley Covering the Years 2016–2022. Available online: http://projekty.barycz.pl/files/?id_plik=1971 (accessed on 6 January 2020).
- Duś, J. Stawy milickie—Historia i stan obecny (The Milicz ponds—History and Current Status). In Ochrona Przyrody w Parku Kra-Jobrazowym, Dolina Baryczy” Stan Obecny, Zagrożenia, Perspektywy (Nature Protection in the “Barycz Valley” Landscape Park Current Status, Threats, Perspectives); Krukowski, M., Drabiński, A., Eds.; Wrocław University of Environmental and Life Sciences Press: Wrocław, Poland, 2009; p. 26. [Google Scholar]
- Szymańska, J. Rynek ryb w Polsce (Fish market in Poland) In Ekonomika Handlu Żywnością i Produktami Rolnymi (Economics of Trade in Food and Agricultural Products); Urban, S., Olszańska, A., Eds.; Wrocław University of Economics Press: Wrocław, Poland, 2015; pp. 318–319. [Google Scholar]
- Tańska-Hus, B. Realizacja przekształceń własnościowych i strukturalnych w rolnictwie Dolnego Śląska (The Implementation of Ownership and Structural Transformations in Agriculture in Lower Silesia) In Agrobiznes a Zrównoważony Rozwój Obszarów Wiejskich (Agribusiness vs. Sustainable Development of Rural Areas); Kapusta, F., Ed.; University of Economics in Wrocław Press: Wrocław, Poland, 2008; pp. 210–215. [Google Scholar]
- Raftowicz, M.; Kalisiak-Mędelska, M.; Struś, M. Redefining the Supply Chain Model on the Milicz Carp Market. Sustainability 2020, 12, 2934. [Google Scholar] [CrossRef] [Green Version]
- Commission Implementing Decision (EU) 2016/1251 of 12 July 2016 Adopting a Multiannual Union Programme for the Collection, Management and Use of Data in the Fisheries and Aquaculture Sectors for the Period 2017-2019 (Notified under Document C (2016) 4329). Available online: https://eur-lex.europa.eu/legal-content/EN/TXT/?uri=CELEX:32016D1251 (accessed on 4 May 2021).
- Feuz, D.M.; Skold, M.D. Typical Farm Theory in Agricultural Research. J. Sustain. Agric. 1992, 2, 43–58. [Google Scholar] [CrossRef] [Green Version]
- Lasner, T.; Brinker, A.; Nielsen, R.; Rad, F. Establishing a benchmarking for fish farming—Profitability, productivity and energy efficiency of German, Danish and Turkish rainbow trout grow-out systems. Aquac. Res. 2016, 48, 3134–3148. [Google Scholar] [CrossRef]
- Lasner, T.; Mytlewski, A.; Nourry, M.; Rakowski, M.; Oberle, M. Carp land: Economics of fish farms and the impact of re-gion-marketing in the Aischgrund (DEU) and Barycz Valley (POL). Aquaculture 2020, 519, 734731. [Google Scholar] [CrossRef]
- ARMIR. Available online: https://www.arimr.gov.pl/programy-2002-2013/program-operacyjny-ryby-2007-2013.html (accessed on 6 January 2020).
- Program Operacyjny „Rybactwo i Morze” (PO RYBY 2014–2020). Available online: https://www.gov.pl/web/rolnictwo/program-po-ryby (accessed on 6 January 2020).
- Partnerstwo dla Doliny Baryczy. Projekty (Projects). Available online: http://projekty.barycz.pl/mapa/index.php?p=1&_search=1&s_strategia=0&s_sektor=1&s_gmina=0 (accessed on 6 January 2020).
- Sierpińska, M.; Jachna, T. Ocena Przedsiębiorstwa Według Standardów Światowych (Enterprise Assessment in Accordance with the Global Standards); Polish Scientific Publishers PWN: Warsaw, Poland, 1997; pp. 80–81. [Google Scholar]
- Brigham, E.F.; Houston, J.F. Podstawy Zarządzania Finansami (Fundamentals of Financial Management); Polish Economic Publishers PWE: Warsaw, Poland, 2005; p. 108. [Google Scholar]
- Rutkowski, A. Zarządzanie Finansami (Finance Management); Polish Economic Publishers PWE: Warsaw, Poland, 2007; p. 87. [Google Scholar]
- Mozumder, M.M.H.; Shamsuzzaman, M.; Nabi, R.-U.; Karim, E. Social-ecological dynamics of the small scale fisheries in Sundarban Mangrove Forest, Bangladesh. Aquac. Fish. 2018, 3, 38–49. [Google Scholar] [CrossRef]
- Dresner, S. The Principles of Sustainability; Earthscan: London, UK, 2008. [Google Scholar]
- Caputo, F.; Buhnova, B.; Walletzký, L. Investigating the role of smartness for sustainability: Insights from the Smart Grid domain. Sustain. Sci. 2018, 13, 1299–1309. [Google Scholar] [CrossRef]
- Costanza, R.; Patten, B.C. Defining and predicting sustainability. Ecol. Econ. 1995, 15, 193–196. [Google Scholar] [CrossRef]
- Caputo, F.; Carrubbo, L.; Sarno, D. The Influence of Cognitive Dimensions on the Consumer-SME Relationship: A Sustainability-Oriented View. Sustainability 2018, 10, 3238. [Google Scholar] [CrossRef] [Green Version]
- Bunker, S.G.; Hawken, P. The Ecology of Commerce: A Declaration of Sustainability. Contemp. Sociol. A J. Rev. 1995, 24, 371. [Google Scholar] [CrossRef]
- Schaltegger, S.; Wagner, M. Integrative management of sustainability performance, measurement and reporting. Int. J. Account. Audit. Perform. Eval. 2006, 3, 1–19. [Google Scholar] [CrossRef]
Figure 1.
Distribution of funds under the European Maritime and Fisheries Fund in the programming period 2014–2020 in European Union countries [EUR]. Source: Authors’ compilation based on [
36].
Figure 1.
Distribution of funds under the European Maritime and Fisheries Fund in the programming period 2014–2020 in European Union countries [EUR]. Source: Authors’ compilation based on [
36].
Figure 2.
The map of Barycz Valley.
Figure 2.
The map of Barycz Valley.
Figure 3.
The amounts of money involved (in PLN) for each sub-category and for each of the 6 carp farms that requested public support. Source: Authors’ compilation based on [
52].
Figure 3.
The amounts of money involved (in PLN) for each sub-category and for each of the 6 carp farms that requested public support. Source: Authors’ compilation based on [
52].
Figure 4.
The regression model of the financial liquidity in enterprise X. Source: Authors’ compilation based on the data provided by enterprises.
Figure 4.
The regression model of the financial liquidity in enterprise X. Source: Authors’ compilation based on the data provided by enterprises.
Figure 5.
The regression model of the financial liquidity in enterprise Z. Source: Authors’ compilation based on the data provided by enterprises.
Figure 5.
The regression model of the financial liquidity in enterprise Z. Source: Authors’ compilation based on the data provided by enterprises.
Figure 6.
The regression model of the profitability in enterprise X. Source: Authors’ compilation based on the data provided by enterprises.
Figure 6.
The regression model of the profitability in enterprise X. Source: Authors’ compilation based on the data provided by enterprises.
Figure 7.
The regression model of the profitability in enterprise Z. Source: Authors’ compilation based on the data provided by enterprises.
Figure 7.
The regression model of the profitability in enterprise Z. Source: Authors’ compilation based on the data provided by enterprises.
Table 1.
The value of submitted applications, allocation structure and the level of contracted funds under the OP Fisheries and Sea in Poland for the years 2014–2020 (status on 12 December 2017).
Table 1.
The value of submitted applications, allocation structure and the level of contracted funds under the OP Fisheries and Sea in Poland for the years 2014–2020 (status on 12 December 2017).
| Priority | Value of Applications [Million EUR] | Allocation Structure | Value of Contracted Funds [Million EUR] | Allocation Level | Budget
[Million EUR] |
|---|
| Axis 1. Promoting environmentally sustainable, resource-efficient, innovative, competitive and knowledge-based fisheries | 116.2 | 64% | 30.2 | 17% | 130.2 |
| Axis 2. Supporting environmentally sustainable, resource-efficient, innovative, competitive and knowledge-based aquaculture | 149.7 | 60% | 3.3 | 1% | 201.7 |
| Axis 3. Supporting the implementation of CAP provisions | 12.9 | 46% | 4.9 | 17% | 23.6 |
| Axis 4. Increasing employment and territorial cohesion | 34.5 | 39% | 7.4 | 8% | 79.7 |
| Axis 5. Fostering marketing and processing | 33.2 | 44% | 0.9 | 1% | 61.6 |
Table 2.
Fisheries identified by LAG in the Barycz Valley based on the submitted RRW-22 reports for 2014.
Table 2.
Fisheries identified by LAG in the Barycz Valley based on the submitted RRW-22 reports for 2014.
| Municipality | Number of Fisheries | Area of Fishing Ponds
[in ha] | Production Value Measured in Revenue from Fishing Activities Including the Total Production Value
[in PLN] | Number of Permanent Employees |
|---|
| Cieszków | 4 | 131.61 | 492,504.74 | 8 |
| Krośnice | 4 | 24.70 | 110,044.00 | 3 |
| Milicz | 11 | 6442.59 | 18,664,537.80 | 229 |
| Przygodzice | 1 | 659.90 | 2,503,780.00 | 14 |
| Sośnie | 1 | 322.13 | 2,322,130.00 | 7 |
| Twardogóra | 3 | 496.31 | 83,800.00 | 2 |
| Żmigród | 2 | 176.21 | 1,172,170.02 | 8 |
| Razem | 26 | 8253.45 | 25,348,966.56 | 271 |
Table 3.
Year of activity commencement, fishery size, water surface area and average annual production of fisheries.
Table 3.
Year of activity commencement, fishery size, water surface area and average annual production of fisheries.
| Fishery | Year of Activity Commencement | Fishery Size [ha] | Water Surface Area [ha] | Average Annual Production in a Fishery [ton] | Value of Public Aid Granted in the Years [PLN] |
|---|
| X | 1950 | 6575.6 | 6114.6 | 1500 | 6,331,935 |
| Y | 1991 | 175 | 166 | 53 | 3,508,424 |
| Z | 1998 | 320 | 285 | 160 | 2,099,997 |
Table 4.
Number of measures involved in 4.1.1–4.1.4 on carp farms in Barycz Valley.
Table 4.
Number of measures involved in 4.1.1–4.1.4 on carp farms in Barycz Valley.
| |
Title
|
Number of Measures Listed
|
|---|
|
4.1.1
| Aid in implementation of operations of strengthening competitiveness and maintaining attractiveness of fisheries areas. |
4 (3 + 1 rejected)
|
|
4.1.2
| Aid in implementation of operations of restructuring or reorienting the economic activity or diversification of employment of people whose work is linked to the fisheries sector by creating additional jobs outside that sector. |
7
|
|
4.1.3
| Aid in implementation of operations of increasing the value of the products of fisheries, development of services for the community living in the fisheries area. |
6 (4 + 2 withdrawn)
|
|
4.1.3.
| Sub-category related to measures listed under P1.1, P1.2 and P1.3: “Implementation of local development strategies” for “small projects”, i.e., operations that do not meet the conditions for granting aid under Axis 3 measures, but contribute to the achievement of the objectives of this Axis, covered by the Rural Development Programme (RDP 2007–2013). |
5
|
|
4.1.4
| Aid in implementation of operations of protection of the environment or natural heritage in fisheries areas to maintain their attractiveness or to restore the fisheries sector production potential in case of its damage by a natural disaster. |
11 (8 + 3 rejected)
|
Table 5.
Amounts of the public aid received for the 6 firms (A, B, C and X, Y, Z).
Table 5.
Amounts of the public aid received for the 6 firms (A, B, C and X, Y, Z).
| Sub-Measures | Amounts (in PLN) |
|---|
| 4.1.1. | 2,968,652 |
| 4.1.2. | 3,237,611 |
| 4.1.3. | 1,560,932 |
| Small Projects | 149,896 |
| 4.1.4. | 4,208,042 |
| In total | 12,125,132 |
Table 6.
Amounts of the request for public aid by main purpose; only for the 3 most important firms (X, Y and Z).
Table 6.
Amounts of the request for public aid by main purpose; only for the 3 most important firms (X, Y and Z).
| Diversification | 1,369,757 |
| Productivity | 2,706,371 |
| Environment | 3,986,063 |
| Education | 2,282,286 |
| Total | 10,344,477 |
Table 7.
Current and quick financial liquidity ratios of the analyzed enterprises.
Table 7.
Current and quick financial liquidity ratios of the analyzed enterprises.
| YEAR | Public Sector | Private Sector |
|---|
| Enterprise X | Enterprise Y | Enterprise Z |
|---|
| Current Liquidity Ratio | Quick Liquidity Ratio | Current Liquidity Ratio | Quick Liquidity Ratio | Current Liquidity Ratio | Quick Liquidity Ratio |
|---|
| 2012 | 28.82 | 27.61 | 337.67 | 281.00 | 202.60 | 168.60 |
| 2013 | 23.41 | 20.45 | 261.38 | 202.05 | 165.37 | 125.81 |
| 2014 | 5.57 | 4.88 | No data | No data | 186.04 | 141.54 |
| 2015 | 5.10 | 4.32 | No data | No data | 212.61 | 161.76 |
| 2016 | 2.61 | 2.11 | 95.00 | 51.00 | 94.00 | 50.00 |
Table 8.
Return on assets and return on sales ratios of the analyzed enterprises.
Table 8.
Return on assets and return on sales ratios of the analyzed enterprises.
| YEAR | Public Sector | Private Sector |
|---|
| Enterprise X | Enterprise Y | Enterprise Z |
|---|
| ROS | ROA | ROS | ROA | ROS | ROA |
|---|
| 2012 | 4.51 | 0.13 | 0.12 | 0.01 | 0.46 | 0.35 |
| 2013 | 0.5 | 0.02 | −0.49 | −0.03 | 0.91 | 0.50 |
| 2014 | −2.33 | −0.11 | 1.10 | No data | −0.80 | −0.04 |
| 2015 | −1.95 | −0.10 | −2.48 | No data | 0 | 0 |
| 2016 | −1.70 | −0.10 | 0.22 | 0.01 | −0.20 | −0.12 |
Table 9.
Debt of the analyzed enterprises and the increase in their total assets (2012 = 100).
Table 9.
Debt of the analyzed enterprises and the increase in their total assets (2012 = 100).
| YEAR | Public Sector | Private Sector |
|---|
| Enterprise X | Enterprise Y | Enterprise Z |
|---|
| Debt-to-Asset Ratio | Assets Increase | Debt-to-Asset Ratio | Assets Increase | Debt-to-Asset Ratio | Assets Increase |
|---|
| 2012 | 0.02 | 100 | 0.0 | 100 | 0.0 | 100 |
| 2013 | 0.03 | 104.46 | 0.0 | 104.16 | 0.0 | 142.57 |
| 2014 | 0.05 | 92.90 | No data | No data | 0.0 | 147.11 |
| 2015 | 0.15 | 103.81 | No data | No data | 0.0 | 162.85 |
| 2016 | 0.15 | 88.94 | 0.0 | 113.81 | 0.0 | 124.82 |
| Publisher’s Note: MDPI stays neutral with regard to jurisdictional claims in published maps and institutional affiliations. |
© 2021 by the authors. Licensee MDPI, Basel, Switzerland. This article is an open access article distributed under the terms and conditions of the Creative Commons Attribution (CC BY) license (https://creativecommons.org/licenses/by/4.0/).


 ,
, 


