
Analysis of Intersection Traffic Safety in the City of San Antonio, 2013–2017


1
Department of Civil and Environmental Engineering, University of Texas at San Antonio, San Antonio, TX 78249, USA
2
The City of San Antonio, San Antonio, TX 78205, USA
*
Author to whom correspondence should be addressed.
Sustainability 2021, 13(9), 5296; https://0-doi-org.brum.beds.ac.uk/10.3390/su13095296
Submission received: 31 March 2021
/
Revised: 5 May 2021
/
Accepted: 6 May 2021
/
Published: 10 May 2021
Abstract
:An understanding of the contributing factors to severe intersection crashes is crucial for developing countermeasures to reduce crash numbers and severity at high-risk crash locations. This study examined the variables affecting crash incidence and crash severity at intersections in San Antonio over a five-year period (2013–2017) and identified high-risk locations based on crash frequency and injury severity using data from the Texas Crash Record and Information System database. Bivariate analysis and binary logistic regression, along with respective odds ratios, were used to identify the most significant variables contributing to severe intersection crashes by quantifying their association with crash severity. Intersection crashes were predominantly clustered in the downtown area with relatively less severe crashes. Males and older drivers, weekend driving, nighttime driving, dark lighting conditions, grade and hillcrest road alignment, and crosswalk, divider and marked lanes used as traffic control significantly increased crash severity risk at intersections. Prioritizing resource allocation to high-risk intersections, separating bicycle lanes and sidewalks from the roadway, improving lighting facilities, increasing law enforcement activity during the late night hours of weekend, and introducing roundabouts at intersections with stops and signals as traffic controls are recommended countermeasures.
1. Introduction
Intersections are where vehicles and road users in a roadway network converge, representing planned points of traffic conflict. They often impose a major responsibility on road users to make an informed decision on when to cross the road to forestall unsafe situations. This part of the road has one of the most complicated traffic situations that road users will come across. Negligent, high-speed drivers who often disregard traffic signals further compound these situations [1]. In the United States, about one-quarter of road fatalities and about half of all traffic injuries over the last several years occurred at intersections [2]. A study that examined the characteristics of 787,236 motor vehicle intersection crashes from 2005 through 2007, as listed in the dataset from the National Motor Vehicle Crash Causation Survey, showed that 96% of intersection crashes had contributing factors attributed to drivers and less than 3% had contributing factors related to vehicles or the environment [3]. Ensuring the safety of intersections is a complicated issue and cannot always be achieved by only changing or adding signals and signs. A more sustainable solution can be achieved by a national comprehensive program of improved road user’s safety and vehicle intersection management [3]. Proper identification of intersections associated with high crash rates and high severe injury risks is a vital first step to ensuring safer roadways. Texas experienced the highest number of fatal crashes in the United States in 2016 (3406 fatal crashes resulting in 3776 deaths), a 5% increase over 2015 figures. The total vehicle miles traveled in Texas also increased by 5.09% in 2016 (271.263 billion) compared to 2015 (258.122 billion). Over 800 of these deaths occurred at intersections or were related to intersections. In 2016, Bexar County, where the city of San Antonio is located, had the 3rd highest number of incidents in Texas with 52,633 crashes and 220 fatalities [4].
Several factors contribute to intersection crashes including driver-, vehicle-, environment-, and road-related factors. Driver errors are mostly human behavior-related factors, including driving while under the influence of alcohol or drugs, violation of traffic rules and regulations, and being distracted while driving. Road-related factors include traffic volume, geometric design of the intersections, traffic control measures, the state of line markings and signage, and surface and light conditions [5]. Environment-related factors, such as weather conditions and natural lighting conditions, are mostly considered external factors as they are beyond human control. Human factors are the main cause of over 90% of crashes [6]. In general, studies found age and gender of drivers [7,8], the time of day [9,10], drug and alcohol influence [11], road alignment [11], traffic control type [12], speed limit [8], and day of the week [13] to be influential factors in intersection crash severity.
The discipline of transportation safety has evolved to focus on data and analysis, rather than depending solely on standards as stated in FHWA’s Highway Safety Improvement Program Manual. For crash data analysis and safety consideration, three to five years of crash data is generally considered to be sufficient representation. Smaller sample sizes often fail to adequately represent the general trends and might require statistical adjustment [14]. Several techniques are typically used in the analysis of intersection crashes, such as the ordinal probit model [9], the random effect ordered logit model [15], the negative binomial model [16], the random effect negative binomial model [17], and the Bayesian hierarchical binomial logistic model [10]. Negative binomial and random effect negative binomial models account for over-dispersion, but these models are adversely influenced by the low sample mean and cannot handle under-dispersion [18]. While the ordinal probit model accounts for the ordinal nature of the data, they might result in biased or inconsistent parameter estimates and restrict the way variables influence outcome probabilities [19]. Bayesian hierarchical logit models account for within-crash correlations but the correlation results can be difficult to interpret [19]. Logistic regression has been widely used to examine the relationship between response and explanatory variables in traffic crashes [20,21,22,23,24,25,26,27] and crash rates and severity [28]. This study employed logistic regression and the chi-square test to understand the relationship between crash factors and the severity of intersection crashes in San Antonio, Texas, employing a five-year crash data set. Logistic regression can measure associations, predict outcomes, and control for confounding variable effects, while the chi-square test provides robustness and flexibility in data handling and offers ease of computation and detailed information [29,30]. The findings of this study will assist the City of San Antonio in prioritizing the allocation of its resources for high-risk intersections. Understanding the effects of temporal and road characteristic related variables on crash severity will help to identify relatively riskier road segments, efficiently allocate law enforcement resources, and aid the City of San Antonio, the Texas Department of Transportation, and other stakeholders in adopting informed decisions regarding future designs and running campaigns to targeted audiences.
2. Materials and Methods
The crash data for the period of January 2013 to December 2017 was acquired from the Texas Department of Transportation’s (TxDOT) Crash Records Information System (CRIS) database. The database is a collection of all crashes that occurred on Texas roads as reported by law enforcement officers. The crash data documentation is enforced by law, and the data are generally documented in the Texas Peace Officer’s Crash Report (form CR-3). Crash data can be submitted to TxDOT using one of the approved formats: C.R.A.S.H. (an internet-based application), submission services, or paper forms. The CRIS database covers crash records starting from 2003. The law enforcement officer investigating a motor vehicle crash is required to forward a report on crashes which resulted in injury, death or property damage to TxDOT no later than the tenth day after the date of the crash. The CRIS data for each year is categorized into the following files: crash, charge, person, primary person, unit, damage, restriction, and endorsement. CRIS provides the location (geographical coordinates) and time of accidents along with relevant information pertaining to the crash (environmental, driver, and vehicle characteristics). The categories for crash severity in CRIS data are fatal (K), incapacitating or serious injury (A), non-serious injury (B), possible injury (C), and not injured or property damage only (PDO). The injury severity information was not linked to hospital data or any other outside sources and identification of injury severity was based on the judgement of investigating officer, which might result in the misclassification of severity. Crash severity was reported as unknown when severity could not be determined (e.g., hit and run or fled the scene). Crash incidents with missing geographic coordinate information also limited the accuracy of the spatial analysis.
Bivariate analysis (via chi-squared test) was performed for several crash and driver associated variables to check the statistical significance of association between a variable and the severity of intersection crashes. The odds ratios (ORs) for each class within a variable was calculated to determine the strength of association with crash severity.
A heat map of intersection crashes was created to better represent the crash density over the study area using a color scheme with a set of smoothly varying colors representing lower to higher density of crashes [31]. The density calculation included the dynamic raster visualization using the kernel density method which is suitable for visualizing crash data as a continuous surface [32]. The kernel density estimation tool uses the following quartic kernel function:
where = is the kernel function for 2-dimensional . Generally, is the radially symmetric unimodal probability density function [33].
The predicted density at a location is determined by the following formula:
where = are input points or point crashes; = the population field value of point ; and is the distance between point and the location.
The Hot Spot Analysis (Getis-Ord Gi*) was used to identify statistically significant spatial clusters of high values (hot spots) and low values (cold spots). For each input feature, the method created an output feature with a z-score, p-value, and confidence level bin. The underlying null hypothesis of this analysis is complete spatial randomness (CSR) of the features or the values associated with those features. Rejection of the null hypothesis is based on the z-score and the p-value indicating statistically significant clustering or dispersion of features or values associated with features. The p-value indicates the probability of randomness in clustering and the z-scores are standard deviations. A very small p-value along with a very high or low z-score indicates a small probability of a cluster being a product of random distribution. The confidence levels used in the analysis were 90, 95, and 99 percent. To account for multiple tests and the spatial dependence of data, a false discovery rate correction was applied to reduce the critical p-value thresholds that determine the confidence levels. An excessively large search bandwidth produces too smooth a pattern and makes the process of differentiation between local hotspot locations harder, whereas a narrow search bandwidth results in a spiky density pattern highlighting individual hotspot locations. Such results might lead to false conclusions and so a trial and error method was adopted as recommended by previous studies [34,35,36]. A fixed distance band is suitable for point data in conceptualization of spatial relationships and thus the threshold distance was selected as 250 m.
Heat maps from crash density do not necessarily reveal severe crash-prone locations and to identify hot and cold spots based on crash severity, a weight must be provided to each crash based on its severity. Although the compromise approach has been popular, where more severe crashes are provided with greater weight, there is no standard optimum weighting system [37]. Fatal, serious injury, other injury, and property damage only crashes were provided with a severity index of 3.0, 1.8, 1.3, and 1.0, respectively, by the Roads and Traffic Authority of New South Wales [38]. Another study used severity indices of 5.0, 3.0, and 1.0 for fatal, serious, and light injury crashes, respectively [39]. This study attempted to contribute to a safer roadway system by identifying high-risk locations. The severity () of a location was computed by providing greater weight on fatal and serious injury crashes using the following equation:
where X1 is the total number of fatal crashes, X2 is the total number of incapacitating or serious injury crashes, X3 is the total number of non-serious injury crashes, X4 is the total number of possible injury crashes, and X5 is the total number of no injury or property damage only crashes.
A logistic regression model was developed using nine variables which were selected based on literature review and bivariate analysis. The logistic model used crash severity as the response variable and the age of the driver, gender of the driver, time of day, day of the week, season, lighting condition, weather condition, traffic control type, and road alignment as predictor variables. The predictor variables were selected based on their availability in the dataset, effect on crash severity, and use in previous studies [7,10,11,21]. Older and male primary persons, dark lighting conditions, the weekend, nighttime hours, and clear weather were expected to increase the crash severity risk based on the literature described in the introduction. The logit model was used to identify statistically significant classes within the selected variables and the odds ratio was calculated for each significant class to quantify the strength of association in the logit model. For crash severity, death and incapacitating injury associated crashes were classified as severe and the rest were classified as non-severe in the bivariate analysis and logistic regression. In this paper, the logit was the natural logarithm of the odds that the response variable Y was severe (Y = 1) versus non-severe (Y = 0), as shown by Equation (4):
where Q is the probability of severe crashes, Zi is the independent variable, and βi is the model coefficient directly determining the odds ratio. Based on the results from the bivariate analysis, logit model, odds ratio values, and literature review, the selected variables were further analyzed, and the results were represented visually for easy and effective interpretation.
Logit (Q) = In (Q/1-Q) = β0 + β1 × Z1 + … + βi × Zi
3. Results and Discussion
3.1. Spatial Analysis
A total of 73,755 intersection crashes occurred in San Antonio during the five-year study period. These crashes involved 145,263 primary persons (141,627 motor vehicle drivers, 980 motorcyclists, 813 bicyclists, 1471 pedestrians, and 372 persons with an unknown or unreported status). The crash data was classified by crash location and crash severity to evaluate the spatial distribution of crashes and highlight intersections and areas with higher severe crash incidents (Figure 1a,c). The figures show that intersection crashes were highly concentrated around the downtown area and its surroundings (within City Council Districts 8 and 9) as well as the northwestern part of the city (along Loop 410, Loop 1604, Interstate-10, and Interstate-87). Fifty-two (52) intersections had 100 or more crashes each. Some of the intersections with high crash frequencies are shown in Figure 1b. The intersection at Loop 1604 and Bandera Rd is one of the most critical in terms of crash frequency, accounting for almost 400 crashes during the study period (Figure 1b).
The spatial distribution of statistically significant clusters of severe intersection crashes and intersections with higher crash incidents are quite different (Figure 1a,c). Significant severe hotspot locations mostly excluded major intersections with high crash frequencies. City road intersections seemed to have a relatively higher proportion of severe crashes and intersections just outside the city center tended to be riskier in terms of crash severity. Cold spots, in terms of crash severity, were observed at intersections with relatively high crash densities (Figure 1d).
3.2. Bivariate Analysis
The total number of crashes and intersection crashes in San Antonio trended up from 2013 through 2016, but decreased in 2017 (Figure 2a). The year 2016 had an exceptionally high number of crashes and fatality rates across the United States, both in terms of fatalities per 100 million vehicle miles travelled and fatalities per 100,000 population [40]. The average percentage of intersection crashes to total crashes over the study period was around 29% (Figure 2a).
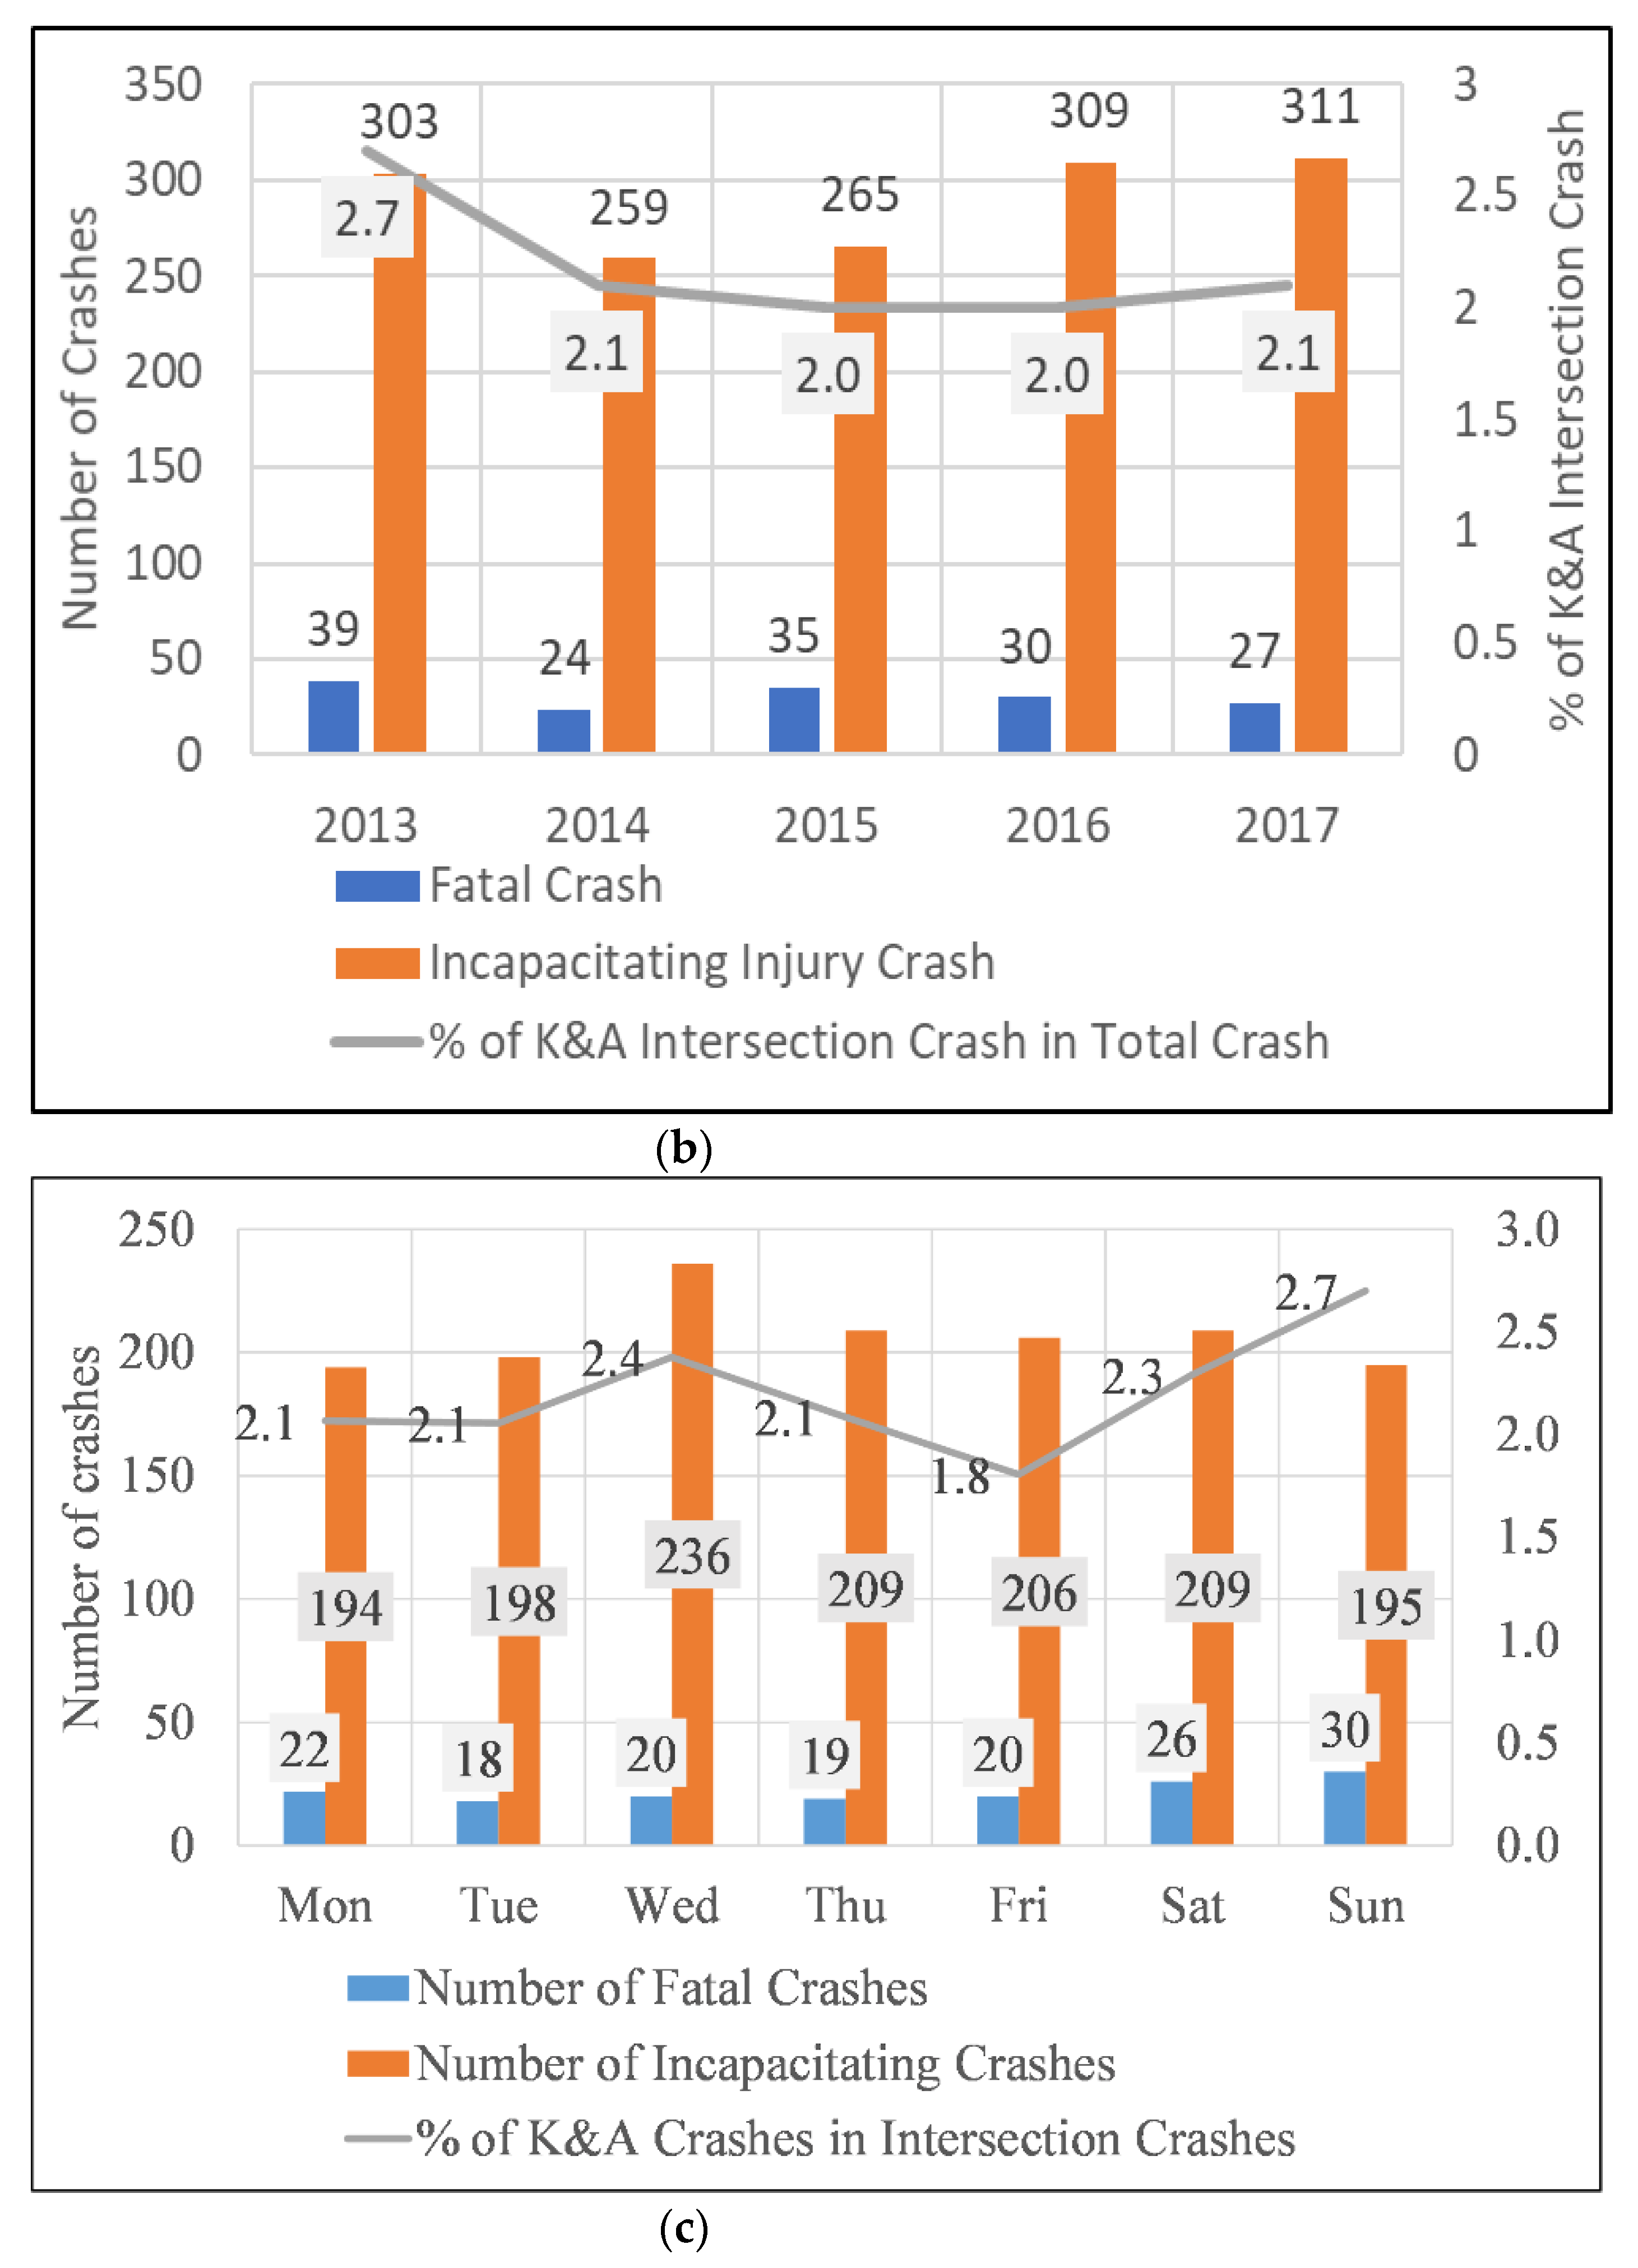
The average percentage of fatal and serious injury crashes in all intersection crashes over the 5 year period was about 2.2%, while 23% of the crashes resulted in possible injury. Driver inattention, failure to yield during left turns, and disregard of stop signs were the primary reasons behind intersection crashes. Intersection related crashes in San Antonio included 155 fatal crashes (20.2% of all fatal crashes) and 1447 serious injury crashes (36.2% of serious injury crashes) during the study period. From 2015, fatal crashes decreased over the years while serious injury crashes increased (Figure 2b). Fatal and serious injury crash counts for each category were determined in addition to chi-squared test results of crash related variables (Table 1,Table 2,Table 3).
The proportion of severe injury was higher for pedestrians (14.7%), bicyclists (7.3%), and motorcyclists (18.2%) compared to motor vehicle drivers (2.0%) at intersections and the difference was statistically significant, X2 (3, N = 144,981) = 2314.5, p = 2.2 × 10⁻¹⁶. Pedestrians, bicyclists, and motorcyclists are generally more exposed in a crash and have fewer protective measures, which results in a higher susceptibility to severe crashes. The analysis suggested that the pattern of intersection crash frequency in San Antonio generally coincided with its overall crash frequency pattern over the hours of the day. Crash frequency was relatively high during 12:00–3:00 p.m. and 3:00–6:00 p.m., while 5:00–6:00 p.m. experienced the peak. Intersection crash frequency gradually decreased during 6:00–9:00 p.m. and 9:00 p.m.–12:00 a.m., but the proportion of intersection crashes in total crashes was relatively high during this period. Both intersection crash frequency and their proportion in total crashes were considerably low during the 12:00–3:00 a.m. and 3:00–6:00 a.m. periods.
This study also attempted to explore the hourly variation of intersection crashes based on seasons and the day of week (weekend and weekday). The day is divided into eight 3 h intervals starting at midnight. The year is divided into four seasons: winter (January, February, and the following December), spring (March to May), summer (June to August), and fall (September to November). For all seasons, the 3:00–6:00 p.m. period had the highest proportion of intersection crashes, possibly due to relatively higher traffic volumes during that period. The summer months had relatively higher proportions of intersection crashes in the afternoon (12:00–3:00 p.m.) and lower intersection crash proportions from 6:00–9:00 a.m. (possibly due to summer not being a school season).
The susceptibility to crashes was influenced by the age and gender of drivers [7]. An analysis of variance (ANOVA) test was performed to check the variation of age of the primary persons (drivers, bicyclists, motorcyclists or pedestrians) involved in intersection crashes with the season of crash occurrence. The descriptive statistics of age of involved primary persons are presented in Table 4. The mean age was higher in the winter season for drivers and bicyclists, in summer for motorcyclists, and in summer and spring for pedestrians (Table 5). When individual months were considered, a higher mean age of vehicle drivers involved in intersection crashes was observed in December and January from the ANOVA test (F(11, 124,295) = 2.64, p = 0.002), probably because older drivers may have difficulty controlling the vehicle during freezing conditions [41]. The mean age was significantly higher in January and February for bicyclists (F(11, 769) = 2.01, p = 0.021) and slightly higher in February and June for motorcyclists (F(11, 930) = 1.19, p = 0.290) involved in intersection crashes. In the case of intersection crashes involving pedestrians, March, June, and July were associated with a higher mean age (F(11, 1427) = 1.91, p = 0.033), probably because older people prefer to limit their activities during cold weather.
Crash severity risk was highest during the first segment (12:00–3:00 a.m.) of the day (131 observed vs. 92 expected severe intersection crashes). Higher volumes of traffic during the 3:00–6:00 p.m. period led to congestion and reduced the overall traffic speed, which might be the reason behind the lower crash severity risk during this period. All 3 h time segments had more intersection crashes on weekdays compared to weekends, except for the 12:00–3:00 a.m. segment. A greater proportion of drunk drivers unable to safely share the road and the relatively high number of vehicles during weekend late night hours might be contributing to this anomaly. The 6:00–9:00 a.m. period during weekends had a much lower frequency of intersection crashes, which might be related to lower traffic volumes.
The number of female licensed drivers is slightly greater than male licensed drivers in Texas [2]. The miles traveled by female drivers might not be directly proportional to their numbers. All the drivers associated with intersection crashes with known age and gender were classified into eight age groups: less than 14, 15–24, 25–34, 35–44, 45–54, 55–64, 65–74, and over 75. The proportion of male drivers to female drivers involved in intersection crashes increased over the age 44 and approximately 48% of all intersection crashes occurred with drivers in the age range of 15–34 years. Licensing laws in Texas require the age of the learner license applicant be at least 15 [42]. However, the intersection crash data included 38 incidents where the driver was aged 14 or less, with 26 (68%) of those incidents committed by male drivers. An ANOVA test was performed to look for a possible significant association of age of primary persons involved in intersection crashes with the day of the week of the crash occurrence. Mean age was greater during the weekend for bicyclists, especially on Sundays (Table 6). This might reflect increased cycling activity of comparatively older bicyclists during the weekend period, possibly for recreational purposes. For motor vehicle drivers, the mean age was significantly lower during the weekend, implying more young drivers were on the road during the weekend. When the age of all drivers was categorized into three classes (18 or less, 19–64, and 65 or older), drivers in the 65 or older group had higher odds of being involved in severe crashes.
For all days of the week, the number of intersection crashes was about 30% of all crashes. The highest intersection crash proportion occurred on Friday. The weekend period (especially Sunday) had a lower intersection crash frequency but higher severe crash proportions and higher proportions of intersection crashes (Figure 2c). Wednesday had the highest number of incapacitating injury crashes, while weekends had substantially higher fatal crash incidents (Figure 2c). The odds of intersection crash severity was higher during the weekend (OR 1.2).
The frequency and proportions of K&A crashes in intersection crashes were relatively lower during the winter and higher during the fall (Figure 3a). The season of crash occurrence (especially fall and winter) significantly influenced intersection crash severity. The winter season had the lowest severe crash risk while the fall had the highest. When individual months were considered, April, May, June, September, October, and November had greater observed severe intersection crashes than expected, X2 (11, N = 73,755) = 20.1, p = 0.044.
Dark lighting conditions lead to a greater risk of severe crashes (OR 1.2). Dark lighting conditions had a higher proportion of fatal crashes (almost 4 times) and serious injury crashes compared to daylight lighting conditions (Figure 3b). Reduced visibility, drunk and distracted drivers at night, and higher traffic speeds due to lower traffic volumes during the night hours might be responsible for this increased crash severity. From Figure 3c, dark lighting conditions (lighted and not lighted) had relatively higher proportions of intersection crashes (approximately 31% and 36%, respectively) during the weekend compared to daylight conditions (approximately 21%). Under dark lighting conditions, intersection crash frequencies were significantly higher during the weekend compared to weekdays, X2 (2, N = 73,755) = 1441.4, p = 2.2 × 10⁻¹⁶.
The proportion of K&A crashes was lower during rainy weather conditions (Figure 3d). In the chi-squared test, any crash that had not occurred in either clear, rainy, or cloudy conditions was included in the other category (including hail, sleet, snow, fog, and crosswind). Although statistically not significant (p-value = 0.076), the chi-squared test indicated that inclement weather reduced severe crash risk (Table 1).
The association of six types of road alignments (straight-level, straight-grade, straight-hillcrest, curve-level, curve-grade, and curve-hillcrest) with intersection crash severity was also examined. Straight-grade (OR 1.2) and straight-hillcrest (OR 1.4) significantly increased severe crashes at intersections, which might be attributed to greater vehicle speeds associated with these road geometries. Signal light, crosswalk, divider, marked lanes, and stop sign traffic controls had significantly higher odds of being associated with severe crashes. The abnormally high OR for crosswalks was due to the higher injury severity risk of pedestrians. About nine out of ten intersection crashes included at least one straight moving vehicle and approximately 32% of all intersection crashes included at least one left turning vehicle, while less than 8% included at least one right turning vehicle.
3.3. Logistic Regression Results
Logistic regression analysis was conducted to further study the association between intersection crash severity and key crash factors. The results of the analysis are represented in Table 7. The coefficient estimates were represented in log-odds terms and differences among coefficient estimates of the categorical variables were used to compare their effects on crash severity. The positive coefficient estimate of dark lighting conditions (0.326) implied that a change from daylight conditions to dark lighting conditions increased the log-odds of a severe injury by 0.326 and the associated p-value (0.001) indicated dark lighting conditions are significant in determining severe injury crashes. Odds ratios represent the ratio of the odds of occurrence of an event given the presence of the predictor variable compared to the odds of the occurrence of that event in the absence of that predictor variable. Odds ratios were used to measure the strength of association between an independent variable and the outcome variable from the regression coefficient estimate. For example, the odds of an intersection crash under dark lighting conditions resulting in a severe injury was 1.39 times compared to daylight conditions.
Overall, the results from the logistic regression were consistent with the bivariate analysis and the observed effects of the independent variables on intersection crash severity were consistent with our prediction. While the strength of association of the independent variables with the predictor variable were different between bivariate analysis and logistic regression, the direction of their relationship (positive or negative) was similar. The logistic regression found the age of the driver (65 or older and unknown), gender of driver (male and unknown), road traffic control, day of the week, weather conditions (rain), lighting conditions (dark), and season (winter) to be significantly associated with crash severity at intersections. The p-values for 3:00–6:00 p.m. and 6:00–9:00 p.m. was just above the significance level. While the effect of road alignment on intersection crash severity was significant as a stand-alone variable in bivariate analysis, none of the categories within this variable were significant when used in conjunction with other variables in logistic regression analysis. On the contrary, rainy weather conditions were significant in conjunction with other categories in logistic regression, but weather condition was not significant as a stand-alone variable in bivariate analysis. Older drivers (age ≥ 65) and male drivers had greater odds of suffering a severe injury (OR 1.30 and OR 1.2, respectively). Less severe crashes were observed when age and gender were not reported (OR 0.55 when age unknown and OR 0.54 when gender unknown).
The intersection crash severity risk was relatively low during the 3:00–6:00 p.m. and 6:00–9:00 p.m. periods, probably due to congestion and slower traffic. Rainy weather reduced the odds of severe injury at intersections (OR 0.73). Severe injury was correlated with vehicle speed, and rainy weather and other inclement weather conditions might compel drivers to approach the intersection with more caution, resulting in less severe injuries. Limited pedestrian and bicyclist activity and wearing more protective clothing in cold temperatures might be the reason behind the relatively lower odds of severe injury at intersections during the winter season. Higher odds of severe injury at intersections during the weekend might be attributed to the relatively higher proportion of distracted and drunk drivers during this period, along with increased recreational activities of vulnerable road users (pedestrians and bicyclists). The risk of severe injury significantly increased at intersections when the traffic was controlled by crosswalk (OR 13.77), divider (OR 2.90), marked lanes (OR 3.21), signal light (OR 3.03), and stop sign (OR 2.66).
4. Conclusions
Bivariate analysis and logistic regression were applied to traffic crash data obtained from the CRIS database to identify the factors that influenced the occurrence and severity of intersection crashes in San Antonio, Texas. The results suggested that traffic control, age and gender of the driver, and lighting conditions were strong predictors of severe intersection crashes. The severity of intersection crashes increased significantly during the weekend, the fall and spring seasons, nighttime (especially from 12:00 a.m.–3:00 a.m.), under dark lighting conditions (especially during weekend), on straight-grade and straight-hillcrest road alignment, and at signal light, crosswalk, or no passing zones.
The injury severity risk was low for crashes where age or gender of injured persons were not reported, implying that crash reports related to less severe crashes are more likely to contain incomplete primary person information. A higher proportion of fatal and serious injury intersection crashes were associated with dark lighting conditions during the weekend, which could be attributed to the tendency to disregard signals and over-speed during late hours with lower traffic volumes, reduced visibility, and a greater number of drunk drivers and pedestrians. Intersections with insufficient lighting, high crash frequency and severe crashes should be identified to ensure proper lighting.
In addition to intersection crashes, driver distraction was one of the primary reasons behind pedestrian and bicyclist crashes [43]. This may be reduced in the near future by the anticipated proliferation of autonomous vehicles that can handle simple, monotonous tasks more proficiently and effectively than human beings. Additionally, introducing devices and techniques that block unsafe functions (e.g., making calls, texting, entering destination details into a navigation device or browsing music) while driving, and adopting driver-centric approaches (educating drivers about what constitutes a distraction while driving and the greater risk associated with distraction crashes) might be helpful. Pedestrians, bicyclists, and motorcyclists are generally less protected on roadways and were at greater risk of being involved in severe intersection crashes. Several automobile companies are adopting motor vehicle designs and implementing technologies which take account of the safety of these vulnerable road users, along with the vehicle driver, in a collision and these initiatives should be encouraged.
Almost 32% of intersection crashes occurred while at least one vehicle was taking a left turn. The introduction of left turning lanes was helpful in reducing crash rates [44,45,46] and the authors recommend the use of left-turn lanes for all major intersections with high crash rates. We also recommend implementation of reduced left-turn conflict intersections such as the restricted crossing U-turn and the median U-turn which are proven to reduce left-turn associated intersection crashes [47]. Disregarding stop signs was responsible for almost 15% of all intersection crashes and was associated with high severity risk (OR 2.6). The addition of flashing lights to stop signs, either through beacons or embedded light-emitting diodes, to draw attention and convey a message to drivers, especially during dark lighting condition, and the implementation of automated red-light cameras at intersections might help to reduce crashes where the traffic is controlled by stop sign. Use of leading pedestrian interval, yellow change interval, and restricted right turn on red reduce crashes at signalized intersections and should be implemented at intersections with higher vehicle and pedestrian activities [48]. Roundabouts reduce 75 percent of injury crashes compared to traditional stop sign or signal-controlled intersections and are recommended for high-risk intersections with severe injury risk and relatively low traffic volume [49]. When the traffic control was a crosswalk, the crash almost always involved a pedestrian which might explain the substantially high severe crash risk associated with crosswalks. Vehicle speed was directly related to pedestrian and bicyclist injury severity and severe injuries are unavoidable when pedestrians are hit at high speed. Implementing stop signs at all intersections that include crosswalks and providing pedestrian overcrossings at high-risk locations might reduce fatal collisions between pedestrians and vehicles at intersections.
Intersection crashes were more frequent in and around the city center and in the northwest part of the city. The spatial pattern of locations experiencing frequent intersection crashes and locations with relatively severe intersection crash clusters were different. Crash incidents occurring at city road intersections experiencing relatively fewer frequent crashes were more likely to result in severe crashes. All-way stop signs might be introduced to these severity-prone intersections as the reduced speed of vehicles at all-way intersections should result in less severe crashes.
Understanding the effects of different variables on intersection crash severity is expected to aid the City of San Antonio in making informed decisions that prioritize crash reduction treatments at high-risk intersections identified by spatial analysis. City-wide traffic volume data at intersections were unavailable and this study did not include traffic volume data in spatial analysis. Further studies on intersections with available traffic volume data by creating a typology of intersections based on frequency-severity combination might better represent crash patterns in San Antonio. While understanding the effect of human factors on intersection crash severity is crucial, only basic demographic information was used due to the unavailability of data about other human factors. The reported injury severities were heavily reliant on the judgement of law enforcement officers and could not be cross-checked with external sources, which is another limitation of this study.
Author Contributions
H.O.S. and S.D. guided this research, contributed significantly to preparing the manuscript for publication and developing the research methodology. Q.A. and L.S. helped in data preparation and literature review. K.B. processed the data, developed the scripts used in the analysis, and performed the analysis. K.B. prepared the first draft. H.O.S. and S.D. performed the final overall proofreading of the manuscript. All authors have read and agreed to the published version of the manuscript.
Funding
The financial support of the Transportation Consortium of South-Central States (Tran-SET) is greatly appreciated (Tran-SET Project 17ITSTSA01 and Grant Number 69A3551747106). This research was partially funded by a professional service agreement between the University of Texas at San Antonio and the City of San Antonio.
Institutional Review Board Statement
Not applicable.
Informed Consent Statement
Not applicable.
Data Availability Statement
Publicly available datasets were analyzed in this study. The data can be found here: https://cris.txdot.gov/ (accessed on 18 May 2019).
Conflicts of Interest
The authors declare no conflict of interest.
References
- Federal Highway Administration MUTCD. 2003 Manual on Uniform Traffic Control Devices; U.S. Department of Transportation: Washington, DC, USA.
- NHTSA. Crash Factors in Intersection-Related Crashes: An On-Scene Perspective: DOT HS 811 366; National Highway Traffic Safety Administration: Washington, DC, USA, 2010.
- Singh, S. Critical Reasons for Crashes Investigated in the National Motor Vehicle Crash Causation Survey. (Traffic Safety Facts Crash Stats; Report No. DOT HS 812 115); National Highway Traffic Safety Administration: Washington, DC, USA, 2015.
- Texas Motor Vehicle Traffic Crash Facts. Available online: http://ftp.dot.state.tx.us/pub/txdot-info/trf/crash_statistics/2016/01.pdf (accessed on 18 July 2020).
- Hussein, N.; Hassan, R. Surface Condition and Safety at Signalised Intersections. Int. J. Pavement Eng. 2017, 18, 1016–1026. [Google Scholar] [CrossRef]
- Federal Highway Administration. Intersection Safety Issue Briefs. FHWA Safety. November 2009. Available online: http://safety.fhwa.dot.gov/intersection/resources/#fhwasa10005 (accessed on 21 December 2017).
- Chen, H.; Cao, L.; Logan, D.B. Analysis of Risk Factors Affecting the Severity of Intersection Crashes by Logistic Regression. Traffic Injury Prev. 2012, 13, 300–307. [Google Scholar] [CrossRef] [PubMed]
- Wu, Q.; Zhang, G.; Ci, Y.; Wu, L.; Tarefder, R.A.; Alcántara, A.D. Exploratory Multinomial Logit Model–Based Driver Injury Severity Analyses for Teenage and Adult Drivers in Intersection-Related Crashes. Traffic Injury Prev. 2016, 17, 413–422. [Google Scholar] [CrossRef] [PubMed]
- Tay, R.; Rifaat, S.M. Factors contributing to the severity of intersection crashes. J. Adv. Transp. 2007, 41, 245–265. [Google Scholar] [CrossRef]
- Huang, H.; Chin, H.C.; Haque, M.M. Severity of Driver Injury and Vehicle Damage in Traffic Crashes at Intersections: A Bayesian Hierarchical Analysis. Accid. Anal. Prev. 2008, 40, 45–54. [Google Scholar] [CrossRef] [PubMed]
- Barua, U.; Azad, A.K.; Tay, R. Fatality Risk of Intersection Crashes on Rural Undivided Highways in Alberta, Canada. Transp. Res. Rec. 2010, 2148, 107–115. [Google Scholar] [CrossRef]
- Persaud, B.; Hauer, E.; Retting, R.; Vallurupalli, R.; Mucsi, K. Crash Reductions Related to Traffic Signal Removal in Philadelphia. Accid. Anal. Prev. 1997, 29, 803–810. [Google Scholar] [CrossRef]
- Tay, R. A Random Parameters Probit Model of Urban and Rural Intersection Crashes. Accid. Anal. Prev. 2015, 84, 38–40. [Google Scholar] [CrossRef]
- Persaud, B.N. Statistical Methods in Highway Safety Analysis; NCHRP Synthesis 295; Transportation Research Board: Washington, DC, USA, 2001. [Google Scholar]
- Obeng, K. Injury severity, vehicle safety features, and intersection crashes. Traffic INJ Prev. 2008, 9, 268–276. [Google Scholar] [CrossRef]
- Wang, Y.; Nihan, N. Quantitative analysis on angle-accident risk at signalized intersections. In Proceedings of the 9th World Congress on Transport Research, Seoul, Korea, 22–27 July 2001. [Google Scholar]
- Chin, H.; Quddus, M. Applying the random effect negative binomial model to examine traffic accident occurrence at signalized intersections. Accid. Anal. Prev. 2003, 35, 253–259. [Google Scholar] [CrossRef]
- Lord, D.; Mannering, F. The statistical analysis of crash-frequency data: A review and assessment of methodological alternatives. Transp. Res. Part A Policy Pract. 2010, 44, 291–305. [Google Scholar] [CrossRef] [Green Version]
- Savolainen, P.T.; Mannering, F.L.; Lord, D.; Quddus, M.A. The statistical analysis of highway crash-injury severities: A review and assessment of methodological alternatives. Accid. Anal. Prev. 2011, 43, 1666–1676. [Google Scholar] [CrossRef] [PubMed] [Green Version]
- Zhang, J.; Lindsay, J.; Clarke, K.; Robbins, G.; Mao, Y. Factors affecting the severity of motor vehicle traffic crashes involving elderly drivers in Ontario. Accid. Anal. Prev. 2000, 32, 117–125. [Google Scholar] [CrossRef]
- Al-Ghamdi, A.S. Using logistic regression to estimate the influence of accident factors on accident severity. Accid. Anal. Prev. 2002, 34, 729–741. [Google Scholar] [CrossRef]
- Yau, K.K.W. Risk factors affecting the severity of single vehicle traffic accidents in Hong Kong. Accid. Anal. Prev. 2004, 36, 333–340. [Google Scholar] [CrossRef]
- Yan, X.D.; Radwan, E.; Abdel-Aty, M. Characteristics of rear-end accidents at signalized intersections using multiple logistic regression model. Accid. Anal. Prev. 2005, 37, 983–995. [Google Scholar] [CrossRef]
- Harb, R.; Radwan, E.; Yan, X.D.; Pande, A.; Abdel-Aty, M. Freeway work-zone crash analysis and risk identification using multiple and conditional logistic regression. J. Transp. Eng. 2008, 134, 203–214. [Google Scholar] [CrossRef] [Green Version]
- Fitzpatrick, C.D.; Rakasi, S.; Knodler, M.A., Jr. An Investigation of the Speeding-Related Crash Designation through Crash Narrative Reviews Sampled via Logistic Regression. Accid. Anal. Prev. 2017, 98, 57–63. [Google Scholar] [CrossRef]
- Wu, Y.; Abdel-Aty, M.; Lee, J. Crash Risk Analysis during Fog Conditions Using Real-Time Traffic Data. Accid. Anal. Prev. 2018, 114, 4–11. [Google Scholar] [CrossRef]
- Gershon, P.; Sita, K.R.; Zhu, C.; Ehsani, J.P.; Klauer, S.G.; Dingus, T.A.; Simons-Morton, B.G. Distracted Driving, Visual Inattention, and Crash Risk Among Teenage Drivers. Am. J. Prev. Med. 2019, 56, 494–500. [Google Scholar] [CrossRef]
- Xu, X.; Li, D. Predicting Crash Rate Using Logistic Quantile Regression with Bounded Outcomes. IEEE Access 2017, 5, 27036–27042. [Google Scholar] [CrossRef]
- Stoltzfus, J.C. Logistic Regression: A Brief Primer. Acad. Emerg. Med. 2011, 18, 1099–1104. [Google Scholar] [CrossRef] [PubMed]
- McHugh, M.L. The chi-square test of independence. Biochem. Med. 2013, 23, 143–149. [Google Scholar] [CrossRef] [PubMed] [Green Version]
- Environmental Systems Research Institute (ESRI). ArcGIS Pro Tool Reference. Density Toolset Concept. 2014. Available online: https://pro.arcgis.com/en/pro-app/tool-reference/spatial-analyst/how-kernel-density-works (accessed on 23 October 2020).
- Chainey, S.; Ratcliffe, J. GIS and Crime Mapping; John Wiley & Sons: Hoboken, NJ, USA, 2013. [Google Scholar]
- Silverman, B.W. Density Estimation for Statistics and Data Analysis; CRC Press: Boca Raton, FL, USA, 1986. [Google Scholar]
- Harirforoush, H.; Bellalite, L. A New Integrated GIS-Based Analysis to Detect Hotspots: A Case Study of the City of Sherbrooke. Accid. Anal. Prev. 2019, 130, 62–74. [Google Scholar] [CrossRef]
- Young, J.; Park, P.Y. Hotzone identification with GIS-based post-network screening analysis. J. Transp. Geogr. 2014, 34, 106–120. [Google Scholar] [CrossRef]
- Plug, C.; Xia, J.C.; Caulfield, C. Spatial and temporal visualisation techniques for crash analysis. Accid. Anal. Prev. 2011, 43, 1937–1946. [Google Scholar] [CrossRef] [PubMed]
- Truong, L.; Somenahalli, S. Using GIS to Identify Pedestrian-Vehicle Crash Hot Spots and Unsafe Bus Stops. J. Public Transp. 2011, 14, 2011. [Google Scholar] [CrossRef] [Green Version]
- RTA. Road Traffic Accidents in NSW—1993; Roads and Traffic Authority of NSW: Sydney, Australia, 1994.
- Geurts, K.; Wets, G.; Brijs, T.; Vanhoof, K. Identification and ranking of black spots: Sensitivity analysis. Transp. Res. Rec. 2004, 1897, 34–42. [Google Scholar] [CrossRef]
- NHTSA. Traffic Safety Facts Research Note: 2017 Fatal Motor Vehicle Crashes: Overview; National Highway Traffic Safety Administration: Washington, DC, USA, 2017.
- Clarke, P.J.; Yan, T.; Keusch, F.; Gallagher, N.A. The Impact of Weather on Mobility and Participation in Older US Adults. Am. J. Public Health 2015, 105, 1489–1494. [Google Scholar] [CrossRef]
- TxDPS—How to Apply for a Texas Driver License as a Teen. Available online: https://www.dps.texas.gov/driverlicense/teendriver.htm (accessed on 12 November 2019).
- Billah, K.; Sharif, H.; Dessouky, S. Analysis of Pedestrian-Motor Vehicle Crashes in San Antonio. Sustainability 2021. submitted for publication. [Google Scholar]
- Gluck, J.; Levinson, H.S.; Stover, V. Impacts of Access Management Techniques. NCHRP Report, no. 420. 1999. Available online: https://trid.trb.org/View/498727 (accessed on 12 February 2021).
- Kim, D.G.; Washington, S. The Significance of Endogeneity Problems in Crash Models: An Examination of Left-Turn Lanes in Intersection Crash Models. Accid. Anal. Prev. 2006, 38, 1094–1100. [Google Scholar] [CrossRef] [PubMed]
- Parker, M.R.; Flak, M.A.; Tsuchiyama, K.H.; Wadenstorer, S.C.; Hutcherson, F. Geometric Treatments for Reducing Passing Accidents at Rural Intersections on Two-Lane Highways. Volume I—Final Report. 1983. Available online: https://catalog.hathitrust.org/Record/005500596 (accessed on 12 February 2021).
- Federal Highway Administration. Proven Safety Countermeasures—Reduced Left-Turn Conflict Intersections—Safety (n.d.). Available online: https://safety.fhwa.dot.gov/provencountermeasures/reduced_left/ (accessed on 21 April 2021).
- Federal Highway Administration. Signalized Intersections | Intersection Safety-Safety. Available online: https://safety.fhwa.dot.gov/intersection/signal/index.cfm (accessed on 21 April 2021).
- Roundabout Benefits. Available online: https://wsdot.wa.gov/Safety/roundabouts/benefits.htm (accessed on 21 April 2021).
Figure 1.
The (a) heat map of intersection crashes in San Antonio based on crash density (2013–2017), (b) locations with frequent intersection crashes: the intersection at Loop 1604 and Bandera Rd (top left), the intersection at Interstate-35 and McCullough Ave (top right), the intersection at Interstate-10 and Wurzbach Rd (bottom left), and the intersection at Interstate-10 and De Zavala Rd (bottom right), (c) hotspots of intersection crashes in San Antonio based on crash severity (500 m bandwidth), and (d) locations with a statistically significant cluster of severe pedestrian crashes near the intersection at: E Houston St and S Hackberry St (top left), Rigsby Ave and S New Braunfels Ave (top right), S Zarzamora St and W Southcross Blvd (bottom left), Pleasanton Rd and W Hutchins Pl (bottom right).


Figure 2.
The (a) average % of intersection crashes in total crashes, (b) yearly intersection K&A crashes and % of K&A intersection crashes in total crashes, and (c) the frequency of fatal crashes and proportion of K&A crashes in total intersection crashes by day of the week.
Figure 2.
The (a) average % of intersection crashes in total crashes, (b) yearly intersection K&A crashes and % of K&A intersection crashes in total crashes, and (c) the frequency of fatal crashes and proportion of K&A crashes in total intersection crashes by day of the week.


Figure 3.
The (a) monthly K&A crash frequency at intersections by month, (b) intersection crashes by light condition and % of K&A crashes, (c) intersection crashes by light condition and day of week, and (d) intersection crashes by weather condition and % of K&A crashes.
Figure 3.
The (a) monthly K&A crash frequency at intersections by month, (b) intersection crashes by light condition and % of K&A crashes, (c) intersection crashes by light condition and day of week, and (d) intersection crashes by weather condition and % of K&A crashes.


Table 1.
Chi-squared test results for environment and road related factors.
| Crash Counts | |||||||
|---|---|---|---|---|---|---|---|
| Variable | df | p-Value | X2 Statistic | Fatal | Serious | OR | OR Range |
| Traffic Control | 6 | 3.4 × 10⁻¹² | 65.5 | ||||
| Yield | 3 | 18 | 1.0 | Reference | |||
| Crosswalk | 0 | 12 | 12.8 | 6.0–26.3 | |||
| Divider | 2 | 39 | 3.0 | 1.8–5.1 | |||
| Marked Lanes | 33 | 180 | 3.4 | 2.2–5.4 | |||
| None | 17 | 144 | 2.8 | 1.8–4.6 | |||
| Signal Light | 71 | 730 | 3.1 | 2.0–4.9 | |||
| Stop | 26 | 295 | 2.6 | 1.7–4.2 | |||
| Lighting Condition | 2 | 2.0 × 10⁻⁷ | 30.8 | ||||
| Daylight | 64 | 967 | 1.0 | Reference | |||
| Dark | 86 | 456 | 1.3 | 1.2–1.5 | |||
| Other | 5 | 24 | 0.9 | 0.6–1.3 | |||
| Weather Condition | 4 | 0.076 | 8.5 | ||||
| Clear | 126 | 1061 | 1.0 | Reference | |||
| Cloudy | 20 | 288 | 1.0 | 0.9–1.1 | |||
| Other | 0 | 3 | 0.4 | 0.1–1.1 | |||
| Rain | 9 | 92 | 0.8 | 0.7–1.0 | |||
| Unknown | 0 | 3 | 0.4 | 0.1–1.1 | |||
| Road Alignment | 6 | 7.1 × 10⁻⁶ | 33.9 | ||||
| Curve, Grade | 7 | 24 | 1.0 | Reference | |||
| Curve, Hillcrest | 0 | 10 | 1.1 | 0.5–2.3 | |||
| Curve, Level | 8 | 37 | 0.7 | 0.5–1.2 | |||
| Other | 1 | 6 | 0.6 | 0.2–1.2 | |||
| Straight, Grade | 14 | 141 | 1.2 | 0.9–1.9 | |||
| Straight, Hillcrest | 2 | 48 | 1.4 | 0.9–2.2 | |||
| Straight, Level | 123 | 1181 | 0.8 | 0.6–1.2 | |||
Table 2.
Chi-squared test results for time of crash occurrence.
| Crash Counts | |||||||
|---|---|---|---|---|---|---|---|
| Variable | df | p-Value | X2 Statistic | Fatal | Serious | OR | OR Range |
| Day of Week | 1 | 0.001 | 10.5 | ||||
| Weekday | 99 | 1043 | 1.0 | Reference | |||
| Weekend | 56 | 404 | 1.2 | 1.1–1.3 | |||
| Season | 3 | 0.003 | 13.9 | ||||
| Fall | 39 | 413 | 1.0 | Reference | |||
| Spring | 37 | 391 | 1.0 | 0.8–1.1 | |||
| Summer | 46 | 351 | 0.9 | 0.8–1.1 | |||
| Winter | 33 | 292 | 0.8 | 0.7–0.9 | |||
| Time of Day | 7 | 2.7 × 10⁻¹⁰ | 48.7 | ||||
| 12:00–3:00 a.m. | 30 | 101 | 1.0 | Reference | |||
| 3:00–6:00 a.m. | 8 | 45 | 0.9 | 0.6–1.2 | |||
| 6:00–9:00 a.m. | 18 | 186 | 0.8 | 0.6–1.0 | |||
| 9:00 a.m–12:00 p.m. | 13 | 199 | 0.7 | 0.6–0.9 | |||
| 12:00–3:00 p.m. | 17 | 277 | 0.7 | 0.6–0.9 | |||
| 3:00–6:00 p.m. | 22 | 268 | 0.5 | 0.4–0.7 | |||
| 6:00–9:00 p.m. | 25 | 216 | 0.7 | 0.5–0.8 | |||
| 9:00 p.m–12:00 a.m. | 22 | 155 | 0.8 | 0.7–1.1 | |||
Table 3.
Chi-squared test results for driver related factors.
| Crash Counts | |||||||
|---|---|---|---|---|---|---|---|
| Variable | df | p-Value | X2 Statistic | Fatal | Serious | OR | OR Range |
| Age | 3 | 2.2 × 10⁻¹⁶ | 201.3 | ||||
| 18 or less | 5 | 156 | 1.1 | 0.9–1.2 | |||
| 19–64 | 256 | 2350 | 1.0 | Reference | |||
| 65 or older | 46 | 292 | 1.3 | 1.2–1.5 | |||
| Unknown | 8 | 139 | 0.4 | 0.3–0.4 | |||
| Gender | 2 | 2.2 × 10⁻¹⁶ | 186.0 | ||||
| Male | 224 | 1653 | 1.2 | 1.1–1.3 | |||
| Female | 86 | 1207 | 1.0 | Reference | |||
| Unknown | 5 | 77 | 0.3 | 0.2–0.4 | |||
Table 4.
Descriptive statistics of age of primary persons.
| Primary Person | Sample Size (N) | Mean Age | SD |
|---|---|---|---|
| Vehicle Driver | 124,307 | 39.09 | 16.49 |
| Bicyclist | 781 | 30.31 | 16.1 |
| Pedestrian | 1439 | 39.35 | 20.1 |
| Motorcyclist | 942 | 38.22 | 13.19 |
Table 5.
ANOVA test results for age of primary persons by season.
| Mean Age by Season | |||||||
|---|---|---|---|---|---|---|---|
| df | p-Value | F-Value | Fall | Winter | Spring | Summer | |
| Vehicle Driver | 3 | 7.3 × 10⁻⁵ | 7.25 | 39.2 | 39.4 | 38.8 | 39.0 |
| Bicyclist | 3 | 0.032 | 2.98 | 30.3 | 33.8 | 29.7 | 28.6 |
| Pedestrian | 3 | 0.216 | 1.49 | 38.3 | 38.6 | 40.3 | 41.0 |
| Motorcyclist | 3 | 0.551 | 0.70 | 37.9 | 38.4 | 37.4 | 39.1 |
Table 6.
ANOVA test results for age of primary persons by day of week.
| Mean Age by Day of Week | ||||||||||
|---|---|---|---|---|---|---|---|---|---|---|
| df | p-Value | F-Value | Sat | Sun | Mon | Tue | Wed | Thu | Fri | |
| Vehicle Driver | 6 | 2.2 × 10⁻¹⁶ | 45.12 | 38.1 | 37.3 | 39.4 | 39.5 | 39.7 | 39.6 | 39.1 |
| Bicyclist | 6 | 0.346 | 1.13 | 29.8 | 33.8 | 31.3 | 30.3 | 28.7 | 30.3 | 28.9 |
| Pedestrian | 6 | 0.889 | 0.38 | 39.6 | 39.0 | 39.7 | 38.8 | 38.0 | 39.5 | 40.7 |
| Motorcyclist | 6 | 0.250 | 1.32 | 37.4 | 38.5 | 38.9 | 40.2 | 36.1 | 37.5 | 39.2 |
Table 7.
Logistic regression modeling results.
| Variable | Categories | Reference | Estimates | Std. Error | z Value | p-Value | OR |
|---|---|---|---|---|---|---|---|
| Intercept 1 | −4.521 | 0.312 | −14.50 | 2.0 × 10⁻¹⁶ | |||
| Traffic Control | Crosswalk | Yield | 2.622 | 0.377 | 6.96 | 3.4 × 10⁻¹² | 13.77 |
| Stop | 0.977 | 0.229 | 4.27 | 2.0 × 10⁻⁵ | 2.66 | ||
| Signal | 1.109 | 0.225 | 4.93 | 8.2 × 10⁻⁷ | 3.03 | ||
| Divider | 1.066 | 0.272 | 3.92 | 8.7 × 10⁻⁵ | 2.90 | ||
| Marked Lane | 1.165 | 0.231 | 5.04 | 4.7 × 10⁻⁷ | 3.21 | ||
| None | 0.934 | 0.235 | 3.98 | 7.0 × 10⁻⁵ | 2.54 | ||
| Road Alignment | Curve, Hillcrest | Curve, Grade | 0.150 | 0.370 | 0.41 | 0.684 | 1.16 |
| Curve, Level | −0.306 | 0.238 | −1.29 | 0.198 | 0.74 | ||
| Other | −0.402 | 0.456 | −0.88 | 0.378 | 0.67 | ||
| Straight, Grade | 0.089 | 0.202 | 0.44 | 0.661 | 1.09 | ||
| Straight, Hillcrest | 0.207 | 0.235 | 0.88 | 0.379 | 1.23 | ||
| Straight, Level | −0.290 | 0.188 | −1.55 | 0.122 | 0.75 | ||
| Day of Week | Weekend | Weekday | 0.139 | 0.058 | 2.38 | 0.017 | 1.15 |
| Crash Season | Spring | Fall | −0.051 | 0.069 | −0.74 | 0.461 | 0.95 |
| Summer | −0.066 | 0.071 | −0.93 | 0.355 | 0.94 | ||
| Winter | −0.283 | 0.074 | −3.80 | 1.4 × 10⁻⁴ | 0.75 | ||
| Time of Day | 3:00–6:00 a.m. | 12:00–3:00 a.m. | −0.137 | 0.167 | −0.82 | 0.413 | 0.87 |
| 6:00–9:00 a.m. | 0.094 | 0.143 | 0.66 | 0.509 | 1.10 | ||
| 9:00 a.m–12:00 p.m. | 0.049 | 0.152 | 0.32 | 0.748 | 1.05 | ||
| 12:00–3:00 p.m. | −0.018 | 0.148 | −0.12 | 0.901 | 0.98 | ||
| 3:00–6:00 p.m. | −0.276 | 0.145 | −1.90 | 0.058 | 0.76 | ||
| 6:00–9:00 p.m. | −0.234 | 0.121 | −1.94 | 0.052 | 0.79 | ||
| 9:00 p.m–12:00 a.m. | −0.172 | 0.119 | −1.45 | 0.147 | 0.84 | ||
| Weather Condition | Cloudy | Clear | −0.041 | 0.066 | −0.62 | 0.535 | 0.96 |
| Rain | −0.314 | 0.109 | −2.89 | 0.004 | 0.73 | ||
| Other | −0.958 | 0.583 | −1.64 | 0.101 | 0.38 | ||
| Unknown | −0.732 | 0.597 | −1.22 | 0.221 | 0.41 | ||
| Lighting Condition | Dark | Daylight | 0.329 | 0.101 | 3.25 | 0.001 | 1.39 |
| Other | 0.060 | 0.199 | 0.30 | 0.765 | 1.06 | ||
| Intercept 2 | −3.823 | 0.029 | −130.9 | 2.0 × 10⁻¹⁶ | |||
| Age | 18 or less | 19–64 | 0.045 | 0.082 | 0.55 | 0.585 | 1.05 |
| 65 or older | 0.265 | 0.059 | 4.51 | 6.5 × 10⁻⁶ | 1.30 | ||
| Unknown | −0.596 | 0.124 | −4.80 | 1.6 × 10⁻⁶ | 0.55 | ||
| Gender | Male | Female | 0.182 | 0.037 | 4.96 | 6.9 × 10⁻⁷ | 1.20 |
| Unknown | −0.622 | 0.166 | −3.75 | 1.7 × 10⁻⁴ | 0.54 |
Null deviance 15,131 on 71,955 df and residual deviance 14,950 on 71,926 df for model 1, AIC: 15010. Null deviance 31,141 on 145,262 df and residual deviance 30,850 on 145,257 df for model 2, AIC: 30862.
Publisher’s Note: MDPI stays neutral with regard to jurisdictional claims in published maps and institutional affiliations. |
© 2021 by the authors. Licensee MDPI, Basel, Switzerland. This article is an open access article distributed under the terms and conditions of the Creative Commons Attribution (CC BY) license (https://creativecommons.org/licenses/by/4.0/).
Share and Cite
MDPI and ACS Style
Billah, K.; Adegbite, Q.; Sharif, H.O.; Dessouky, S.; Simcic, L. Analysis of Intersection Traffic Safety in the City of San Antonio, 2013–2017. Sustainability 2021, 13, 5296. https://0-doi-org.brum.beds.ac.uk/10.3390/su13095296
AMA Style
Billah K, Adegbite Q, Sharif HO, Dessouky S, Simcic L. Analysis of Intersection Traffic Safety in the City of San Antonio, 2013–2017. Sustainability. 2021; 13(9):5296. https://0-doi-org.brum.beds.ac.uk/10.3390/su13095296
Chicago/Turabian StyleBillah, Khondoker, Qasim Adegbite, Hatim O. Sharif, Samer Dessouky, and Lauren Simcic. 2021. "Analysis of Intersection Traffic Safety in the City of San Antonio, 2013–2017" Sustainability 13, no. 9: 5296. https://0-doi-org.brum.beds.ac.uk/10.3390/su13095296
Note that from the first issue of 2016, this journal uses article numbers instead of page numbers. See further details here.