
Social Sustainability of Water and Waste Management Companies in Portugal


Centre of Applied Research in Management and Economics, School of Technology and Management, Polytechnic Institute of Leiria, 2411-901 Leiria, Portugal
*
Author to whom correspondence should be addressed.
Sustainability 2022, 14(1), 221; https://0-doi-org.brum.beds.ac.uk/10.3390/su14010221
Submission received: 29 November 2021
/
Revised: 21 December 2021
/
Accepted: 23 December 2021
/
Published: 26 December 2021
(This article belongs to the Special Issue Social Sustainability)
Abstract
:The Sustainable Development Goals aim at balancing economic, social and environmental development. In this framework, social sustainability is key to tackle current challenges that hinder the maximization of social satisfaction. Yet, for many years, scholars have negleted the social dimension. A possible explanation may be the difficulty to measure social concepts such as well-being and prosperity. Thus, we argue that, to evaluate sectoral performance, the concept of social sustainability should be translated into metrics, by focusing on the indicators that impact on those social concepts. Consequently, time-series data from Quadros do Pessoal, PORDATA and SABI databases for the sector of Water Collection, Treatment and Distribution, Sanitation, Waste Management and Depollution, are consulted to analyze the evolution of those indicators and evaluate corporate performance concerning social sustainability in 2008–2019. In line with previous literature, we use average wages and employment as proxies for social sustainability. However, we introduce a new indicator, the average term for receipts to carry out an analysis from the stakeholders’ perspective. The results suggest that, especially as of 2017, sectoral firms appear to have reagained their momentum concerning social sustainability performance. This study provides the opportunity to uncover average sectoral trends on social sustainability and paves the way for future research exploring firms’ heterogeneity.
1. Introduction
Currently, the Sustainable Development Goals (SDGs) are considered critical aspects for human beings, since they tackle a range of issues, namely poverty and climate change, and aim at balancing economic, social and environmental development [1,2,3]. In this framework, the social dimension is one of the most elementary pillars of sustainability. Indeed, social sustainability is key to address existing social problems and to maximize social satisfaction [4,5,6]. However, for many years, scholars have focused on the economic and environmental dimensions of sustainability, in detriment of the social dimension [7,8,9]. A socially sustainable system is expected to promote fairness in distribution and adequate provision of social services, gender equity and political accountability and participation [10,11,12].
Thus, evaluating the social sustainability of firms and sectors allows for more informed decision making regarding investment, product portfolios, and corporate programs, along with reporting firms’ effect on the relevant SDGs [13,14,15].
Yet, measuring corporate social sustainability is a difficult task since it involves the identification of goals of different stakeholders with, sometimes, antagonic motivations that give rise to the emergence of conflicts over corporate objectives [16,17,18].
Accordingly, scholars have adopted some ad hoc notions and indicators of social sustainability, some related to socio-economic impacts of firms and others with a holistic nature. For example, [19] emphasized particular features that promote social sustainability, namely the existence of job opportunities, infrastructures that promote social interaction and access to work with convenient commuting times. The authors of [20] state that social sustainability focuses on personal assets, such as education, consumption, income, employment and the right to actively participate in societal activities [21]. In [22], it is emphasized that social sustainability may have three general orientations: towards behavioral change to achieve environmental goals; towards preserving socio-cultural patterns and practices; and towards the mitigation of poverty and inequity. Finally, the authors of [23] identify social sustainability indicators from societal and corporate perspectives.
Thus, a list of consensual indicators to assess corporate social sustainability is not foreseen in the near future. A major challenge is to address social sustainability by linking short-term financial to long-term social objectives [24].
A most used sustainability assessment framework was developed by [25], and states that firms influence social sustainability in four aspects: through its employees, local community, stakeholder participation especially via information sharing and decision-making participation, and macro-social performance.
Because the socio-economic impacts are related to the impacts of firms on their stakeholders and on economic systems at different spatial levels [26], Corporate Social Responsibility (CSR) is the most used measure to assess social sustainability and larger firms are now incorporating the Global Reporting Initiative (GRI) guidelines in their management practices to encourage an environmentally responsible behavior and to embrace social activities [23].
Accordingly, socio-economic indicators of sustainability are usually related to political institutions (e.g., distributional systems, fair taxation, open political systems and free associations) or economic institutions (e.g., land and resource ownership, property rights, prices and competition, as well as worker and consumer rights) [15]. Because achieving social sustainability requires that firms stimulate the well-being of their employees, rather than merely meet their basic needs [27], along the lines of [28], we argue that, to evaluate sectoral performance, the concept of social sustainability should be translated into metrics, by focusing on indicators that impact on prosperity. In particular, from the employees’ perspective, social sustainability can be assessed by social equity, which is related to job opportunities, training and learning, professional growth and health and safety.
Hence, we measure social sustainability using wages for employees and employment and the average term for receipts (PMR) is used to measure the social sustainability from the perspective of stakeholders (clients). All indicators have an impact on the performance of stakeholders, thus influencing their level of well-being and prosperity and social sustainability, in this perspective. We focus on the Water Collection, Treatment and Distribution, Sanitation, Waste Management and Depollution sector to evaluate corporate social sustainability performance. Since these firms are located in different regions and use different technologies, this suggest that their approach to social sustainability issues might be different, resulting in divergent performances on that matter. Therefore, this study provides the opportunity to uncover an average trend on social sustainabiluty behavior, in this particular sector.
2. Materials and Methods
This paper adopted a narrative approach of the analysis of evolution of these indicators over the period 2008–2019 for the Water Collection, Treatment and Distribution, Sanitation, Waste Management and Depollution sector. Other authors have proposed indicators to measure the social sustainability of firms [7,29,30] using different methodologies with a focus on other countries. For example, a study for Sweden [10] used a survey questionnaire applied to technical systems for energy technologies. A study for Iran [31] developed an analytical and conceptual framework applied to mass construction projects. Another study for Iran [32] elaborated a checklist of indicators collected from the literature and used AHP method in Expert Choice software to analyze the prioritized qualities in pairwise comparison and present the descriptive statistics.
The data sources were Quadros do Pessoal, PORDATA and SABI database. Despite the legal regime for “Quadros do Pessoal” dating back to 1976, making the annual completion of personnel maps by public and private companies with workers mandatory, in 2010 the Single Report was instituted. This document gathers information on the conclusion and termination of fixed-term employment contracts, staff, extra work, professional qualification, occupational safety and health services, and social report and strikes. This data source allows analyzing business structures, employment, working hours, wages, and Collective Labor Regulation.
Created in 2009, PORDATA was developed by the Francisco Manuel dos Santos Foundation, and it collects and disseminates information on multiple areas of society, for Portugal, municipalities, and European countries. Statistics were taken from official and certified sources, such as the National Institute of Statistics.
SABI contains data from Portuguese and Spanish companies, containing current and historical financial reports (up to 25 years) on 2.7 million companies.
Along the lines of studies carried out by OECD, we measured social sustainability using wages [33] for employees’ perspective; employment (number of employees and share of employment by education level) [34,35,36]; and a novel indicator, the average term for receipts (PMR) to measure the social sustainability from the perspective of stakeholders (clients).
Since we do not have sectoral data on PMR, we used SABI’s financial reports for firms operating in NACE rev. 2 code 37.0. We calculated the annual average of PMR and analyzed the time evolution from a sample of 95 firms. Sample size was restrained by the number of SABI companies with PMR values available. All firms presented missing values for the variable average term for payments (PMP), thus we were unable to assess the evolution of this indicator.
We assumed that the greater the growth in average wages and employment, the greater the social sustainability of sectoral firms, and the lower the PMR, the greater the social sustainability. The rationale is that the size and magnitude of these changes is a reflex of the firm’s sound financial position and, thus, it is more capable to maintain or increase wages and dividends and pay its debts. In such a way, the well-being and prosperity of employees, community and stakeholders increase.
Hypothesis 1 (H1).
We expect a rise on average wages that improves social sustainability performance of sectoral firms, from employees’ perspective.
Hypothesis 2 (H2).
We expect an increase in employment that enhances the social sustainability performance of sectoral firms, from the community’s perspective.
Hypothesis 3 (H3).
Since the financial crisis was more than ten years ago, we expect firms to have improved their financial performance and, thus, an expected decrease in PMR improves the social sustainability performance of sectoral firms, from stakeholders’ perspective.
3. Results
Analyzing Figure 1, it appears that the average monthly remuneration of employees in the Water Collection, Treatment and Distribution, Sanitation, Waste Management and Depollution sector has fluctuated over the years, although it has been increasing since 2016, reaching a record of EUR 1154.30 in 2019. We can grasp the influence of business cycles on the evolution of sectoral wages. The financial crisis of 2008 and the subsequent period of 2010–2013 (Panel A) and 2016 (Panel B) were particularly expressive of the effects of the downturn, with average wages in the sector displaying a negative growth. We found that, on average, over the period 2008–2019, the increase in minimum wage (22%) was not followed by corresponding increases in the sectoral average wage (0.55%).
Average wages were calculated as total, without distinguishing the pay grade of employees according to their skills. A detailed analysis of the evolution of wages according to skills showed that changes over time reflect the wages of top categories, since the lowest levels tend to be stable over the period. In contrast, a trend towards higher average wages slower than the evolution of the minimum wage resulted in an increase in the percentage of workers earning the national minimum wage. This development suggests a greater capacity of the wage structure to accommodate wage increases at levels just above the minimum wage in the period prior to the 2008 financial crisis.
As a result, over time, the minimum wage has come closer to the average wage in the sector, which suggests losses in the purchasing power of employees. Thus, the analysis of Figure 1 suggests a corporate performance in terms of social sustainability that worsened after 2010, but relatively recovered from 2017 onwards. The minimum wage is traditionally indexed to inflation, revealing the degradation of the social sustainability of companies in the sector.
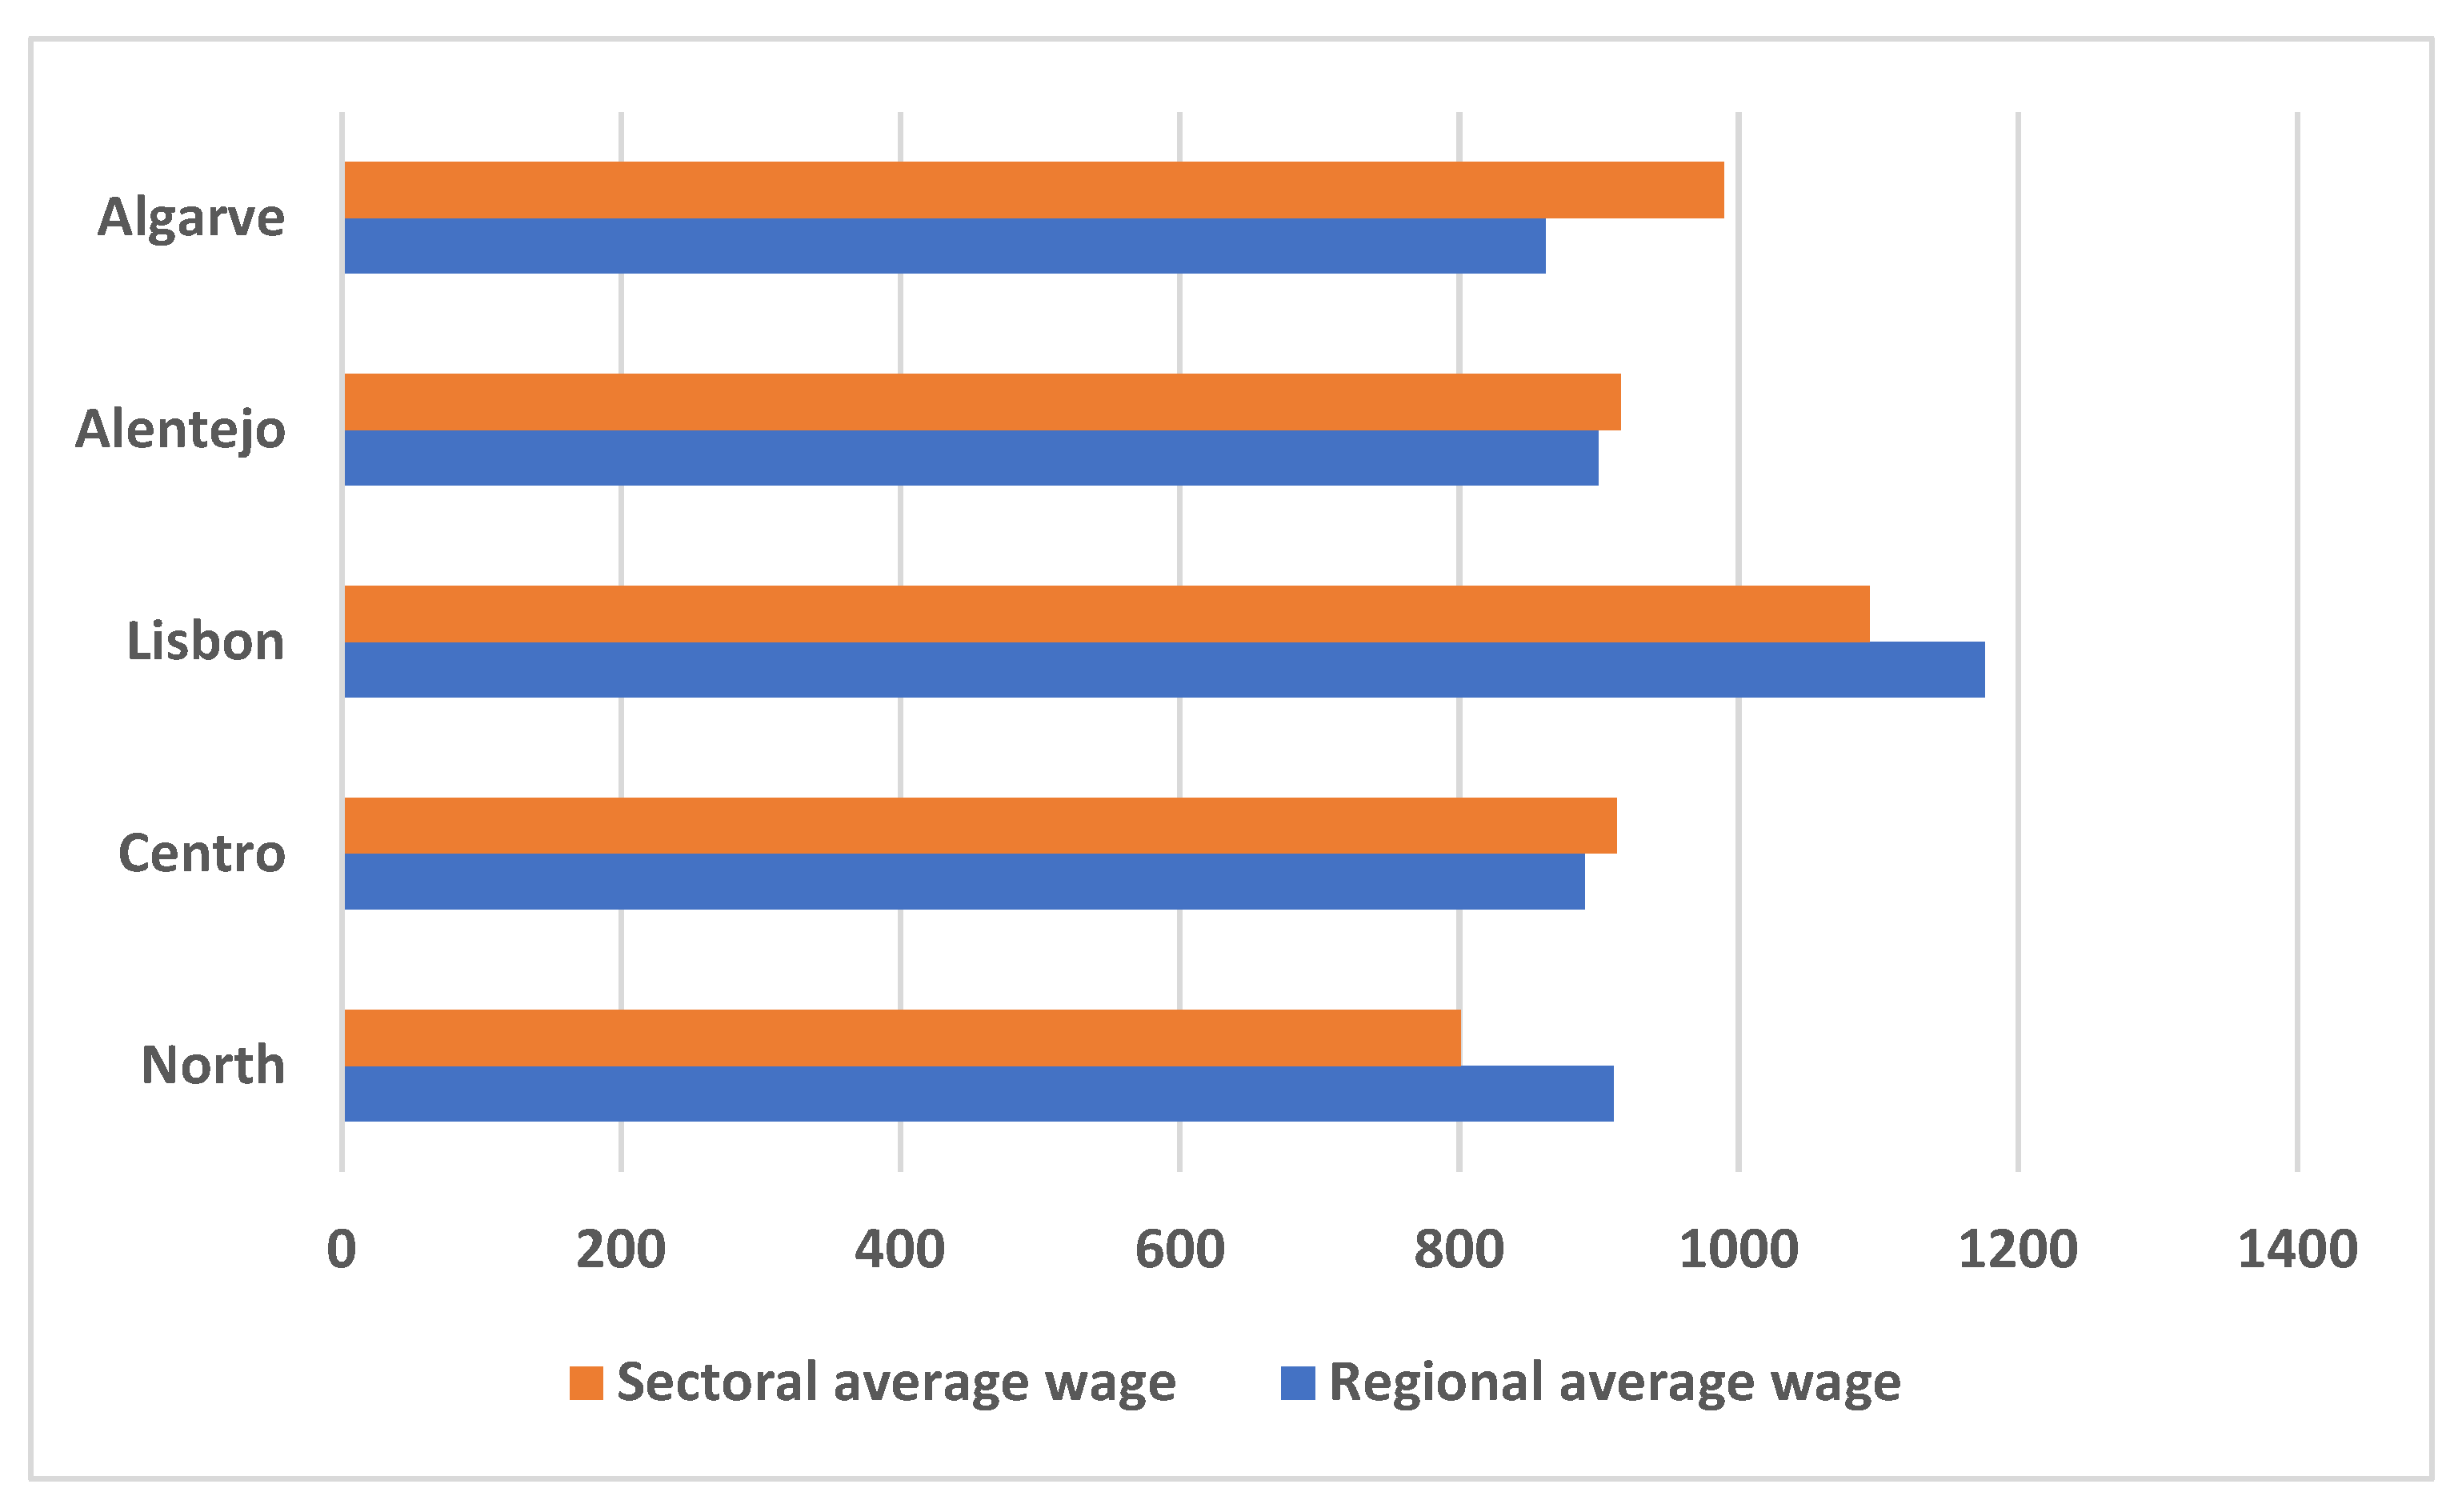
Analyzing average remunerations by regions, as of April 2019 (Figure 2), it appears that employees in this sector in the Lisbon Metropolitan Area earn higher wages than their colleagues in other regions. However, the sectoral average remuneration in Lisbon was still below the regional average. An inverse relationship is found among employees in the Centro region and Algarve, whose sectoral average remuneration is higher than the regional average.
Concerning the number of firms in the sector and characterizing them according to their size, in October 2019, the majority are SMEs, employing up to 250 employees (96.6%, which corresponds to 596 out of 617 firms), following the national trend. These firms employed a total of 13,684 individuals (53.97% of the total number of employees in the sector) and the remaining 21 firms, considered large, employed 11,672 individuals (46.03% of the total number of employees in the sector).
Analyzing the distribution of these firms by NUTsII regions and according to Table 1, it appears that most firms are located in the North and Centro regions (31.6% and 27%, respectively); 20.9% in Lisbon; 13.1% in Alentejo; and 7.4% in Algarve. It should be noted that this distribution is identical to the distribution of establishments nationwide.
Regarding the number of employees in this sector by regions, firms located in the North employed, as of October 2019, 33.7% of the total number of individuals working in the sector, while the regions of Centro and Lisbon Metropolitan Area employed 20.4%, and 26.8%, respectively. Firms in Alentejo and Algarve, on the other hand, registered employability values in the sector of 9.6% each. It should be noted that these values are in line with the percentage distribution of firms by region, with a higher weight both in terms of firms and the number of employees, in the North, Centro and Lisbon Metropolitan Area. These values are also comparable to national global values, where firms located in these three regions, at the reference date, had a weight of 86.1% compared to the total number of firms in mainland, and employed 88.93% of individuals. It should also be noted that most firms are national with private capital.
Analyzing firms by age, it appears that most firms in this sector are relatively recent, where at the time of analysis 60.1% were between 5 years old and 19 years old (38.7% were between 10 years old and 19 years old and 21.4% were between 5 years old and 9 years old), followed by firms that were 20 years old to 49 years old (20.1%), firms that were 1 years old to 4 years old (16%) and, finally, firms that were less than 1 year old (3.1%) and aged 50 years or over (0.6%).
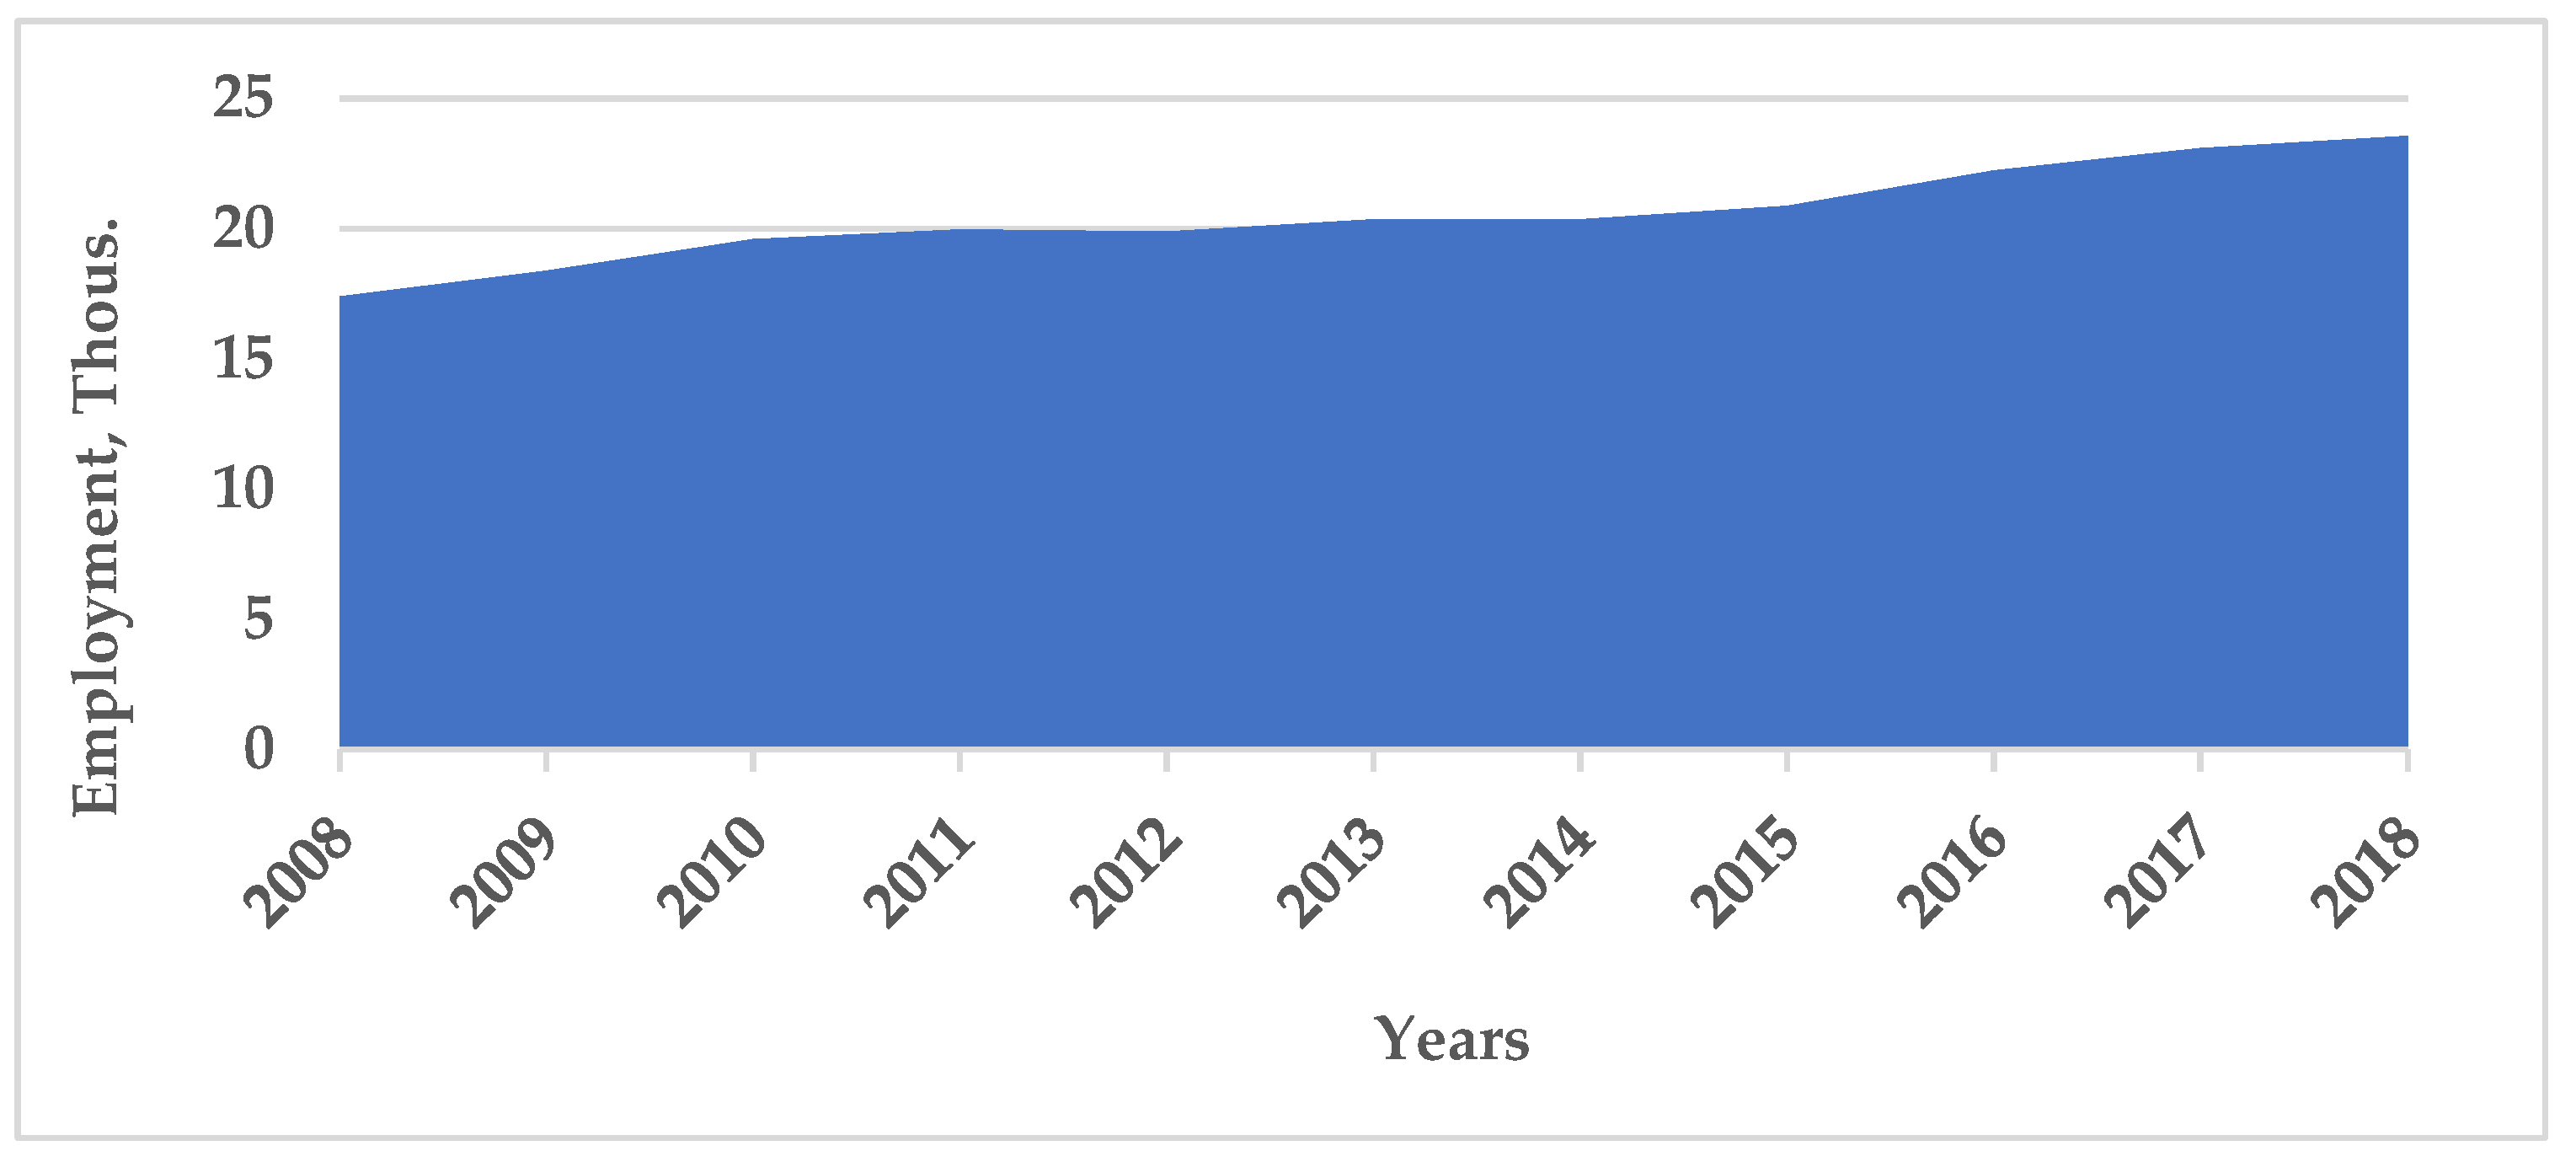
Figure 3 shows the evolution of sectoral employment in 2008–2019. Similar to the average wage trend, we can find three distinct periods: (i) at the beginning of the financial crisis (2008), when employment increased slightly; (ii) after 2010 and until 2016, when employment stagnated; and (iii) from 2017 onwards, with a more accentuated increase in employment in the sector. Thus, this analysis suggests an improvement in the performance of companies in the sector in terms of social sustainability.
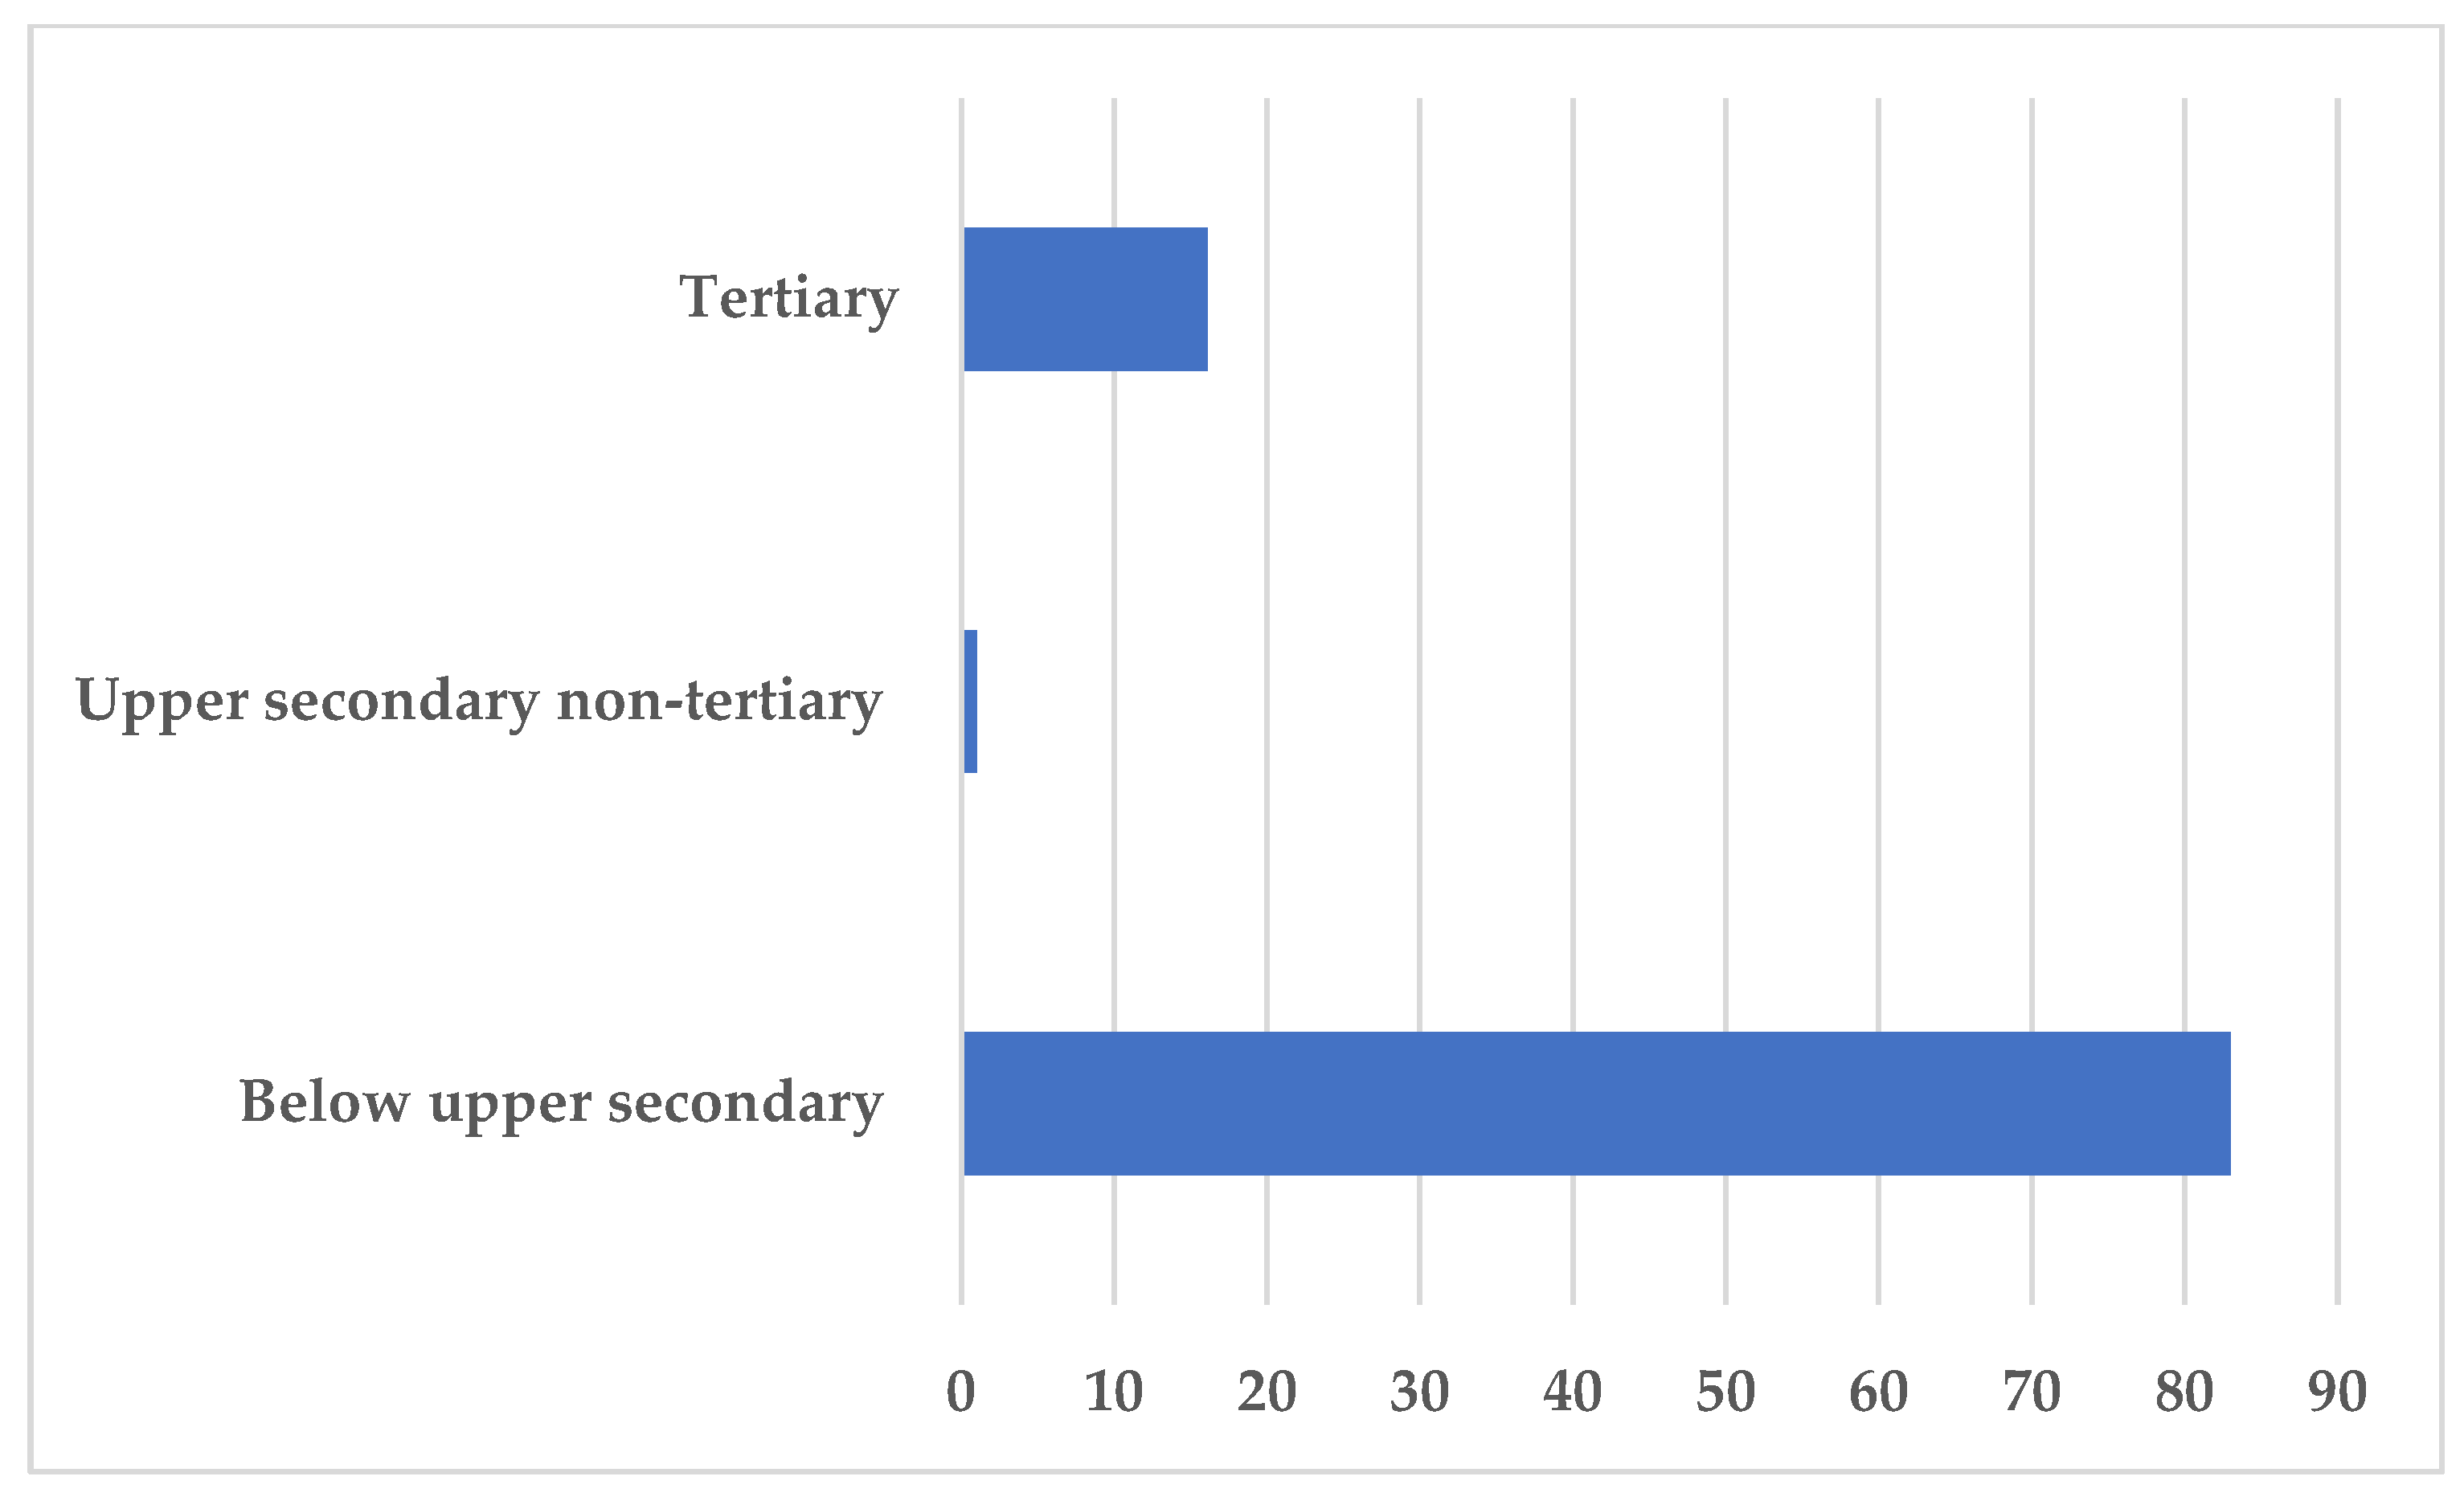
According to [20], social sustainability focuses on individual assets, such as education. Thus, with reference to the education level (Figure 4), most employees in this sector, in 2019, did not exhibit a high academic background and only less than 20% fell in the category of tertiary level. The results suggest that, from the educational point of view, firms in this sector do not seem to contribute for social sustainability. However, to draw conclusions on this matter a comprehensive analysis of the evolution of the education levels of employees over time, and the number of yearly training sessions would provide more insights about firms’ contribution to the improvement of education levels, and thus, on corporate performance regarding social sustainability.
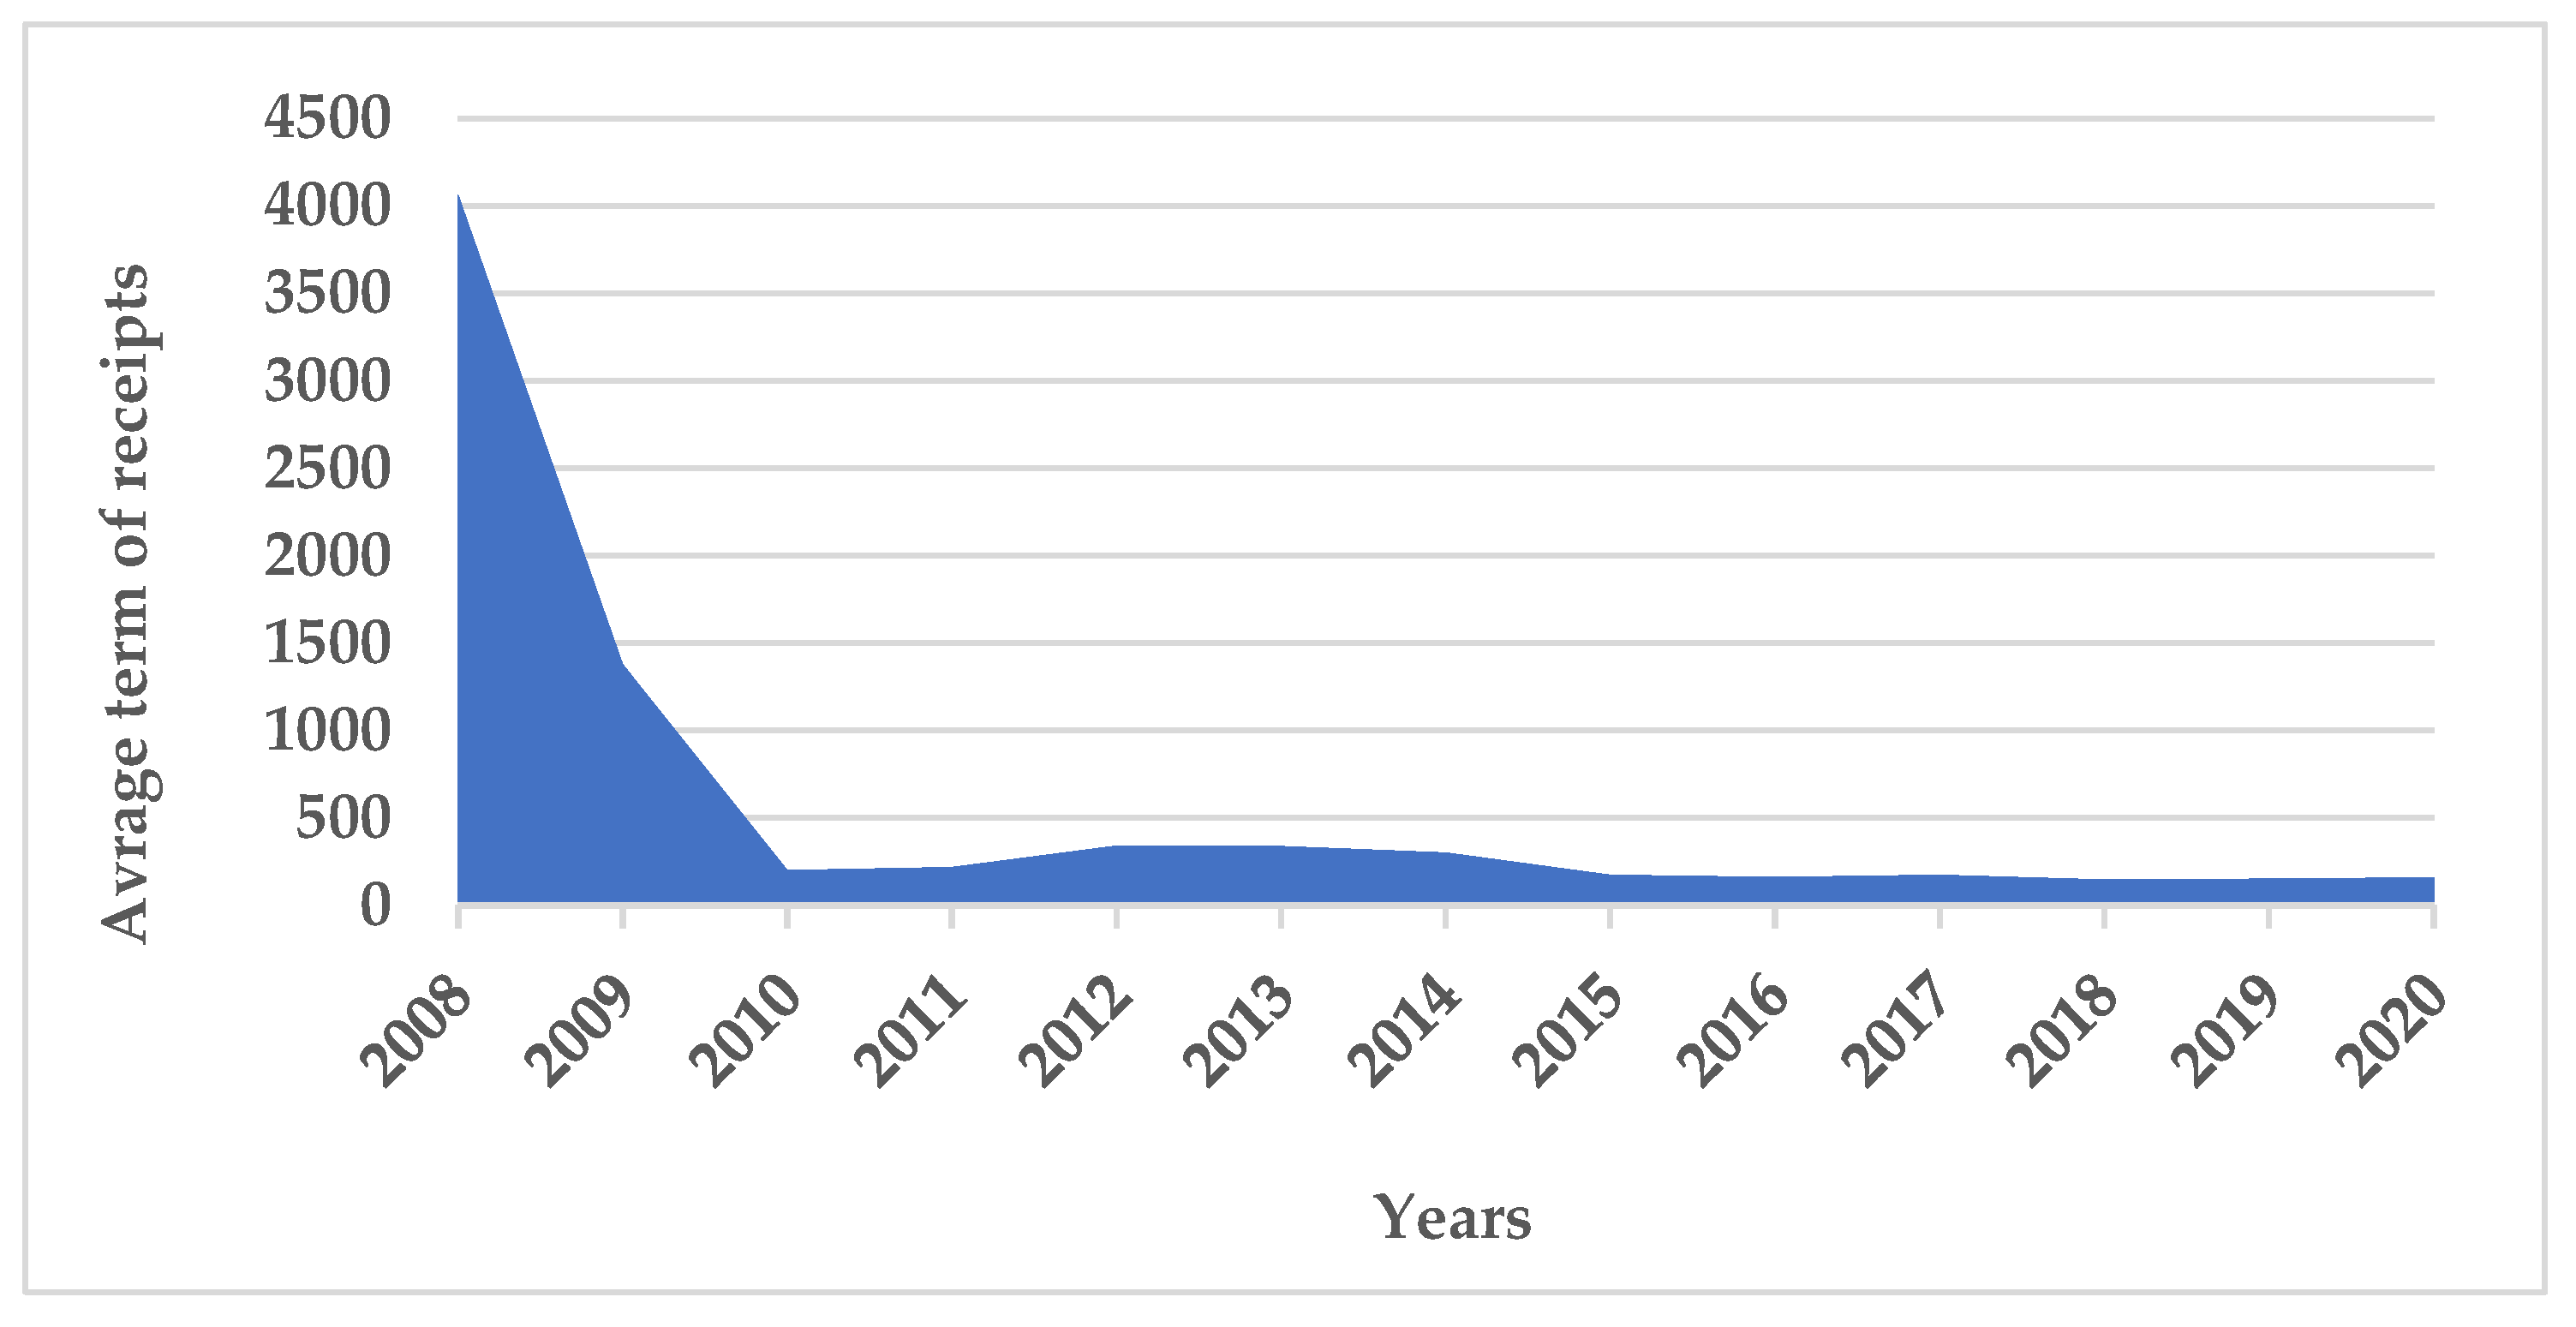
Figure 5 reveals an improvement in the liquidity of firms in the sector, translated into a drastic reduction in the PMR, so the social sustainability of stakeholders (customers) improved.
4. Discussion
Currently, it is widely recognized that consistent development in undertaking environmental issues requires a sustainability approach that incorporates economic issues and social justice [37]. This entails an integrated insight of sustainability in which the three pillars are attached and interrelated. For example, economic and environmental sustainability can be driven along with fundamental social factors, namely justice and equity, health, education, culture and employee involvement within a firm. Thus, firms are expected to support certain activities, such as healthcare, day care and educational opportunities [38]. However, until now, the literature has approached social sustainability in an uneven manner.
Given that social sustainability encourages human well-being, particularly for vulnerable groups [39], firms recognize the prominence of CSR. Therefore, it became necessary to implement more efficient and refined methods and tools to assess the social sustainability of firms [40]. However, a big challenge for firms is to balance financial goals with long-term social goals [41]. One way to address this challenge involves facing competitiveness as a guarantor of economic sustainability, but also as an element to protect material and human resources in order to continue the needs of future generations.
The importance of corporate performance regarding social sustainability is closely linked to a healthy business structure that socially meets stakeholder expectations [42] and minimizes long-term negative environmental impacts [43]. In other words, corporate sustainability is crucial to achieve the company’s objectives without losing its competitive advantage, ensuring economic growth, environmental management and providing social responsibilities [44]. Indeed, because there is a wide range of definitions for social sustainability in the literature [45], and different understandings of the concept among stakeholders and sometimes antagonistic interests [44,46], we support the view of [24] that a results-oriented approach to social sustainability is needed to encourage firms’ managers to take actions to improve corporate performance on social sustainability.
Reporting to our hypotheses, H1 is partly confirmed, and H2 and H3 are confirmed.
Indeed, because average wages oscillated in 2008–2013, only from 2016 was it possible for firms to improve their social sustainability performance. Moreover, because changes over time reflect wage changes on top categories of employees, the lowest levels remaining stable over the period, it raises the question of the validity of wages as a reliable indicator of social sustainability in firms that employ a great share or exclusively unskilled labor. In addition, because there is evidence that, over time, the minimum wage has come closer to the sectoral average wage, suggesting that the purchasing power of employees on top levels decreased, it appears that the joint analysis of the evolution of average sectoral wage and minimum wage indicates that the social sustainability of firms in this sector actually has worsened.
The validation of H2 and H3 suggests that sectoral firms are improving their performance regarding social sustainability. Indeed, as of 2017, after a turbulent period, following the 2008 financial crisis, sectoral firms appear to have regained their momentum regarding their impact on social grounds. The recent literature highlights factors that can contribute to the improvement of corporate social sustainability, such as agility and lean practices [47], buyer knowledge transfer activities [48], cross-border collaboration [49] and the hiring of chief sustainability officers [43].
We argue in this paper that, for the sake of the progress in research, sustainability indicators must be quantifiable and therefore they should incorporate the economic dimension. Related to that, we also support the idea that the three dimensions of sustainability must be linked. For example, studies should not overlap the economic focus with the social and environmental aspects, and so forth.
Accordingly, and along the lines with previous studies, we use socio-economic indicators to assess corporate social sustainability performance. However, criticisms on these social sustainability indicators include the blurred lines between the economic and social dimensions and the unstandardized nature of the assessment that prevent companies to benchmark against rivals, which is one of the primary goals of leading social assessment approaches [15]. Other authors (e.g., [22]) highlight the fact that there is no grade scale supporting the levels of corporate contribution to the well-being of their employees. The common practice is simply mandating workers be allowed to collectively bargain and earn the minimum wage.
However, this paper has some limitations. First, this research uses only three indicators of social sustainability. Second, finding social sustainability indicators that adequately measure the level of prosperity and well-being is not easy because they are imbibed with non-mensurable concepts, such as happiness. Third, one might point out that this research uses aggregated data for the sector and annual averages, so it does not reflect the heterogeneity of firms in the sector, with regard to the evolution of their social sustainability performance. It would be interesting to analyze, for example, in which region of the country firms show more resilience toward financial crises, by analyzing the evolution of employment and average wage levels. Fourth, the focus of this paper is just on one sector, but a complete picture of the Portuguese economy would have to be provided by an extensive analysis of all sectors.
5. Conclusions
The results provide some insights for strategic decision making towards improving the social sustainability of sectoral firms. For example, acknowledging key drivers and barriers to social sustainability can help managers promote good practices and predict challenges. Furthermore, there is evidence that managers focused on the social sustainability of their firms are more likely to develop behavioral skills, such as collaboration, open mind, humility, empathy and encouragement, which may constitute an incentive to productivity and consequent economic sustainability of firms.
The regional analysis of the sector shows a concentration of firms (86.1%) and employment (88.93%) in three regions of the mainland: North, Centro and Lisbon Metropolitan Area. However, a more detailed analysis across regions shows differences in the social sustainability of sectoral firms. For example, in the Lisbon Metropolitan Area the sectoral average wage is below the regional average; while in the Centro, it is higher than the regional average. This suggests better corporate performances regarding social sustainability in firms located in the Centro region.
The analysis of the sector in 2019 uncovered a pattern where only 20% of workers has tertiary education, which suggests the weak social sustainability of this sector, compared, for example, with science-based industries (e.g., chemicals, pharmaceuticals and electronics). Part of our analysis, with regard to the average wage, highlighted two main features: (i) a distinct growth in the minimum wage at a much higher pace than the increase in nominal average wages; and (ii) a heterogeneous pattern of share of employees with a minimum wage. These facts may question the importance of raising the minimum wage in this sector. Along with a trend of stagnation/moderate increase in average nominal wages, we can hypothesize that firms with higher shares of employees being paid the minimum wage may have experienced greater growth in the average nominal wages in this period.
The results suggest the influence of economic cycles on the social sustainability performance of sectoral firms. Indeed, after a drop in sectoral average wages in the aftermath of the financial crisis, from 2017 onwards, firms appear to have regained momentum in terms of their social impact. It may be the case that Portuguese firms operating in the Water and Sanitation sector do not have enough resilience to maintain the well-being of their employees, during downturns. The literature suggests factors that can contribute to improve corporate social sustainability, such as agility and lean practices, buyer knowledge transfer activities, international collaboration and the hiring of sustainability directors. Moreover, the results suggest the need to improve the human resources allocation, so that these firms can maintain the wage levels of top-level employees during downturns. In this context, the short-term solution would imply a rationalization of human resources with the consequent loss of social sustainability. This, however, could allow the maintenance of long-term social sustainability. In a context of change from the conventional leadership role, embodied in a decentralization of decisions from top managers to operational teams, and the current turmoil in the global businesses, managers must be able to redirect human resources talent in response to rapidly changing labor demography.
Another insight of this study is that, since lower wage levels have remained stable over the period, the validity of wages as a reliable indicator of social sustainability in firms that employ a large share or exclusively unskilled labor may be questioned. In contrast, with regard to employment, the results show a clear improvement in the corporate performance of social sustainability. In addition, from the perspective of customers, there was an improvement in the liquidity of firms, translated into a sharp drop in the PMR. Therefore, social sustainability improved during this period.
As far as we are aware, this is the first study to use the PMR to assess corporate social sustainability in the period 2008–2019, in Portugal and in this specific sector. This indicator is easy to collect given the mandatory nature of firms’ financial statements and appears to be reliable since it corroborates the main findings of some other measures of social sustainability employed. However, it must be kept in mind that the assessment of corporate social sustainability must be measured from the perspective of all stakeholders.
To sum-up, we posit that the adoption of social sustainability practices in firms may improve the quality of life of employees and the well-being of society. In this framework, the support of employees and the improvement of their skills and competences are crucial. Given current debates about the adoption of social sustainability practices in firms and the associated human resource challenges, this study provides some valuable insights for the water and sanitation sector in Portugal, academia and policy makers to address gaps in the sector that prevent the successful application of social sustainability practices.
This study also provides the opportunity to uncover average sectoral trends in social sustainability. However, it has a number of limitations, such as the use of only three indicators and the use of aggregated data for only one sector and annual averages, not reflecting the heterogeneity of firms in the sector and between sectors in terms of the evolution of their social sustainability performance. Furthermore, the proposed indicators only suggest clues regarding the measurement of the level of prosperity and well-being.
These caveats provide plenty room for development and can provide a useful basis for further research on this subject. For example, avenues of future research may include regional-level analysis of firms that are more resilient during downturns. In addition, future studies could calculate the age-weighted annual employment change of firms to measure the relative impact of the firm and sector on society.
Author Contributions
Conceptualization, E.S.; methodology, E.S. and J.M.; software, E.S.; validation, E.S. and J.M.; formal analysis, E.S. and J.M. investigation, E.S. and J.M.; resources, E.S. and J.M.; writing—original draft preparation, E.S. and J.M.; writing—review and editing, E.S. and J.M.; supervision, E.S.; project administration E.S.; funding acquisition, E.S. and J.M. All authors have read and agreed to the published version of the manuscript.
Funding
This research is financed by National Funds of the FCT—Portuguese Foundation for Science and Technology within the project «UIDB/04928/2020» and, under the Scientific Employment Stimulus—Institutional Call CEECINST/00051/2018.
Institutional Review Board Statement
Not applicable.
Informed Consent Statement
Not applicable.
Data Availability Statement
Data available in a publicly accessible repository. The data presented in this study (Quadros do Pessoal and Pordata) are openly available in http://www.gep.mtsss.gov.pt/sinteses-/-publicacoes, accessed on 22 December 2021, and https://www.pordata.pt/Portugal/ accessed on 22 December 2021. Restrictions apply to the availability of PMR data. Data was obtained from SABI.
Conflicts of Interest
The authors declare no conflict of interest.
References
- Rosati, F.; Faria, L.G. Addressing the SDGs in sustainability reports: The relationship with institutional factors. J. Clean. Prod. 2019, 215, 1312–1326. [Google Scholar] [CrossRef]
- Murphy, E.; Walsh, P.P.; Banerjee, A. Framework for Achieving the Environmental Sustainable Development Goals; Environmental Protection Agency: Wexford, Ireland, 2021.
- Sparviero, S.; Ragnedda, M. Towards digital sustainability: The long journey to the sustainable development goals 2030. Digit. Policy Regul. Gov. 2021, 23, 216–228. [Google Scholar] [CrossRef]
- Torkayesh, A.E.; Ecer, F.; Pamucar, D.; Karamaşa, Ç. Comparative assessment of social sustainability performance: Integrated data-driven weighting system and CoCoSo model. Sustain. Cities Soc. 2021, 71, 102975. [Google Scholar] [CrossRef]
- Lami, I.M.; Mecca, B. Assessing social sustainability for achieving sustainable architecture. Sustainability 2021, 13, 142. [Google Scholar] [CrossRef]
- Gangi, F.; D’Angelo, E.; Daniele, L.M.; Varrone, N. Assessing the impact of socially responsible human resources management on company environmental performance and cost of debt. Corp. Soc. Responsib. Environ. Manag. 2021, 28, 1511–1527. [Google Scholar] [CrossRef]
- Yıldızbaşı, A.; Öztürk, C.; Efendioğlu, D.; Bulkan, S. Assessing the social sustainable supply chain indicators using an integrated fuzzy multi-criteria decision-making method: A case study of Turkey. Environ. Dev. Sustain. 2021, 23, 4285–4320. [Google Scholar] [CrossRef]
- Matshusa, K.; Leonard, L.; Thomas, P. The Contribution of Geotourism to Social Sustainability: Missed Opportunity. Int. J. Sustain. Econ. Soc. Cult. Context 2021, 17, 95–118. [Google Scholar] [CrossRef]
- Baghizadeh, K.; Zimon, D.; Jum’a, L. Modeling and optimization sustainable forest supply chain considering discount in transportation system and supplier selection under uncertainty. Forests 2021, 12, 964. [Google Scholar] [CrossRef]
- Assefa, G.; Frostell, B. Social sustainability and social acceptance in technology assessment: A case study of energy technologies. Technol. Soc. 2007, 29, 63–78. [Google Scholar] [CrossRef]
- Borowy, I. The social dimension of sustainable development at the UN: From Brundtland to the SDGs. In The Struggle for Social Sustainability: Moral Conflicts in Global Social Policy; Bristol University Press, University of Bristol: Bristol, UK, 2021; pp. 89–108. ISBN 978-1-4479-5610-3. [Google Scholar]
- Rodríguez, R.; Svensson, G.; Ferro, C. Assessing the future direction of sustainable development in public hospitals: Time-horizon, path and action. Health Policy 2021, 125, 526–534. [Google Scholar] [CrossRef]
- Azmat, F.; Jain, A.; Michaux, F. Strengthening impact integrity in investment decision-making for sustainable development. Sustain. Account. Manag. Policy 2022, 13, 55–87. [Google Scholar] [CrossRef]
- Alkaraan, F.; Albitar, K.; Hussainey, K.; Venkatesh, V.G. Corporate transformation toward Industry 4.0 and financial performance: The influence of environmental, social, and governance (ESG). Technol. Forecast. Soc. Change 2022, 175, 121423. [Google Scholar] [CrossRef]
- Walker, A.M.; Opferkuch, K.; Lindgreen, E.R.; Simboli, A.; Vermeulen, W.J.; Raggi, A. Assessing the social sustainability of circular economy practices: Industry perspectives from Italy and the Netherlands. Sustain. Prod. Consum. 2021, 27, 831–844. [Google Scholar] [CrossRef]
- Journeault, M.; Perron, A.; Vallières, L. The collaborative roles of stakeholders in supporting the adoption of sustainability in SMEs. J. Environ. Manag. 2021, 287, 112349. [Google Scholar] [CrossRef]
- Stål, H.I.; Bengtsson, M.; Manzhynski, S. Cross-sectoral collaboration in business model innovation for sustainable development: Tensions and compromises. Bus. Strategy Environ. 2021. [Google Scholar] [CrossRef]
- Viererbl, B.; Koch, T. The paradoxical effects of communicating CSR activities: Why CSR communication has both positive and negative effects on the perception of a company’s social responsibility. Public Relat. Rev. 2022, 48, 102134. [Google Scholar] [CrossRef]
- Chan, E.; Lee, G.K. Critical factors for improving social sustainability of urban renewal projects. Soc. Indic. Res. 2008, 85, 243–256. [Google Scholar] [CrossRef]
- Omann, I.; Spangenberg, J. Assessing social sustainability; the social dimension of sustainability in a socio-economic scenario. Sustainable Europe Research Institute SERI. In Proceedings of the 7th Biennial Conference of the International Society for Ecological Economics, Sousse, Tunisia, 6–9 March 2002. [Google Scholar]
- Baffoe, G.; Mutisya, E. Social sustainability: A review of indicators and empirical application. Environ. Manag. Sustain. Dev. 2015, 4, 242–262. [Google Scholar] [CrossRef] [Green Version]
- Hale, J.; Legun, K.; Campbell, H.; Carolan, M. Social sustainability indicators as performance. Geoforum 2019, 103, 47–55. [Google Scholar] [CrossRef]
- Husgafvel, R.; Pajunen, N.; Virtanen, K.; Paavola, I.L.; Paavola, M.P.; Inkinen Inkinen, V.; Heiskanen, K.; Dahl, O.; Ekroos, A. Social sustainability performance indicators–experiences from process industry. Int. J. Sustain. Eng. 2015, 8, 14–25. [Google Scholar] [CrossRef]
- Ajmal, M.M.; Khan, M.; Hussain, M.; Helo, P. Conceptualizing and incorporating social sustainability in the business world. Int. J. Sustain. Dev. World Ecol. 2018, 25, 327–339. [Google Scholar] [CrossRef]
- Labuschagne, C.; Brent, A.C.; Van Erck, R.P. Assessing the sustainability performances of industries. J. Clean. Prod. 2005, 13, 373–385. [Google Scholar] [CrossRef] [Green Version]
- Global Reporting Initiative. What is Sustainability Reporting. 2019. Available online: https://www.gri.org (accessed on 25 December 2021).
- Bhavsar, A.; Diallo, C.; Ülkü, M.A. Towards sustainable development: Optimal pricing and sales strategies for retailing fair trade products. J. Clean. Prod. 2021, 286, 124990. [Google Scholar] [CrossRef]
- Vermeulen, W.J. Substantiating the rough consensus on concept of sustainable development as point of departure for indicator development. In Routledge Handbook of Sustainability Indicators; Routledge: London, UK, 2018. [Google Scholar]
- Papageorgiou, A.; Henrysson, M.; Nuur, C.; Sinha, R.; Sundberg, C.; Vanhuyse, F. Mapping and assessing indicator-based frameworks for monitoring circular economy development at the city-level. Sustain. Cities Soc. 2021, 75, 103378. [Google Scholar] [CrossRef]
- Bouillass, G.; Blanc, I.; Perez-Lopez, P. Step-by-step social life cycle assessment framework: A participatory approach for the identification and prioritization of impact subcategories applied to mobility scenarios. Int. J. Life Cycle Assess. 2021, 26, 2408–2435. [Google Scholar] [CrossRef]
- Karji, A.; Woldesenbet, A.; Khanzadi, M.; Tafazzoli, M. Assessment of social sustainability indicators in mass housing construction: A case study of mehr housing project. Sustain. Cities Soc. 2019, 50, 101697. [Google Scholar] [CrossRef]
- Abousaeidi, M.; Hakimian, P. Developing a checklist for assessing urban design qualities of residential complexes in new peripheral parts of Iranian cities: A case study of Kerman, Iran. Sustain. Cities Soc. 2020, 60, 102251. [Google Scholar] [CrossRef]
- OECD. Average Wages (Indicator). 2020. Available online: https://0-www-oecd--ilibrary-org.brum.beds.ac.uk/employment/average-wages/indicator/english_cc3e1387-en (accessed on 25 December 2021).
- OECD. Employment Rate (Indicator). 2020. Available online: https://0-www-oecd--ilibrary-org.brum.beds.ac.uk/employment/employment-rate/indicator/english_1de68a9b-en (accessed on 25 December 2021).
- OECD. Labour force (Indicator). 2020. Available online: https://0-www-oecd--ilibrary-org.brum.beds.ac.uk/employment/labour-force/indicator/english_ef2e7159-en (accessed on 25 December 2021).
- OECD. Adult education Level (Indicator). 2020. Available online: https://0-www-oecd--ilibrary-org.brum.beds.ac.uk/education/adult-education-level/indicator/english_36bce3fe-en (accessed on 25 December 2021).
- Peterson, N.D. Introduction to the special issue on social sustainability: Integration, context, and governance. Sustain. Sci. Pract. Policy 2016, 12, 3–7. [Google Scholar] [CrossRef]
- Christofi, A.; Christofi, P.; Sisaye, S. Corporate sustainability: Historical development and reporting practices. Manag. Res. Rev. 2012, 35, 157–172. [Google Scholar] [CrossRef]
- Rachelle, H.; Amekudzi-Kennedy, A.; Sarah, B.; Benya, F.; Cliff, D. Network priorities for social sustainability research and education: Memorandum of the integrated network on social sustainability research group. Sustain. Sci. Pract. Policy 2016, 12, 16–21. [Google Scholar]
- Arora, P.; Nicole, P.; Bert, F.; Guillermo, P. Managing the triple bottom line for sustainability: A case study of Argentine agribusinesses, sustainability. Sci. Pract. Policy 2016, 12, 60–75. [Google Scholar] [CrossRef] [Green Version]
- Buser, M.; Koch, C. Is this none of the contractor’s business? Social sustainability challenges informed by literary accounts. Constr. Manag. Econ. 2014, 32, 749–759. [Google Scholar] [CrossRef]
- Artiach, T.; Lee, D.; Nelson, D.; Walker, J. The determinants of corporate sustainability performance. Account. Financ. 2010, 50, 31–51. [Google Scholar] [CrossRef]
- Fu, R.; Tang, Y.; Chen, G. Chief sustainability officers and corporate social (Ir) responsibility. Strateg. Manag. J. 2020, 41, 656–680. [Google Scholar] [CrossRef]
- Koc, S.; Durmaz, V. Airport corporate sustainability: An analysis of indicators reported in the sustainability practices. Procedia Soc. Behav. Sci. 2015, 181, 158–170. [Google Scholar] [CrossRef] [Green Version]
- Weingaertner, C.; Moberg, Å. Exploring social sustainability: Learning from perspectives on urban development and companies and products. Sustainable Dev. 2014, 22, 122–133. [Google Scholar] [CrossRef] [Green Version]
- Govindan, K.; Shaw, M.; Majumdar, A. Social sustainability tensions in multi-tier supply chain: A systematic literature review towards conceptual framework development. J. Clean. Prod. 2021, 279, 123075. [Google Scholar] [CrossRef]
- Nath, V.; Agrawal, R. Agility and lean practices as antecedents of supply chain social sustainability. Int. J. Oper. Prod. Manag. 2020, 40, 1589–1611. [Google Scholar] [CrossRef]
- Awan, U.; Khattak, A.; Rabbani, S.; Dhir, A. Buyer-driven knowledge transfer activities to enhance organizational sustainability of suppliers. Sustainability 2020, 12, 2993. [Google Scholar] [CrossRef] [Green Version]
- Awan, U.; Kraslawski, A.; Huiskonen, J. Governing Interfirm Relationships for Social Sustainability: The Relationship between Governance Mechanisms. Sustain. Collab. Cult. Intell. 2018, 10, 4473. [Google Scholar]
Figure 1.
Evolution of the sectoral average wage and minimum wage. Source: Quadros do Pessoal and PORDATA.
Figure 1.
Evolution of the sectoral average wage and minimum wage. Source: Quadros do Pessoal and PORDATA.

Figure 2.
Evolution of the sectoral average remuneration vs. average national remuneration, by regions in April 2019. Source: Quadros do Pessoal and PORDATA.
Figure 2.
Evolution of the sectoral average remuneration vs. average national remuneration, by regions in April 2019. Source: Quadros do Pessoal and PORDATA.

Figure 3.
Evolution of the sectoral employment. Source: Quadros do Pessoal.

Figure 4.
Employees by education level (%), April 2019. Source: Quadros do Pessoal.

Figure 5.
Evolution of the sectoral average term of receipts. Source: SABI Financial Reports.


Table 1.
Sectoral share of firms and employment.
| North | Centro | Lisbon Metropolitan Area | Alentejo | Algarve | |
|---|---|---|---|---|---|
| Firms (%) | 31.6 | 27 | 20.9 | 13.1 | 7.4 |
| Employees (%) | 33.7 | 20.4 | 26.8 | 9.6 | 9.6 |
Publisher’s Note: MDPI stays neutral with regard to jurisdictional claims in published maps and institutional affiliations. |
© 2021 by the authors. Licensee MDPI, Basel, Switzerland. This article is an open access article distributed under the terms and conditions of the Creative Commons Attribution (CC BY) license (https://creativecommons.org/licenses/by/4.0/).
Share and Cite
MDPI and ACS Style
Santos, E.; Moreira, J. Social Sustainability of Water and Waste Management Companies in Portugal. Sustainability 2022, 14, 221. https://0-doi-org.brum.beds.ac.uk/10.3390/su14010221
AMA Style
Santos E, Moreira J. Social Sustainability of Water and Waste Management Companies in Portugal. Sustainability. 2022; 14(1):221. https://0-doi-org.brum.beds.ac.uk/10.3390/su14010221
Chicago/Turabian StyleSantos, Eleonora, and Jacinta Moreira. 2022. "Social Sustainability of Water and Waste Management Companies in Portugal" Sustainability 14, no. 1: 221. https://0-doi-org.brum.beds.ac.uk/10.3390/su14010221
Note that from the first issue of 2016, this journal uses article numbers instead of page numbers. See further details here.