
Modeling the Impact of High Temperature on Mortality in Pakistan

Department of Statistics, College of Computer Science and Information System, Institute of Business Management Karachi, Karachi 75270, Pakistan
*
Author to whom correspondence should be addressed.
Sustainability 2022, 14(1), 332; https://0-doi-org.brum.beds.ac.uk/10.3390/su14010332
Submission received: 25 November 2021
/
Revised: 20 December 2021
/
Accepted: 24 December 2021
/
Published: 29 December 2021
(This article belongs to the Topic Climate Change and Environmental Sustainability)
Abstract
:The objective of this paper is to model and study the impact of high temperature on mortality in Pakistan. For this purpose, we have used mortality and climate data consisting of maximum temperature, variation in monthly temperature, average rainfall, humidity, dewpoint, as well as average air pressure in the country over the period from 2000 to 2019. We have used the Generalized Linear Model with Quasi-Poisson link function to model the number of deaths in the country and to assess the impact of maximum temperature on mortality. We have found that the maximum temperature in the country has a significant impact on mortality. The number of deaths in Pakistan increases as the maximum temperature increases. We found that, as the maximum temperature increase beyond 30 °C, mortality increases significantly. Our results indicate that mortality increases by 27% when the maximum temperature in the country increases from medium category to a very high level. Similarly, the number of deaths in the country increases by 11% when the temperature increases from medium temperature to high level. Furthermore, our study found that when the maximum temperature in the country decreases from a medium level to a low level, the number of deaths in the country decreases by 23%. This study does not consider the impact of other factors on mortality, such as age, medical conditions, gender, geographical location, as well as variability of temperature across the country.
1. Introduction
The fifth report of the Intergovernmental Panel on Climate Change (IPCC) indicated that the global climate is changing continuously and there are scientific evidences of a warming climate system [1]. The change in climate affects human health, the environment, as well as quality of life [2]. Over the last 50 years or so, the annual mean temperature of Pakistan has increased by 0.5 °C [3]. A comparison of the maximum monthly temperature of Pakistan over the last two decades shown inFigure 1 indicates that the monthly maximum temperature in Pakistan has increased slightly over the last decade in comparison to the previous decade.
It is expected that by the end of the 21st century, the annual average temperature of Pakistan will increase by 3 °C to 5 °C under a central global emissions scenario (RCP4.5) and 4 °C to 6 °C under a high emissions scenario (RCP 8.5) [3]. Furthermore, Pakistan is considered among those countries where the effects of climate change are expected to be higher than in several other parts of the world [4]. In this article, we study the impact of climate change on mortality in the country.
It is believed that the temperature affects mortality and this phenomenon has been studied by numerous authors around the globe. For instance, Gasparrini et al. assessed the temperature and mortality association in various cities around the globe and he found that most temperature-related mortality was attributable to cold weather [5]. Another study conducted in high-income countries in North East Asia found that mortality is increasing with either cold or hot temperature in urban populations [6]. Similarly, a study conducted in Bangladesh found that the effect of high temperature on all-cause mortality in rural areas is remarkable, whereas cardiovascular and respiratory diseases due to low temperature are high in the region [7]. A study of low temperatures (below 25 °C) and rain fall above 14mm found an increase in the risk of mortality in Bangladesh [8]. Similarly, a study conducted in South Africa found that mortality burden is associated with heat and cold and the impact of heat and cold is higher at younger and older ages [9]. All-cause mortality and mortality due to medical and respiratory conditions showed excessive risk of mortality at moderately cold and hot temperature in India [10]. A study of mortality attributable to high temperature in Spain indicated a nonlinear increase in mortality with increase in temperature [11]. Another study on mortality burden associated with temperature in the largest metropolitan areas of Portugal projected significant mortality burden due to heat [12]. Anderson and Bell [13] showed that higher mortality risk is related to heat waves in 43 cities in the United States. In Moscow, a study on mortality and heat waves confirmed that there is excessive mortality in heat waves and cold spells [14]. The association of temperature and mortality was also confirmed in nine European cities [15]. Naqvi and Hall [16] investigated the effect of future mean temperature on older adult mortality in England, Wales, and Scotland and found that there is a U-shape relationship between temperature and mortality and there exist a range of temperatures at which the mortality is higher on its both sides of the range. In Iran, the mortality and diurnal temperature range association study showed that, in high diurnal temperature ranges during the hot season, the Cumulative Relative Risk of non-accidental deaths, and cardiovascular and respiratory deaths increased, whereas in cold season, the high diurnal temperature range caused a lower number of deaths [17]. In China alone, numerous studies on the association of the temperature and mortality have been conducted a few of them include the work of [18,19,20,21,22,23,24,25,26].
Literature on high temperature and its association with mortality in Pakistan is scarce; very few studies have been conducted on the topic. For instance, [27] forecasted the maximum temperature of Karachi, and Hussain et al. [28] conducted a study on sensitiveness of genders and age to heat in Pakistan. The implications of heat waves in June 2015 on mortality in the Karachi city was studied by [29] and the work of Asif et al. observed overall and age-specific mortality variation due to seasonality in the Chitral district of Pakistan [30]. We study the impact of maximum temperature on mortality in Pakistan.
2. Methods
2.1. Research Data
Historic monthly data about temperature, mortality, and other climatic variables of Pakistan over the period of 2000–2019 have been used in this study. The climatic variables have been collected from the Meteorological Department of Pakistan whereas mortality data have been collected from the Ministry of Finance and Pakistan Bureau of Statistics.
2.2. Descriptive Analysis
Table 1 shows the summary statistics of the monthly average of historic all-cause death counts and monthly population over the period of 2000–2019. The minimum total number of all-cause deaths over the period 2000–2019 were 81,344, whereas the maximum of the average monthly death counts is 177,482. On average, there were 116,329 deaths in a month over the study period. The mean is higher than the median number of deaths, and thus it indicates that the death counts follow positively skewed distribution.
The summary statistics of the maximum monthly temperature, variation in temperature, average rain falls, and other climatic variables, are given in Table 2. The minimum of the monthly maximum temperature during the period 2000–2019 was observed to be 13.90 °C, whereas the maximum of the monthly maximum temperature recorded as 37.30 °C. The mean of the maximum temperature of Pakistan is about 27.91 °C. It is observed that the most frequent maximum temperature over the period has been 34.40 °C, whereas the 25th and 75th percentile of the monthly temperature over the period has been 27.91 °C and 34.02 °C, respectively. The range of the maximum temperature is 23.4 °C
The summary statistics of the variation in the monthly variation in temperature over the period 2000–2019 indicates that the minimum variation in the monthly temperature is 8.19 °C, whereas the maximum variation in the monthly temperature is about 21.62 °C. The mean variation in temperature is 13.84 °C, whereas the median variation in temperature is 13.65 °C.
The descriptive analysis of the average humidity over the period 2000–2019 shows that the minimum average humidity in Pakistan is 42.39 °C, whereas the maximum average humidity in the country is about 76.54 °C. The range of humidity is 34.15 °C. About 75% of the time the average humidity has been lower than 64.75 °C.
The minimum average monthly rain fall over the period is 0.08 mm, whereas the maximum average rainfall reached up to 105.00 mm over the period 2000–2019 and the range is 104.20 mm. About 75% of the time, average rainfall was lower than 33.08 mm.
The association between the monthly death counts and climate variables, such as the maximum temperature over the period 2000–2019, is examined. The association between the number of deaths and maximum temperature is given in Figure 2. It is evident from the graph that the monthly maximum temperature and the number of deaths in the country have nonlinear association.
We examine the correlation between the climatic variables and the death counts as well as other climatic variables. Table 3 provides linear correlations amongst the variables using Spearman’s Correlation. The death counts indicate a positive correlation with maximum temperature, negative correlation with the variation in temperature, negative correlation with the average rain fall, negative correlation with average humidity, and positive correlation with air pressure and Dewpoint in the country.
However, the Spearman’s Correlation does not capture the nonlinear association among the variables. The nonlinear correlation among the variables could be calculated using the Maximal Information Coefficient (MIC), which is used to calculate the linear and nonlinear association between the variables [31]. The nonlinear correlation among the variables is given in Table 4.
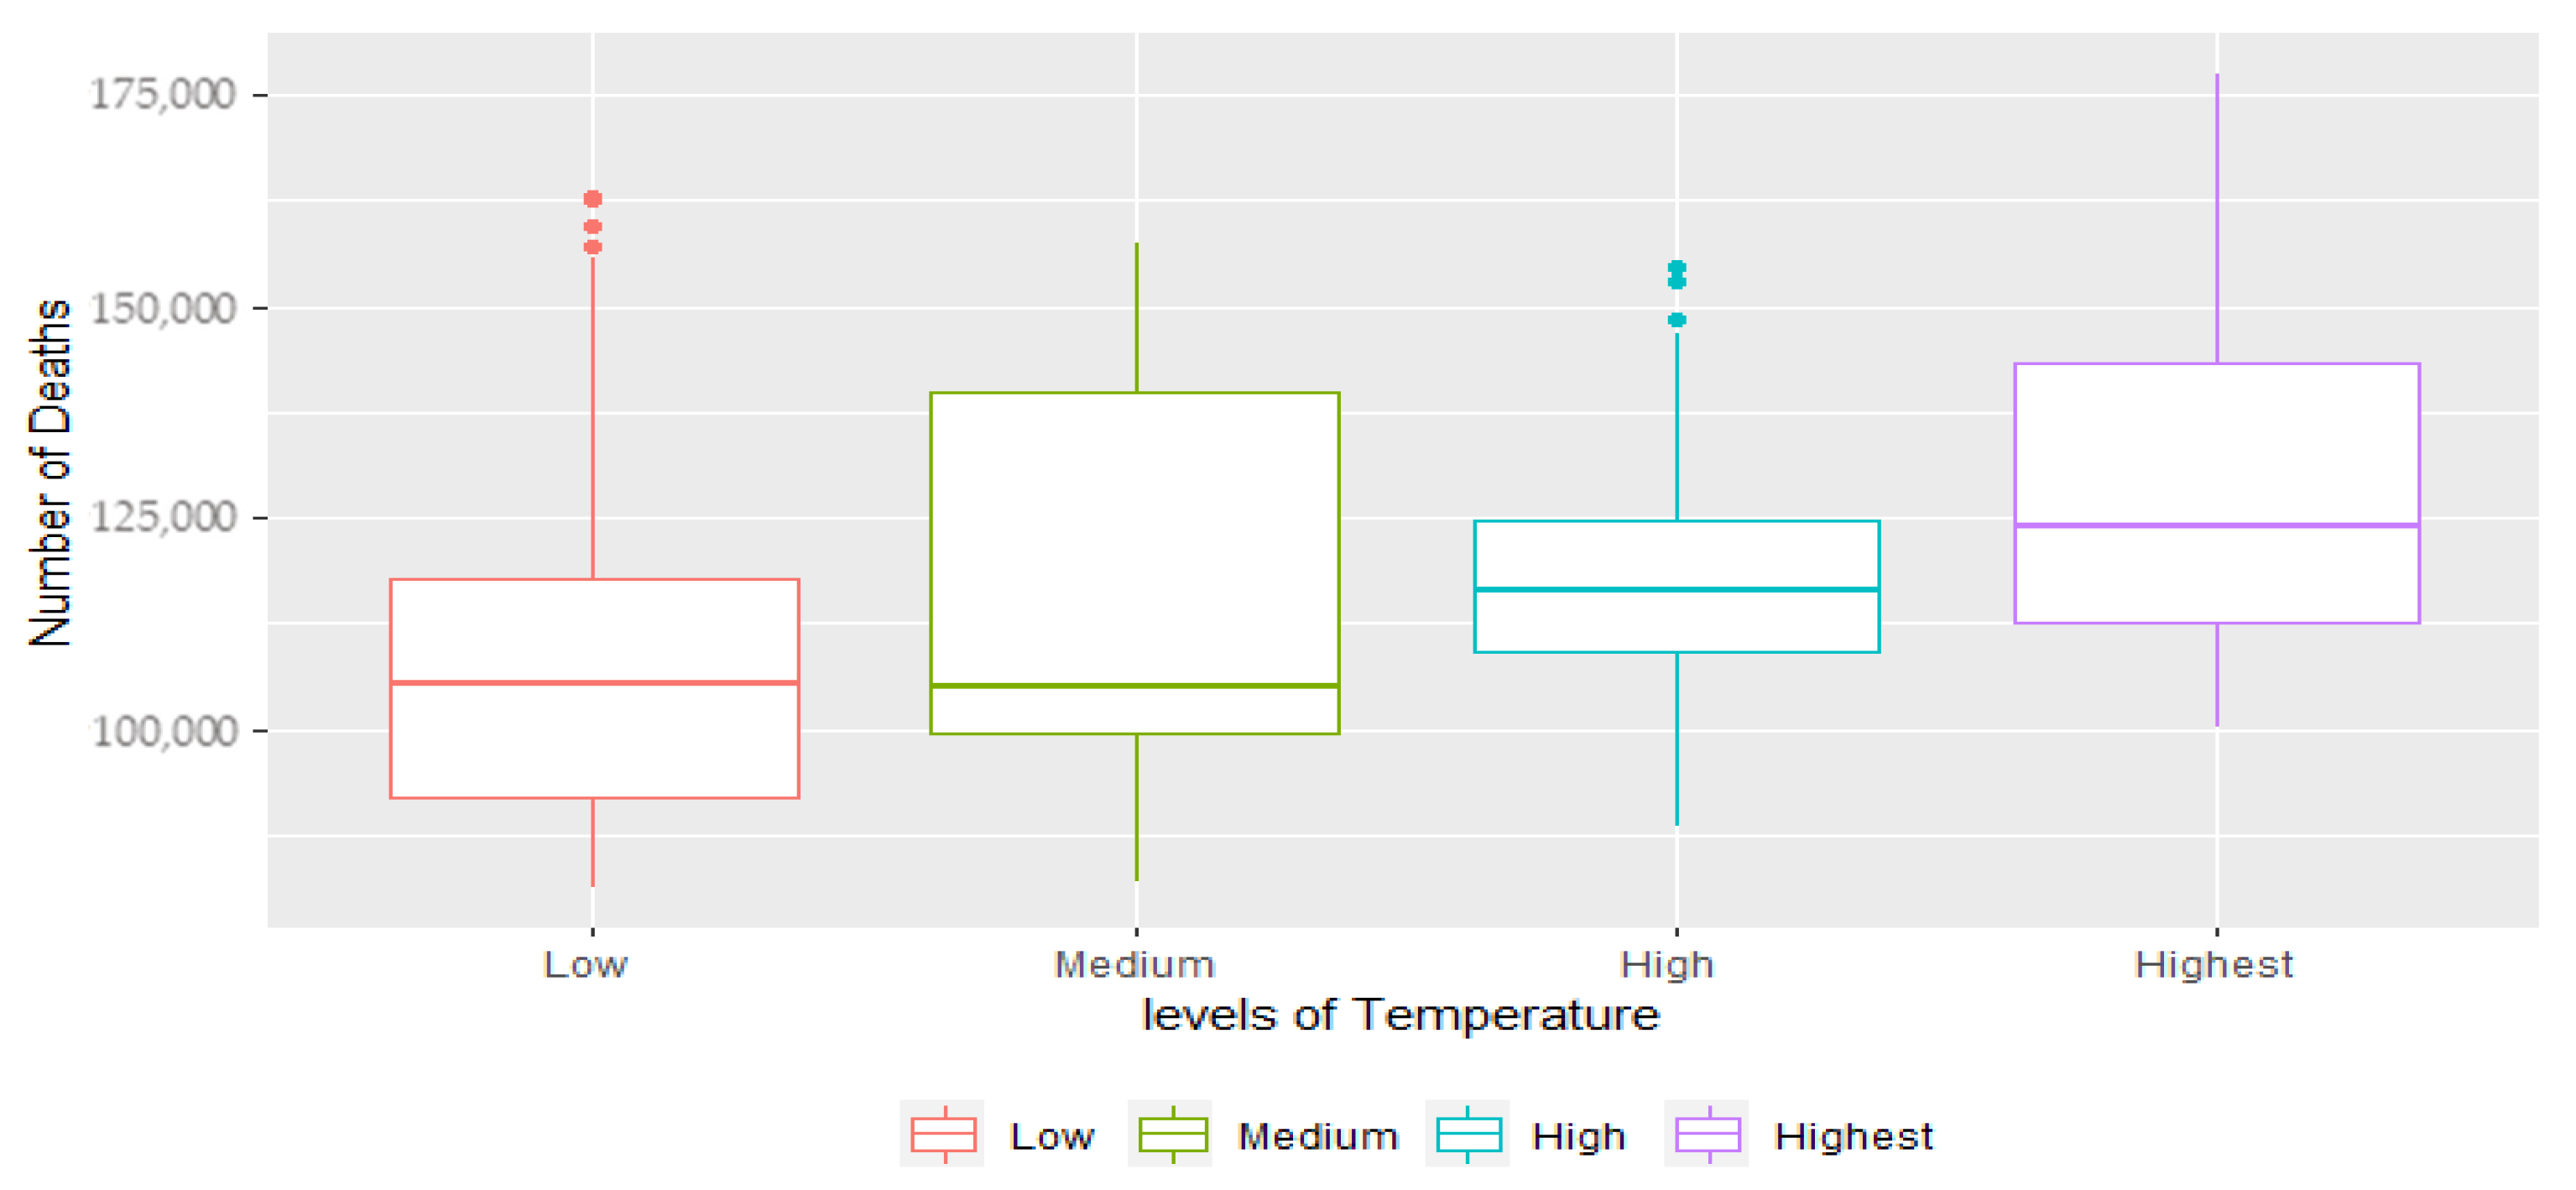
We have conducted a graphical analysis of the association between the number of deaths and the various levels of temperature, i.e., low (0–25 °C), high (30–35 °C) and very high (35–40 °C); this is depicted in Figure 3, which indicates the important impact of the temperature on the number of deaths in the country.
2.3. Statistical Model
Figure 3 clearly indicates a nonlinear association between the number of deaths and the maximum temperature in the country. Furthermore, the descriptive analysis also indicates that the number of deaths follow a positively skewed distribution. For accurately assessing the impact of the maximum temperature on mortality, linear regression models would not model the phenomena. Therefore, we utilize a generalized linear model to assess the impact of temperature on mortality. Several researchers, such as [32,33] and many more have used generalized linear models to assess the impact of climate change on mortality. Furthermore, the number of deaths can be modelled using Quasi-Poisson and Poisson distribution [34], alternatively, the mortality rates can be modelled using other distributions such as Gamma, Inverse Gaussian, and a general form of all these models: “the Tweedie distribution”. For this analysis, it is assumed that the monthly number of deaths follow Poisson distribution; thus, we use the generalized linear model with Poisson distribution with mean and standard deviation because the monthly average and the standard deviation of the number of deaths are not equal, and so we use a generalized linear model with a Quasi-Poisson link function, given in Equation (1).
where, denotes the number of deaths in a month.;
for are the model parameters;
are the climate variables, such as maximum temperature, monthly variation in temperature, average rain fall, humidity, dew point and air pressure;
represents the number of parameters in the model;
: are standard normal i.i.d random variables with mean 0 and unit variance; and natural cubic spline is used to adjust the seasonality in the minimum temperature.
The model parameters are estimated using the Maximum Likelihood Estimation Method (MLE) and the estimated values of the parameters are used to determine the relative risk of each predictor variable used in the model.
To determine the amount of risk associated with each predictor, the following simple relationship is used:
where indicates the relative risk of the th predictor variable.
3. Results
To estimate the model parameters and fit the proposed model to the data, we use R software, which is a powerful tool for regression and other statistical analysis with many packages that support all kinds of statistical analysis [35]. The estimated parameters, standard errors of the estimates, z-scores, and p-values are given in Table 5.
The relative risk of low (0–25 °C), high (30–35 °C), and very high (35–40 °C) temperature, in comparison to the medium temperature (25–30 °C), is calculated using Equation (2); the relative risks of low, high, and very high temperature are given in Table 6.
Our analysis indicates that the monthly maximum temperature is significant in the determination of the number of deaths in the country. Change in maximum monthly temperature has a significant impact on the number of deaths in the country. For this analysis, we have considered the medium temperature (25–30 °C) as the base point where the number of deaths is minimal. It is evident from Table 6 that the relative risk of number of deaths is increasing significantly and exponentially as the monthly maximum temperature goes up to high and very high in the region. Similarly, relative risk of the number deaths to the medium temperature decreases significantly when the temperature goes to the low category.
4. Model Comparison and Diagnosis
In this section, we compare the proposed model with the other candidate models, such as Tweedie, Gamma, Inverse Gaussian, and Poisson distribution. Table 7 provides a comparison of Null and Residual Deviances, and . The three models, the Quasi-Poisson, Poisson, and Gamma distribution, provide almost the same result. We chose Quasi-Poisson to model the effect of temperature on mortality because of its simplicity and intuition.
We conduct the residual analysis of the proposed model to validate its assumptions. Figure 4a provides a graphic representation of the residuals versus the fitted values, Figure 4b provides Normal Q-Q plot, Standardized residuals are given in Figure 4c, and leverage of the residuals are depicted in Figure 4d. The plot of the residual versus the fitted value indicates the independence and randomness of the residuals, the normal Q-Q plot confirms the normality of the residual with slight variations at extreme values, the scale location indicates the residuals are heteroscedastic, and thus all the assumptions of the proposed model are validated.
5. Conclusions
We have studied the impact of high temperature on all-cause number of deaths in Pakistan. The study used demographic as well as climate-related variables to assess the impact of temperature on the number of deaths in the country. Other climate variables included in the study are variation in minimum temperature, the amount of rainfall, average humidity, dewpoint, and air pressure.
The study shows that the maximum temperature in the country has a significant impact on the number of deaths. The minimum number of deaths take place at temperatures between 25 and 30 °C. The analysis indicates that the relative risk of mortality increases as the maximum temperature increases. An increase in the monthly maximum temperature from the medium temperature to the high level of temperature increases the relative risk of mortality by 11%. Similarly, a decrease in the maximum temperature below medium temperatures results in a decrease in deaths by 23%. The study indicates that the optimum temperature in the country is around 25–30 °C, and when the temperature goes up to every category of temperature, the number of deaths in the country increase by 27%.
The results indicate that increase in temperature poses a significant risk to the human mortality in Pakistan. Considering the prospective change in temperature increase by 3 °C to 5 °C under a central global emissions scenario (RCP4.5) and 4 °C to 6 °C under the high emissions scenario (RCP 8.5), the implications of change in maximum temperature on mortality would lead to excessive deaths and will have significant pressure on life insurance companies to increase premium of their life assurance products to cover for the increasing risk due to change in maximum temperature. Furthermore, the insurance liabilities and capital requirements of the life insurance companies that sell life assurance products would only increase. Nevertheless, it is likely that the pricing and liabilities of the annuity’s products would decrease which provides a natural hedge to the risk; however, it would depend on the portfolio of the life insurance products.
6. Further Research
There are several areas which we believe should be explored further to expand the body of research. For instance, the study assumes that the maximum temperature has the same impact on various segments of the population irrespective of their age, gender, medical condition, geographic areas, availability of resources, availability of basic needs, etc. However, this needs to be further examined. Furthermore, we have used the country’s monthly maximum temperature that indicates the average maximum temperature of the country; however, in a country like Pakistan, there are huge variations in various geographic areas, and thus the impact of temperature in various geographical locations would be different; this need to be explored further. The study does not differentiate between the segments of population that are more exposed to the risk of high temperatures or those who are less prone to the risk of high temperatures due to their profession or nature of work; this also needs to be further examined in future research. The study used monthly average maximum temperature data to assess the impact of maximum temperature on mortality. However, temperature varies significantly each day within a month, which would provide more insight in the implication of temperature on mortality, which must to be explored further in the future.
Author Contributions
Conceptualization. M.A.K.B.; supervision, S.M.A.B. All authors have read and agreed to the published version of the manuscript.
Funding
This research received no external funding.
Institutional Review Board Statement
Not applicable.
Informed Consent Statement
Not applicable.
Data Availability Statement
The climate related data can be obtained from Meteorological Department of Pakistan https://www.pmd.gov.pk/en/ (accessed on 13 June 2018), whereas mortality related can be obtained from Pakistan Bureau of Statistics https://www.pbs.gov.pk/ and https://www.finance.gov.pk/survey_1920.html (accessed on 13 June 2018).
Conflicts of Interest
The authors declare no conflict of interest.
References
- Field, C.B.; Barros, V.R.; Intergovernmental Panel on Climate Change (Eds.) Climate Change 2014: Impacts, Adaptation, and Vulnerability: Working Group II Contribution to the Fifth Assessment Report of the Intergovernmental Panel on Climate Change; Cambridge University Press: New York, NY, USA, 2014. [Google Scholar]
- Gutterman, S. The Vulnerable. Society of Actuaries, The Actuary Magazine. 2018. Available online: http://www.theactuarymagazine.org/the-vulnerable/ (accessed on 13 June 2018).
- Chaudhry, Q.U.Z. Climate Change Profile of Pakistan; Asian Development Bank: Manila, Philippines, 2017. [Google Scholar] [CrossRef]
- Eckstein, D.; Künzel, V.; Schäfer, L. Global Climate Risk Index 2021 Who Suffers Most Extreme Weather Events? Weather-Related Loss Events in 2019 and 2000–2019; Germanwatch: Bonn, Germany, 2021. [Google Scholar]
- Gasparrini, A.; Guo, Y.; Hashizume, M.; Lavigne, E.; Zanobetti, A.; Schwartz, J.; Tobías, A.; Tong, S.; Rocklöv, J.; Forsberg, B.; et al. Mortality risk attributable to high and low ambient temperature: A multicounty observational study. Lancet 2015, 386, 369–375. [Google Scholar] [CrossRef]
- Chung, Y.; Lim, Y.-H.; Honda, Y.; Guo, Y.-L.L.; Hashizume, M.; Bell, M.L.; Chen, B.-Y.; Kim, H. Mortality Related to Extreme Temperature for 15 Cities in Northeast Asia. Epidemiology 2015, 26, 255–262. [Google Scholar] [CrossRef]
- Hashizume, M.; Wagatsuma, Y.; Hayashi, T.; Saha, S.K.; Streatfield, K.; Yunus, M. The effect of temperature on mortality in rural Bangladesh—A population-based time-series study. Int. J. Epidemiol. 2009, 38, 1689–1697. [Google Scholar] [CrossRef] [PubMed] [Green Version]
- Alam, N.; Lindeboom, W.; Begum, D.; Streatfield, P.K. The association of weather and mortality in Bangladesh from 1983–2009. Glob. Health Action 2012, 5, 19121. [Google Scholar] [CrossRef] [PubMed]
- Scovronick, N.; Sureda, X.; Fu, M.; Pérez-Ortuño, R.; Ballbè, M.; López, M.J.; Saltó, E.; Pascual, J.A.; Fernández, E. The association between ambient temperature and mortality in South Africa: A time-series analysis. Environ. Res. 2018, 161, 229–235. [Google Scholar] [CrossRef] [PubMed]
- Fu, S.H.; Gasparrini, A.; Rodriguez, P.S.; Jha, P. Mortality attributable to hot and cold ambient temperatures in India: A nationally representative case-crossover study. PLoS Med. 2018, 15, e1002619. [Google Scholar] [CrossRef] [PubMed]
- Díaz, J.; Sáez, M.; Carmona, R.; Mirón, I.J.; Barceló, M.A.; Luna, M.Y.; Linares, C. Mortality attributable to high temperatures over the 2021–2050 and 2051–2100 time horizons in Spain: Adaptation and economic estimate. Environ. Res. 2019, 172, 475–485. [Google Scholar] [CrossRef] [PubMed]
- Rodrigues, M.; Santana, P.; Rocha, A. Modelling climate change impacts on attributable-related deaths and demographic changes in the largest metropolitan area in Portugal: A time-series analysis. Environ. Res. 2020, 190, 109998. [Google Scholar] [CrossRef]
- Anderson, B.G.; Bell, M.L. Weather-Related Mortality: How Heat, Cold, and Heat Waves Affect Mortality in the United States. Epidemiology 2009, 20, 205–213. [Google Scholar] [CrossRef] [PubMed] [Green Version]
- Revich, B.; Shaposhnikov, D. Excess mortality during heat waves and cold spells in Moscow, Russia. Occup. Environ. Med. 2008, 65, 691–696. [Google Scholar] [CrossRef]
- D’Ippoliti, D.; Michelozzi, P.; Marino, C.; De’Donato, F.; Menne, B.; Katsouyanni, K.; Kirchmayer, U.; Analitis, A.; Medina-Ramón, M.; Paldy, A.; et al. The impact of heat waves on mortality in 9 European cities: Results from the EuroHEAT project. Environ. Health 2010, 9, 37. [Google Scholar] [CrossRef] [Green Version]
- Naqvi, R.; Hall, D.M. Climate change: Reshaping mortality differences within the United Kingdom? Br. Actuar. J. 2018, 23, e27. [Google Scholar] [CrossRef] [Green Version]
- Sharafkhani, R.; Khanjani, N.; Bakhtiari, B.; Jahani, Y.; Mahdi Entezar, R. Diurnal temperature range and mortality in Urmia, the Northwest of Iran. J. Therm. Biol. 2017, 69, 281–287. [Google Scholar] [CrossRef]
- Zhou, X.; Zhao, A.; Meng, X.; Chen, R.; Kuang, X.; Duan, X.; Kan, H. Acute effects of diurnal temperature range on mortality in 8 Chinese cities. Sci. Total Environ. 2014, 493, 92–97. [Google Scholar] [CrossRef] [PubMed]
- Li, J.; Xu, X.; Yang, J.; Liu, Z.; Xu, L.; Gao, J.; Liu, X.; Wu, H.; Wang, J.; Yu, J.; et al. Ambient high temperature and mortality in Jinan, China: A study of heat thresholds and vulnerable populations. Environ. Res. 2017, 156, 657–664. [Google Scholar] [CrossRef] [PubMed]
- Li, T.; Lin, G.Y.; Hua, W.Z.; Jing, W. Assessing Heat-related Mortality Risks in Beijing, China. Biomed. Environ. Sci. 2012, 25, 458–464. [Google Scholar] [PubMed]
- Chen, R.; Wang, C.; Meng, X.; Chen, H.; Thach, T.Q.; Wong, C.-M.; Kan, H. Both low and high temperature may increase the risk of stroke mortality. Neurology 2013, 81, 1064–1070. [Google Scholar] [CrossRef] [PubMed] [Green Version]
- Kan, H.; London, S.; Chen, H.; Song, G.; Chen, G.; Jiang, L.; Zhao, N.; Zhang, Y.; Chen, B. Diurnal temperature range and daily mortality in Shanghai, China. Environ. Res. 2007, 103, 424–431. [Google Scholar] [CrossRef]
- Safitri, L.; Mardiyati, S.; Rahim, H. Forecasting the mortality rates of Indonesian population by using neural network. J. Phys. Conf. Ser. 2018, 974, 012030. [Google Scholar] [CrossRef]
- He, B.J.; Zhao, D.; Dong, X.; Zhao, Z.; Li, L.; Duo, L.; Li, J. Will individuals visit hospitals when suffering heat-related illnesses? Yes, but…. Build. Environ. 2021, 108587. [Google Scholar] [CrossRef]
- He, B.J.; Zhao, D.; Xiong, K.; Qi, J.; Ulpiani, G.; Pignatta, G.; Prasad, D.; Jones, P. A framework for addressing urban heat challenges and associated adaptive behavior by the public and the issue of willingness to pay for heat resilient infrastructure in Chongqing, China. Sustain. Cities Soc. 2021, 75, 103361. [Google Scholar] [CrossRef]
- Wang, C.; Zhang, Z.; Zhou, M.; Zhang, L.; Yin, P.; Ye, W.; Chen, Y. Nonlinear relationship between extreme temperature and mortality in different temperature zones: A systematic study of 122 communities across the mainland of China. Sci. Total Environ. 2017, 586, 96–106. [Google Scholar] [CrossRef] [PubMed]
- Burney, S.M.A.; Barakzai, M.A.K.; James, S.E. Forecasting Monthly Maximum Temperature of Karachi City using Time Series Analysis. Pak. J. Eng. Technol. Sci. 2017, 7, 12. [Google Scholar]
- Husnain, M.I.U.; Salman, A.; Kahlon, T.U.M. Heat and mortality in Pakistan: A study into the gender perspective. Pak. Armed Forces Med. J. PAFMJ 2017, 6, 966–970. [Google Scholar]
- Ghumman, U.; Horney, J. Characterizing the Impact of Extreme Heat on Mortality, Karachi, Pakistan, 2015. Prehospital Disaster Med. 2016, 31, 263–266. [Google Scholar] [CrossRef] [PubMed]
- Asif, M.; Nawaz, K.; Zaheer, Z.; Thygesen, H.; Abu-Shaheen, A.; Riaz, M. Seasonality of deaths with respect to age and cause in Chitral District Pakistan. PLoS ONE 2019, 14, e0225994. [Google Scholar] [CrossRef]
- Reshef, D.N.; Reshef, Y.A.; Finucane, H.K.; Grossman, S.R.; McVean, G.; Turnbaugh, P.J.; Lander, E.S.; Mitzenmacher, M.; Sabeti, P.C. Detecting Novel Associations in Large Data Sets. Science 2011, 334, 1518–1524. [Google Scholar] [CrossRef] [Green Version]
- Sasikumar, R.; Indira, S. Impact of Climate Factors through GLM and GAM Methods. Int. J. Sci. Technol. Res. 2019, 8, 1221–1223. [Google Scholar]
- Kim, Y.-M.; Kim, S.; Liu, Y. The impact of climate change on heat-related mortality in six major cities, South Korea, under representative concentration pathways (RCPs). Front. Environ. Sci. 2014, 2, 3. [Google Scholar] [CrossRef] [Green Version]
- Scott, W.F. Some Applications of the Poisson Distribution in mortality studies. Trans. Fac. Actuar. 1983, 38, 255–263. [Google Scholar] [CrossRef]
- Hackenberger, B.K. R software: Unfriendly but probably the best. Croat. Med. J. 2020, 61, 66–68. [Google Scholar] [CrossRef] [PubMed] [Green Version]
Figure 1.
Comparison of Temperature 2000–2009 and 2009–2019.

Figure 2.
Association between Maximum Temperature and Mortality.

Figure 3.
Number of Deaths vs. Level of Temperature.

Figure 4.
(a) Residuals vs. Fitted Values; (b) Residuals Q-Q Normal Plot; (c) Residuals Standard Deviation vs. Scale LocationFigure; (d) Residuals vs. Leverage.
Figure 4.
(a) Residuals vs. Fitted Values; (b) Residuals Q-Q Normal Plot; (c) Residuals Standard Deviation vs. Scale LocationFigure; (d) Residuals vs. Leverage.


Table 1.
Summary of Monthly Average Deaths and Populations.
| Deaths | Population | |
|---|---|---|
| Minimum | 81,344 | 11,646,667 |
| 1st Quartile | 103,034 | 12,770,208 |
| Median | 113,079 | 14,310,417 |
| Mean | 116,329 | 14,403,000 |
| 3rd Quartile | 126,290 | 15,745,208 |
| Maximum | 177,482 | 17,597,500 |
Table 2.
Summary Statistics of Monthly Climatic Variables.
| Maximum Temperature | Average Humidity | Average Pressure | Average Dew | Average Rain Fall | Variation Temperature | |
|---|---|---|---|---|---|---|
| Minimum | 13.90 | 42.39 | 4.47 | 0.76 | 0.80 | 8.19 |
| 1st Quartile | 22.25 | 53.84 | 16.96 | 9.18 | 10.28 | 12.39 |
| Median | 30.05 | 58.33 | 18.90 | 14.92 | 18.75 | 13.65 |
| Mean | 27.91 | 58.59 | 19.74 | 14.82 | 24.29 | 13.84 |
| 3rd Quartile | 34.02 | 64.75 | 24.57 | 21.36 | 33.08 | 14.74 |
| Maximum | 37.30 | 76.54 | 28.84 | 24.22 | 105.00 | 21.62 |
Table 3.
Correlation among Variables used in the Study.
| Death Counts | Maximum Temperature | Variation in Temperature | Average Rainfall | Average Humidity | Average Pressure | Average Dewpoint | |
|---|---|---|---|---|---|---|---|
| Death Counts | −1.0000 | 0.1725 | −0.0790 | −0.1472 | −0.0778 | 0.0262 | 0.1028 |
| Maximum Temperature | 0.1725 | 1.0000 | −0.2576 | 0.2214 | 0.0477 | −0.1861 | 0.9330 |
| Variation in Temperature | 0.0790 | −0.2576 | 1.0000 | −0.4836 | −0.3199 | 0.0351 | −0.3717 |
| Average Rainfall | −0.1472 | 0.2214 | −0.4836 | 1.0000 | 0.5324 | −0.1867 | 0.4119 |
| Average Humidity | −0.0778 | 0.0477 | −0.3199 | 0.5324 | 1.0000 | −0.1880 | 0.3803 |
| Pressure Average | 0.0262 | −0.1861 | 0.0351 | −0.1867 | −0.1880 | 1.0000 | −0.1956 |
| Dewpoint Average | 0.1028 | 0.9330 | −0.3717 | 0.4119 | 0.3803 | −0.1956 | 1.0000 |
Table 4.
Non-Linear Correlation among variables.
| Death Counts | Maximum Temperature | Variation in Temperature | Average Rainfall | Average Humidity | Average Pressure | Average Dew | |
|---|---|---|---|---|---|---|---|
| Death Counts | 1.7918 | 0.2979 | 0.2225 | 0.1801 | 0.1999 | 0.0756 | 0.2973 |
| Maximum Temperature | 0.2979 | 1.7918 | 0.3308 | 0.1327 | 0.2949 | 0.1078 | 0.8809 |
| Variation in Temperature | 0.2225 | 0.3308 | 1.7873 | 0.3019 | 0.3450 | 0.1067 | 0.5438 |
| Average Rainfall | 0.1801 | 0.1327 | 0.3019 | 1.7917 | 0.2960 | 0.0756 | 0.2770 |
| Average Humidity | 0.1999 | 0.2949 | 0.3450 | 0.2960 | 1.7917 | 0.0666 | 0.3801 |
| Average Pressure | 0.0756 | 0.1078 | 0.1067 | 0.0756 | 0.0666 | 1.7918 | 0.0991 |
| Average Dew | 0.2973 | 0.8809 | 0.5438 | 0.2770 | 0.3801 | 0.0991 | 1.7918 |
Table 5.
Estimated values of Coefficients, Standard Errors, and z-Score.
| Estimate | Std. Error | z Value | Pr (>|z|) | |
|---|---|---|---|---|
| (Intercept) | 24.09000 | 0.07643 | 315.229 | <2 × 10⁻¹⁶ |
| Year | −0.01439 | 0.00004 | −381.771 | <2 × 10⁻¹⁶ |
| Low Temperature | −0.26190 | 0.00097 | −270.265 | <2 × 10⁻¹⁶ |
| High Temperature | 0.10350 | 0.00077 | 134.264 | <2 × 10⁻¹⁶ |
| Very High Temperature | 0.24250 | 0.00095 | 256.075 | <2 × 10⁻¹⁶ |
| Variation in Temperature | −0.00580 | 0.00011 | −52.923 | <2 × 10⁻¹⁶ |
| Average Rainfall | −0.00188 | 0.00001 | −149.337 | <2 × 10⁻¹⁶ |
| Average Humidity | 0.00917 | 0.00004 | 226.596 | <2 × 10⁻¹⁶ |
| Average Dewpoint | −0.02507 | 0.00009 | −270.946 | <2 × 10⁻¹⁶ |
| Average Pressure | 0.00039 | 0.00210 | 0.185 | <8.5 × 10⁻¹ |
Table 6.
Relative Risk of Change in Temperature.
| Temperature | |||
|---|---|---|---|
| Low | Medium | High | Very High |
| 0.77 | 1.00 | 1.11 | 1.27 |
Table 7.
Comparison of Deviance, R-Square, and R-Square Adjusted.
| Tweedie | ||||
|---|---|---|---|---|
| Deviance | df | R-square | R-Square Adj | |
| Null | 0.00056339 | 239 | 38% | 36% |
| Residual | 0.00034944 | 232 | ||
| Poisson Distribution | ||||
| Deviance | df | R-square | R-Square Adj | |
| Null | 948,010 | 239 | 40% | 38% |
| Residual | 69,015 | 230 | ||
| Gamma Distribution | ||||
| Deviance | df | R-square | R-Square Adj | |
| Null | 8.094 | 239 | 40% | 38% |
| Residual | 4.860 | 230 | ||
| Quasi-Poisson Distribution | ||||
| Deviance | df | R-square | R-Square Adj | |
| Null | 948,010 | 239 | 40% | 38% |
| Residual | 569,015 | 230 | ||
Publisher’s Note: MDPI stays neutral with regard to jurisdictional claims in published maps and institutional affiliations. |
© 2021 by the authors. Licensee MDPI, Basel, Switzerland. This article is an open access article distributed under the terms and conditions of the Creative Commons Attribution (CC BY) license (https://creativecommons.org/licenses/by/4.0/).
Share and Cite
MDPI and ACS Style
Khan Barakzai, M.A.; Burney, S.M.A. Modeling the Impact of High Temperature on Mortality in Pakistan. Sustainability 2022, 14, 332. https://0-doi-org.brum.beds.ac.uk/10.3390/su14010332
AMA Style
Khan Barakzai MA, Burney SMA. Modeling the Impact of High Temperature on Mortality in Pakistan. Sustainability. 2022; 14(1):332. https://0-doi-org.brum.beds.ac.uk/10.3390/su14010332
Chicago/Turabian StyleKhan Barakzai, Mushtaq Ahmad, and S.M. Aqil Burney. 2022. "Modeling the Impact of High Temperature on Mortality in Pakistan" Sustainability 14, no. 1: 332. https://0-doi-org.brum.beds.ac.uk/10.3390/su14010332
Note that from the first issue of 2016, this journal uses article numbers instead of page numbers. See further details here.