Article

Seasonal Variation of Phthalate Esters in Urban River Sediments: A Case Study of Fengshan River System in Taiwan

1
Institute of Environmental Engineering, National Sun Yat-sen University, Kaohsiung 80424, Taiwan
2
Department of Marine Environmental Engineering, National Kaohsiung University of Science and Technology, Kaohsiung 81157, Taiwan
*
Authors to whom correspondence should be addressed.
Sustainability 2022, 14(1), 347; https://0-doi-org.brum.beds.ac.uk/10.3390/su14010347
Submission received: 2 November 2021 / Revised: 22 December 2021 / Accepted: 27 December 2021 / Published: 29 December 2021

Abstract

:
The Fengshan River system is one of the major rivers in Kaohsiung City, Taiwan. This study investigated the concentration of eight phthalate esters (PAEs) in sediments of the river and the impact of potential ecological risks during the dry and wet seasons. The potential risk assessment of sediment PAEs was evaluated by adopting the total risk quotient (TRQ) method. The total PAEs concentrations (∑PAEs) in the sediments of the Fengshan River system are between 490–40,190 ng/g dw, with an average of 8418 ± 11,812 ng/g dw. Diisononyl phthalate (38.1%), bis(2-ethylhexyl) phthalate (36.9%) and di-isodecyl phthalate (24.3%) accounted for more than 99.3% of ∑PAEs. The concentration of ∑PAEs in sediments at the river channel stations is higher during the wet season (616–15,281 ng/g dw) than that during the dry season (490–1535 ng/g dw). However, in the downstream and estuary stations, the wet season (3975–6768 ng/g dw) is lower than the dry season (20,216–40,190 ng/g dw). The PAEs in sediments of the Fengshan River may have low to moderate potential risks to aquatic organisms. The TQR of PAEs in sediments at the downstream and estuary (TQR = 0.13) is higher than that in the upstream (TQR = 0.04). In addition, during the wet season, rainfall transported a large amount of land-sourced PAEs to rivers, leading to increased PAEs concentration and potential ecological risks in the upper reaches of the river.

1. Introduction

Phthalate esters (PAEs) are a group of dialkyl or alkyl aryl esters of phthalic acid. According to the molecular weight of PAEs and the number of carbon atoms in their alkyl side chain, they can be classified into low molecular weight (LMW) PAEs and high molecular weight (HMW) PAEs [1,2,3]. The number of carbon atoms in the alkyl side chain of low molecular weight PAEs is ≤6, whereas that of high molecular weight PAEs is ≥7. LMW PAEs are commonly used in personal care products, cosmetics, paints and adhesives [4]. HMW PAEs are mainly used in plasticizers in the polymer industry to improve softness, flexibility, elongation and durability. The products include flooring, cables and wire, wall coverings, self-adhesive films, synthetic leather, coated fabrics and automotive applications. [4,5]. About 80% of PAEs are used in plasticizers in plastic polymers, accounting for 65% of global plasticizer consumption [6].
Since PAEs are not chemically bonded to plastic polymers but are attached with hydrogen bonds or van der Waals forces, they are easily released from plastic products into the environment through evaporation, leaching and abrasion [7,8]. Some review articles show that PAEs ubiquitously exist in the environment, including sediments, water, soil, air, plants, animals, and food, etc., [2,4]. PAEs can enter the water environment directly from urban sewage, sewage treatment plant effluent and industrial wastewater discharge, or indirectly through atmospheric deposition, surface runoff and landfill leachate. Most PAEs strongly adsorb organic and inorganic suspended particles in aquatic environments because of their high hydrophobic nature. PAEs may eventually settle and accumulate in sediments [9]. Sediment not only acts as a long-term pollutant sink, but also becomes a source of pollutants through resuspension. Therefore, it is widely used as an indicator to evaluate the pollution status of PAEs in various aquatic environments [10,11,12,13]. Many studies have shown that PAEs are toxic to aquatic animals, including immunotoxicity, metabolic toxicity, endocrine toxicity, neurotoxicity, genotoxicity, developmental toxicity and other adverse effects, which can cause various types of organ damage and behavioral disorders [14]. As a result, PAE pollution that occurs widely in the aquatic environment poses a severe threat to the aquatic ecosystem.
Anthropogenic pollutants in the atmosphere and land, especially hydrophobic organic pollutants, are usually transported to riverine and estuaries systems via surface runoff, sewage discharge, and atmospheric deposition, leading to accumulation in sediments. Some studies have shown that the seasonal changes of sediment PAEs are mainly affected by local rainfall and surface runoff [2,15,16,17]. Lee et al. [2] reported that the concentration of PAEs in Asan Lake (Korea) sediments varies seasonally, with the highest concentration in summer (2356 ng/g dw) and the lowest concentration in spring (1874 ng/g dw). Rainfall and surface runoff lead to variations in the concentration of PAEs in sediments. In other words, this also changes the exposure concentration and potential risks to aquatic organisms. About 70% of Taiwan’s area is mountainous, so rivers have characteristics of short flow paths, large slopes and rapid currents. In addition, southern Taiwan has a tropical monsoon climate, with distinct wet and dry seasons, with rainfall concentrated in summer [18]. The seasonal characteristics of rainfall and behavior of rivers may play a leading role in the transmission and accumulation of anthropogenic pollutants in the aquatic environment, affecting the exposure risk of aquatic organisms. Therefore, the purpose of this study is to collect the sediments of the Fengshan River system, which simultaneously receives urban, industrial and pasturage wastewater, in southern Taiwan during the dry and wet seasons. Based on the analysis results of the sediments, the concentration, chemical composition, source and spatial distribution of PAEs were investigated, and the impact of heavy rainfall during the wet season on PAEs in the sediments and the exposure risk to aquatic organisms were also evaluated.

2. Materials and Methods

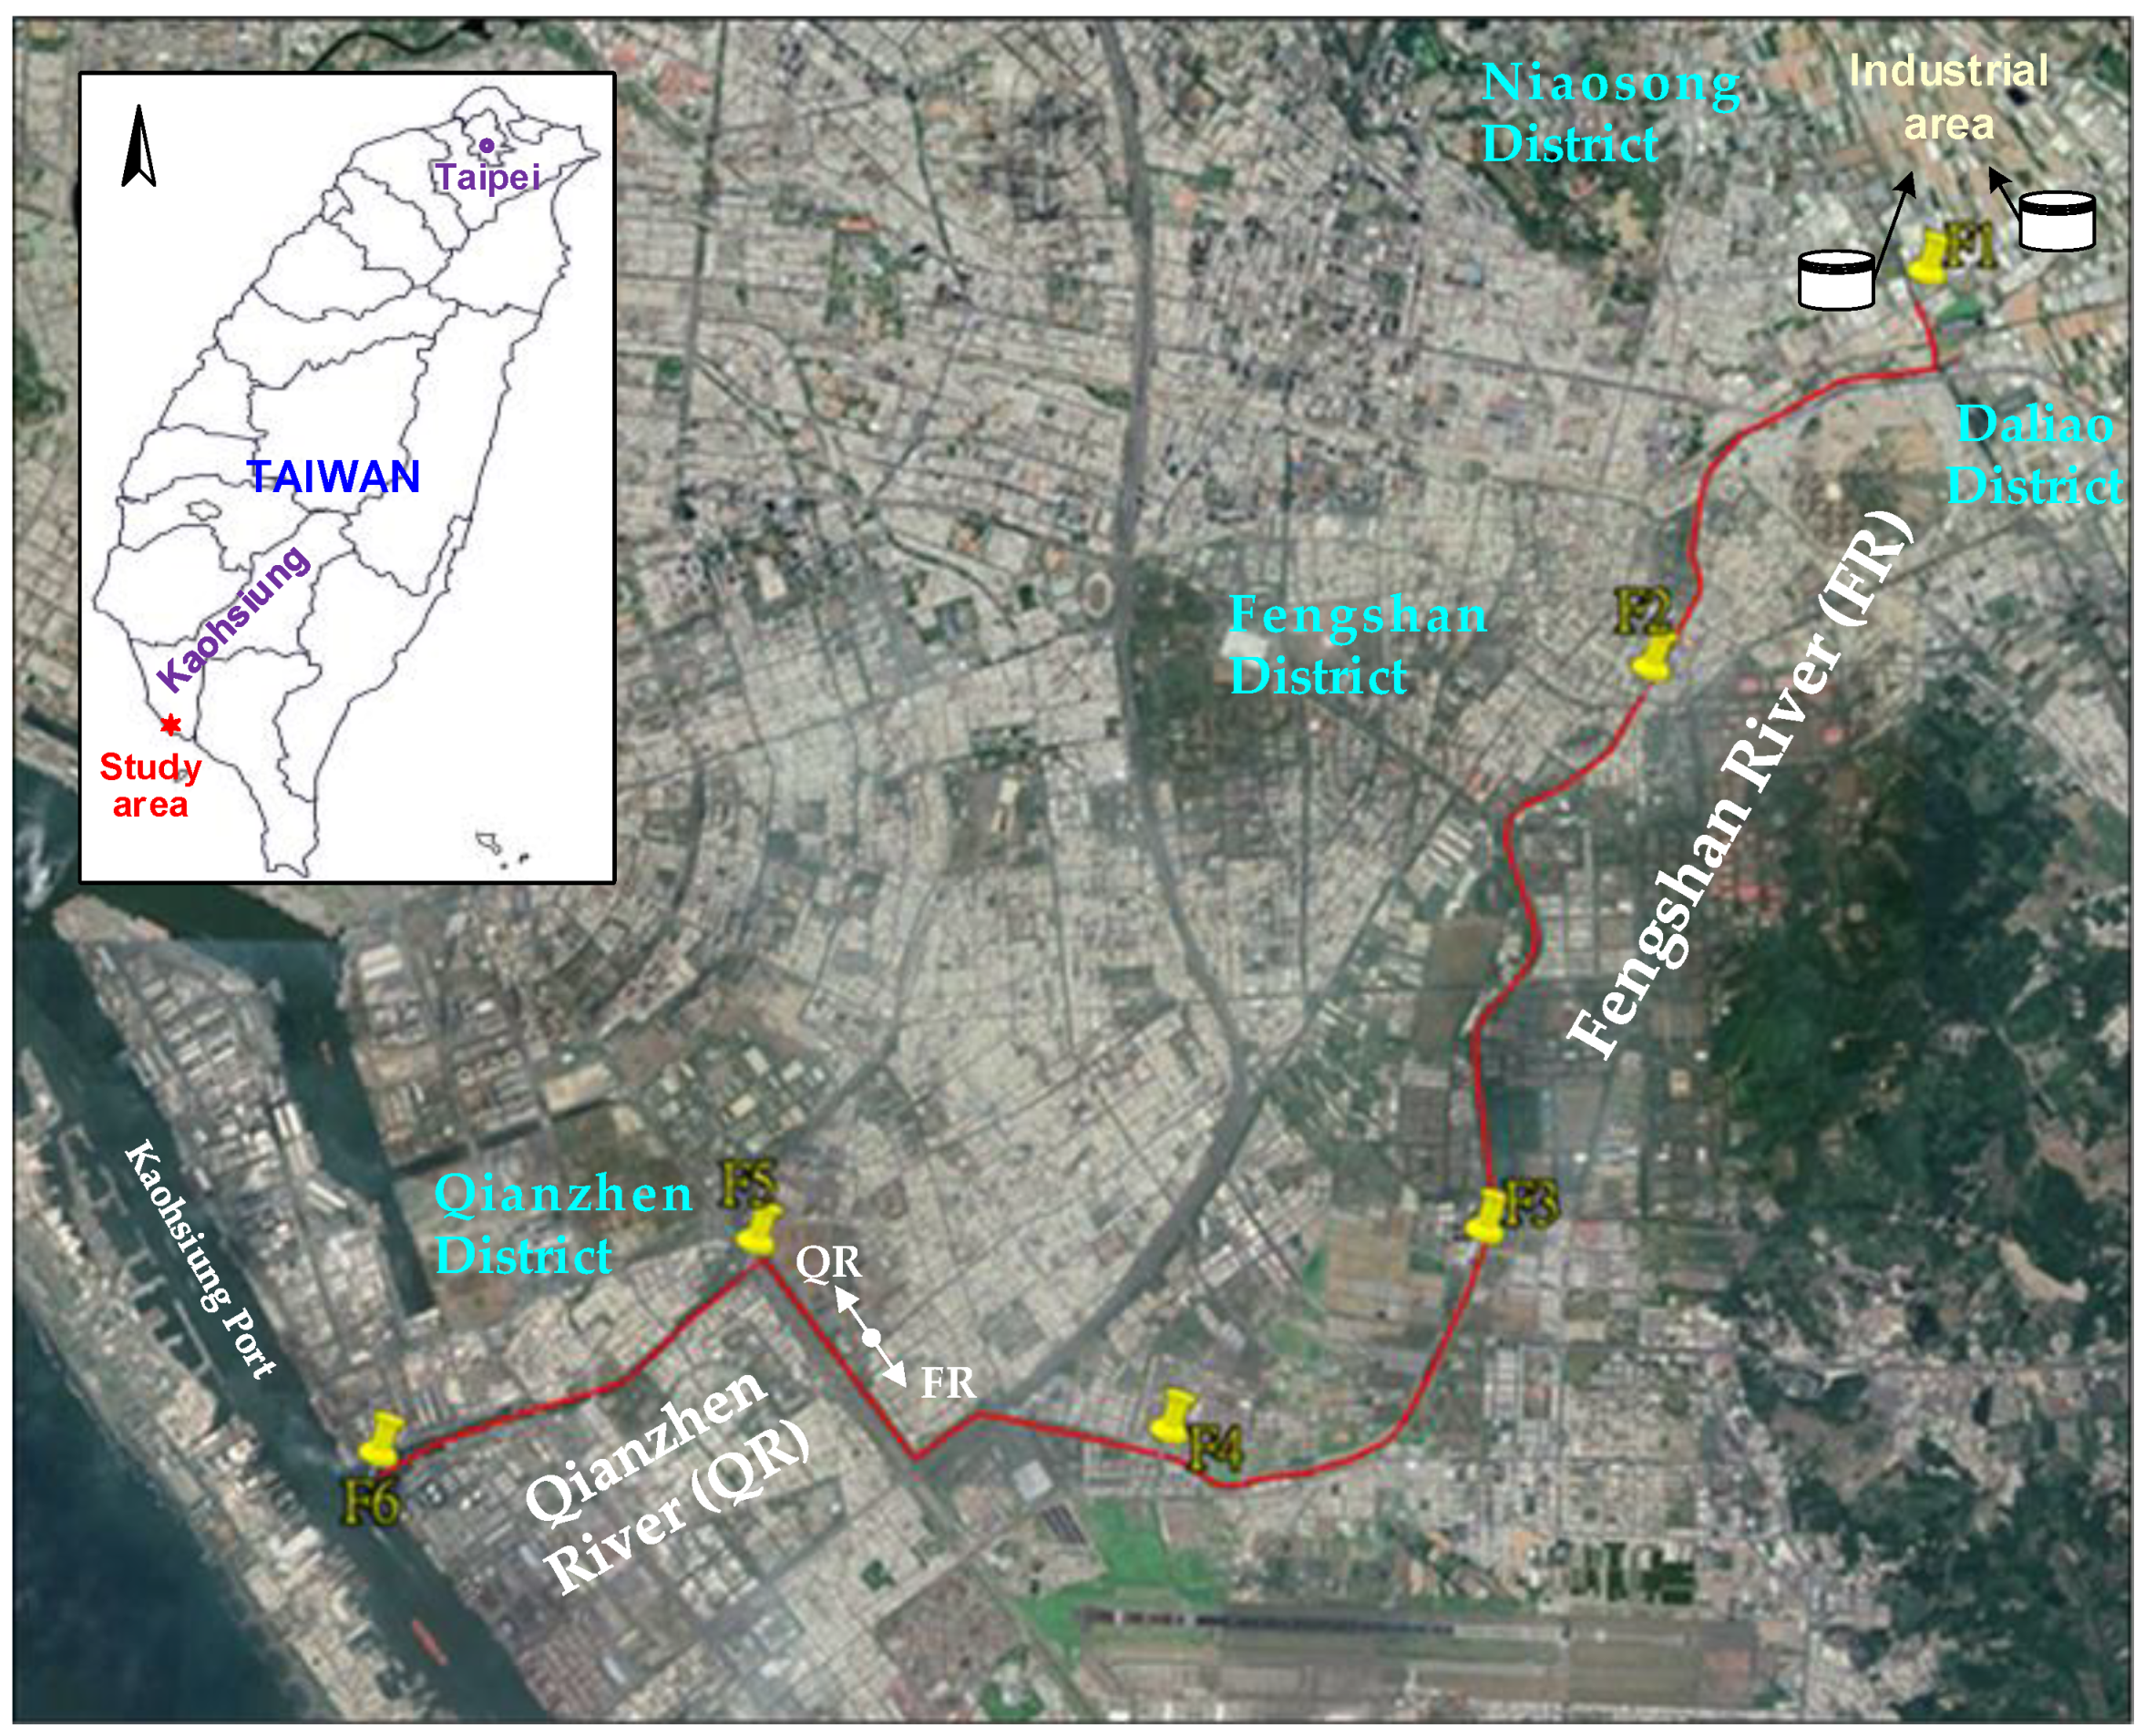
2.1. Study Area and Sample Collection

The study area includes Fengshan River and Qianzhen River, which belong to the Fengshan River system (Figure 1). The Fengshan River originates in the Jiuqutang Mountain in Kaohsiung City, runs through the center of Fengshan District, and flows southwest through Fengshan District, Niaosong District, Daliao District and other areas of the city. After entering the Qianzhen District of Kaohsiung City, it is called the Qianzhen River that finally flows into Kaohsiung Port. The river as a total length of about 20 km and a catchment area of 53.85 square kilometers. The pollution in the basin of Fengshan River system mainly comes from domestic discharge, industrial and pasturage wastewater, of which 68% of household wastewater is the largest proportion, followed by industrial wastewater at 31% and pasturage wastewater at 1%. However, in terms of the total amount of pollution, industrial wastewater 42.8% is the largest, followed by household wastewater at 39.6%, and pasturage wastewater and agricultural drainage which account for 15.2% and 2.4%, respectively. Taiwan has a subtropical/tropical monsoon climate with an average annual rainfall of about 2500 mm, which is 2.6 times the world average. However, the distribution of rainfall among seasons is extremely uneven. Because heavy rains or typhoons in summer and autumn are the main source of water resources in Taiwan, approximately 80% of the annual rainfall in Taiwan occurs during May to October. The differences in cumulative rainfall are significant between dry and wet seasons, resulting in a large variation of river discharge (91%:9% of annual discharge) from May to October and November to April in the study region [19].
Based on the above background information, six sampling points (Figure 1) are set up in the main channel (F1–F5) and estuary (F6) of the Fengshan River system. In fact, the five sampling points of the main channel are also the water quality monitoring stations for the long-term monitoring of the water quality of the Fengshan River system by the Bureau of Environmental Protection, Kaohsiung City Government. There are many small factories near station F1, such as leather processing, metal finishing, and food manufacturing. Stations F2 to F5 cover mainly residential areas [20]. In addition, station F3 is the discharge point for the Fengshanxi Sewage Treatment Plant. Details of the sampling stations are listed in Table 1. The sampler was lowered from the bridge to the center of the river to collect sediment samples. About 1.5 kg surface sediment (0–15 cm) samples were collected during the dry season (December 2015) and the wet season (May 2016) from the six sampling points with an Ekman Dredge grab sampler. The collected surface sediment was placed in a brown glass bottle (with a Teflon-lined cap), pre-washed with n-hexane, and then stored in an ice bucket until transported to the laboratory for further pretreatment.

2.2. Sample Preparation and Analysis

After the sediment was transported back to the laboratory, a small part of the wet-based sediment was used for moisture content and organic matter (OM) analysis. The remaining sediment samples were freeze-dried, crushed with a pestle and mortar, and then sieved with a 1.0 mm stainless steel mesh. The dried and homogenized sediment samples were stored in a brown glass bottle (with Teflon gasket screw cap), rinsed with n-hexane in advance and placed in a −20 °C freezer until further analysis. OM was analyzed using 550 °C loss-on-ignition (LOI). The particle size of the sediment was analyzed with a laser particle analyzer (Beckman Coulter, Inc., Brea, CA, USA). The total nitrogen (TN) and total phosphorus (TP) of the sediments were analyzed according to USEPA Method 351.2 [21] and Method 365.1 [22], respectively.
PAEs contained in the sediment samples were analyzed using the following procedures established by Chen et al. [5]. 5.00 g of dried and homogenized sediment samples are finely weighed, 5 mL of acetone/n-hexane (1:1, v/v) is added, followed by vortex mixing, ultrasonic vibration extraction, and centrifugal separation. Then, after taking the upper extract, the extraction was repeated twice and the extracts combined. Activated copper was added to the extract for desulphurization. The extract was dried over anhydrous sodium sulfate, concentrated to 0.5 mL using a gentle stream of nitrogen, and then analyzed by GCMS. Qualitative and quantitative analysis of PAEs (including dimethyl phthalate (DMP), diethyl phthalate (DEP), dibutyl phthalate (DnBP), butyl-benzyl phthalate (BBP), bis(2-ethylhexyl) phthalate (DEHP), di-n-octyl phthalate (DnOP), diisononyl phthalate (DiNP), and di-isodecyl phthalate (DiDP)) was performed using a GC/MS (Agilent 7890B GC and Agilent 5977A) mass selective detector (Agilent Technologies, Santa Clara, CA, USA). The conditions and quality control procedures for GC/MS analysis are detailed elsewhere [5].
In order to ensure the credibility of the analysis results, a calibration curve, procedural blank, check standard, sample duplicates, and certified reference materials were carried out for every set of samples. The calibration standard and check standard solutions were prepared by diluting the 2000 mg/L PAEs mixed standard solution obtained from AccuStandard Chem. Co. (New Haven, CT, USA). The response factors for individual PAEs showed acceptable relative standard deviation (RSD) values (5.0 to 12.5%). The procedural blank (0.5 mL of acetone/n-hexane) and check standards (0.5 mL of standards mixture solution at 0.5 mg/L) were implemented, using the same procedures as for the samples but without sediment. The procedural blank values were always less than the detection limit, the recoveries of individual PAEs in check standards ranged from 92.1 ± 6.2% to 102.2 ± 6.5% (n = 6) and the relative percent differences of sample duplicates ranged from 7.1 ± 3.6% to 10.0 ± 2.5% (n = 6) for detection of target analyses. The average measured value of the DEP, BBP, DEHP, and DnOP in certified reference materials (CRM-143) were 8273 ± 251, 8524 ± 115, 7461 ± 210, and 7688 ± 277 ng/g dw. The average recoveries of the four PAEs in CRM-143 were between 97.2 ± 3.5 to 103.3 ± 3.1% of the certified values.

2.3. Ecological Risk Assessment

Due to various pollution sources within the drainage basin of the Fengshan River, the aquatic organisms in the river, either from Fengshan River, its tributary or estuary (Kaohsiung Port), have rarely been caught and consumed by local citizens. Therefore, this study evaluated the potential hazards of the three trophic aquatic organisms (algae, crustaceans, and fish) based on the PAE content of sediments examined in this study. The risk quotients (RQs) method was used to assess the exposure risk of sediment PAEs to aquatic organisms. The calculation formula of the RQ value is RQ = MC/PNEC, where MC is the measured concentration of individual PAEs in the sediment (ng/g dw), and PNEC is the predicted no effect concentration of the corresponding PAEs. In this study, the PNEC values of algae, crustaceans, and fish were quoted from the calculation of Li et al. [23]. The risk of exposure of sediment PAEs to aquatic organisms can be evaluated according to the RQ value. When RQ > 1 (the log Kow of PAEs is between 3–5) and RQ > 10 (log Kow > 5), it means that the risk of the aquatic organisms exposed to the sediment is high [13,23,24]. However, there are usually multiple PAEs in the aquatic environment at the same time, so the RQ of individual PAEs is weighted and summed to obtain the total RQ (Total RQ, TRQ), so as to comprehensively evaluate the potential risk of sediment PAEs to exposed aquatic organisms. The calculation formula of TRQ value is TRQ = (∑RQs × Wi), where RQs is the RQ value of individual PAEs, and Wi is the weighted value of individual PAEs (DEHP and DiNP Wi = 0.1, DMP, DEP, DiBP, DnBP Wi = 1). Values of TRQ > 1 indicate a high risk, TRQ between 0.1–1 indicates a moderate risk, and TRQ < 0.1 indicates a low risk from PAE pollutants in the sediment [17,25].

3. Results and Discussion

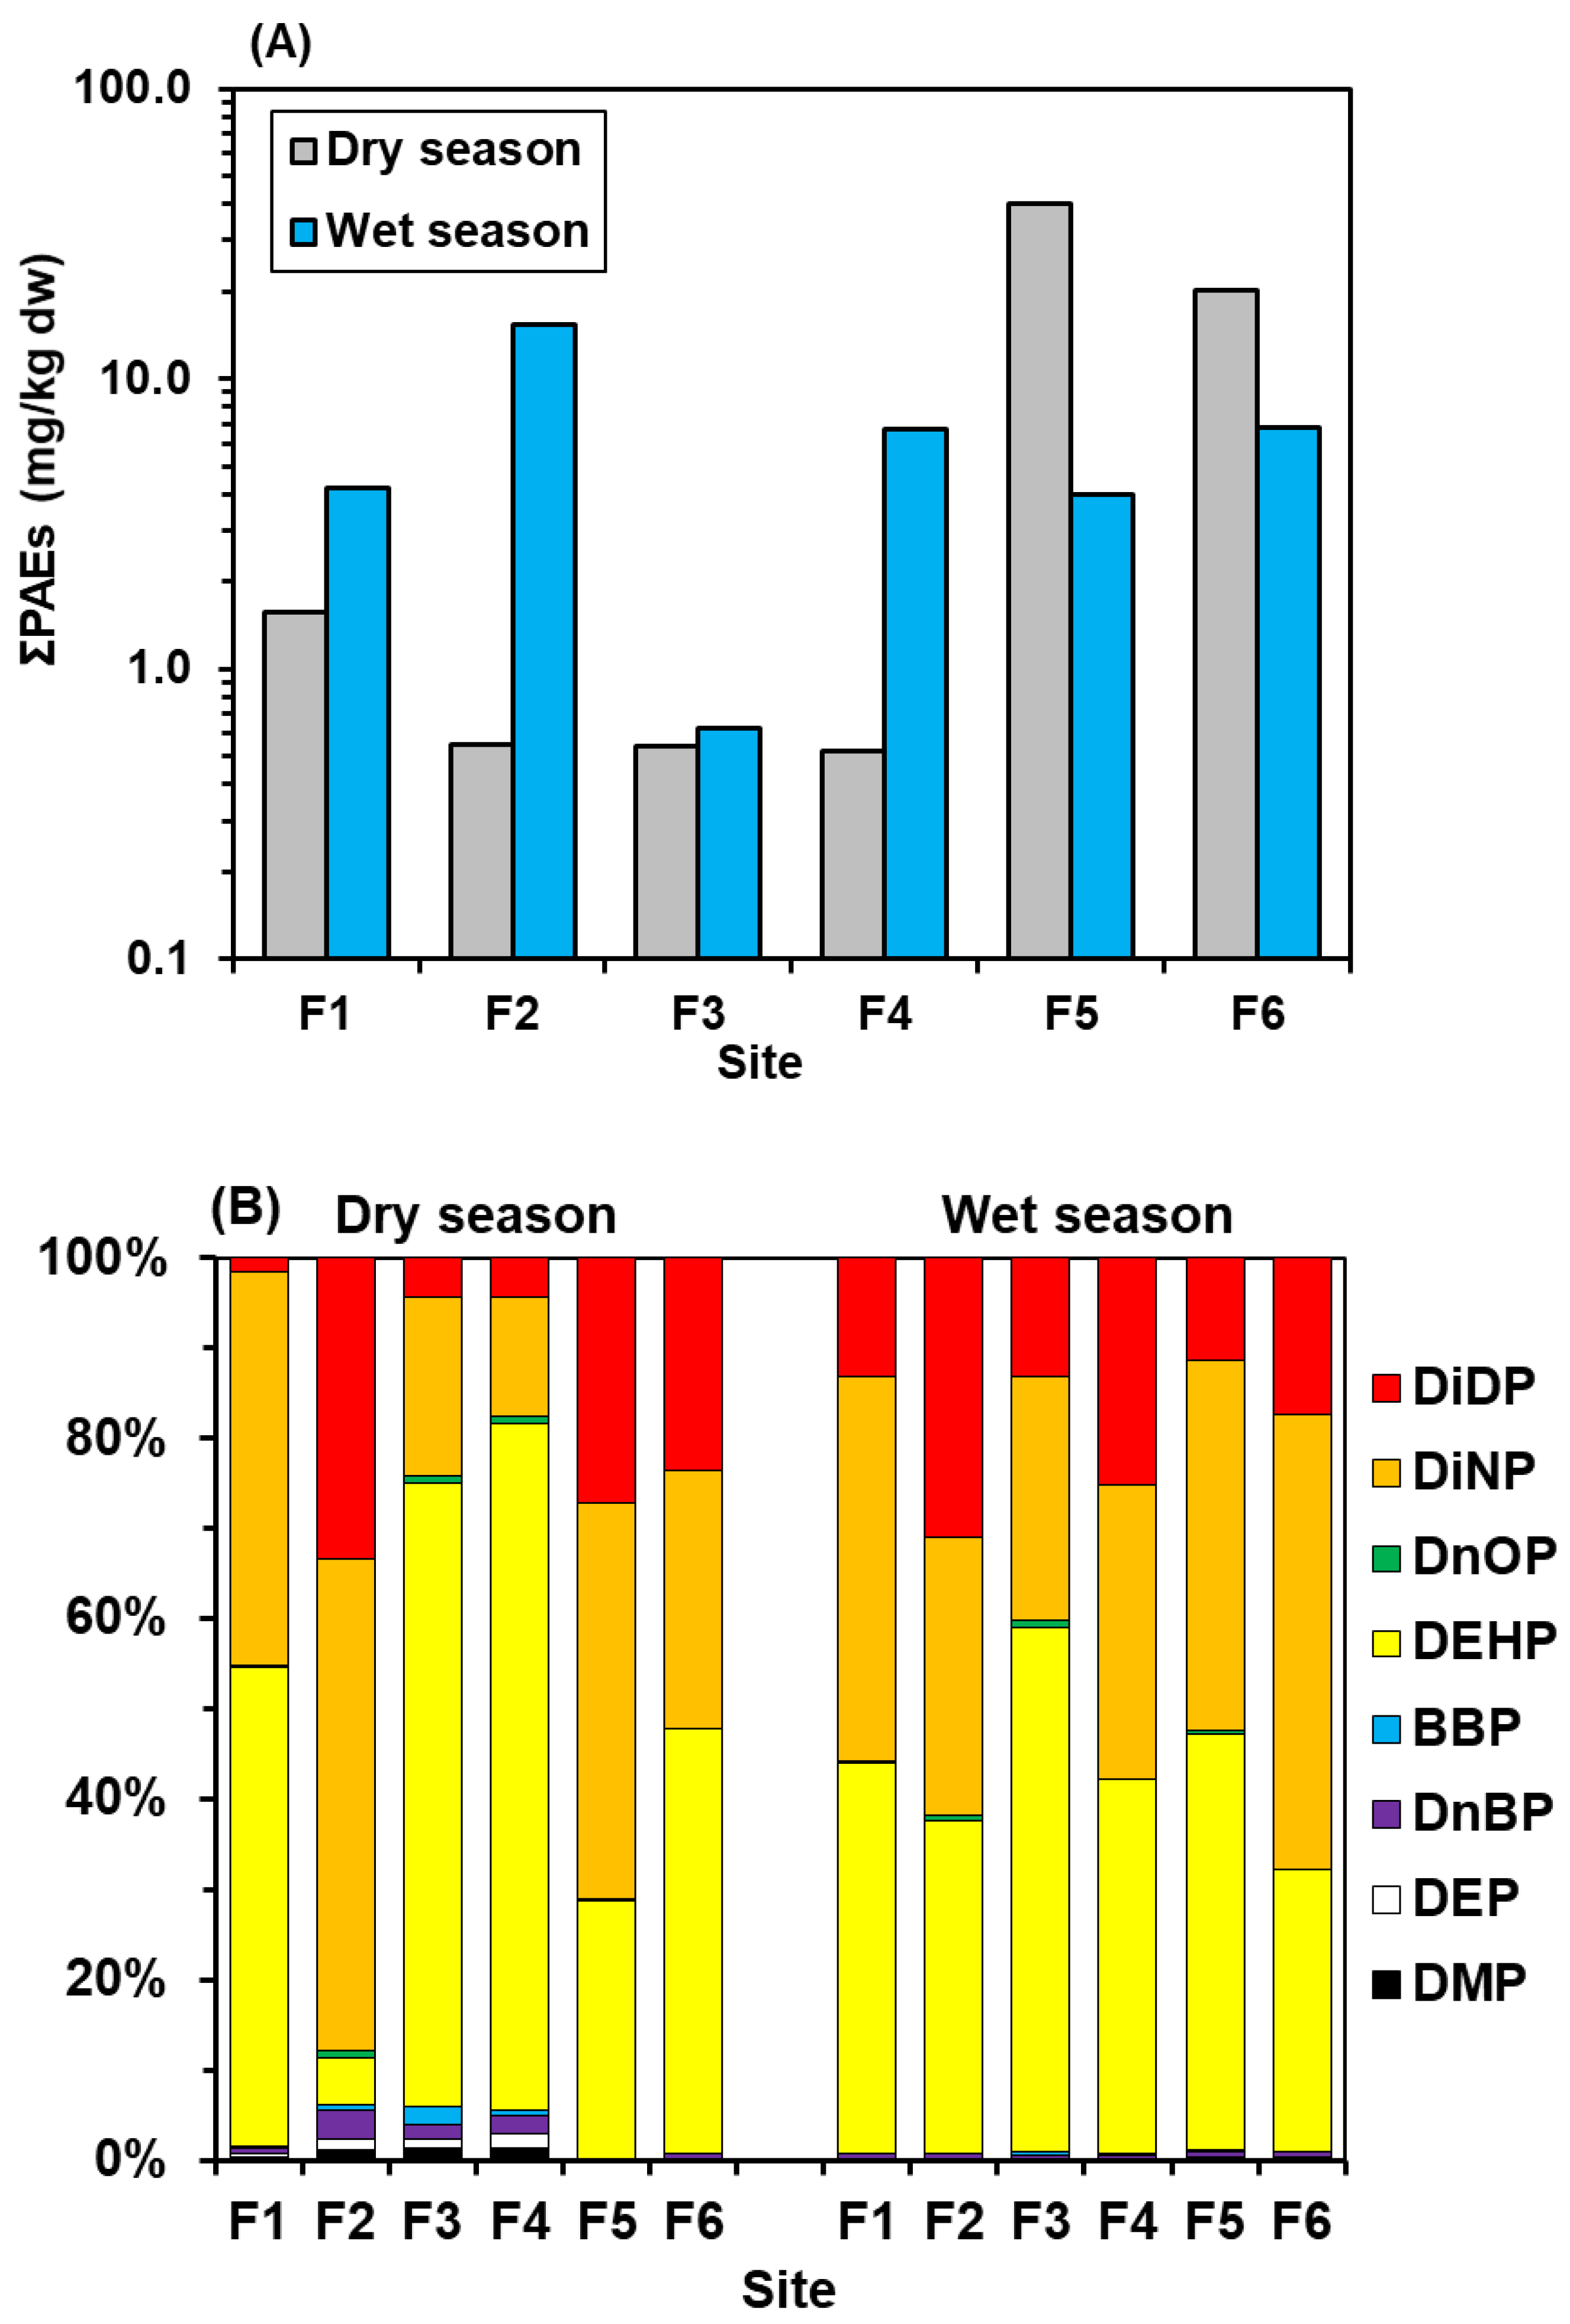
3.1. Concentration and Composition of PAEs in Sediments

The characteristics and the concentrations of PAEs in sediment of the Fengshan River are listed in Table 2. The percentages of clay, silt and sand particles in the sediments are 5.5 ± 6.6%, 37.5 ± 28.3% and 57.0 ± 33.8%, respectively. The sediment is mainly composed of silt in the upstream stations (28.6–78.1%) and the river mouth (66.1%, 70.8%), whereas sand (44.0–100.0%) is the main composition in the middle and downstream stations. The particle size distribution of the sediments in the dry and wet seasons should be affected by the river flow and the velocity of river discharge. Stations F2 and F5 have significantly higher sand content in the wet season with relatively high flow and velocity. Although the sand content of the sediments in the dry and wet seasons of F1 station is similar (35.7% and 35.6%), the clay (13.0%) in the dry season of F1 is significantly higher than that in the wet season (3.8%). A large amount of eluent water discharged from the Fengshan Sewage Treatment Plant induced an increase of river flow and velocity, resulting in high sand content in sediment samples at stations F3 and F4 in the two seasons [20]. F6 is located at the Kaohsiung Port, and its hydrodynamic force is relatively lower than that of the river. Therefore, sediments are mainly fine-grained in the dry and wet seasons. The average content of OM, TN and TP in the sediments are 2.4 ± 2.1%, 837 ± 723 mg/kg and 231 ± 168 mg/kg, respectively. Generally, the content of TN, TP and TOC in the sediments in the wet season is higher than that in the dry season (Table 2).
The total PAEs (∑PAEs) concentrations in the sediments of the Fengshan River system are between 490–40,190 ng/g dw, with an average of 8418 ± 11,812 ng/g dw (Table 2). The mean concentration of individual PAEs showed that DEHP, DiNP and DiDP (2046–3211 ng/g dw) were significantly higher than other PAEs (2.3–36.4 ng/g dw) by 3 to 4 orders of magnitude. The three PAE species were the major species, which constituted about 99.3% of ΣPAEs found in the sediment. DEHP and DiNP were the most dominant, with little difference, accounting for 36.9% and 38.1% of ∑PAEs, respectively, followed by DiDP (24.3%). As for other PAEs (including DnBP, DMP, DEP, BBP and DnOP), they only accounted for 0.06–0.43% of ∑PAEs. This distribution of the average concentration of PAEs is consistent with the production of PAEs in Taiwan [7,15]. The production and input of PAEs with a long and branching chain in Taiwan accounted for about 97.8% (DEHP (58.1%), DiNP (38.8%), DiDP (0.94%)), and short alkyl chain PAEs accounted for less than 4% (DEP (0.07%), DiBP (0.03%), DMP (0.03%) and DnBP (2.1%)) [26]. Since PAEs are hydrophobic compounds with low water solubility, PAEs are easily adsorbed on the suspended particles, settle on the bottom, and eventually accumulate in the sediment after entering the water environment. Long alkyl chain PAEs (log Kow = 6.00–9.46) have a higher octanol water ratio than short ones (log Kow = 1.6–4.7), so they are much easier to distribute in sediments, resulting in high concentrations in the sediments [4].
Table 3 shows the Spearman correlation matrix for the sediment characteristics, and PAE concentration in the sediments of the Fengshan River system, Taiwan. The concentration of PAEs in the sediments has no significant correlation with the particle size distribution (p > 0.05), but there is significant positive correlation with OM (r = 0.73–0.84, p < 0.01), indicating that the distribution of PAEs in sediments is mainly affected by OM content. The concentrations of each PAE showed a significant positive correlation (r = 0.87 −0.95, p < 0.01), indicating that they may have the same pollution source [27]. In addition, TN and TP were also significantly positively correlated with PAEs (r = 0.59–0.73, p < 0.05). TP and TN may mainly come from domestic sewage and surface runoff from non-point source pollution. Based on the background environment of the study area, the main pollution contributors to the PAEs in sediments of the Fengshan River system may be the effluent of the sewage treatment plant, the backwater of the agricultural area, and surface runoff [20].

3.2. Spatial Distribution of PAEs in Sediments

Figure 2 shows the spatial distribution of ∑PAEs concentration of sediments at six monitoring stations in the Fengshan River system. Concentration of ∑PAEs gradually increased in the upstream station (F1, F2) and decreased sharply at the discharge point of the sewage treatment plant (F3); then it showed an upward trend, highest at the downstream station (F5), followed by the river mouth (F6). Based on the source of the discharged wastewater into the Fangshan River system, the ∑PAE pollution of the upstream station mainly comes from the discharge of industrial, domestic wastewater and surface runoff water; the downstream is affected by domestic wastewater, the return water from the agricultural area, the surface runoff and the effluent of the sewage treatment plant. Tine et al. [20] investigated the microplastics distribution in the Fengshan River and found that runoff/discharge in industrial, urban and agricultural areas contribute mainly to the microplastics in the water of Fengshan River. Since 80% of PAEs are used as plasticizers for plastic products that are massively produced and consumed in daily life, a large amount of PAEs may be released during the physical, chemical, and biological degradation processes after these plastics litters enter the environment [7,28,29]. Therefore, compared with the emissions and wastewater discharge from the industrial manufacturing process, the release during the use, disposal or degradation of plastic products should be the main source of PAEs in the water environment. Besides, many studies have pointed out that urban runoff and effluent of sewage treatment plants are also the main sources of PAEs in aquatic environments [11,25,28,30,31,32]. Accordingly, this may be the reason why the ∑PAE concentrations at the downstream station (F5) are the highest. In addition, the ∑PAE concentration at the estuary station (F6) also showed a relatively high value, indicating that the PAEs were transported through the river and affected by flocculation at the estuary [33], and eventually accumulated in the sediments at the river mouth [29].

3.3. Distribution of PAEs in Sediments during Wet and Dry Seasons

In the study area, approximately 91% of the annual rainfall occurs in the wet season. Heavy and concentrated rainfall may cause the sediments of the main channels of the river to be washed away downstream. The pollutant content of the surface sediments could represent the accumulation of recent pollution. Therefore, this study collected 0–15 cm surface sediments for investigation in order to understand the impact of dry and wet seasons on the pollutant distribution. The variation of the sediment particle size in the dry and wet seasons showed that the sediment was strongly affected by the river flow and the velocity of river discharge during the dry and wet seasons (Table 2). It revealed that the pollutants of the sediment would vary seasonally. Therefore, the PAE content of surface sediments collected in this study could be used for the assessment of the recent pollution input during the dry and wet seasons. The distribution of ∑PAE concentration in the sediments of the Fengshan River system during the dry and wet seasons is shown in Figure 3A. During the dry season, the sediments PAEs at stations F1–F4, which account for most parts of the river, did not vary much (490–1535 ng/g dw), while the sediments PAEs at the downstream and river mouth stations F5 and F6 changed significantly with an increase of two orders of magnitude (40,190 and 20,216 ng/g dw). This phenomenon not only shows that the sediment PAEs are accumulated from the upper reaches to the lower reaches and the estuary during the dry season, but also indicates that the discharge of downstream pollutant (domestic wastewater, return water from agricultural areas, sewage treatment plant effluent and surface runoff water) may be the main source of pollution input for PAEs in the Fengshan River system.
During the wet season, the PAE concentration of sediments at stations F1–F4 covering most of the river sections increased compared to the dry season, and F1, F2 and F4 were significantly increased, by 3 to 13 times compared to the dry season. This is because about 91% of the annual precipitation in Kaohsiung, Taiwan is concentrated in the wet season [19]. The concentrated precipitation may cause large amounts of pollutants from non-point sources to be carried by surface runoff into the Fengshan River system [15]. Some studies have also shown that atmospheric deposition and rainfall runoff are the main factors affecting changes in the concentration of pollutants in river sediments [2,25,34,35]. Under the large amounts of discharge of pollutants from the source, sediments of streams will present high pollutants during the wet season. In the dry season, PAEs in the sediments may gradually be released into the water column and transported downstream along the river and to the sea. This may be the reason for the obvious increase of sediment PAEs at F1–F4 stations in the Fengshan River system during the wet season.
On the contrary, the ∑PAEs at the downstream and river mouth stations (F5, F6) during the wet season is lower than in the dry season. This may be due to the dilution effect of the heavy rainfall and the tidal influence at the estuary. Moreover, unlike the dry season, there is no such significant difference in ∑PAEs between F1–F4 and F5–F6, which shows a relatively average PAE concentration of sediments along the Fengshan River system during the wet season. The large amount of rainfall and surface runoff from upstream to the estuary may be the reason why the variations of the ∑PAEs along the river sections during the wet season are not as large as the ∑PAEs in the dry season [15,36].
The pattern of eight PAEs shows that the main composition of PAEs in the sediments at each station are those with a long alkyl chain, DEHP, DiNP, and DiDP, which accounted for 5.3–80.8%, 13.9–55.2% and 0–33.7% of ∑PAEs, respectively, in the dry season, and accounted for 31.3–59.1%, 27.6–50.4% and 11.4–31.0% of ∑PAEs during the wet season (Figure 3B). The long alkyl chain PAEs at each station accounted for more than 90% of ∑PAEs in the dry and wet seasons, whereas other short-chain PAEs only accounted for 0–6.3% of PAEs. Similar results have been observed in sediment samples from South Korea, China and Taiwan [5,30,37].

3.4. Potential Ecological Risk of PAEs in Sediments

In this study, the total risk quotient (TRQ) of three sensitive aquatic organisms (algae, crustaceans, and fish) was calculated based on the concentrations of eight PAEs in the sediments of the Fanshan River system. Figure 4 shows the distribution of TRQ values for three sensitive aquatic organisms in the dry and wet seasons. The TRQ value of algae is calculated based on the concentration of four PAEs including DMP, DEP, DnBP and DEHP. As shown in Figure 4A, during the dry season, the highest value of TRQ of algae appeared in the downstream and estuary stations F5 and F6, respectively 0.39 and 0.35, between 0.1 and 1.0, indicating a moderate risk level, while the rest of the station’s TRQ values <0.1 are considered a low risk level. During the wet season, a large amount of rainfall and surface runoff brought pollutants from the land area into the river, causing the TRQ values, which are 0.07–0.22 and close to medium risk, of the F1, F2 and F4 stations to increase significantly by 2–11 times compared with the dry season [17]. Some studies have also shown that the ecological risk of sediment in the rainy season is higher than that in the dry season [17,28]. However, the TRQ value of station F3 is not much different from that in the dry season. The TRQ values of stations F5 (0.08) and F6 (0.09) are lower than those in the dry season, which may result in the dilution or transportation of accumulated pollutant to the open sea due to a large amount of continuous rainfall during the wet season [17].
The TRQ value of crustaceans is calculated based on the concentration of five PAEs: DMP, DEP, DnBP, DEHP and DiNP. In general, the TRQ value of crustaceans is consistent with that of algae in time and space distribution, but is relatively lower than that of algae (Figure 4A,B). Only the TRQ values of F5 and F6 during the dry season are between 0.1–1, which is a medium risk level, whereas the rest of the TRQ values are less than 0.1, which is a low risk level (Figure 4B). The TRQ value of fish is calculated based on the concentration of four PAEs including DMP, DEP, DnBP and DEHP. The distribution of TRQ values of fish, whether in the dry season, wet season or among individual stations, is more similar to that of crustaceans than of algae. The TRQ values are also relatively lower than those of algae. However, except for the F5 and F6 stations in the dry season, the TRQ value of F2 in the wet season is also between 0.1–1, considered to be a moderate risk. The rest of the TRQ values are all less than 0.1, indicating a low risk level.
Figure 5 shows the relative contribution of individual PAEs to the TRQ values of three sensitive aquatic organisms. In the dry season, DEHP is the main PAE causing potential risks for algae. The RQ value of DEHP accounts for the highest TRQ value (48.2–90.0%) of all station sediments except for F2, followed by DnBP (5.4–48.6%), DMP (1.4–30.7%) and DEP (1.4–15.2%). The RQ value of DnBP at F2 accounted for the highest proTRQ value (48.6%), followed by DMP (30.7%), DEP (15.2%) and DEHP (5.6%). In the wet season, the RQ value of DEHP also accounts for the highest TRQ value (72.6–88.2%) of algae at all stations, followed by DnBP (5.3–19.6%), DMP (0.3–9.0%) and DEP (0.1– 7.2%) (Figure 5A). For crustaceans, the contribution of individual RQs of PAE in the dry season shows two types. One demonstrated a relatively average contribution of individual RQ at F1–F4. The main RQ contribution came from DEP (33.1–42.8%), DMP (18.9–30.0%), DnBP (16.9–33.0%) and DEHP (1.1–29.3%), with DiNP (0.2–1.8%) the lowest. On the other hand, F5 and F6 stations showed that the RQ value of DEHP accounted for the highest TRQ value (53.0–66.5%), followed by DnBP (13.2–29.6%), DEP (7.0–11.2%), DMP (3.9–5.7%) and DiNP (2.4–7.6%) (Figure 5B). In the wet season, the RQ value of DEHP accounts for the highest TRQ value (30.2–57.3%) of crustaceans at all stations, followed by DnBP (11.6–43.2%), DEP (1.0–37.3%), DMP (0.7–22.0%) and DiNP (2.0–3.8%). As for the fish, the contribution of individual RQ in the dry season is also presented in two types. The RQ contribution of F1–F4 is dominated by DEP (36.5–48.9%) and DnBP (31.4–49.7%), followed by DMP (13.0–19.1%), and DEHP (0.3–9.6%) is the lowest; while at F5 and F6 stations, the biggest contribution came from DnBP (43.6–63.6%), followed by DEHP (18.4–35.4%), DEP (14.6–15.2%) and DMP (2.8–6.3%). In the wet season, DnBP (32.7–82.4%) is the highest, followed by DEP (1.2–41.8%), DEHP (8.6–26.1%) and DMP (0.5–17.0%) (Figure 5C). The above indicates that in the dry season the proportion of individual PAEs to TRQ shows two patterns. The similar composition of individual PAEs from upstream to midstream may be caused by the same type of pollution source, while a similar distribution of PAE contributing to TRQ from downstream to the estuary may be due to the accumulation of all upstream pollutants. During the wet season, the similar distribution of individual PAE contribution to the TRQ may be due to the dilution and homogenization caused by the heavy and continuous rainfall and surface runoff.
PAEs in sediments of the Fengshan River system may have low to moderate potential risks of algae, crustaceans and fish. DEHP, DnBP and DEP are the main PAEs that cause ecological risks. In addition, during the wet season, rainfall transports a large amount of land-sourced PAEs to rivers, leading to increased PAE concentration and potential ecological risks, especially in the upper reaches of the river; however, continuous rainfall will lower the PAE concentration in sediment because of dilution and river transportation, hence reducing the ecological risk of aquatic organisms. In summary, the discharge of industrial wastewater, domestic sewage and surface runoff into the drainage basin of Fengshan River causes pollutants to accumulate in the river sediments, which may pose a risk of harm to aquatic organisms. These pollutants may accumulate in the estuarine zone seasonally, with seasonal variation of rainfall and river transport. Therefore, the management of industrial wastewater and domestic sewage in the upper reaches of the river should be strengthened to reduce the discharge of pollutants such as PAEs. In addition, the aquatic organisms living in the Fengshan River and its tributary and estuary may accumulate harmful chemical substances such as PAEs, so it is not recommended to capture and eat them.

4. Conclusions

This study investigated the distribution of eight PAE concentrations and their ecological risks in the sediments of the Fengshan River system in the dry and wet seasons. The long alkyl chain PAEs, which are mainly used as plasticizers in Taiwan such as DEHP, DiNP, and DiDP, account for about 99.3% of ∑PAEs, and are considered the dominant PAEs. The spatial distribution shows that PAEs mainly come from the use, disposal or degradation of plastic products in daily life, and are discharged into the Fengshan River system along with sewage and surface runoff. In addition, effluent of sewage treatment plants is also one of the main sources of PAEs. During the dry season, the sediments in the lower reaches and estuary of the Fengshan River system accumulate relatively high PAEs and also have higher ecological risks. During the wet season, a large number of land-based pollutant input leads to an increase of PAE concentration and potential ecological risk upstream, whereas PAE concentration and potential ecological risk decrease downstream and at the river mouth due to the dilution effect of continuous rainfall and river transportation. The results of the study present significant temporal and spatial variation of PAE concentration and ecological risk in river sediments during the dry and wet seasons, which is useful information for water environmental management.

Author Contributions

Conceptualization, C.-D.D. and C.-M.K.; methodology, C.-F.C.; validation, C.-F.C. and K.-N.L.; formal analysis, K.-N.L.; investigation, Y.C.L.; data curation, C.-W.C.; writing—original draft preparation, K.-N.L.; writing—review and editing, C.-W.C., C.-M.K. and C.-D.D.; visualization, K.-N.L.; supervision, C.-M.K.; project administration, C.-W.C.; funding acquisition, C.-D.D. All authors have read and agreed to the published version of the manuscript.

Funding

This research received no external funding.

Institutional Review Board Statement

Not applicable.

Informed Consent Statement

Not applicable.

Data Availability Statement

Not applicable.

Conflicts of Interest

The authors declare no conflict of interest. The funders had no role in the design of the study; in the collection, analyses, or interpretation of data; in the writing of the manuscript, or in the decision to publish the results.

References

  1. Katsikantami, I.; Sifakis, S.; Tzatzarakis, M.N.; Vakonaki, E.; Kalantzi, O.I.; Tsatsakis, A.M.; Rizos, A.K. A global assessment of phthalates burden and related links to health effects. Environ. Int. 2016, 97, 212–236. [Google Scholar] [CrossRef]
  2. Lee, Y.M.; Lee, J.E.; Choe, W.; Kim, T.; Lee, J.Y.; Kho, Y.; Choi, K.; Zoh, K.D. Distribution of phthalate esters in air, water, sediments, and fish in the Asan Lake of Korea. Environ. Int. 2019, 126, 635–643. [Google Scholar] [CrossRef]
  3. Chang, W.H.; Herianto, S.; Lee, C.C.; Hung, H.; Chen, H.L. The effects of phthalate ester exposure on human health: A review. Sci. Total Environ. 2021, 786, 147371. [Google Scholar] [CrossRef]
  4. Net, S.; Sempéré, R.; Delmont, A.; Paluselli, A.; Ouddane, B. Occurrence, Fate, Behavior and Ecotoxicological State of Phthalates in Different Environmental Matrices. Environ. Sci. Technol. 2015, 49, 4019–4035. [Google Scholar] [CrossRef] [PubMed]
  5. Chen, C.F.; Chen, C.W.; Ju, Y.R.; Dong, C.D. Determination and assessment of phthalate esters content in sediments from Kaohsiung Harbor, Taiwan. Mar. Pollut. Bull. 2017, 124, 767–774. [Google Scholar] [CrossRef] [PubMed]
  6. Erythropel, H.C.; Maric, M.; Nicell, J.A.; Leask, R.L.; Yargeau, V. Leaching of the plasticizer di(2-ethylhexyl)phthalate (DEHP) from plastic containers and the question of human exposure. Appl. Microbiol. Biotechnol. 2014, 98, 9967–9981. [Google Scholar] [CrossRef] [PubMed]
  7. Sun, J.Q.; Huang, J.; Zhang, A.P.; Liu, W.P.; Cheng, W.W. Occurrence of phthalate esters in sediments in Qiantang River, China and inference with urbanization and river flow regime. J. Hazard. Mater. 2013, 248–249, 142–149. [Google Scholar] [CrossRef]
  8. Jiménez-Skrzypek, G.; González-Sálamo, J.; Varela-Martínez, D.A.; Paluselli, A.; Kim, S.K. Horizontal and vertical distribution of phthalates acid ester (PAEs) in seawater and sediment of East China Sea and Korean South Sea: Traces of plastic debris? Mar. Pollut. Bull. 2020, 151, 110831. [Google Scholar]
  9. Qiu, Y.W.; Wang, D.X.; Zhang, G. Assessment of persistent organic pollutants (POPs) in sediment of the Eastern Indian Ocean. Sci. Total Environ. 2020, 710, 136335. [Google Scholar] [CrossRef]
  10. Ramzi, A.; Gireeshkumar, T.R.; Habeeb Rahman, K.; Manu, M.; Balachandran, K.K.; Chacko, J.; Chandramohanakumar, N. Distribution and contamination status of phthalic acid esters in the sediment of a tropical monsoonal estuary, Cochin—India. Chemosphere 2018, 210, 232–238. [Google Scholar] [CrossRef] [PubMed]
  11. Zhang, Z.M.; Zhang, H.H.; Zhang, J.; Wang, Q.W.; Yang, G.P. Occurrence, distribution, and ecological risks of phthalate esters in the seawater and sediment of Changjiang River Estuary and its adjacent area. Sci. Total Environ. 2018, 619–620, 93–102. [Google Scholar] [CrossRef]
  12. Zhang, Q.; Song, J.; Li, X.; Peng, Q.; Yuan, H.; Li, N.; Duan, L.; Ma, J. Concentrations and distribution of phthalate esters in the seamount area of the tropical Western Pacific Ocean. Mar. Pollut. Bull. 2019, 140, 107–115. [Google Scholar] [CrossRef]
  13. Wang, L.Y.; Gu, Y.Y.; Zhang, Z.M.; Sun, A.L.; Shi, X.Z.; Chen, J.; Lu, Y. Contaminant occurrence, mobility and ecological risk assessment of phthalate esters in the sediment-water system of the Hangzhou Bay. Sci. Total Environ. 2021, 770, 144705. [Google Scholar] [CrossRef] [PubMed]
  14. Zhang, Y.; Jiao, Y.; Li, Z.; Tao, Y.; Yang, Y. Hazards of phthalates (PAEs) exposure: A review of aquatic animal toxicology studies. Sci. Total Environ. 2021, 771, 145418. [Google Scholar] [CrossRef]
  15. Chen, C.W.; Chen, C.F.; Dong, C.D. Distribution of phthalate esters in sediments of Kaohsiung Harbor, Taiwan. Soil. Sediment. Contam. 2013, 22, 119–131. [Google Scholar] [CrossRef]
  16. Gao, D.W.; Wen, Z.D. Phthalate esters in the environment: A critical review of their occurrence, biodegradation, and removal during wastewater treatment processes. Sci. Total Environ. 2016, 541, 986–1001. [Google Scholar] [CrossRef]
  17. Li, Z.; Zhang, W.; Shan, B. The effects of urbanization and rainfall on the distribution of, and risks from, phenolic environmental estrogens in river sediment. Environ. Pollut. 2019, 250, 1010–1018. [Google Scholar] [CrossRef]
  18. Chen, C.F.; Ju, Y.R.; Lim, Y.C.; Chen, C.W.; Dong, C.D. Seasonal variation of diversity, weathering, and inventory of microplastics in coast and harbor sediments. Sci. Total Environ. 2021, 781, 146610. [Google Scholar] [CrossRef] [PubMed]
  19. CWB, (Central Weather Bureau). 2021. Available online: https://www.cwb.gov.tw/V8/C/D/DailyPrecipitation.html (accessed on 2 November 2021).
  20. Tien, C.J.; Wang, Z.X.; Chen, C.S. Microplastics in water, sediment and fish from the Fengshan River system: Relationship to aquatic factors and accumulation of polycyclic aromatic hydrocarbons by fish. Environ. Pollut. 2020, 265, 114962. [Google Scholar] [CrossRef]
  21. U.S. EPA. Method 351.2: Determination of Total Kjeldahl Nitrogen by Semi-Automated Colorimetry; Revision 2.0; U.S. Environmental Protection Agency: Cincinnati, OH, USA, 1993.
  22. U.S. EPA. Method 365.1: Determination of Phosphorus by Semi-Automated Colorimetry; Revision 2.0; U.S. Environmental Protection Agency: Cincinnati, OH, USA, 1993.
  23. Li, R.L.; Liang, J.; Gong, Z.B.; Zhang, N.N.; Duan, H.L. Occurrence, spatial distribution, historical trend and ecological risk of phthalate esters in the Jiulong River, Southeast China. Sci. Total Environ. 2017, 580, 388–397. [Google Scholar] [CrossRef]
  24. European Commission Technical Guidance Document in Support of Commission Directive 93/67/EEC on Risk Assessment for New Notified Substances and Commission Regulation (EC) No. 1488/94 on Risk Assessment for Existing Substance, Part II; European Commission: Brussels, Belgium, 2003.
  25. Li, B.; Liu, R.; Gao, H.; Tan, R.; Zeng, P.; Song, Y. Spatial distribution and ecological risk assessment of phthalic acid esters and phenols in surface sediment from urban rivers in Northeast China. Environ. Pollut. 2016, 219, 409–415. [Google Scholar] [CrossRef] [PubMed]
  26. TCSB (Toxic and Chemical Substances Bureau). 2019. Available online: https://www.tcsb.gov.tw/cp-326-3120-f7716-1.html (accessed on 2 November 2021).
  27. Zhang, Z.M.; Yang, G.P.; Zhang, H.H.; Shi, X.Z.; Zou, Y.W.; Zhang, J. Phthalic acid esters in the sea-surface microlayer, seawater and sediments of the East China Sea: Spatiotemporal variation and ecological risk assessment. Environ. Pollut. 2020, 259, 113802. [Google Scholar] [CrossRef] [PubMed]
  28. Liu, Y.; He, Y.; Zhang, J.; Cai, C.; Breider, F.; Tao, S.; Liu, W. Distribution, partitioning behavior, and ecological risk assessment of phthalate esters in sediment particle-pore water systems from the main stream of the Haihe River, Northern China. Sci. Total Environ. 2020, 745, 141131. [Google Scholar] [CrossRef]
  29. Chen, C.F.; Ju, Y.R.; Su, Y.C.; Lim, Y.C.; Kao, C.M.; Chen, C.W.; Dong, C.D. Distribution, sources, and behavior of PAHs in estuarine water systems exemplified by Salt River, Taiwan. Mar. Pollut. Bull. 2020, 154, 111029. [Google Scholar] [CrossRef]
  30. Li, R.; Liang, J.; Duan, H.; Gong, Z. Spatial distribution and seasonal variation of phthalate esters in the Jiulong River estuary, Southeast China. Mar. Pollut. Bull. 2017, 122, 38–46. [Google Scholar] [CrossRef]
  31. Gao, D.; Li, Z.; Wen, Z.; Ren, N. Occurrence and fate of phthalate esters in full-scale domestic wastewater treatment plants and their impact on receiving waters along the Songhua River in China. Chemosphere 2014, 95, 24–32. [Google Scholar] [CrossRef]
  32. Wu, Y.; Sun, J.; Zheng, C.; Zhang, X.; Zhang, A.; Qi, H. Phthalate pollution driven by the industrial plastics market: A case study of the plastic market in Yuyao City, China. Environ. Sci. Pollut. Res. 2019, 26, 11224–11233. [Google Scholar] [CrossRef] [PubMed]
  33. Kennish, M.J. Sediment contaminant concentrations in estuarine and coastal marine environments: Potential for remobilization by boats and personal watercraft. J. Coast. Res. 2002, 37, 151–178. [Google Scholar]
  34. Zeng, F.; Cui, K.Y.; Xie, Z.Y.; Liu, M.; Li, Y.J.; Zen, Z.X.; Li, F.B. Occurrence of phthalate esters in water and sediment of urban lakes in a subtropical city, Guangzhou, South China. Environ. Int. 2008, 34, 372–380. [Google Scholar] [CrossRef] [PubMed]
  35. Lin, C.; Lee, C.J.; Maoa, W.M.; Nadim, F. Identifying the potential sources of di-(2-ethylhexyl) phthalate contamination in the sediment of the Houjing River in southern Taiwan. J. Hazard. Mater. 2009, 161, 270–275. [Google Scholar] [CrossRef]
  36. Gong, J.; Xu, L.; Yang, Y.; Chen, D.Y.; Ran, Y. Sequential ASE extraction of alkylphenols from sediments: Occurrence and environmental implications. J. Hazard. Mater. 2011, 192, 643–650. [Google Scholar] [CrossRef] [PubMed]
  37. Kim, S.; Lee, Y.S.; Moon, H.B. Occurrence, distribution, and sources of phthalates and non-phthalate plasticizers in sediment from semi-enclosed bays of Korea. Mar. Pollut. Bull. 2020, 151, 110824. [Google Scholar] [CrossRef] [PubMed]
Figure 1. Sampling sites along the Fengshan River system in Kaohsiung City, Taiwan.
Sustainability 14 00347 g001
Figure 2. Distribution of the total PAEs (∑PAEs) in sediments from the Fengshan River system, Taiwan.
Sustainability 14 00347 g002
Figure 3. Distribution of total PAEs (∑PAEs) (A) and PAE composition (B) in sediments of the Fengshan River system during dry and wet seasons.
Sustainability 14 00347 g003
Figure 4. Total risk quotient (TRQ) values of the PAEs in sediments from the Fengshan River system, Taiwan. TRQ > 1 indicates that the aquatic organisms exposed to the corresponding sediment have a high potential risk, 1 ≥ TRQ ≥ 0.1 has a moderate risk, and TRQ < 0.1 has a low risk.
Sustainability 14 00347 g004
Figure 5. Relative contents of risk quotients of individual PAEs in sediments from the Fengshan River system, Taiwan.
Sustainability 14 00347 g005
Table 1. Location of sampling sites along the Fengshan River in Kaohsiung City, Taiwan.
SiteLatitude
(N)
Longitude
(E)
Distance from River Mouth (km)
F122°38′22.61″120°22′37.07″13.7
F222°37′14.18″120°21′46.10″11.2
F322°35′38.64″120°21′16.01″7.3
F422°35′04.86″120°20′18.71″5.0
F522°35′36.23″120°19′02.76″2.2
F622°35′00.39″120°17′54.62″0.0
Table 2. Sediment characteristics and PAE concentrations in sediments of the Fengshan River system, Taiwan.
SiteClay
(%)
Silt
(%)
Sand
(%)
OM
(%)
TN
(mg/kg)
TP
(mg/kg)
Phthalate Esters (ng/g dw) aΣPAEs
(ng/g dw)
DMPDEPDnBPBBPDEHPDnOPDiNPDiDP
MDL a0.760.641.562.843.784.326.423.0
Dry season (river flow: 0.14–0.46 m3/s; velocity: 2.21–10.1 m/s)
F113.051.335.70.87204385.15.810.2ND a830ND684ND1535
F221.978.10.02.37863866.66.118.2ND29ND300183543
F30.69.689.80.262411467.06.17.811.4373ND108ND513
F40.912.986.20.29281677.27.710.8ND396ND68.3ND490
F55.550.544.04.9213391479.37.548.516.511,519ND17,6681092140,190
F69.566.124.42.6619304556.512.4112.7ND9518ND5799476720,216
Wet season (river flow: 0.33–1.49 m3/s; velocity: 6.38–13.7 m/s)
F13.860.635.61.01410227NDND28.9ND1825ND17975574208
F22.728.669.05.21683394NDND99.6ND565584.84708473415,281
F30.00.0100.00.43341198NDNDNDND364ND17081.9616
F40.914.185.05.30136738611.0ND29.7ND2774ND218416756674
F50.57.592.00.70133959.1ND28.9ND183613.016334553975
F67.170.822.24.522254534ND16.1 41.1ND2118 ND3413 1180 6768
PNECsediment b
Algae 133025102330 3250
Crustaceans 12808402880 13,600 181,400
Fish 14705101110 32,500
a MDL: method detection limit, ND: not detected. OM: organic matter, TN: total nitrogen, TP: total phosphorus, DMP: dimethyl phthalate, DEP: diethyl phthalate, DnBP: dibutyl phthalate, BBP: butyl-benzyl phthalate, DEHP: bis(2-ethylhexyl) phthalate, DnOP: di-n-octyl phthalate, DiNP: diisononyl phthalate, DiDP: di-isodecyl phthalate, and ∑PAEs: sum of phthalate esters. b PNECsediment: predicted no effect concentration for the sediment-phase [23].
Table 3. Correlation matrix for the sediment characteristics and PAEs in the sediments of the Fengshan River system, Taiwan.
ItemClaySiltSandOMTNTPDnBPDEHPDiNPDiDP
Silt0.94 a
Sand−0.94 a−1.00 a
OM0.410.48−0.48
TN0.450.62 b−0.62 b0.76 a
TP0.010.25−0.250.61 b0.76 a
DnBP0.370.47−0.470.81 a0.69 b0.67 b
DEHP0.170.19−0.190.73 a0.520.59 b0.89 a
DiNP0.380.43−0.430.84 a0.66 b0.67 b0.91 a0.92 a
DiDP0.240.35−0.350.85 a0.73 a0.72 a0.92 a0.87 a0.95 a
∑PAEs0.300.36−0.360.81 a0.64 b0.70 b0.89 a0.92 a0.99 a0.94 a
a significant at p < 0.01; b significant at 0.01 < p < 0.05; n = 12.
Publisher’s Note: MDPI stays neutral with regard to jurisdictional claims in published maps and institutional affiliations.

