
What Kind of Travellers Are Using Carsharing in Beijing? A Study Based on Selective Ensemble Learning


1
Beijing Key Laboratory of General Aviation Technology, Beijing University of Civil Engineering and Architecture, Beijing 100044, China
2
Department of Civil Engineering, Tsinghua University, Beijing 100091, China
*
Author to whom correspondence should be addressed.
Sustainability 2022, 14(1), 540; https://0-doi-org.brum.beds.ac.uk/10.3390/su14010540
Submission received: 29 November 2021
/
Revised: 31 December 2021
/
Accepted: 1 January 2022
/
Published: 4 January 2022
(This article belongs to the Special Issue Shared Mobility and Sustainable Transportation)
Abstract
:As a new urban travel mode, carsharing is significantly different from private cars, buses and other travel modes. Therefore, clarifying the typical characteristics of carsharing, such as individual users’ attributes, travel environment and travel behaviour, is conducive to accurately grasping the development of carsharing. In this study, a selective ensemble learning model is established to analyse typical travel characteristics of carsharing. Firstly, personal characteristics, environmental characteristics and behavioural characteristics were obtained through integrating order data, global positioning system data and station information. Then, based on a consolidated view of carsharing, different types of carsharing travel characteristics were distinguished using selective ensemble learning. Lastly, all kinds of carsharing travel are described in detail. It was identified through this research that carsharing travel can be divided into four kinds: long distance for leisure and entertainment, medium and short distances for business and commuting, a mixed category of medium and short distances for business and residence, and a mixed category of long distance for business and residence. This study can provide a theoretical reference and practical basis for precise planning and design and the scientific operation of carsharing.
1. Introduction
With the development of the Internet and information technology, carsharing has come into being as a green travel mode to alleviate the conflict between limited social transportation resources and people’s ever-growing need for better travel [1,2]. Carsharing, or so-called timeshare rental, is a self-service car rental service model where travellers can rent cars on an hourly or daily basis [3,4]. Travellers do not need to buy a car, and they only need pay the rent. In addition, travellers do not need to be responsible for vehicle maintenance, parking and other problems. Moreover, travellers can better enjoy the privacy of travel. Therefore, carsharing is favoured by many travellers. Compared with private cars and the traditional car rentals, carsharing could improve the utilisation rate of vehicle resources and reduce the empty–loading ratio [5,6]. Moreover, a majority of carsharing services use electric vehicles, which have a low negative impact on the environment [7,8]. In addition, previous studies have shown that carsharing could reduce travellers’ interest in buying a private car [9,10]. However, problems, such as poor user experience, unreasonable station location, low cognitive levels, limited acceptance of carsharing, and citizens’ data privacy, have resulted in the failure of the expected development status of carsharing services [2,11], which means they have failed to achieve the expected results of alleviating traffic congestion, reducing energy consumption and environmental pollution.
In essence, carsharing is still a form of car travel with a small carrying capacity [12], which is contrary to the transit-oriented development model. Therefore, a better understanding of the impact of carsharing on the transportation system is particularly critical, especially with regard to the typical travel characteristics of carsharing, which can isolate the differences between carsharing travellers and traditional travel-mode travellers.
To sum up, the objective of this paper was to examine what kind of travellers use carsharing, clarify the typical travel characteristics of carsharing and develop a theoretical basis and practical reference for carsharing operators and managers. Some scholars have realised the importance of studying different carsharing travel types and conducted in-depth studies through questionnaires [13,14,15]. The innovation of this paper compared with previous studies is that we comprehensively considered the travel characteristics of carsharing and adopted a method with a higher classification accuracy. This paper is presented in five sections: The first section introduces the background and current research on carsharing travel characteristics. Section 2 provides a literature review of the existing early studies on carsharing travel. Section 3 describes the research framework, collection and processing of essential data and the modelling of selective ensemble learning. Section 4 lists all of the analytical results of the model analysis and describes all of the types of carsharing travellers. Finally, Section 5 concludes this study and proposes future research recommendations.
2. Literature Review
The concept and practice of carsharing originated in Europe [16]. In the development process of carsharing, scholars, both at home and abroad, conducted a large amount of research on travel characteristics, influencing factors, operations management, services, etc. [17,18,19]. Among them, the travel characteristics of carsharing can be divided into three categories: personal characteristics, environmental characteristics and behavioural characteristics.
2.1. Personal Characteristics
Scholars have carried out carsharing research on the aspects of age, gender and income. By analysing survey data from 45 carsharing members and 76 carsharing non-members, Seik found that the average family size of carsharing members was 4.1, 73% were married, 49% were middle-income families, and 62% had never owned a car before [20]. Shaheen et al. found that students and low-income families preferred to use shared cars [21]. Through a questionnaire survey, Millard evaluated the personal characteristics of carsharing travellers and found that the average age of carsharing travellers was 37.7 years old, and the average family size was 2.02, and most of the travellers were female (55%) [22]. Zhou analysed the characteristics of carsharing campus travellers at the University of California, Los Angeles (UCLA), and found that carsharing was most popular among bus commuters, college students and female employees [23]. By collecting data from the Internet, Efthymiou et al. built an analysis model of the willingness to use carsharing. The results showed that carsharing was more attractive to low-income people; it appealed to people who were currently using buses or electric vehicles to get to work or school; and Greeks aged 26–35 were more likely to use carsharing [24]. Le et al. summarised the socioeconomic profiles of carsharing travellers as urban residents, well-educated, middle- and upper-income, young people living alone, or small families without children [25]. By establishing an ordered probability model, Kim et al. found that the social and economic views of carsharing travellers were the most important factors affecting participants’ attitudes. Moreover, attitudes were also influenced by personal characteristics such as gender, age and income [26]. Prieto et al. studied socio-demographic factors affecting interest in carsharing, and the results showed that socio-demographic variables played an important role in the individual choice behaviour of carsharing travellers: highly educated, younger males were the key factor [27].
2.2. Environmental Characteristics
Scholars have conducted in-depth studies on the relationship between shared automobile order data and weather data. By analysing order data from two carsharing systems, Schmöller et al. found that weather was not a single dominant factor, but it was one of many factors [28]. Through order data in Munich, Schmöller et al. found that weather changes affected carsharing usage [29]. Scholars also investigated the relationship between carsharing travel conditions and the environment through questionnaires. Yoon et al. established a binomial logit model on preference for carsharing. The results of the model showed that warm weather (e.g., 10, 20 and 30 °C) conditions were more conducive to carsharing than low temperatures (e.g., 0 °C) conditions, which might be related to the poor driving conditions in cold weather. In addition, when environmental conditions were unfavourable, people preferred more private modes of travel such as carsharing [30]. Wielinski et al. also established a binomial logit model to discuss the choice behaviour of electric and hybrid carsharing travellers. The analysis showed that driving distance had a significant impact on the probability of using carsharing; electric shared cars were less popular for distances of more than 24 km; cold weather reduced the probability of choosing carsharing [31].
2.3. Behavioural Characteristics
Scholars have carried out studies on the behavioural characteristics of shared car order data. By processing the operation data of shared cars, Morency et al. classified the travellers of carsharing according to the changing rules of vehicle use frequency, driving distance and weekly use [32]. Costain analysed the travel behaviour of AutoShare users and found that trips can be divided into local trips and inter-city trips. The average annual travel distance of local trips was 50 km, and the average annual travel distance of out-of-town trips was 340 km. Through the categorisation of monthly, weekly and daily usage, it was found that less than 10% of members travel more than three times a month. More than 60% of carsharing members drive less than 40 km per year [33]. Schmöller et al. used the clustering analysis method to combine the two aspects of time and space to identify the travel categories of carsharing with similar spatial travel patterns and found the spatial–temporal distribution of the supply and demand of carsharing to be asymmetric [29]. Wagner et al. used the zero-expansion Poisson model to comprehensively analyse the data set of carsharing travel in Berlin, including data about local points of interest and demographic data, and explained the spatial variation of carsharing demand with points of interest. The proposed prediction method can accurately predict the carsharing travel demand in new regions [34].
From the above literature review, it can be seen that much research has been conducted on carsharing travel characteristics and much has been discovered. However, the links between personal, environmental and behavioural factors of travellers have been ignored. A comprehensive description of personal, environmental and behavioural characteristics of carsharing travel based on multi-source data has rarely been attempted, although the research on the characteristics of carsharing travel needs to be in depth. Therefore, this paper focused on creating a comprehensive description of carsharing travel characteristics, which included personal, environmental and behavioural data. Based on previous research, major factors of focus for the present study were identified as given in Table 1.
Ensemble learning refers to solving the same problem through multiple learners, which can significantly improvements in the learning ability of the system [35]. Selective ensemble learning involves selecting the qualified base classifier from all the base classifiers through certain methods or strategies, so as to form the final ensemble system [36]. Given the multi-dimensional characteristics as well as the data-intensive characteristics of carsharing travel and drawing on the idea of ensemble learning, a segmentation framework of carsharing travel characteristics based on selective ensemble learning was proposed to analyse the typical travel characteristics of carsharing and to clarify what kind of travellers use carsharing. The flow of the overall research framework is shown in Figure 1, which consists of the research steps of this paper.
Firstly, based on data, including a user registration system, order system and global positioning system (GPS)-based vehicle monitoring system, a unified view was constructed. Then, through unsupervised learning algorithms, a base classifier collective was generated for travel characteristics in each view. Moreover, high-quality base classifiers were selected for integration. Lastly, based on the above analysis’ result, characteristics of carsharing travellers were described.
3. Methodology
3.1. Collection and Processing of Data
3.1.1. Collection of Travel Data
X, a carsharing company, provides four types of original data about carsharing: user order data, vehicle GPS data, vehicle information data and station information data.
X carsharing users knew X company would collect their travel information and conduct impersonal analyses. Informed consent was obtained from all individual participants included in the study. Moreover, X carsharing company knew these data would be used for scientific research.
User order data were carsharing order information including 9 sets of field information such as origin station identity document (ID), reservation time and age of a user. One month of user order data were available. Partial booking data are shown in Table 2.
The vehicle GPS data were one month’s GPS information for of all the carsharing vehicles in this company. The GPS information included 8 sets of field information including code, time, vehicle identification number, longitude, latitude, charging status, electric quantity and total mileage of the vehicle. The information was updated every 10 s. Partial GPS data are shown in Table 3.
The vehicle information data included the vehicle ID, license plate number and vehicle identification number for of all the vehicles operated by this carsharing company. To protect privacy, vehicle information data are not shown in this paper.
The station information data included the carsharing station name, station ID and detailed station address. Partial station information is shown in Table 4.
3.1.2. Processing of Travel Data
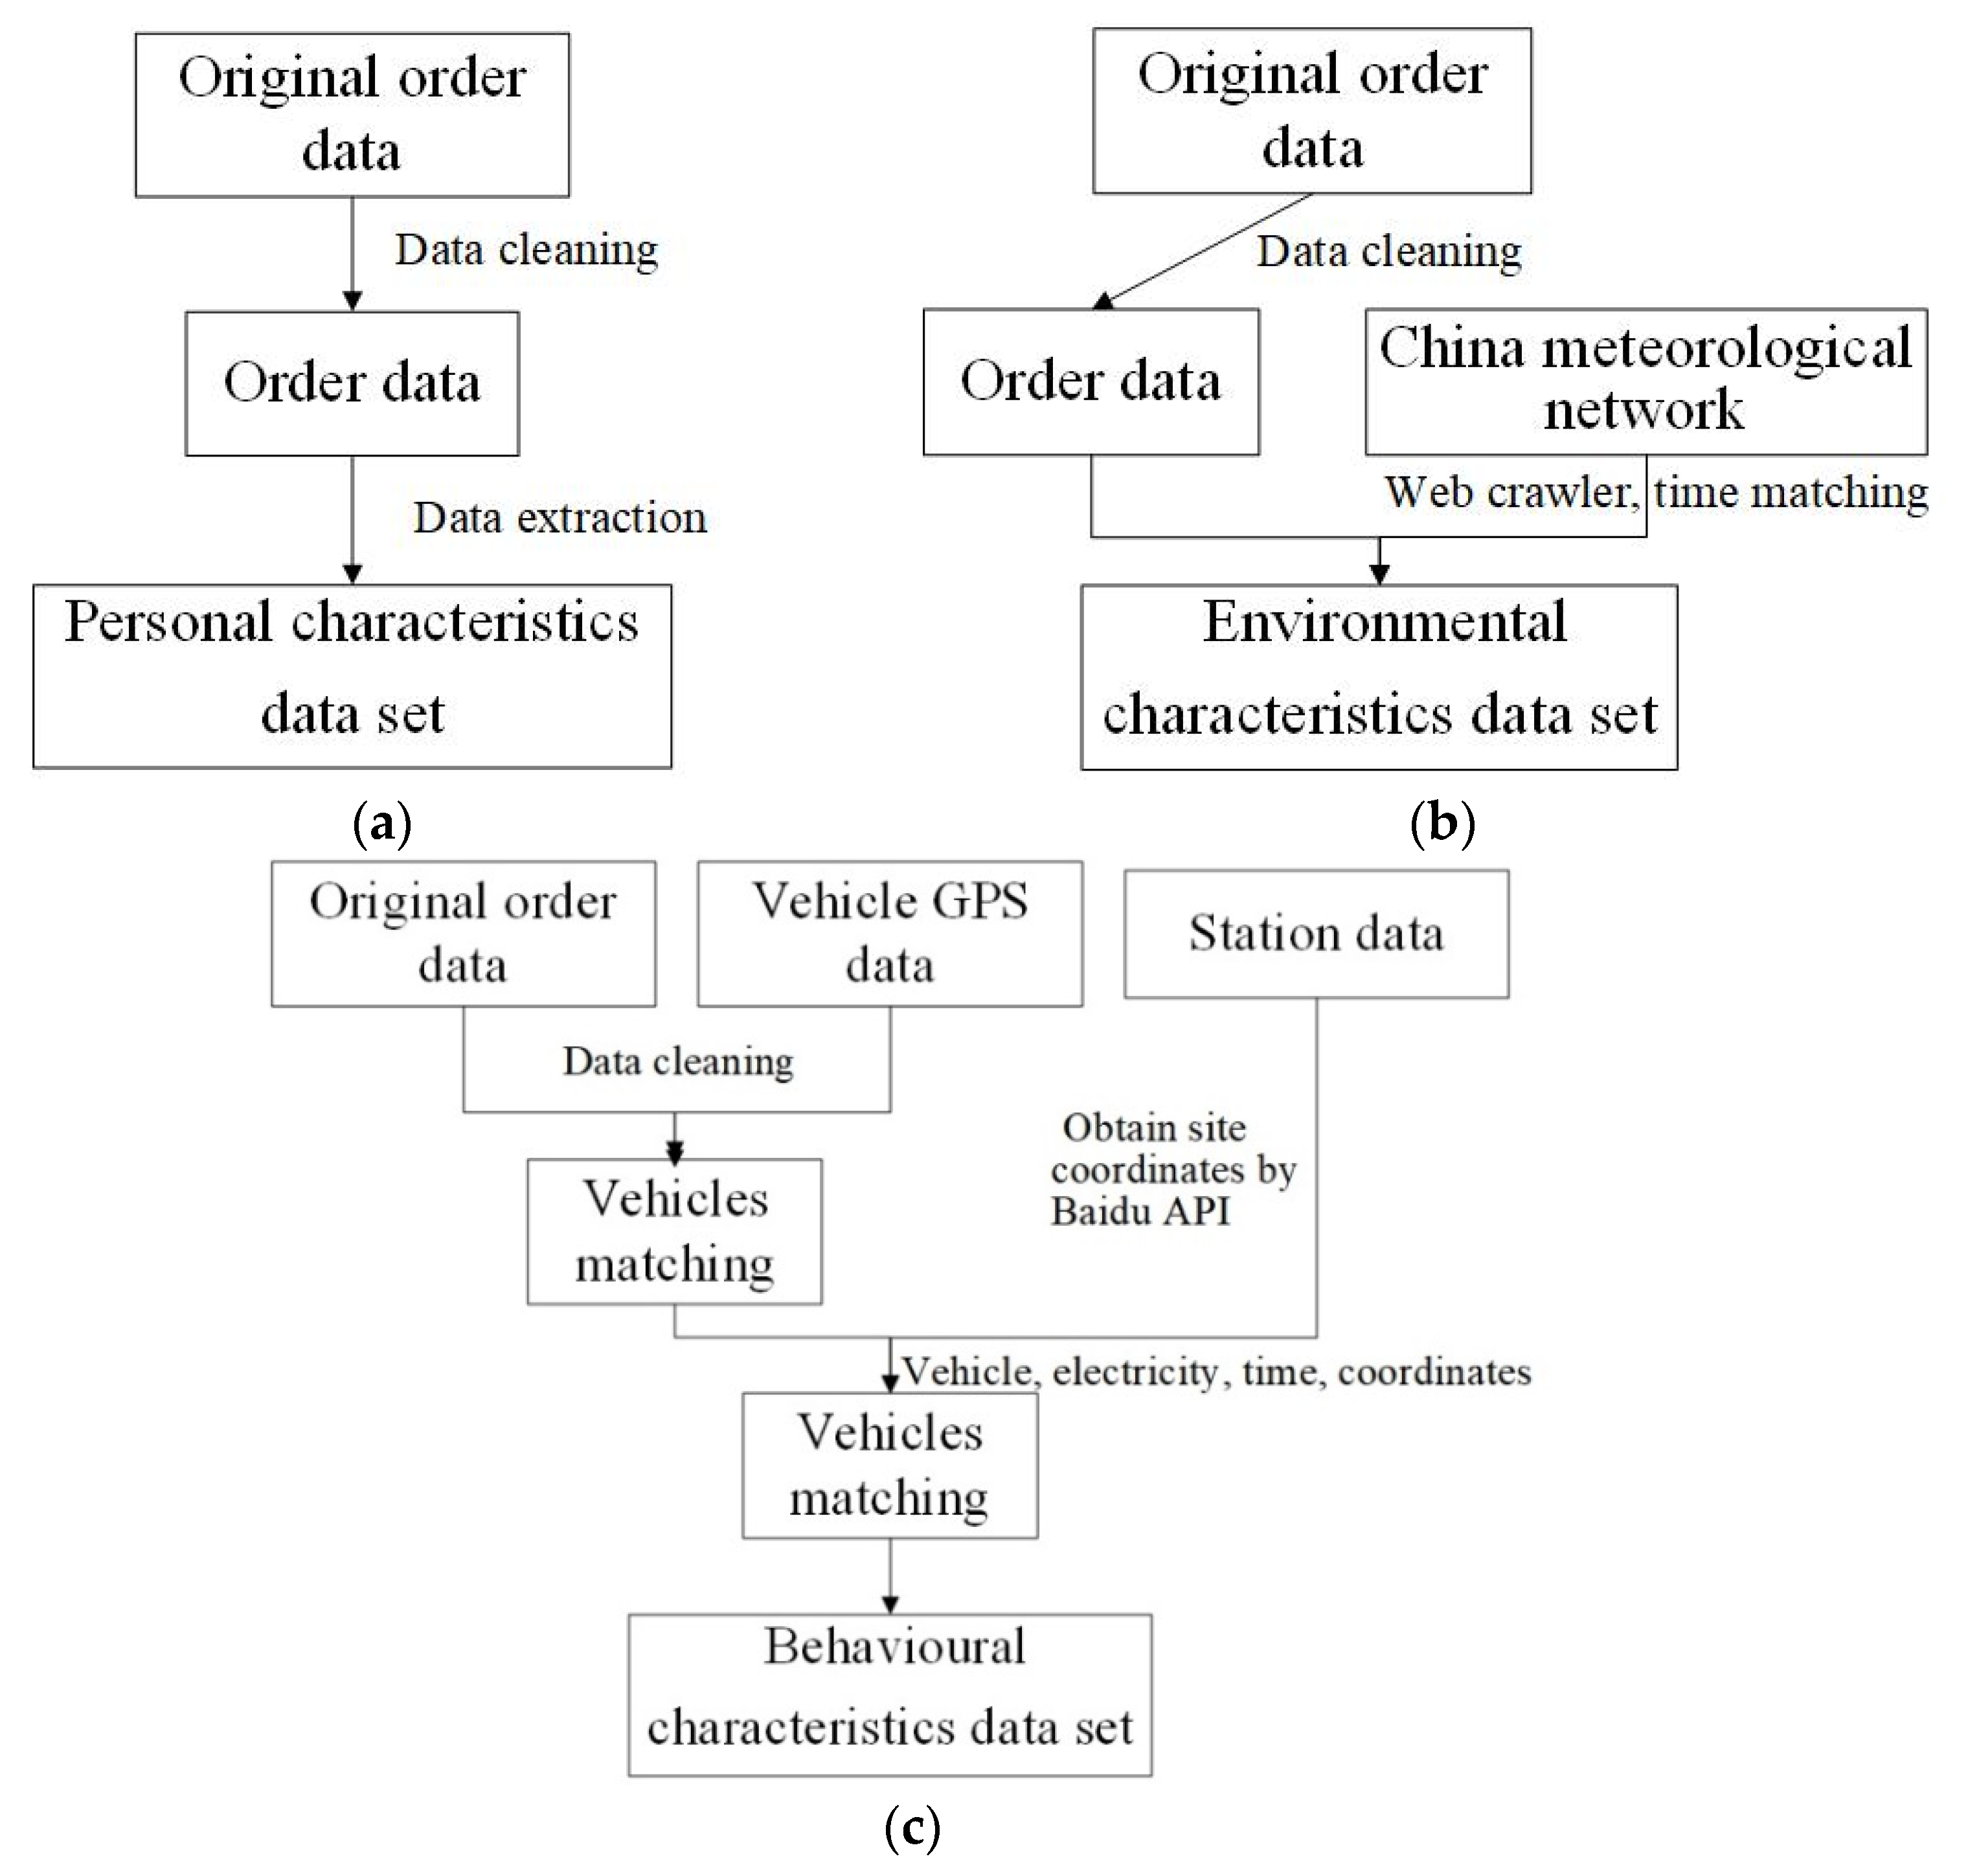
As shown in Figure 2, through data cleaning and pre-processing of user order data, the personal characteristics (i.e., gender and age) of each carsharing traveller were obtained to form a personal characteristics data set. By means of data cleaning and a web crawler on the original order data, the weather conditions and air quality data from the Chinese meteorological network were obtained, and the corresponding time nodes were matched so that the environmental composition (i.e., weather conditions and air quality) of each carsharing travel event was obtained and the travel environmental characteristics data set could be formed. Through data cleaning of the order data, vehicle GPS data and the station data, the vehicle identification number (VIN) code matching the order data and vehicle GPS data was used to obtain the day of the week, travel hour, travel time, travel distance and travel speed of each carsharing travel event. Through the Baidu Map application programming interface (API), the coordinate data of the carsharing station was obtained, and then the land usage of the station was estimated, and the land usage of the destination and departure locations of the carsharing journey was obtained. After this processing, the behavioural characteristics data set was finalised.
Through the collection and processing of data, 19,850 pieces of carsharing travel data were obtained. Every piece of travel data contained 11 characteristics in three parts: personal characteristics, environmental characteristics and behavioural characteristics.
3.2. Modelling of Selective Ensemble Learning
3.2.1. Construct the Base Classifier Collective
The construction methods for obtaining the base classifier could be divided into 3 types: (1) using the same data set and choosing different algorithms or choosing different initialisation parameters for the same algorithm; (2) using the same algorithm and choosing different sampling subsets of the data set; (3) selecting different feature subsets of the data set or different cast shadow spaces to obtain the base classifier [37]. Of these types, the collective quality of the base classifier obtained by method (3) was the highest. Therefore, this paper divided the carsharing travel characteristics into several subsets (each subset representing a view), and then base classifiers were generated, respectively.
Suppose that the travel data set was . Firstly, the travel characteristics were divided into subsets, , each subset representing a view. The different characteristic subsets , of sample set were selected as the training set, and a cluster was generated for each training set with the purpose of obtaining the label vector.
This paper took an iterative algorithm for each travel characteristic training set cluster. Firstly, the number of clusters, , as given, and the algorithm randomly selected points as the initial cluster centres. According to the distance measurement, each sample was assigned to the nearest cluster centre. Then, each cluster centre was updated iteratively until all samples belonging to a new cluster centre were consistent with the original.
Let the data set to be clustered be , and the objective of the algorithm was to minimise the variance criterion function, , within the cluster. The calculation formula of was as follows:
where represents cluster , represents the square of the distance between each point in the cluster and the centre of the cluster. The number of clusters, , affects the accuracy of the results. To obtain the optimal value of , this paper calculated the evaluation function [38] to determine the value of , and then selected the tag vectors closed within the clusters and scattered among the clusters to participate in the integration of the base classifier. The evaluation function was calculated as follows. Firstly, the similarity between the two samples was defined:
where is the Euclidean distance, and is the scaling factor which was used to adjust the sensitivity. Obviously, the similarity of the two sample points is . The tightness of the cluster can be expressed by the average similarity among all samples belonging to the cluster; then, the tightness of the cluster of the marker vector, , can be calculated as follows:
These two measures were used as the evaluation function of the overall quality of the clustering effect, and weight allocation should be weighed during the merger, namely:
From Equation (4), it can be seen that the marker vectors which were close within the clusters and had separate inter-cluster boundaries will have the maximum value of the evaluation function.
In this paper, the value of the evaluation function was used as the basis for selecting individual marker vectors for base classifier integration. That is to say, for the value, , between range and , the marker vector with the largest value of the evaluation function was selected to participate in the base classifier integration.
3.2.2. Compute Base Classifier Integration
Suppose that base classifier is used to cluster the sample set, which will obtain a marker matrix, . The marker vector divides the sample set into clusters. is the cluster label for the sample point . Then, the base classifier integration algorithm uses a consistency function to merge the marker matrix into the final marker vector . Base classifier integration consists of two steps: firstly, the base classifier collective is generated, that is to say, different individual marker vectors are generated by various base classifiers; then, individual integration is carried out, that is to say, individual marker vectors are combined to obtain a unified partition result.
After the base classifier collective is generated, the task of the individual integration stage is to design a consistency function to merge multiple marker vectors and generate unified partition results. In the individual integration stage, a selective integration strategy based on weight is adopted [39]. The basic idea is that if the travel characteristics of a cluster in view A are divided into different clusters in view B, the most representative clusters are selected to participate in the integration and, vice versa, if a view B cluster is divided into view A. Thus, the proportion of the number of the same travel characteristic objects covered by each cluster in different views is used as the weight to evaluate the representativeness of the cluster.
Assume that the carsharing travel characteristic are divided into views A and B, and the travel data set is divided into clusters and clusters by the algorithm in Section 3.2.1. The tag vectors are and , which are represented by and .
Let the number of travel objects in the cluster mark be , and the number of the same travel objects covered by the cluster mark and be . Then, the set of can form an overlap matrix, . The row of the matrix represents, under view B, the distribution of the cluster under view A, and the column of the matrix represents, under view A, the distribution of the cluster under view B. For each element in the overlap matrix, its weight is defined as:
The matrix is scanned by column, and the cluster which has a value that is higher than a pre-set threshold is selected as the output result. When the view is adopted, the set of the number of the same travel objects covered by cluster markers under each view, , constitutes an dimensional hypercube. For each grid element, its weight can be defined as:
The hypercube is traversed and the clusters that have values that are higher than the pre-set threshold (30%) are selected as the output.
3.3. Model Validation
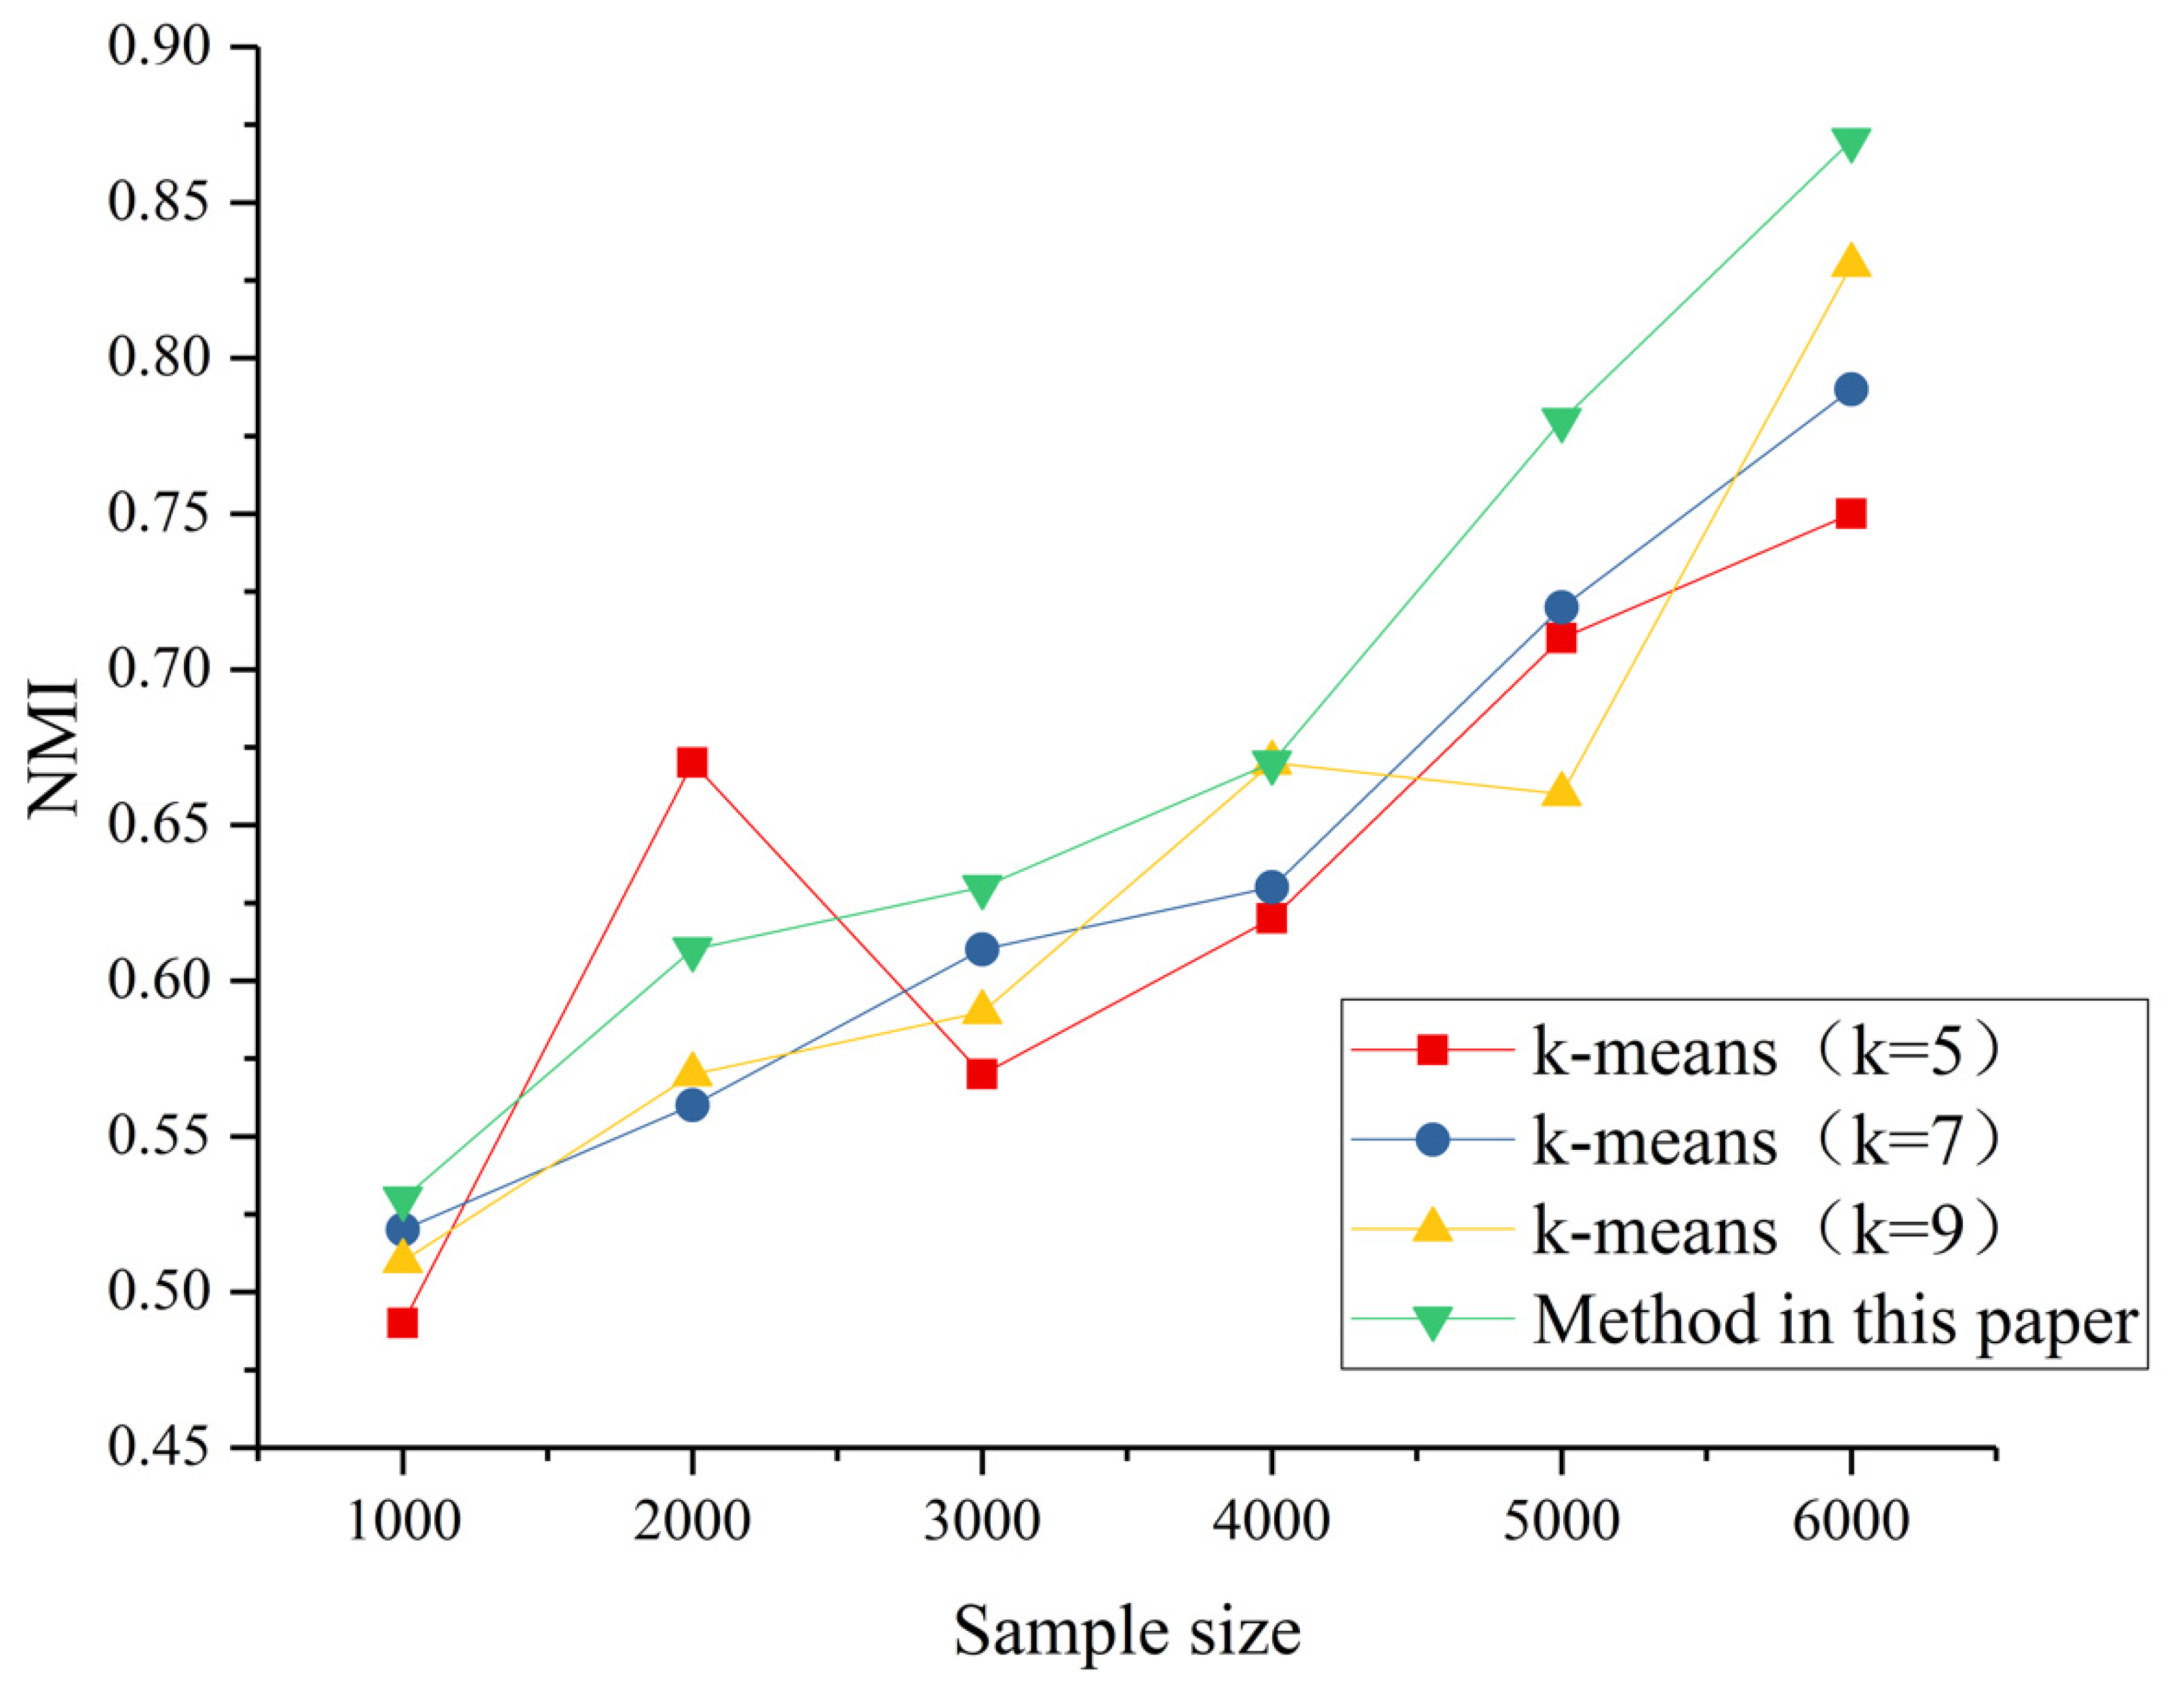
To test the performance, the selective ensemble learning model was compared with K-means clustering. The maximum number of iterations was set to 100, and the threshold of the loop stop was set to 1 × 10⁻⁵. Samples of 1000, 1500, …, 5000 were extracted from the total sample data, and the average results were output after 10 experiments. The evaluation indicator of the clustering performance adopted normalized mutual information (NMI), which is a symmetric measure that can be used to measure the shared information between two distributions [40]. The range of the NMI was from 0 to 1, and the larger the value, the better the clustering effect.
Assuming that and were the distribution of N sample labels, the entropy of the two distributions (entropy represents the degree of uncertainty) is as follows:
In Formula (7), . In Formula (8), .
Mutual information (MI) between and is defined as:
In Formula (9), .
Then, NMI is as follows:
Figure 3 shows the clustering accuracy of the two algorithms with the increase in the number of samples, including K-means algorithm (the K was selected randomly as 5, 7 and 9) and selective ensemble learning in this paper. As shown in Figure 3, with the increase in the number of samples, the clustering accuracy of the selective ensemble learning, K-means (K = 7) and K-means (K = 9) improved to a certain extent. Meanwhile, when the sample size was small (sample size = 2000), the clustering accuracy of K-means (K = 5) was highest. Then, with increasing sample size, the clustering accuracy of the selective ensemble learning method in this paper was more accurate than the K-means algorithm, which was principally because the selective ensemble learning method was integrated after clustering into three views of personal characteristics, environmental characteristics, and behavioural characteristics. In addition, the K-means algorithm needs to determine the number of clusters, K, in advance, which leads to the need to try different values of K and much rework. But the algorithm in Section 3.2. automatically selects the number of clusters in each view according to Formula (4) in the given K-value interval, which has certain advantages. Overall, the larger the sample size, the more clustering accuracy the method in this paper and the better it is than K-means.
4. Results and Discussion
Based on the travel clustering results from the view of personal characteristics, environmental characteristics and behavioural characteristics, an overlapping matrix was constructed to record the number of the same objects covered by each pair of cluster markers. Then, the corresponding weight θ of each matrix element was calculated. When the threshold value was set as c, 16 clusters were integrated with a coverage rate of 86%. According to the travel proportion and characteristic consistency, all the significant points were merged, and some clusters were merged. Finally, four clusters were achieved, which is to say that carsharing travel can be divided into four types.
4.1. Travel Characteristics of the First Type
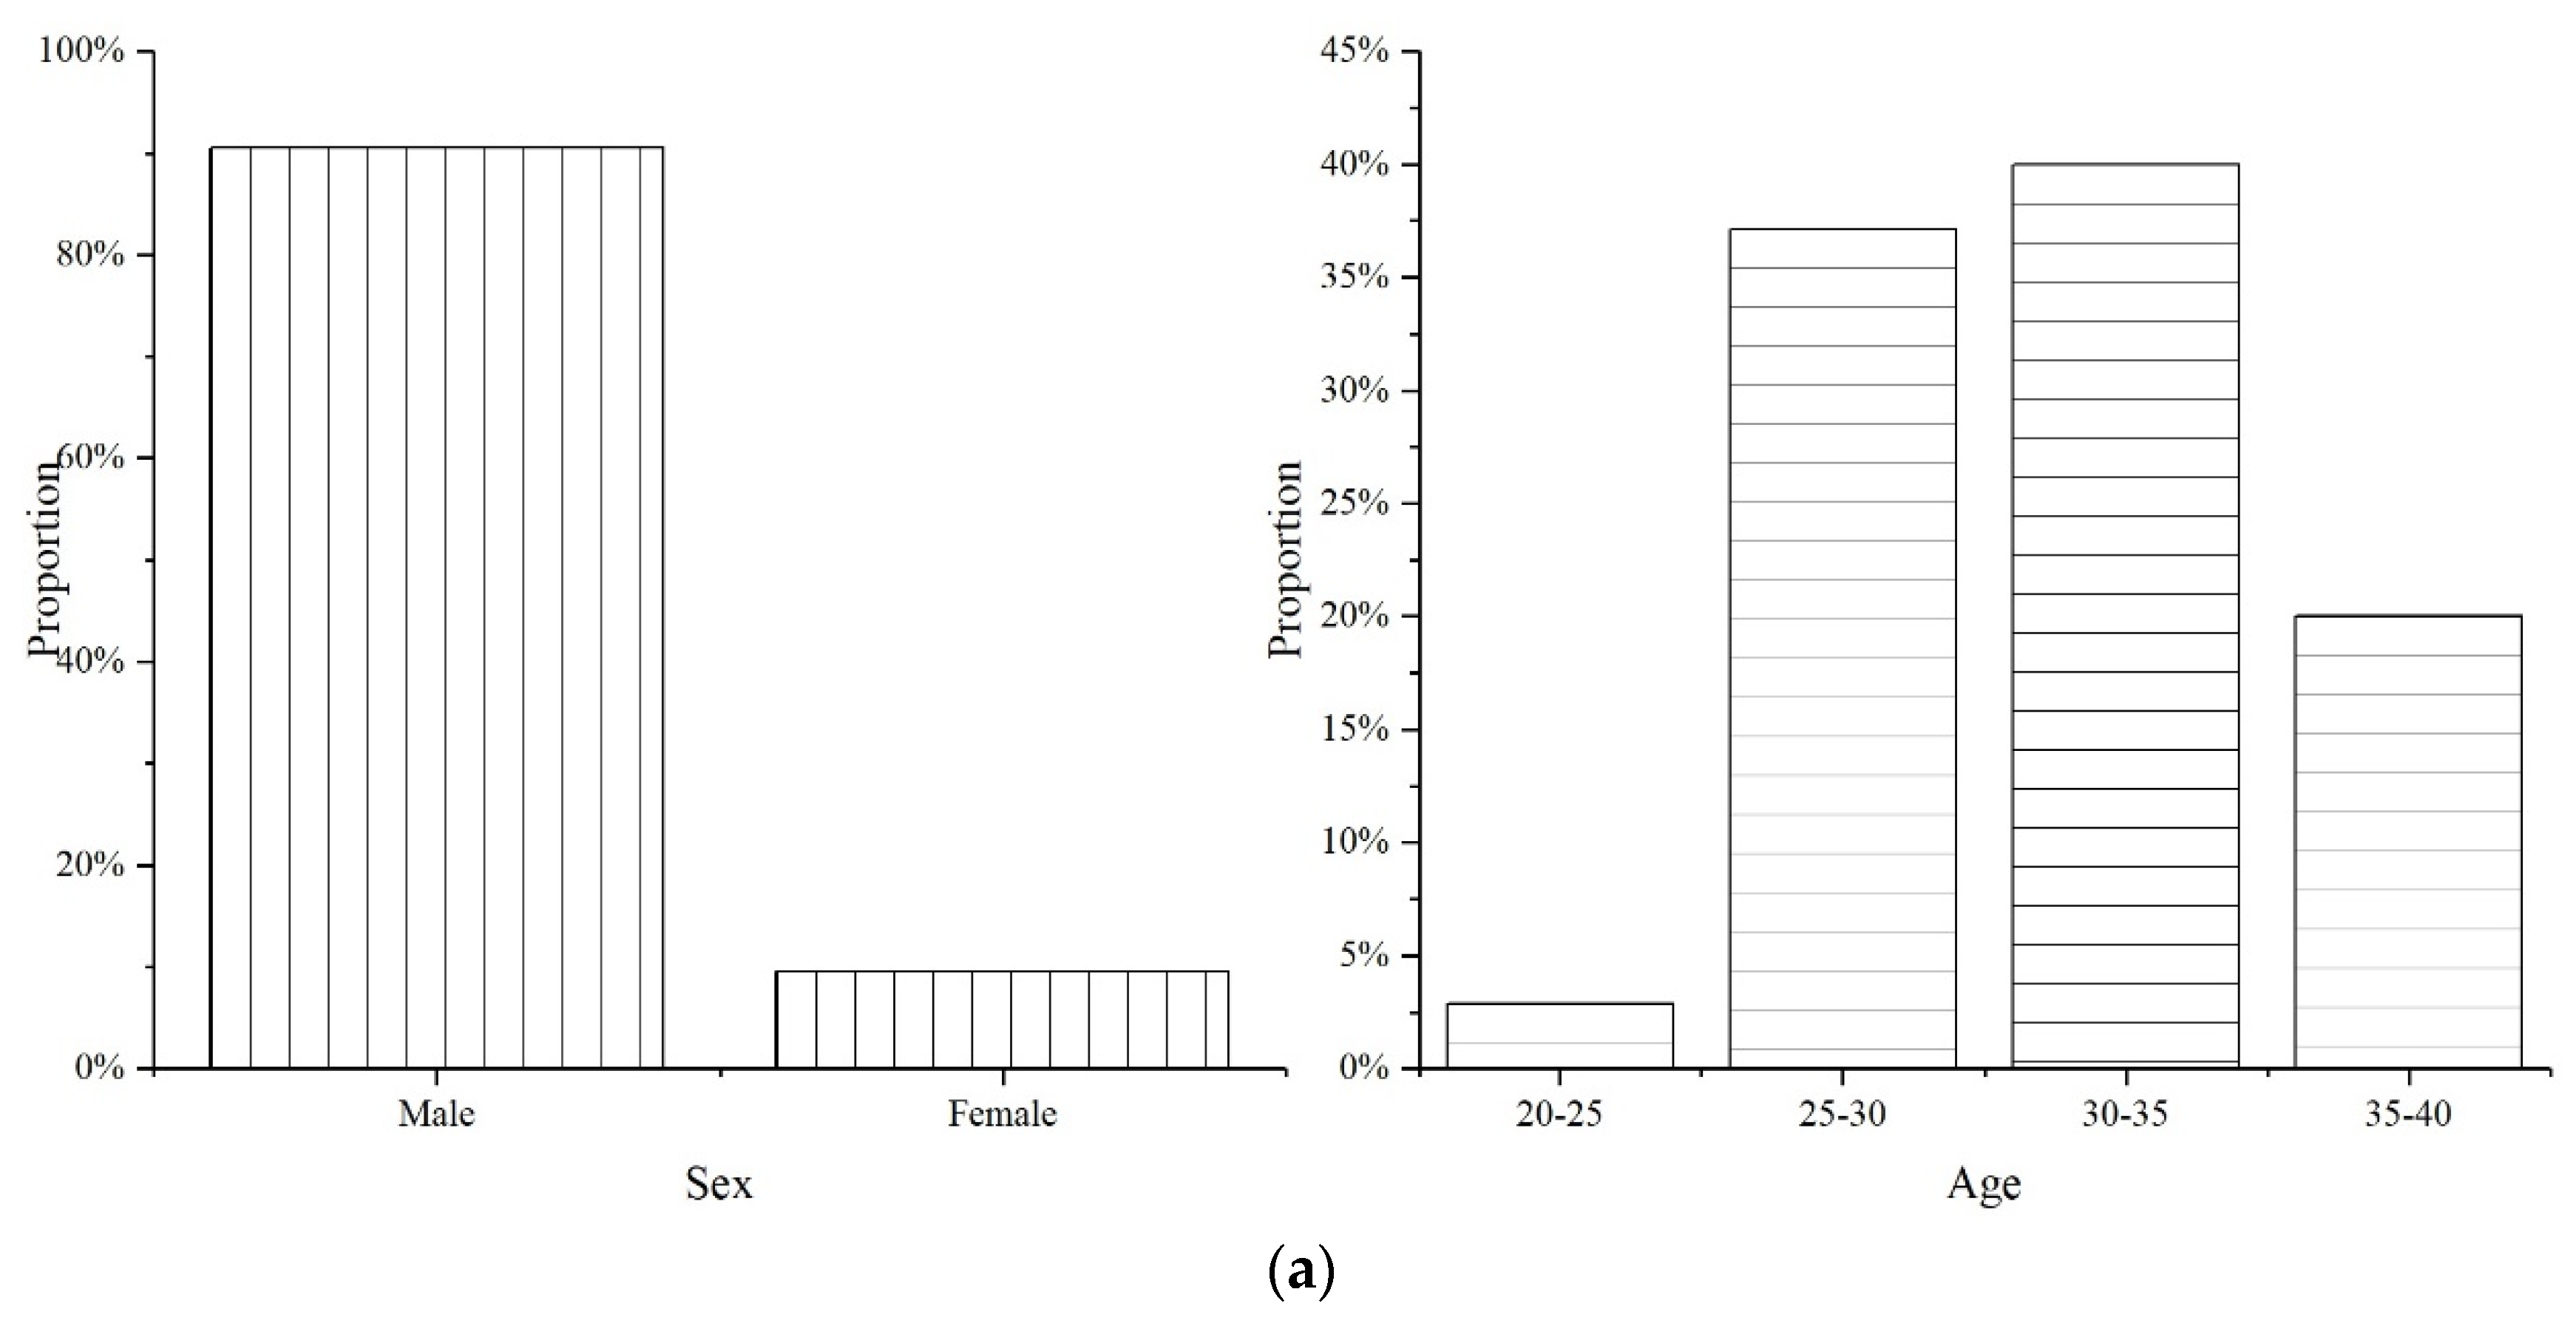
(1) Personal characteristics: As shown in Figure 4a, in the first kind of carsharing travel, the proportion of males was much higher than females, with males accounting for up to 90.5%. The majority of people are middle-aged or young, with 40% aged between 30 and 35, followed by 37.1% aged between 25 and 30 and 20% aged between 35 and 40.
(2) Environmental characteristics: As shown in Figure 4b, air conditions of the first kind of carsharing travel were good. This kind of carsharing travel was mainly on sunny days, accounting for 72.4%, followed by cloudy days, accounting for 27.6%, and almost none on rainy days. The air quality of the first kind of carsharing travel was good, with 69.6% being excellent or good, followed by mild pollution at 30.4%. The environmental composition of this kind of carsharing travel differed greatly from that of the overall travel environment, indicating that this kind of traveller intentionally chooses to use carsharing on weekends with sunny days and good air quality, which is flexible travel.
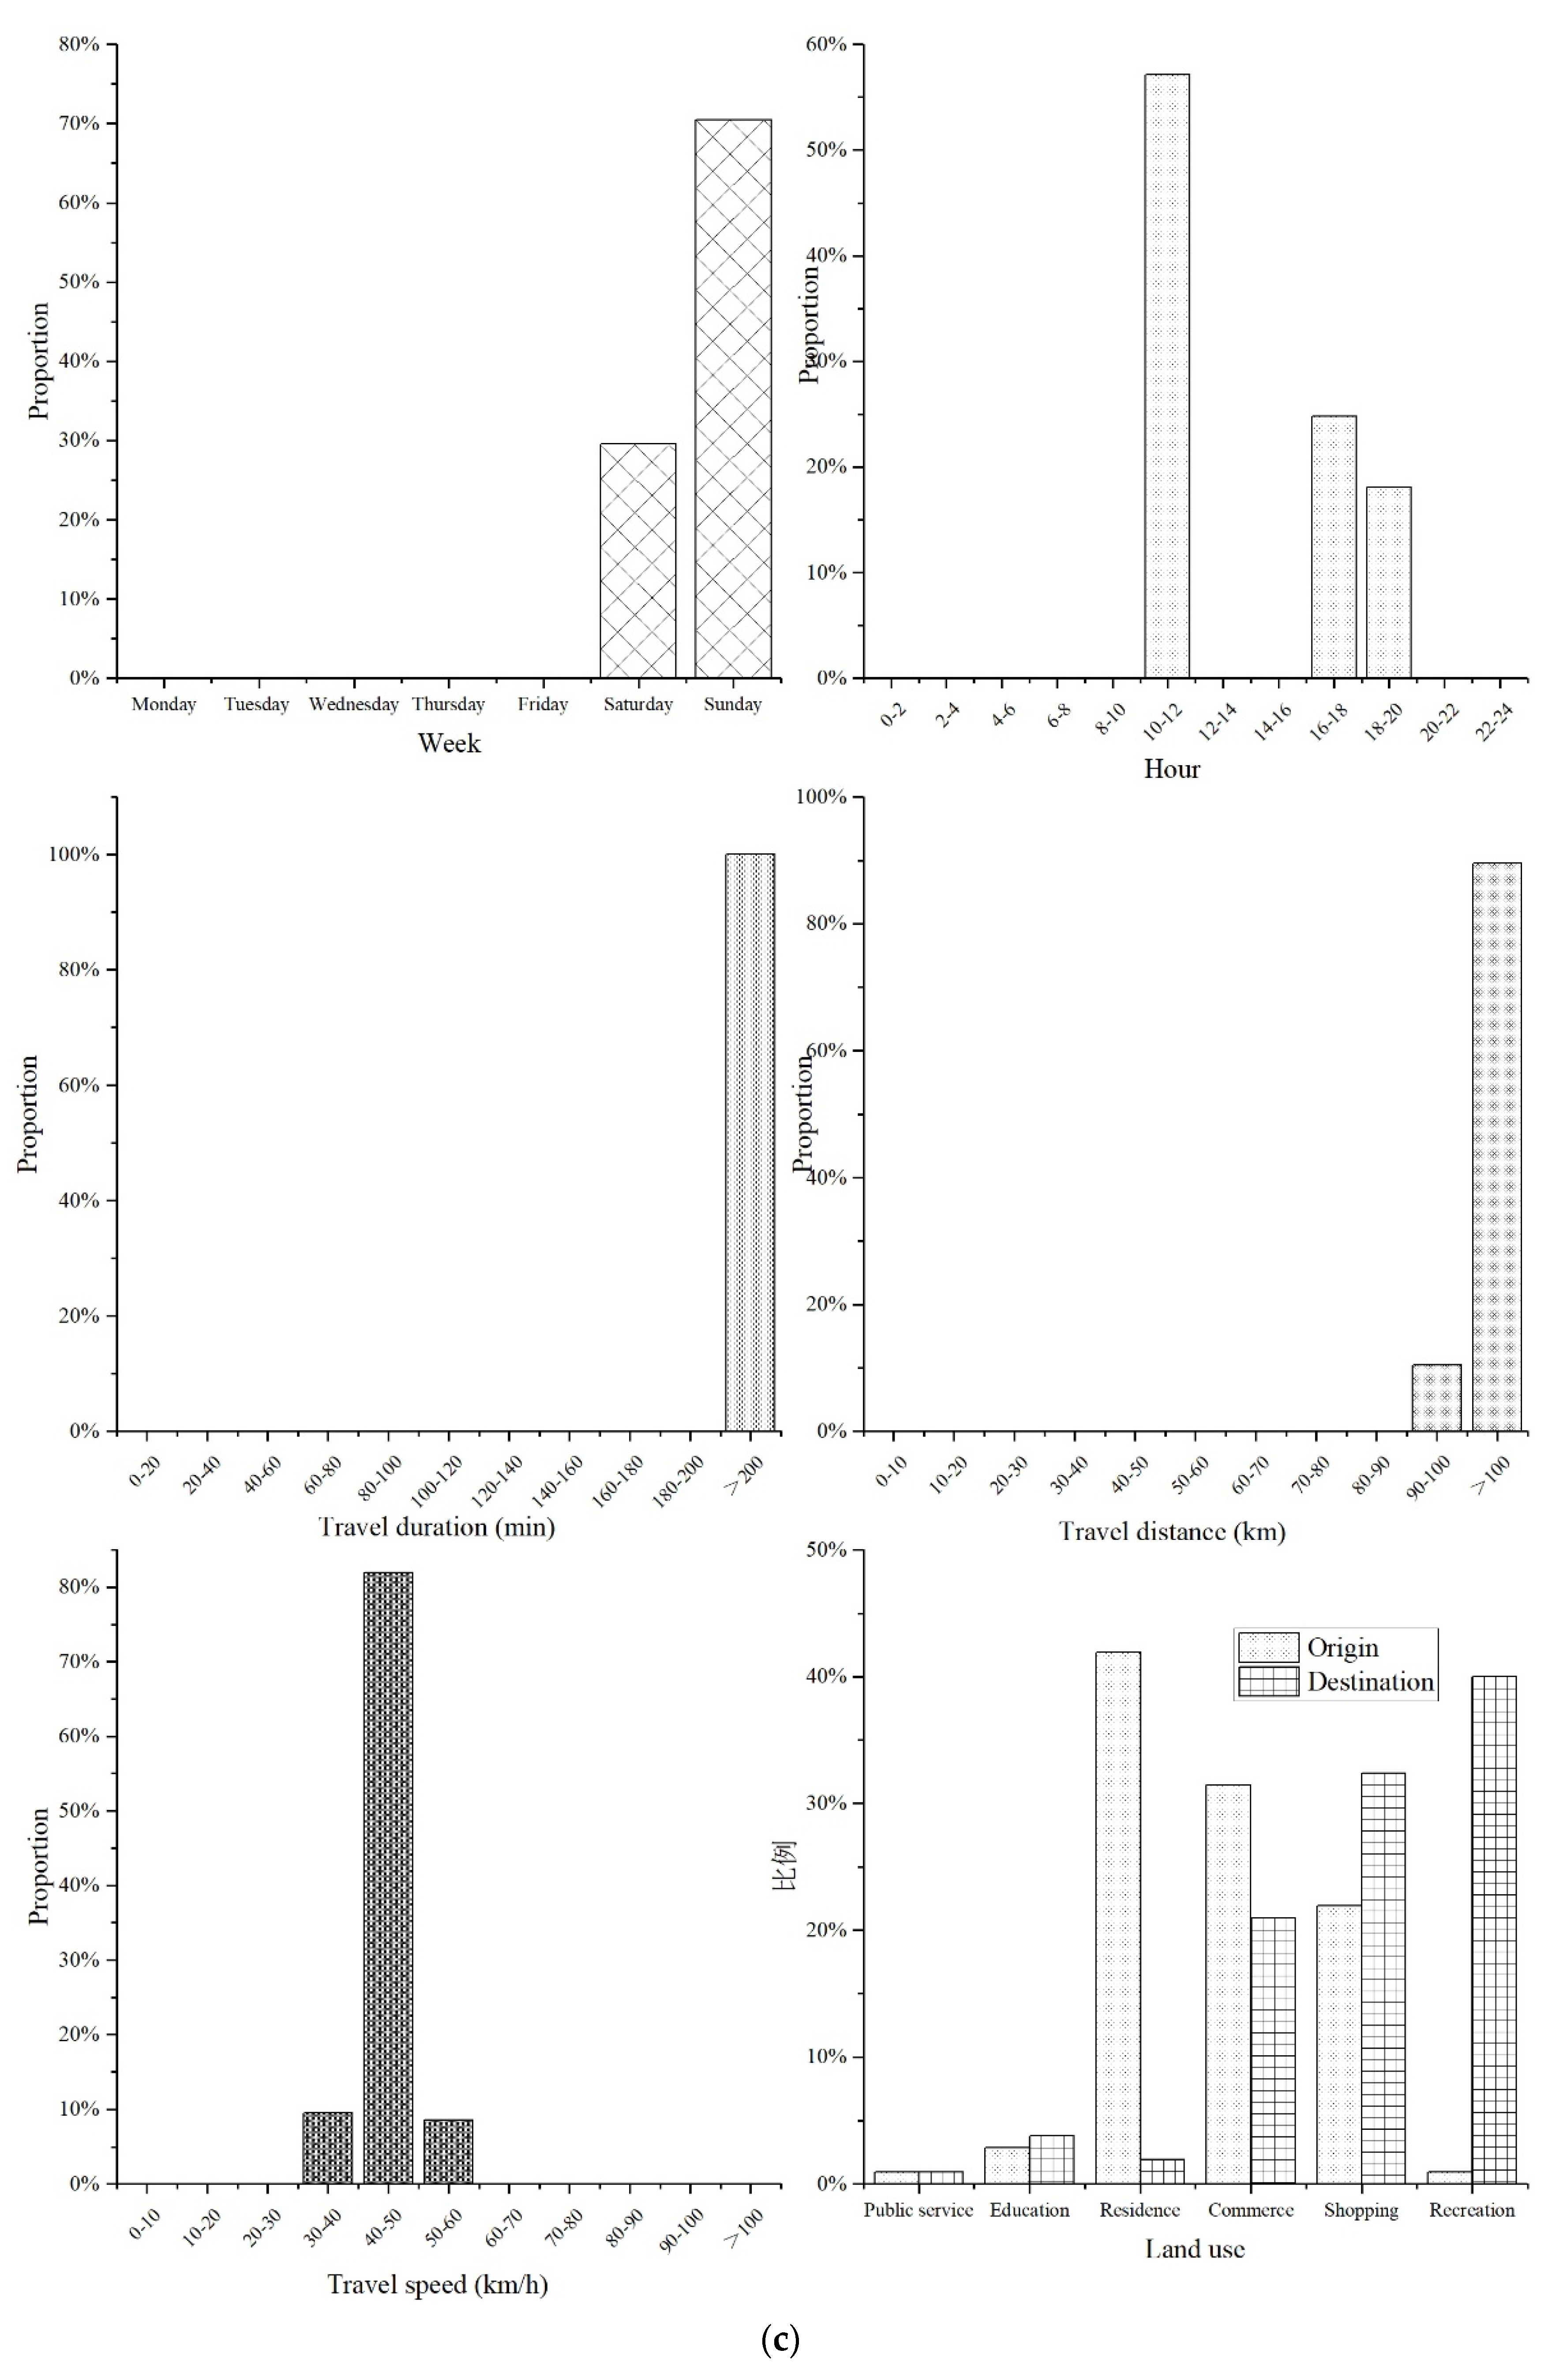
(3) Behavioural characteristics: Figure 4c shows the temporal and spatial distribution of the first kind of travel. In terms of time, travellers mainly travel on Saturday and Sunday, accounting for 29.5% and 70.5%, respectively. The travel time for the whole day was concentrated on the periods 10:00–12:00, 16:00–18:00 and 18:00–20:00, accounting for 57.1%, 24.8% and 18.1%, respectively. The travel duration was relatively long, more than 200 min. In terms of distance, the majority of journeys were long distance, 89.5% above 100 km, and the remaining 10.5% at 90–100 km. The overall average speed was low; 40–50 km/h accounted for 89.5%. The land use of origin locations was mainly residential, commercial and retail, accounting for 41.9%, 31.4% and 21.9%, respectively. The land use of destinations was recreational, retail and commercial, accounting for 40%, 32.4% and 21%, respectively. In both origin and destination, the proportion of retail and commercial land use was high, which is also related to the fact that the carsharing stations are mostly located in retail and commercial areas. In the first kind of carsharing travel, the land use of origin had a high proportion of residential use, while the land use of destination had a high proportion of recreational use, so it can be inferred that this type of travel was mainly for recreation and entertainment.
4.2. Travel Characteristics of the Second Type
(1) Personal characteristics: As shown in Figure 5a, in the second kind of carsharing travel, the proportion of male users was much higher than female users, with males accounting for up to 90.4%. The majority of people were middle-aged or young, with 37.7% aged between 35 and 30, followed by 29.5% aged between 20 and 25 and 18.1% aged between 30 and 25.
(2) Environmental characteristics: as shown in Figure 5b, weather conditions of the second type of carsharing travel were fairly evenly distributed. Cloudy, rainy and sunny days accounted for 46.5%, 35.9% and 17.7%, respectively. The proportions of good air quality and mild pollution were 43.3% and 36.6%, respectively, followed by excellent air quality, accounting for 14.0%. The environmental composition of carsharing travel was consistent with the proportion of the overall environmental composition, indicating that the second kind of carsharing travel was inflexible trips, which did not change according to environmental changes and were not affected by the external environment.
(3) Behavioural characteristics: These are depicted in Figure 5c, which show the temporal and spatial distribution of the second kind of travel. In terms of time, users mainly travelled on workdays, accounting for 14.5%, 15.2%, 15.5%, 14.2% and 15.1% from Monday to Friday. The travel time was evenly distributed throughout the day. The travel volume was high from 8:00 to 22:00, and two small peaks appeared at 12:00–14:00 and 18:00–20:00. The travel was mainly 40–120 min, accounting for 93.6%. In terms of distance, the travel distance was mainly short and middle distance: 10–30 km accounted for 85.5%. The overall average speed was low: 20–30 km/h accounted for 70.4%. The land use of origin locations were mainly retail and commercial, accounting for 76.9%, followed by residential land at 13.7%. The land use of destination locations was also dominated by retail and commercial, accounting for 75.6%, followed by residential land at 14.8%.
4.3. Travel Characteristics of the Third Type
(1) Personal characteristics: As shown in Figure 6a, in the third type of carsharing travel, the proportion of male users was much higher than female users, with males accounting for up to 90.6%. The majority of people were middle-aged or young, with 37.8% aged between 25 and 30, followed by 29.8% aged between 20 and 25 and 17.2% aged between 30 and 35.
(2) Environmental characteristics: As shown in Figure 6b, weather conditions for the third type of carsharing travel were fairly evenly distributed. Rainy, cloudy and sunny days accounted for 44.0%, 38.9% and 17.0%, respectively. The proportions of good air quality and mild pollution were 44.6% and 33.1%, respectively, followed by excellent air quality, accounting for 13.7%. In the third kind of carsharing travel, the environmental composition of carsharing journeys was consistent with the proportion of the overall environmental composition, but the number of journeys on rainy days was greater, indicating that some of the trips using this kind of carsharing travel were affected by bad weather conditions, such as rain, causing travellers to choose carsharing, which is comfortable and convenient.
(3) Behavioural characteristics: Figure 6c shows the temporal and spatial distribution of the third type of travel. Similar to the second kind of carsharing travel, the third kind of carsharing travel was distributed evenly over the week. The travel time was evenly distributed throughout the day, and the travel volume was high from 8:00 to 22:00 with a small peak at 10:00–12:00. The travel duration was relatively short, mainly 20–60 min, accounting for 92.4%. In terms of distance, the travel distance was mainly short and middle distance, with 10–30 km accounting for 78.1%. The overall average speed was high: 30–50 km/h accounting for 51.9%. The land use of the origin locations was mainly retail and residential, accounting for 77.1%, followed by commercial land, which covered 13.7%. The land use of destination locations were dominated by retail and commercial use, accounting for 75.1%.
4.4. Travel Characteristics of the Fourth Type
(1) Personal characteristics: As shown in Figure 7a, in the fourth type of carsharing travel, the proportion of males was much higher than females with males accounting for up to 90%. The majority of people were middle-aged or young with 84.8% aged between 20 and 35.
(2) Environmental characteristics: As shown in Figure 7b, weather conditions of the fourth kind of carsharing travel were fairly evenly distributed. Cloudy, rainy and sunny days accounted for 43.2%, 39.4% and 17.5%, respectively. The proportions of good air quality and mild pollution were 55.4% and 24.2%, respectively, followed by excellent air quality, accounting for 18.3%. In the fourth kind of carsharing travel, the environmental composition was consistent with the proportion of the overall environmental composition, indicating that the fourth type of carsharing travel was for inflexible trips, which were not changed by environmental changes and were not affected by the external environment.
(3) Behavioural characteristics: Figure 7c shows the temporal and spatial distribution of the fourth kind of travel. In terms of time, there was a fairly even distribution of travelling throughout the week. The time of day for travel was concentrated in the afternoon and evening from 14:00 to 20:00, accounting for 43.5%. The travel duration was longer, and the proportion of more than 140 min journeys was as high as 99.5%. In terms of distance, the journeys were mainly medium and long, with 79.9% from 30 to 70 km. The overall average speed was relatively low: 20–30 km/h accounted for 77.3%. The land use of origin locations were mainly residential, commercial and retail, accounting for 40.9%, 34.1% and 16.8%, respectively. The land use of destinations were mainly retail, commercial and residential, accounting for 39.2%, 31.3% and 19.6%, respectively. In the fourth kind of carsharing travel, considering both origin and destination locations, the proportions of retail and commercial land use were highest, which relates to the fact that the carsharing stations are mostly located in retail and commercial areas.
4.5. Summary
In conclusion, the first type of carsharing travel can be summarised as follows: In conditions of good weather and air quality, travellers started from residential areas at 10:00–12:00, 16:00–18:00 and 18:00–20:00 on Saturdays and Sundays. The travel duration was longer than 200 min, the travel distance was longer than 100 km and the travel speed was 40–50 km/h. Finally, travellers arrived at recreation areas. According to the environmental and behavioural characteristics, the first type of carsharing travel was long-distance, flexible travel, mainly for recreation and entertainment on weekends. Therefore, this kind of carsharing travel could be defined as long distance for leisure and entertainment (LDLE).
The second type of carsharing travel can be summarised as follows: Regardless of the weather and air quality conditions, travellers travelled from Monday to Friday, 8:00–22:00 (peak hours: 12:00–14:00 and 18:00–20:00) from business and commercial areas. The travel time was 40–120 min, the travel distance was 10–30 km and the travel speed was 20 to 30 km/h. Finally, travellers arrived at retail and commercial areas. With regard to the environmental and behavioural characteristics, the second type of carsharing travel was inflexible travel of short and medium distances, mainly for weekday commuting and business. Therefore, this type of carsharing travel could be defined as short and medium distances for business commuting (MSDBC).
The third type of carsharing travel can be summarised as follows: Affected by rainy weather, travellers travelled from commercial and residential areas at 8:00–22:00 (peak time was 10:00–12:00) from Monday to Wednesday. The travel duration was 20–60 min, the travel distance was 10–30 km and the travel speed was 30–50 km/h. Finally, travellers arrived at commercial and residential areas. With regard to the environmental and behavioural characteristics, the third kind of carsharing travel was diversified short and medium distance travel for commuting and leisure shopping. Therefore, this kind of carsharing travel could be defined as a mixed category of short and medium distances for business and residence (MSDBR).
The fourth kind of carsharing travel can be summarised as follows: Regardless of weather and air quality, travellers travelled from Monday to Tuesday at 14:00 (14:00–16:00 was the peak) from residential, retail and commercial areas. The travel duration was up to 140 min, the distance was 30–70 km and the travel speed was 20–30 km/h. The destinations of these travellers were residential, retail and commercial areas. With regard to the environmental and behavioural characteristics, the fourth kind of carsharing travel was weekday travel, primarily on Mondays and Tuesdays, which was mainly long-distance commercial travel. Therefore, this type of carsharing travel could be defined as a mixed category of medium and long distances for business and residence (LDBR).
To sum up, the four types of carsharing travel can be divided into long distance for leisure and entertainment, medium and short distances for business and commuting, a mixed category of medium and short distances for business and residence, and a mixed category of long distance for business and residence. The four types of carsharing travel characteristics are summarised in Table 5.
In previous research, long-term carsharing users’ fastigium of single-use distance was located in the range 1–70 km, which contained more than 80% of orders [41], which is consistent with the research results of this paper. Meanwhile, scholars have found that the higher frequency carsharing user groups prefer to use carsharing on weekdays. The lower frequency carsharing user groups are more likely to use carsharing over the weekend [41]. Similarly, in this paper, carsharing travellers were also divided into travelling on workdays and weekends (LDLE: weekends; MSDBC, MSDBR and LDBR: workdays). However, some studies suggest that the gender ratio indicates that women are the dominant regular customers of the Communauto carsharing service [42]. In this study, men were the main users of carsharing in Beijing. Maybe difference results are related to the gender structure of drivers in different cities. In general, the conclusions of this study are similar to previous studies. But there were also some differences.
4.6. Discussion
Each travel mode has its own attributes, advantages and disadvantages when meeting traffic demand. Travel mode attributes mainly refer to the characteristics of travel modes when meeting the travel needs of residents such as cost, time spent, controllability of the travel, and travellers’ perceptions (comfort, privacy, etc.). These attributes constitute the elements of competition among travel modes when meeting travel needs. On the premise that there are several travel modes to choose from for a travel, travellers will choose the corresponding ideal travel mode according to their own needs.
To analyse the relationships among the four types of carsharing travel characteristics and regular urban travel and to compare their differences, this paper took travel distance and travel duration as examples, which are easy to collect and are objective. The data on average travel distance and duration of regular urban travel came from the Beijing Transport Institute [43].
Figure 8 takes the travel distance as the x-axis and the travel duration as the y-axis. If different travel modes are in the same place, it means that they have a competitive relationship. As shown in Figure 8, LDLE carsharing travel was competitive with taxis and traditional car rental in terms of travel duration and distance; MSDBC carsharing travel was competitive with subways, buses and private cars in terms of travel duration and distance; MSDBR carsharing travel was competitive with private cars in terms of travel distance. However, the competition between bicycles and the four types of carsharing was weak in terms of travel duration and distance; the competition between LDBR carsharing travel and regular urban travel was weak. The analysis shows that there was a competitive relationship between carsharing and regular urban travel, but there was also a relationship of complementary traffic composition. Previous studies have also shown that for a large number of customers, public transport and carsharing complement each other [44]. Thus, it is important for the sustainable development of urban transportation systems to reasonably guide the development of carsharing and optimise the structure of urban transportation systems.
Through the research of this paper, the typical travel characteristics of carsharing were clarified. These results can be applied to promote the scientific planning and design of carsharing and to optimise the structure of urban transportation systems. For example, from the perspective of energy conservation and environmental protection, MSDBC and MSDBR carsharing travel should not be encouraged, because they are competing with public transport. LDBR carsharing travel should be encouraged, because it complements the urban transportation structure. Moreover, in some special cases, such as restricted driving conditions and other special types, carsharing can be a good alternative travel needs [45,46].
5. Conclusions
Determining what kinds of travellers are using carsharing is significant for the future development of carsharing. Thus, in this study, a selective ensemble learning model was built to analyse the typical travel characteristics of carsharing. After defining the typical influencing factors of carsharing travel, personal characteristics, environmental characteristics and behavioural characteristics were obtained by integrating order data, GPS data and station information. Based on the establishment of a consolidated view of carsharing, different types of carsharing travel characteristics were distinguished using selective ensemble learning. Lastly, all kinds of carsharing travel were described in detail. It was identified with this research that carsharing travel can be divided into four types: long-distance for leisure and entertainment, medium and short distances for business and commuting, a mixed category of medium and short distances for business and residence, and a mixed category of long distance for business and residence. Moreover, there is a competitive relationship between carsharing and regular urban travel, but there was also a relationship of complementary traffic composition. It is important for the sustainable development of urban transportation systems to reasonably guide the development of carsharing and to optimise the structure of urban transportation systems.
The research findings can lay a solid theoretical foundation for perfecting the theory of carsharing travel. It can also provide a theoretical reference and a practical basis for precise planning and design and scientific operation of carsharing. However, the limitations in this study are that the influencing factors studied were limited, and only 11 travel characteristics were studied. For example, personal characteristics only included sex and age. Actually, personal characteristics are quite complex and also included occupation, income, family structure, etc. Especially, it is demonstrated that single drivers and professional drivers have different travel characteristics [47]. In future studies, more personal, environmental and behavioural characteristics could be taken into consideration such as occupation and traffic accident. Furthermore, the influencing factors and competition process of carsharing and regular urban travel can be further studied.
Author Contributions
Conceptualisation, W.L.; methodology, W.L.; software, W.L.; validation, W.L., Y.W. and P.J.; formal analysis, W.L., Z.W., P.Z. and Y.W.; investigation, W.L.; resources, W.L.; data curation, Z.W., P.Z. and Y.W.; writing—original draft preparation, W.L.; writing—review and editing, W.L., Z.W., P.Z., Y.W. and P.J.; visualisation, Y.W. and Z.W.; supervision, W.L.; funding acquisition, W.L. All authors have read and agreed to the published version of the manuscript.
Funding
This research was funded by a project funded by the China Postdoctoral Science Foundation (No. 2021M690331), the Youth Foundation of Social Sciences and Humanity, the China Ministry of Education (No. 21YJC630094), the Beijing Postdoctoral Research Foundation (No. 2020-ZZ-089), the Research Capacity Enhancement Program for Young Teachers of Beijing University of Civil Engineering and Architecture (No. X21069), National Natural Science Foundation of China (No. 52172301) and Beijing Social Science Fund (No. 21GLA010).
Institutional Review Board Statement
Not applicable.
Informed Consent Statement
Informed consent was obtained from all subjects involved in the study.
Data Availability Statement
The data presented in this study are available upon request from the corresponding author.
Conflicts of Interest
The authors declare no conflict of interest.
References
- Bocken, N.; Jonca, A.; Södergren, K.; Palm, J. Emergence of Carsharing Business Models and Sustainability Impacts in Swedish Cities. Sustainability 2020, 12, 1594. [Google Scholar] [CrossRef] [Green Version]
- Luo, W.; Sun, L.S.; Shi, M.Z.; Yao, L.; Rong, J. An investigation into electric vehicle timeshare rental schemes in Beijing, China. Proc. Inst. Civ. Eng.-Eng. Sustain. 2020, 173, 73–83. [Google Scholar] [CrossRef]
- Ferrero, F.; Perboli, G.; Rosano, M.; Vesco, A. Car-sharing services: An annotated review Sustain. Sustain. Cities Soc. 2018, 37, 501–518. [Google Scholar] [CrossRef]
- Machado, C.A.S.; de Salles Hue, N.P.M.; Berssaneti, F.T.; Quintanilha, J.A. An overview of shared mobility. Sustainability 2018, 10, 4342. [Google Scholar] [CrossRef] [Green Version]
- Esfandabadi, Z.S.; Ravina, M.; Diana, M.; Zanetti, M.C. Conceptualizing environmental effects of carsharing services: A system thinking approach. Sci. Total Environ. 2020, 745, 141169. [Google Scholar] [CrossRef]
- Kostic, B.; Loft, M.P.; Rodrigues, F.; Borysov, S.S. Deep survival modelling for shared mobility. Transp. Res. Part C Emerg. Technol. 2021, 128, 103213. [Google Scholar] [CrossRef]
- Li, Y.; Davis, C.; Lukszo, Z.; Weijnen, M. Electric vehicle charging in China’s power system: Energy, economic and environmental trade-offs and policy implications. Appl. Energy 2016, 173, 535–554. [Google Scholar] [CrossRef] [Green Version]
- Becker, H.; Balac, M.; Ciari, F.; Axhausen, K.W. Assessing the welfare impacts of shared mobility and mobility as a service (MaaS). Transp. Res. Part A Policy Pract. 2020, 131, 228–243. [Google Scholar] [CrossRef]
- Cervero, R.; Tsai, Y. City carshare in San Francisco, California: Second-year travel demand and car ownership impacts. Transp. Res. Rec. 2004, 1887, 117–127. [Google Scholar] [CrossRef]
- Firnkorn, J.; Müller, M. Free-floating electric carsharing-fleets in smart cities: The dawning of a post-private car era in urban environments? Environ. Sci. Policy 2015, 45, 30–40. [Google Scholar] [CrossRef]
- Alonso, F.; Faus, M.; Esteban, C.; Useche, S. Is there a predisposition towards the use of new technologies within the traffic field of emerging countries? The case of the Dominican Republic. Electronics 2021, 10, 1208. [Google Scholar] [CrossRef]
- Baumgarte, F.; Brandt, T.; Keller, R.; Röhrich, F.; Schmidt, L. You’ll never share alone: Analyzing carsharing user group behaviour. Transp. Res. Part D Transp. Environ. 2021, 93, 102754. [Google Scholar] [CrossRef]
- Tesoriere, G.; Campisi, T. The benefit of engaging the “Crowd” encouraging a bottom-up approach for shared mobility rating. In Proceedings of the International Conference on Computational Science and Its Applications, Cagliari, Italy, 1–4 July 2020; Springer: Cham, Switzerland, 2020; pp. 836–850. [Google Scholar]
- Becker, H.; Ciari, F.; Axhausen, K.W. Comparing car-sharing schemes in Switzerland: User groups and usage patterns. Transp. Res. Part A Policy Pract. 2017, 97, 17–29. [Google Scholar] [CrossRef] [Green Version]
- Zhou, F.; Zheng, Z.; Whitehead, J.; Washington, S.; Perrons, R.; Page, L. Preference heterogeneity in mode choice for car-sharing and shared automated vehicles. Transp. Res. Part A Policy Pract. 2020, 132, 633–650. [Google Scholar] [CrossRef]
- Shaheen, S.; Sperling, D.; Wagner, C. Carsharing in Europe and North American: Past, present, and future. Transp. Q. 1998, 52, 35–52. [Google Scholar]
- Turoń, K.; Kubik, A.; Chen, F. Electric shared mobility services during the pandemic: Modeling aspects of transportation. Energies 2021, 14, 2622. [Google Scholar] [CrossRef]
- Turoń, K.; Kubik, A.; Chen, F. Operational aspects of electric vehicles from car-sharing systems. Energies 2019, 12, 4614. [Google Scholar] [CrossRef] [Green Version]
- Turoń, K. Social barriers and transportation social exclusion issues in creating sustainable car-sharing systems. Entrep. Sustain. Issues 2021, 9, 10–22. [Google Scholar] [CrossRef]
- Seik, F.T. Vehicle ownership restraints and car sharing in Singapore. Habitat Int. 2000, 24, 75–90. [Google Scholar] [CrossRef]
- Shaheen, S.A.; Schwartz, A.; Wipyewski, K. Policy considerations for carsharing and station cars: Monitoring growth, trends, and overall impacts. Transp. Res. Rec. 2004, 1887, 128–136. [Google Scholar] [CrossRef] [Green Version]
- Millard-Ball, A. Car-sharing: Where and how it succeeds. In Proceedings of the Transportation Research Board, Washington, DC, USA, 9–13 January 2005. [Google Scholar]
- Zhou, J. An analyzed university employee car-sharers in Los Angeles. Transp. Res. Part D Transp. Environ. 2012, 17, 588–591. [Google Scholar] [CrossRef]
- Efthymiou, D.; Antoniou, C.; Waddell, P. Factors affecting the adoption of vehicle sharing systems by young drivers. Transp. Policy 2013, 29, 64–73. [Google Scholar] [CrossRef]
- Le, V.S.; Zolfaghari, A.; Polak, J. Carsharing: Evolution, challenges and opportunitie. Sci. Advis. Group Rep. 2014, 22, 218–229. [Google Scholar]
- Kim, D.; Ko, J.; Park, Y. Factors affecting electric vehicle sharing program participants’ attitudes about car ownership and program participation. Transp. Res. Part D Transp. Environ. 2015, 36, 96–106. [Google Scholar] [CrossRef]
- Prieto, M.; Baltas, G.; Stan, V. Car sharing adoption intention in urban areas: What are the key sociodemographic drivers? Transp. Res. Part A Policy Pract. 2017, 101, 218–227. [Google Scholar] [CrossRef]
- Schmöller, S.; Bogenberger, K. Analyzing external factors on the spatial and temporal demand of car sharing systems. Procedia-Soc. Behav. Sci. 2014, 111, 8–17. [Google Scholar] [CrossRef] [Green Version]
- Schmöller, S.; Weikl, S.; Müller, J.; Bogenberger, K. Empirical analysis of free-floating carsharing usage: The Munich and Berlin case. Transp. Res. Part C Emerg. Technol. 2015, 56, 34–51. [Google Scholar] [CrossRef]
- Yoon, T.; Cherry, C.R.; Jones, L.R. One-way and round-trip carsharing: A stated preference experiment in Beijing. Transp. Res. Part D Transp. Environ. 2017, 53, 102–114. [Google Scholar] [CrossRef] [Green Version]
- Wielinski, G.; Trépanier, M.; Morency, C. Electric and hybrid car use in a free-floating carsharing system. Int. J. Sustain. Transp. 2017, 11, 161–169. [Google Scholar] [CrossRef]
- Morency, C.; Trepanier, M.; Agard, B.; Martin, B.; Quashie, J. Car sharing system: What transaction datasets reveal on users’ behaviors. In Proceedings of the IEEE Intelligent Transportation Systems Conference, Bellevue, WA, USA, 30 September–3 October 2007; pp. 284–289. [Google Scholar]
- Costain, C.; Ardron, C.; Habib, K.N. Synopsis of users’ behaviour of a carsharing program: A case study in Toronto. Transp. Res. Part A Policy Pract. 2012, 46, 421–434. [Google Scholar] [CrossRef]
- Wagner, S.; Brandt, T.; Neumann, D. In free float: Developing business analytics support for carsharing providers. Omega 2016, 59, 4–14. [Google Scholar] [CrossRef]
- Bates, J.M.; Granger, C.W.J. The combination of forecasts. J. Oper. Res. Soc. 1969, 20, 451–468. [Google Scholar] [CrossRef]
- Du, H.; Zhang, Y. Network anomaly detection based on selective ensemble algorithm. J. Supercomput. 2020, 77, 2875–2896. [Google Scholar] [CrossRef]
- Sun, B.; Wang, J.D.; Chen, H.Y.; Wang, Y.T. Diversity measures in ensemble learning. Control Decis. 2014, 3, 385–395. [Google Scholar]
- Bezdek, J.C. Pattern Recognition with Fuzzy Objective Function Algorithms; Springer: Berlin, Germany, 2013. [Google Scholar]
- Pan, J.; Wang, R.Q. Customer segmentation based on selective clustering ensemble. Comput. Integr. Manuf. Syst. 2015, 21, 1662–1668. [Google Scholar]
- Amelio, A.; Pizzuti, C. Correction for Closeness: Adjusting normalized mutual information measure for clustering comparison. Comput. Intell. 2017, 33, 579–601. [Google Scholar] [CrossRef]
- Hui, Y.; Wang, W.; Ding, M.; Liu, Y. Behavior patterns of long-term car-sharing users in China. Transp. Res. Procedia 2017, 25, 4666–4682. [Google Scholar] [CrossRef]
- Kashani, H.B.; Trépanier, M. A typology of carsharing customers in Montreal based on large-scale behavioural dataset. Cirrelt 2018, 16, 1–34. [Google Scholar]
- Beijing Transport Institute. 2017 Beijing Transport Development Annual Report. 2017. Available online: https://www.bjtrc.org.cn/List/index/cid/7.html (accessed on 1 July 2017).
- Ceccato, R.; Diana, M. Substitution and complementarity patterns between traditional transport means and car sharing: A person and trip level analysis. Transportation 2021, 48, 1523–1540. [Google Scholar] [CrossRef]
- Alonso, F.; Esteban, C.; Sanmartín, J.; Useche, S.A. Reported prevalence of health conditions that affect drivers. Cogent Med. 2017, 4, 1303920. [Google Scholar] [CrossRef] [Green Version]
- Alonso, F.; Esteban, C.; Sanmartín, J.; Useche, S.A. Consistency between the subjective perception of feeling indisposed, the decision to drive and driving performance. Sci. J. Public Health 2016, 4, 482–488. [Google Scholar] [CrossRef] [Green Version]
- Llamazares, J.; Useche, S.A.; Montoro, L.; Alonso, F. Commuting accidents of spanish professional drivers: When occupational risk exceeds the workplace. Int. J. Occup. Saf. Ergon. 2019, 27, 754–762. [Google Scholar] [CrossRef] [PubMed]
Figure 1.
Research framework.

Figure 2.
Carsharing travel characteristics processing flow: (a) personal characteristics; (b) environmental characteristics; (c) behavioural characteristics.
Figure 2.
Carsharing travel characteristics processing flow: (a) personal characteristics; (b) environmental characteristics; (c) behavioural characteristics.

Figure 3.
Clustering precision of the sample data set.

Figure 4.
The first type of carsharing travel: (a) personal characteristics for the first type of carsharing travel; (b) environment characteristics for the first type of carsharing travel; (c) behavioural parameters for the first type of carsharing travel.
Figure 4.
The first type of carsharing travel: (a) personal characteristics for the first type of carsharing travel; (b) environment characteristics for the first type of carsharing travel; (c) behavioural parameters for the first type of carsharing travel.


Figure 5.
Second type of carsharing travel: (a) personal characteristics for the second type of carsharing travel; (b) environmental characteristics for the second type of carsharing travel; (c) behavioural parameters for the second type of carsharing travel.
Figure 5.
Second type of carsharing travel: (a) personal characteristics for the second type of carsharing travel; (b) environmental characteristics for the second type of carsharing travel; (c) behavioural parameters for the second type of carsharing travel.


Figure 6.
Third type of carsharing travel: (a) personal characteristics for the third type of carsharing travel; (b) environmental characteristics for the third type of carsharing travel; (c) behavioural parameters for the third type of carsharing travel.
Figure 6.
Third type of carsharing travel: (a) personal characteristics for the third type of carsharing travel; (b) environmental characteristics for the third type of carsharing travel; (c) behavioural parameters for the third type of carsharing travel.


Figure 7.
Fourth type of carsharing travel: (a) personal characteristics for the fourth type of carsharing travel; (b) environmental characteristics for the fourth type of carsharing travel; (c) behavioural parameters for the fourth type of carsharing travel.
Figure 7.
Fourth type of carsharing travel: (a) personal characteristics for the fourth type of carsharing travel; (b) environmental characteristics for the fourth type of carsharing travel; (c) behavioural parameters for the fourth type of carsharing travel.


Figure 8.
Comparison of carsharing travel with regular urban travel.


Table 1.
Major factors in this study.
| Characteristic | Factor | Range |
|---|---|---|
| Personal characteristics | Sex | (Male, Female) |
| Age | (18, 100) | |
| Environmental characteristics | Weather conditions | (Sunny, Rainy, Cloudy, Snowy) |
| Air quality | (Heavy pollution, Severe pollution, Medium pollution, Mild pollution, Good, Excellent) | |
| Behavioural characteristics | Week | (Monday, …, Sunday) |
| Hour | (1, 24) | |
| Travel duration | (0, 500) | |
| Travel distance | (0, 500) | |
| Travel speed | (0, 300) | |
| Land usage of origin | (Public service, Residence, Commerce, Shopping, Recreation, Education) | |
| Land usage of destination | (Public service, Residence, Commerce, Shopping, Recreation, Education) |
Table 2.
Partial user order data.
| Origin Station ID | Reservation Time | Age | Sex | Time of Door Open | User ID | Vehicle ID | Destination Station ID | Time of Door Close |
|---|---|---|---|---|---|---|---|---|
| 101 | 5 June 2016 18:58:04 | 31 | m | 5 June 2016 19:08:50 | 44749 | 288 | 269 | 5 June 2016 20:01:05 |
| 140 | 5 June 2016 18:59:43 | 26 | m | 5 June 2016 19:13:17 | 39345 | 125 | 140 | 5 June 2016 20:40:22 |
| 102 | 5 June 2016 19:00:38 | 22 | m | 5 June 2016 19:04:10 | 82816 | 137 | 102 | 5 June 2016 19:25:14 |
| 27 | 5 June 2016 19:01:12 | 21 | m | 5 June 2016 19:01:16 | 56174 | 313 | 303 | 5 June 2016 19:26:16 |
| 61 | 5 June 2016 19:04:14 | 31 | m | 5 June 2016 19:22:53 | 9851 | 103 | 26 | 5 June 2016 20:27:03 |
| 55 | 5 June 2016 19:04:25 | 23 | m | 5 June 2016 19:08:01 | 96675 | 207 | 93 | 5 June 2016 19:42:06 |
| 32 | 5 June 2016 19:05:12 | 28 | m | 5 June 2016 19:05:20 | 74329 | 147 | 32 | 5 June 2016 19:57:07 |
| 285 | 5 June 2016 19:05:18 | 20 | m | 5 June 2016 19:22:24 | 95001 | 21 | 284 | 5 June 2016 20:31:11 |
| 104 | 5 June 2016 19:05:30 | 25 | m | 5 June 2016 19:27:42 | 71040 | 82 | 53 | 5 June 2016 20:39:22 |
| 304 | 5 June 2016 19:09:04 | 21 | m | 5 June 2016 19:09:13 | 76670 | 129 | 304 | 5 June 2016 20:07:48 |
Table 3.
Partial GPS data.
| Code | Time | Vehicle Identification Number 1 | Longitude | Latitude | Charging Status | Electric Quantity | Total Mileage |
|---|---|---|---|---|---|---|---|
| 62522830 | 7 June 2016 03:18:32 | ***************** | 116.501 | 39.9945 | 0 | 46 | 48,680 |
| 62522918 | 7 June 2016 03:18:42 | ***************** | 116.501 | 39.9945 | 0 | 46.4 | 48,680 |
| 62523014 | 7 June 2016 03:18:52 | ***************** | 116.501 | 39.9945 | 0 | 46.4 | 48,680 |
| 62523108 | 7 June 2016 03:18:02 | ***************** | 116.501 | 39.9945 | 0 | 46.4 | 48,680 |
| 62523208 | 7 June 2016 03:18:12 | ***************** | 116.501 | 39.9945 | 0 | 46.4 | 48,680 |
| 62523287 | 7 June 2016 03:18:22 | ***************** | 116.501 | 39.9945 | 0 | 46.4 | 48,680 |
| 62523373 | 7 June 2016 03:18:32 | ***************** | 116.501 | 39.9945 | 0 | 46.4 | 48,680 |
| 62523449 | 7 June 2016 03:18:42 | ***************** | 116.501 | 39.9945 | 0 | 46.4 | 48,680 |
| 62523526 | 7 June 2016 03:18:52 | ***************** | 116.501 | 39.9944 | 0 | 46.4 | 48,680 |
| 62523614 | 7 June 2016 03:18:02 | ***************** | 116.501 | 39.9944 | 0 | 46.4 | 48,680 |
1 Vehicle identification numbers were anonymised to protect privacy in this paper.
Table 4.
Partial station information.
| ID | Station Name | Detailed Station Address |
|---|---|---|
| 1 | SOHO Modern Park Building | No. 88, Jianguo Road, Chaoyang District |
| 2 | Yangguang 100 underground parking | No. 2 Guanghua Road |
| 3 | Guozong Hospital of Traditional Chinese Medicine Ground Parking | Guangshun North Street, Wangjing West Garden District 2, Jingdian Business Complex Building |
Table 5.
Summary of carsharing travel characteristics.
| Characteristics | Long Distance for Leisure and Entertainment (LDLE) | Medium and Short Distances for Business and Commuting (MSDBC) | A Mixed Category of Medium and Short Distances for Business and Residence (MSDBR) | A Mixed Category of Long Distance for Business and Residence (LDBR) |
|---|---|---|---|---|
| Sex | Male | Male | Male | Male |
| Age | 30–35 | 25–30 | 25–30 | 25–30 |
| Weather | Sunny | Cloudy, rainy | Cloudy, sunny | Cloudy, rainy |
| Air quality | Excellent, good | Good, mild pollution | Good, mild pollution | Good, mild pollution |
| Week | Saturday, Sunday | Workday | Monday–Wednesday | Monday, Tuesday |
| Hour | 10–12 (Travel) | 8–22 (Travel) | 8–22 (Travel) | 14–20 (Travel) |
| 16–18 (Travel) | 12–14 (Peak) | 10–12 (Peak) | 14–16 (Peak) | |
| 18–20 (Travel) | 18–20 (Peak) | |||
| Travel duration (min) | >200 | 40–120 | 20–60 | >140 |
| Travel distance (km) | >100 | 10–30 | 10–30 | 30–70 |
| Travel speed (km/h) | 40–50 | 20–30 | 30–50 | 20–30 |
| Land use of origins | Residence | Commerce, shopping | Shopping, residence | Residence, commerce, shopping |
| Land use of destinations | Recreation | Commerce, shopping | Shopping, residence | Residence, commerce, shopping |
Publisher’s Note: MDPI stays neutral with regard to jurisdictional claims in published maps and institutional affiliations. |
© 2022 by the authors. Licensee MDPI, Basel, Switzerland. This article is an open access article distributed under the terms and conditions of the Creative Commons Attribution (CC BY) license (https://creativecommons.org/licenses/by/4.0/).
Share and Cite
MDPI and ACS Style
Luo, W.; Wang, Y.; Jiao, P.; Wang, Z.; Zhao, P. What Kind of Travellers Are Using Carsharing in Beijing? A Study Based on Selective Ensemble Learning. Sustainability 2022, 14, 540. https://0-doi-org.brum.beds.ac.uk/10.3390/su14010540
AMA Style
Luo W, Wang Y, Jiao P, Wang Z, Zhao P. What Kind of Travellers Are Using Carsharing in Beijing? A Study Based on Selective Ensemble Learning. Sustainability. 2022; 14(1):540. https://0-doi-org.brum.beds.ac.uk/10.3390/su14010540
Chicago/Turabian StyleLuo, Wei, Yi Wang, Pengpeng Jiao, Zehao Wang, and Pengfei Zhao. 2022. "What Kind of Travellers Are Using Carsharing in Beijing? A Study Based on Selective Ensemble Learning" Sustainability 14, no. 1: 540. https://0-doi-org.brum.beds.ac.uk/10.3390/su14010540
Note that from the first issue of 2016, this journal uses article numbers instead of page numbers. See further details here.