Article

Integrated Carbon Footprint and Economic Performance of Five Types of Dominant Cropping Systems in China’s Semiarid Zone

1
State Key Laboratory of Grassland Agro-Ecosystems, Lanzhou University, Lanzhou 730020, China
2
College of Pastoral Agriculture Science and Technology, Lanzhou University, Lanzhou 730020, China
3
College of Earth and Environmental Sciences, Lanzhou University, Lanzhou 730020, China
*
Author to whom correspondence should be addressed.
Sustainability 2022, 14(10), 5844; https://0-doi-org.brum.beds.ac.uk/10.3390/su14105844
Submission received: 10 April 2022 / Revised: 3 May 2022 / Accepted: 9 May 2022 / Published: 11 May 2022
(This article belongs to the Special Issue Carbon Footprint and Sustainability Assessment)

Abstract

:
Crop production requires large areas of land and makes an important contribution to greenhouse gas emissions. Cleaner production of all crop types could be of great significance to realizing carbon neutrality as soon as possible. The present study adopted life cycle assessment (LCA) combined with the profit accounting method of input-output to compare the differences in greenhouse gas emissions in the entire life cycle of apple (Malus pumila Mill.), grain maize (Zea mays L.), wheat (Triticum aestivum L.), silage maize (Zea mays L.), and alfalfa (Medicago sativa Linn.) production in eastern Gansu Province with three functional units, including per ha of land, per ton of product, and per 10,000 yuan of output value. The results showed that apple had the largest carbon footprint per ha. Wheat had the largest carbon footprint per ton of product and per 10,000 yuan output. The results of LCA inventory sensitivity analysis showed that the main sources of greenhouse gas emissions for all crops were the production process of agricultural materials such as chemical fertilizer, machinery, and agricultural film. In particular, the excessive input of chemical fertilizer was the driving factor resulting in greenhouse gas emissions. Based on the study results, this paper also puts forward certain suggestions on the future land use of the cropping systems in the study area.

1. Introduction

Mitigating greenhouse gas emissions has become an important cornerstone issue that can be used to guide social and economic development as well as the lifestyle of individuals [1,2]. China has also proposed striving to achieve carbon neutrality by 2060 [3], which implies minimizing greenhouse gas release and fixing additional carbon dioxide so that the release of greenhouse gases emitted into the atmosphere globally will not result in a net increase of atmospheric carbon. According to the data from the United Nations Food and Agriculture Organization, the modern food production system relies heavily on fossil fuels and requires about 30% of the world’s existing energy production, and accounts for about 30% of the world’s total anthropogenic greenhouse gas emissions [4]. Since the 1960s, increases in global crop production have been associated with an expansion of land in crop production, increased irrigation of cropland, and a greater use of chemical fertilizers [5], along with a reliance on chemical pesticides [6,7,8,9]. However, these factors have been linked to negative impacts on the environment. Therefore, the cropping systems must employ low-carbon production methods in order to achieve carbon neutrality for the whole society [10].
In order to deal with the greenhouse effect on a global scale, the concept of a carbon footprint (CF) has been proposed as an essential environmental management tool [11]. Past studies on greenhouse gas emissions from cropland have employed CF as the first tool used to inventory and calculate the total amount of greenhouse gas emissions to realize the management of those emissions [12,13]. However, knowing how to practically guide the production behavior of farmers is difficult because deriving economic benefit is the main driving force that encourages farmers to engage in agricultural production [14,15], while farmers rarely consider the environmental impacts of their actions. Current studies on the CF of agricultural products generally only focus on the investigation of the ecological benefits of crop production and few studies have combined this with economic analysis, resulting in mitigation measures that are often difficult to apply in practice [16,17]. Hence, the research on the combination of economic performance and CF can not only guide the abatement of greenhouse gas production but also ensure the economic benefits of farmers [18,19].
Eastern Gansu Province serves as one of the main crop production areas in China and is located in the transition zone between grassland pastoral and farming areas on the Loess Plateau. The environment here is fragile and sensitive with the features of steep landscape, erosion-prone soil, and high-intensity summer rainstorms; the region has become one of the most severely eroded areas in the world mainly due to agricultural development [20,21]. In addition, undergoing climatic changes driven by increasing incidences of extreme weather events and global warming, the rational consumption of resources and the improvement of production efficiency are an urgent need. To ensure a reasonable ecological carrying capacity in the study area, adaptation of the cropping systems is one of the most important aspects of sustainable agricultural systems in the region [22,23].These conditions provide an excellent case for carrying out this study, which has the following main objectives. (1) Calculation of the status of greenhouse gas emissions in the entire life cycle of typical crops which dominate cropland in the study area. Through contribution analysis, segments of agricultural production accounting for a large proportion of total emissions are identified and mitigation measures designed to result in cleaner production activities are explored. (2) By combining a comprehensive analysis of the efficiency of greenhouse gas emissions with economic benefits, crops with good profit opportunities and low greenhouse gas emissions are finally selected to provide a reference for the future land use planning in the study area.

2. Methods and Data

2.1. Study Area and Crop Types

2.1.1. Study Area

The study was conducted in the cities of Pingliang and Qingyang located in eastern Gansu Province in northwest China (Figure 1), which includes 14 counties with an approximate area of 3.84 × 10⁴ km2. This area is known as the transition ecotone of the grassland-cropland ecosystem in China. The most important land cover and land use types are grassland, cropland, and woodland. Cropland and woodland constitute the dominant land use and land cover types in the southeastern region, while the northwestern region is dominated by grassland. The climate of most of the land features a typical semiarid zone with annual rainfall of around 400–600 mm and annual temperature fluctuating between 7.5 and 11.4 °C. Rainfall has been identified as a crucial factor affecting yield of crops; however, precipitation often experiences great changes from year to year, which leads to a large range of variation in outputs of rainfed cropping systems [24].

2.1.2. Crops in the Study

Statistical data showed that wheat, grain maize, apple, silage maize, and alfalfa are the five dominant crop types with large planting areas in the study area, taking up 74.83% of the cropland use area [25]. Wheat and grain maize are cereal crops, mainly used for human consumption and livestock feedstuff. Apple has the largest planting area among fruits for sale in the region. Silage maize and alfalfa are forage crops, which are used to feed livestock. Therefore, this study selected these five types of crops as the research objects.

2.2. Methods

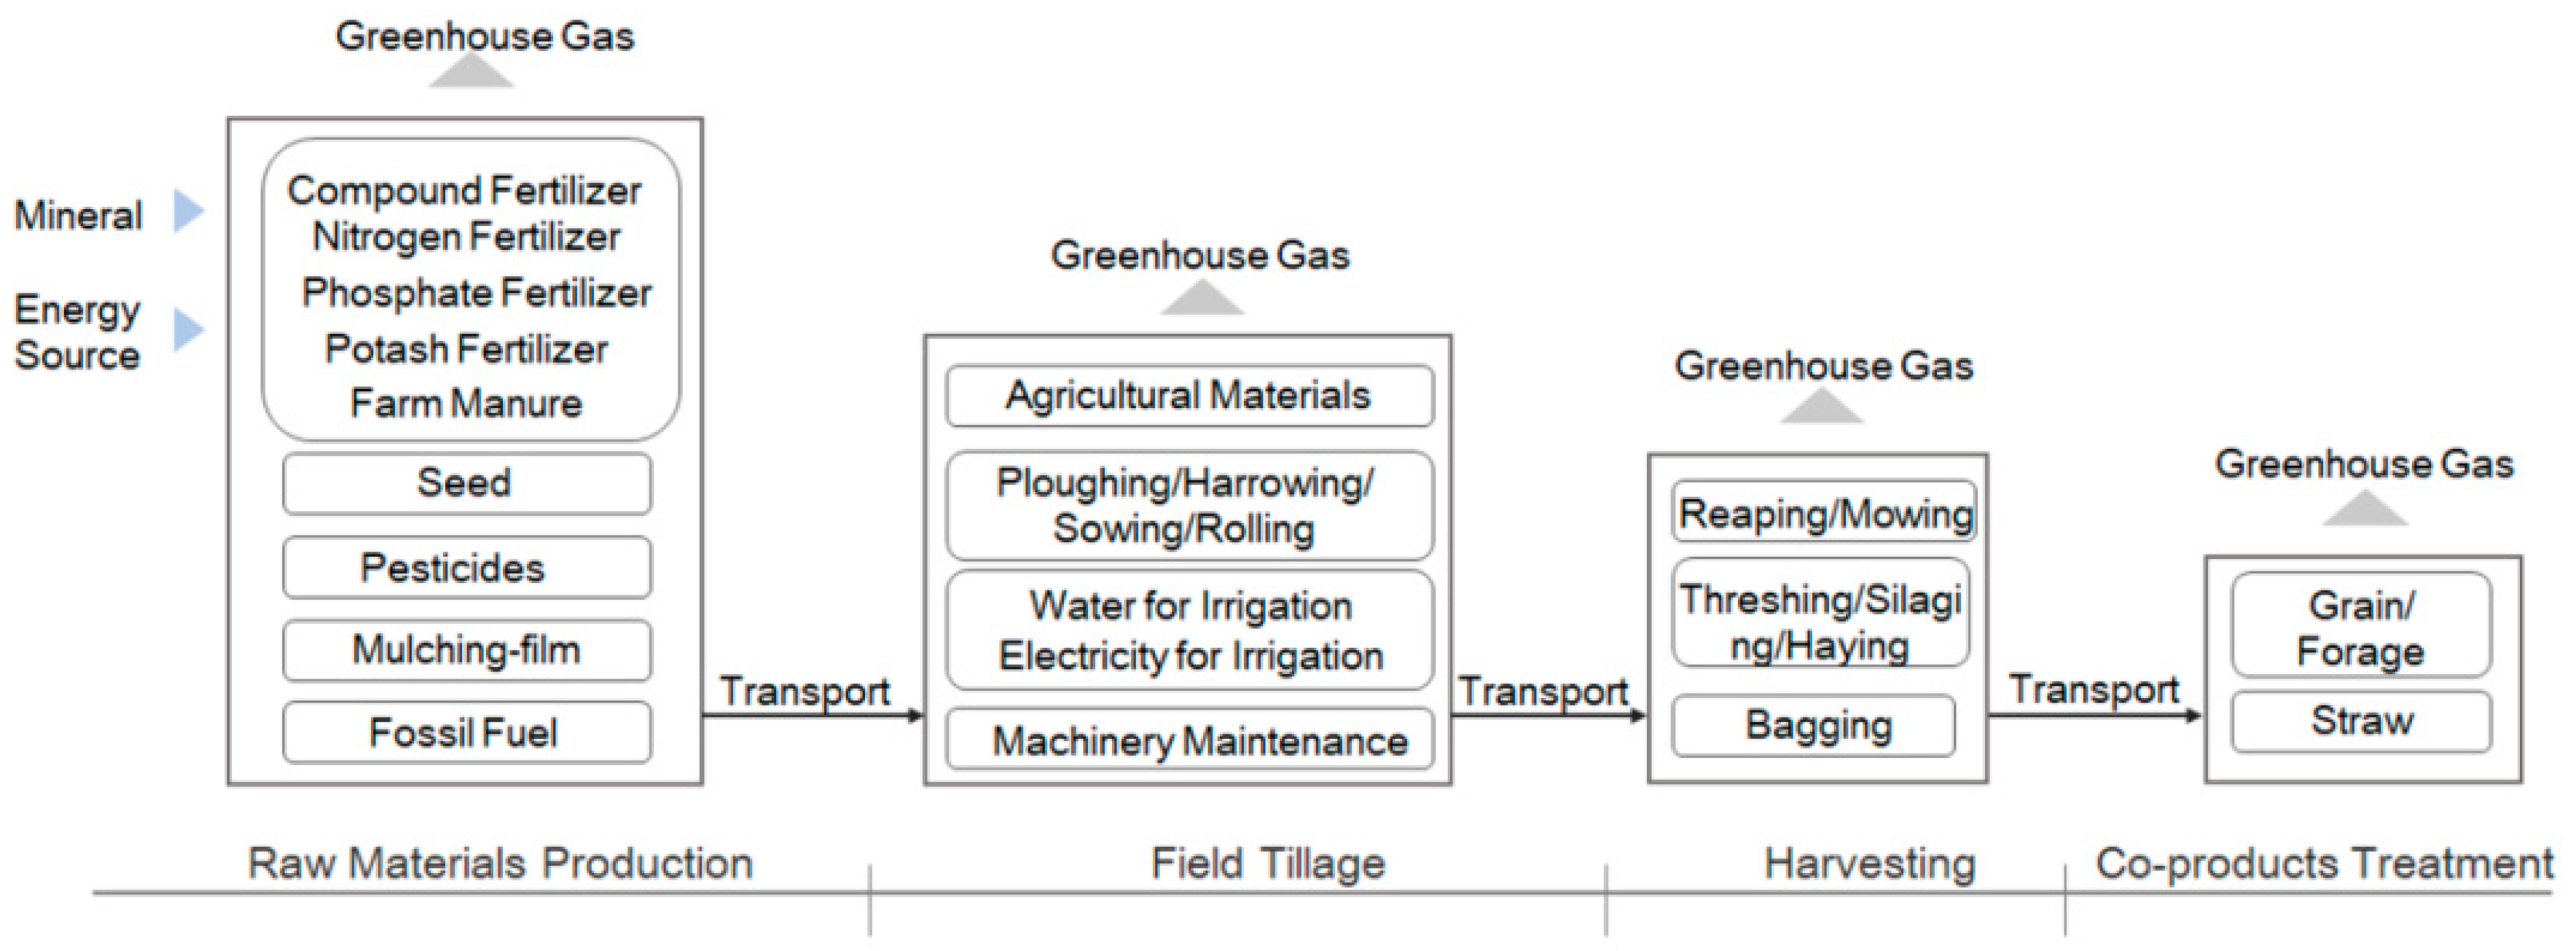
2.2.1. Carbon Footprint Accounting

This study adopted the life cycle assessment (LCA) method to calculate greenhouse gas emissions in the entire life cycle of crop production. Life cycle assessment is widely used to assess the environmental impacts of a product or service throughout its life cycle from cradle to grave [26]. This type of assessment can avoid the transfer of environmental impacts between different processes and different regions [27]. In addition, standardized by International Organization for Standardization, LCA is a research method widely recognized in China and worldwide that is used to quantitatively study climate change and evaluate the intensity of carbon release into the atmosphere [28,29,30]. Therefore, LCA has been extensively adopted to assess CF from cropland cultivation in order to identify the main segments of the agricultural economy that produces greenhouse gases and to carry out targeted improvements [31].
  • System boundary
Based on the production segments of cropping systems in the study area, the system boundary of carbon footprint analysis was from cradle to farm gate, and included four main subsystems: the production and manufacturing of raw materials, field farming, harvesting, treatment of agricultural and sideline products, and transportation of all stages was taken into account (Figure 2). The system boundary does not include any subsequent segments such as processing, transportation, circulation, and use of crops after harvest. The LCA models of five cropping systems were built according to the above goal and scope definition.
  • Inventory analysis
Inventory analysis represents a compilation of natural resource inputs and greenhouse gas emissions related to one functional unit. Certain key greenhouse gas produced by agricultural operations and on-field emissions due to synthetic fertilizers were calculated as follows:
EFtotal = EFinput + EFtransport + EFN2O + EFmachine
where EFtotal, EFinput, and EFtransport represent the total amount of greenhouse gas emissions from crop production along with the greenhouse gas emissions generated during means of production and manufacturing processes of crop production and of means of production and products (grain, straw) during the transportation process, respectively; EFN2O represents the N2O emissions directly generated by soil as a result of the application of chemical fertilizer; EFmachine represents the greenhouse gas emissions generated by machines used in the field during crop production.
The equation used to calculate EFinput was as follows:
EFinput = Seedinput × EFSe + Fertilizerinput × EFFe + Pestinput × EFPe + Filminput × EFFi + Irrelect × EFelect + Fuelinput × EFFu
where Seedinput stands for the amount of seed (kg); EFSe is the greenhouse gas emission amount per kg of seed in the production life cycle; Fertilizerinput is the amount of fertilizer (kg), including nitrogen, phosphorus, potassium, compound, and farm fertilizers; EFFe is the greenhouse gas emission amount of 1 kg fertilizer in the production life cycle; Pestinput is the amount of pesticide used (kg), including insecticides, fungicides, and herbicides; EFPe is the greenhouse gas emission amount per 1 kg pesticide in the production life cycle; Filminput is the amount of agricultural film (kg, also known as plastic sheeting); EFFi is the greenhouse gas emission amount of 1 kg agricultural film in the production life cycle; Irrelect is the electricity or water consumption used for irrigation (kWh or t); EFelect is the greenhouse gas emission amount of 1 kWh irrigation electricity consumption or 1 t irrigation water consumption in the production life cycle; Fuelinput is the fossil fuel consumption of various agricultural machinery in the production process; and EFFu is the greenhouse gas emission amount of 1 kg fossil fuel used in the production life cycle.
In addition, release of N2O from soil into the atmosphere as a result of chemical fertilizer application exerts consequences related to global warming, and it was measured using following:
EFN2O = FN2O × EN2O × 298 × 44/28
where FN2O represents the application rate of nitrogen and compound fertilizers in soil; EN2O is the emission factor of N2O; 298 is the carbon dioxide equivalent of N2O in global warming potential (GWP); and 44 / 28 is the conversion rate of N to N2O.
  • Life cycle impact assessment
This study adopted 100 years GWP factors from the IPCC 2013 to calculate the characteristic equivalent of greenhouse gases in terms of CO2 equivalents (CO2-eq).

2.2.2. Profit Accounting

The crop production return was calculated by the input-output method where total cost is subtracted from gross revenue. For the ith crop, using the following equation:
P i = Y i × S i k = 1 n X i j × C j C i t r a n s p o r t C i l a b o r
where Pi, Yi, Si, and Xij, represent the net margin per unit area, yield per unit area, selling price, and input of item j in the agricultural materials per unit area, respectively; Cj represents the market price of the jth agricultural material; Citransportrepresents the cost of transporting agricultural materials and products in the production. In addition, Cilabor represents the cost of labor force used in the production. Most of the surveyed farmer households in the study area had little in the way of non-agricultural employment and do not consider the opportunity cost of their own labor force when making production decisions. Therefore, the labor cost of farmers was not considered in the calculation of profit, but only the charges of hired labor.
The input of agricultural materials mainly includes the items of seed, chemical fertilizer, pesticide, agricultural film, water and electricity, and machinery, and was calculated as:
k = 1 n X i j × C j = X i S e e d × C i S e e d + X i F e r × C i F e r + X i P e s t × C i P e s t + X i I r r × C i I r r + X i F i × C i F i + X i M a c h × C i M a c h
where XiSeed represents the seed input per unit area; CiSeed represents the market price of the seed in the current year; XiFer, XiPest, and XiFi represent the input of chemical fertilizer, pesticide, and agricultural film per unit area, respectively; CiFer, CiPest, and CiFi represent the market price of chemical fertilizer, pesticide, and agricultural film in the current year, respectively; XiIrr and XiMach represent the input amounts of water/electricity and fuel consumption of the machinery or the rental time of the machinery per unit area; CiIrr and CiMach represent the prices of water/electricity and agricultural film as well as the machinery price per unit mass or the rental price of machinery per unit time, respectively.
The profit ratio of crop production ( R i ) was calculated using the following equation:
R i = P i / ( k = 1 n X i j × C j )
where Ri represents the crop profit ratio which is the ratio of net margin to total input. The profit ratio was used to measure crop productivity, which can reflect the economic performance of planting a certain crop.

2.2.3. Functional Units

Three functional units were adopted to compare the CF of five crops, including carbon emissions per unit area ( A C , kg CO2-eq/ha), carbon emissions per unit mass product ( W C , kg CO2-eq/t); regarding the greenhouse gas management scope, 10,000 yuan profit output is an officially used benchmark in China ( P C , kg CO2-eq/104 yuan), it was also adopted by our study to ensure comparability with other products and to provide direct implications for policy making. The conversion relationships between functional units were calculated using equations as follow:
WC = AC/y
PC = AC × 10,000/p
where y is the crop yield per ha (t/ha); and p is the crop profit per ha (yuan/ha).

2.3. Data Sources

A fully informed questionnaire was used to obtain data reflecting the average level of farmers’ input-output of these five crops in the study area. The questionnaire survey was conducted by stratified random sampling, covering 14 counties (districts) of the two cities. A total of 347 valid questionnaires were collected. In order to reduce inter annual fluctuations, the statistical year of input-output data was 2018–2020. Lastly, the average value of the three-years of data was obtained.
Large differences were observed in the crop types planted by farmer households. Consequently, not all 347 farmer households had planted all five crops. The numbers of households cultivating wheat, grain maize, apples, alfalfa, and silage maize were 237, 285, 42, 59, and 16, respectively.

3. Results and Analysis

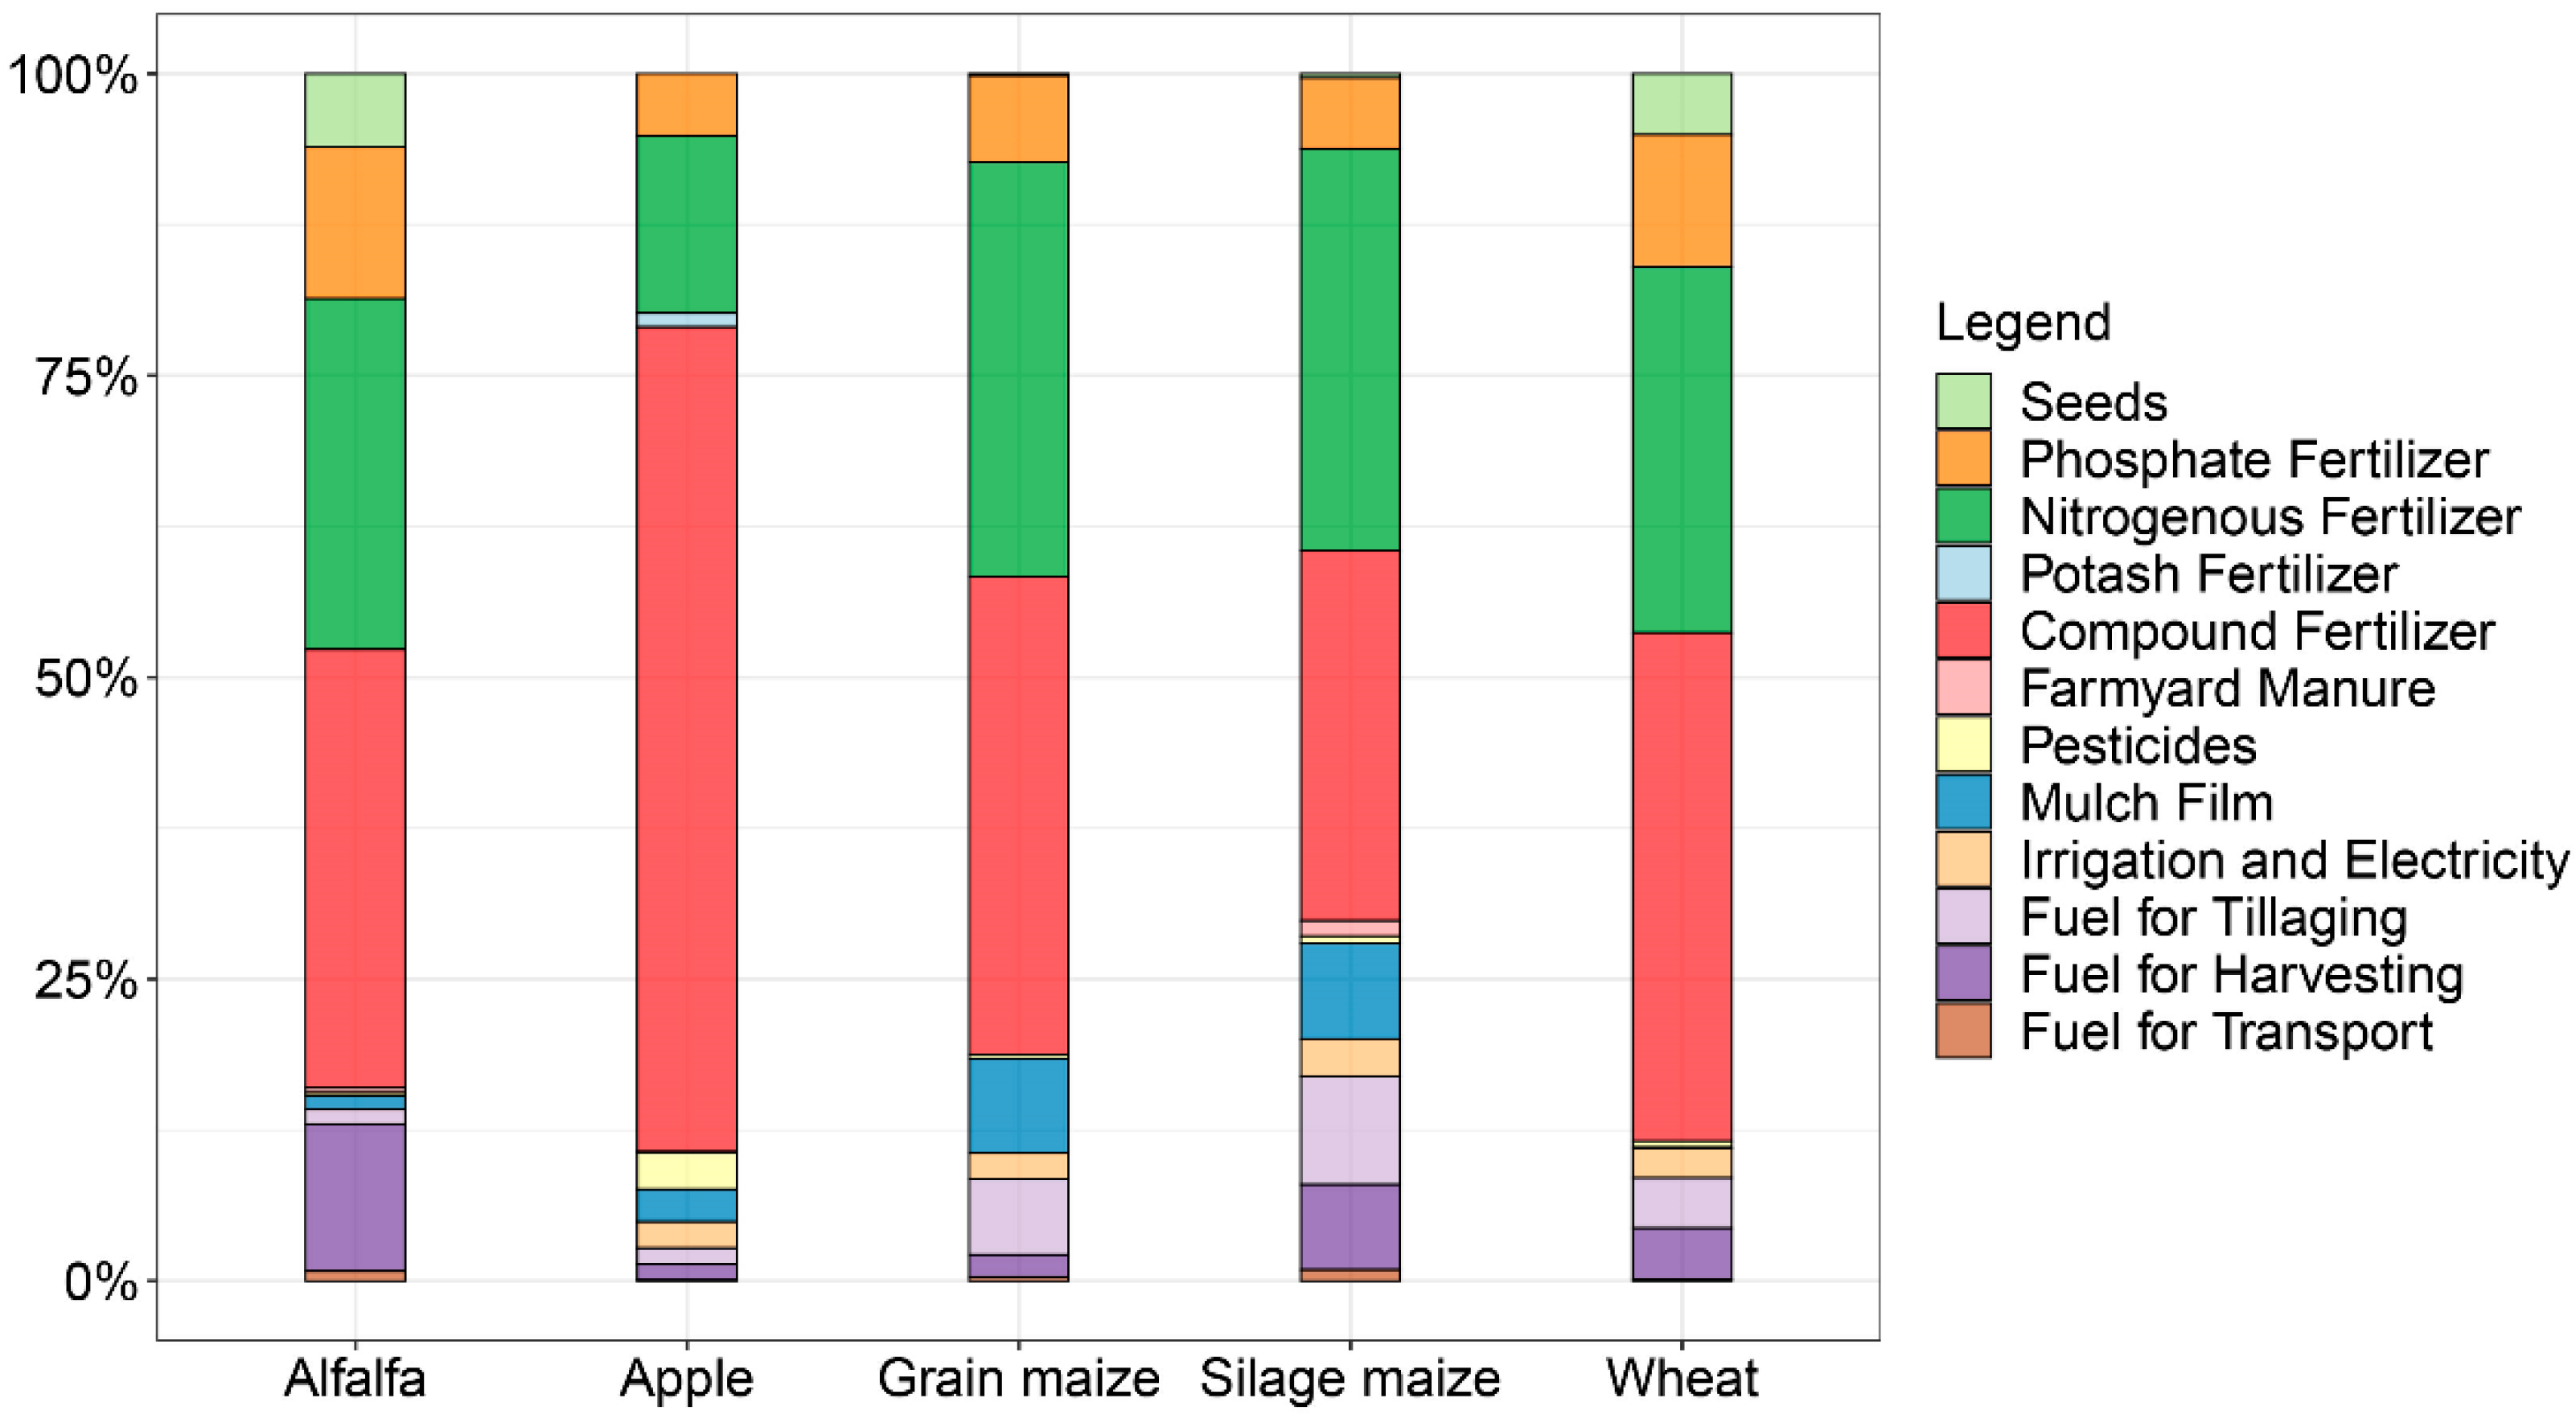
3.1. Carbon Footprint Observations

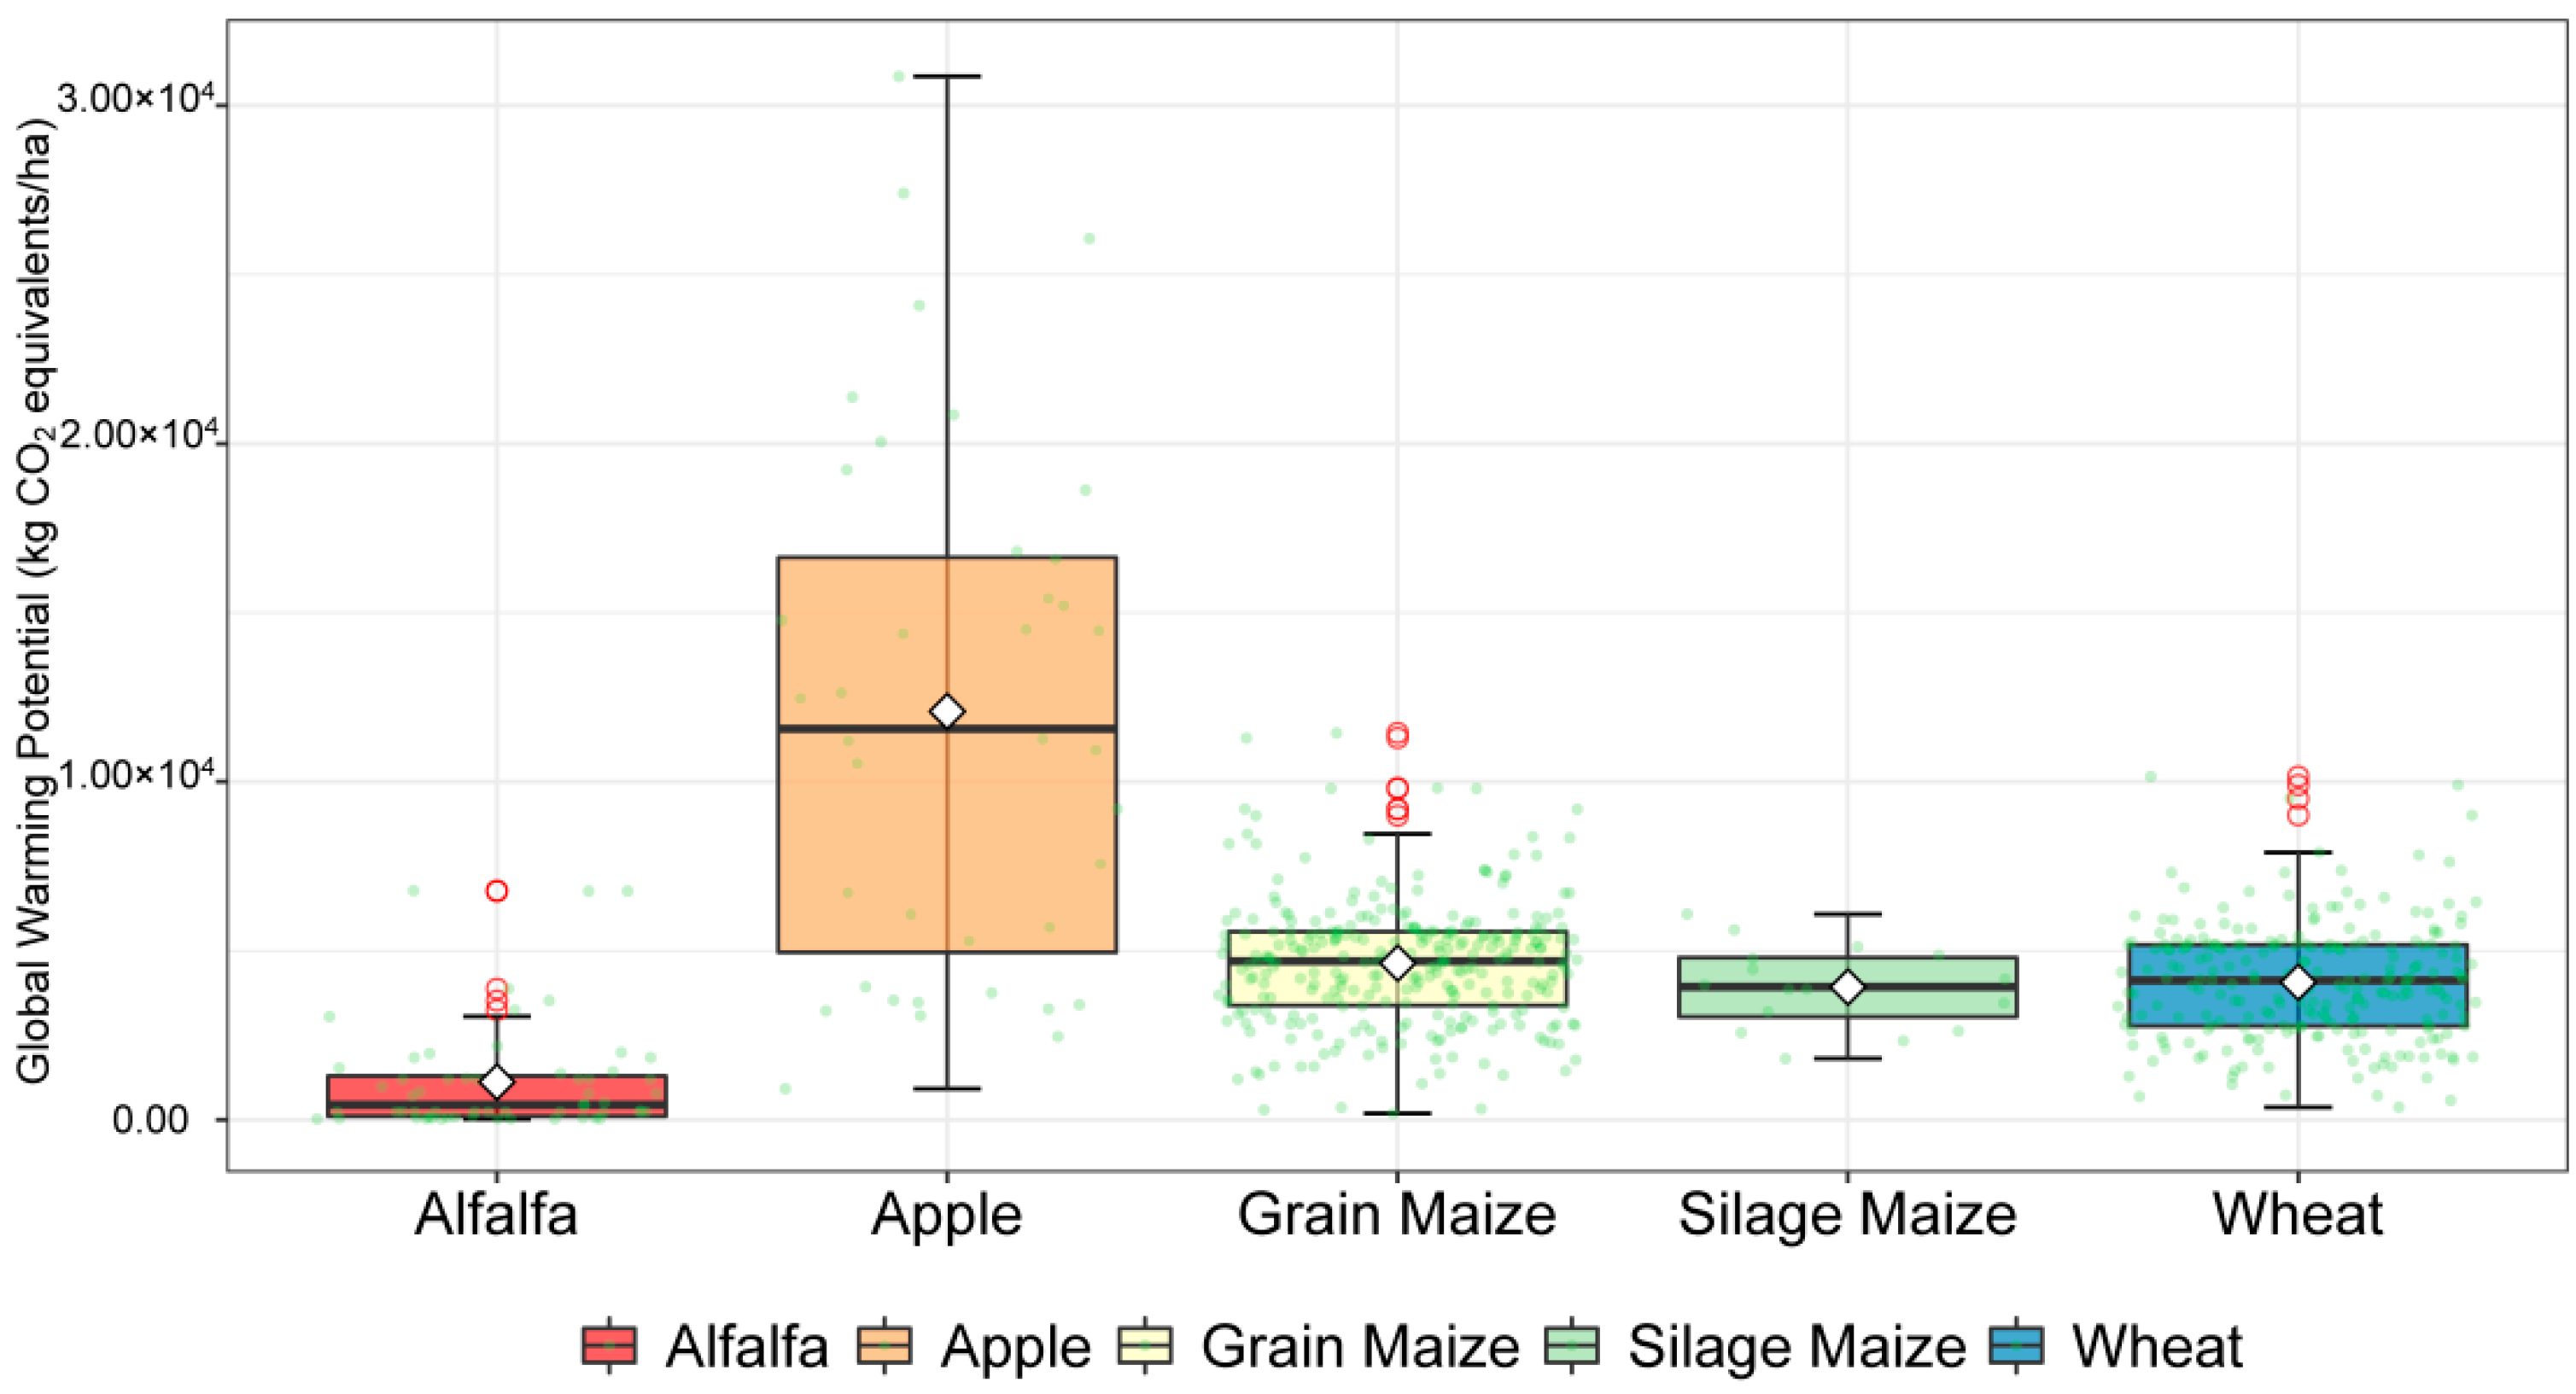
3.1.1. Greenhouse Gas Emissions per Hectare of Land Use

Taking 1 ha of land area as the benchmark unit, the greenhouse gas emission resulting from the production of the five crops during the entire life cycle were calculated per hectare (Figure 3).
The AC from high to low was as follows: (unit, kg CO2-eq): apple > grain maize > wheat > silage maize > alfalfa. Planting apple produced far more greenhouse gas emissions per hectare than other crops, more than twice as much emissions as grain maize, the second largest emission producer per hectare. The greenhouse gas emissions per unit area of grain maize and wheat were very similar. The emissions from alfalfa were the lowest, which was only 8.46% of the greenhouse gas emission from apple and 21.95% of that from grain maize.
The alfalfa cultivation resulted in low levels of greenhouse gas emissions overall with a relatively concentrated distribution of data, showing that the input of local farmers in alfalfa is generally low. The differences between the upper and lower quartiles of apple and silage maize were large with a highly dispersed distribution of data, suggesting that the input of farmers varied considerably, which is related to the use of fertilizers by local farmers. The distribution of carbon emission data for wheat and grain maize was small and concentrated with some outlying values, indicating that there was little difference in the input of most farmers when cultivating wheat and grain maize. Nevertheless, the input of some individual farmers was significantly higher than the average level for farmers in this area.

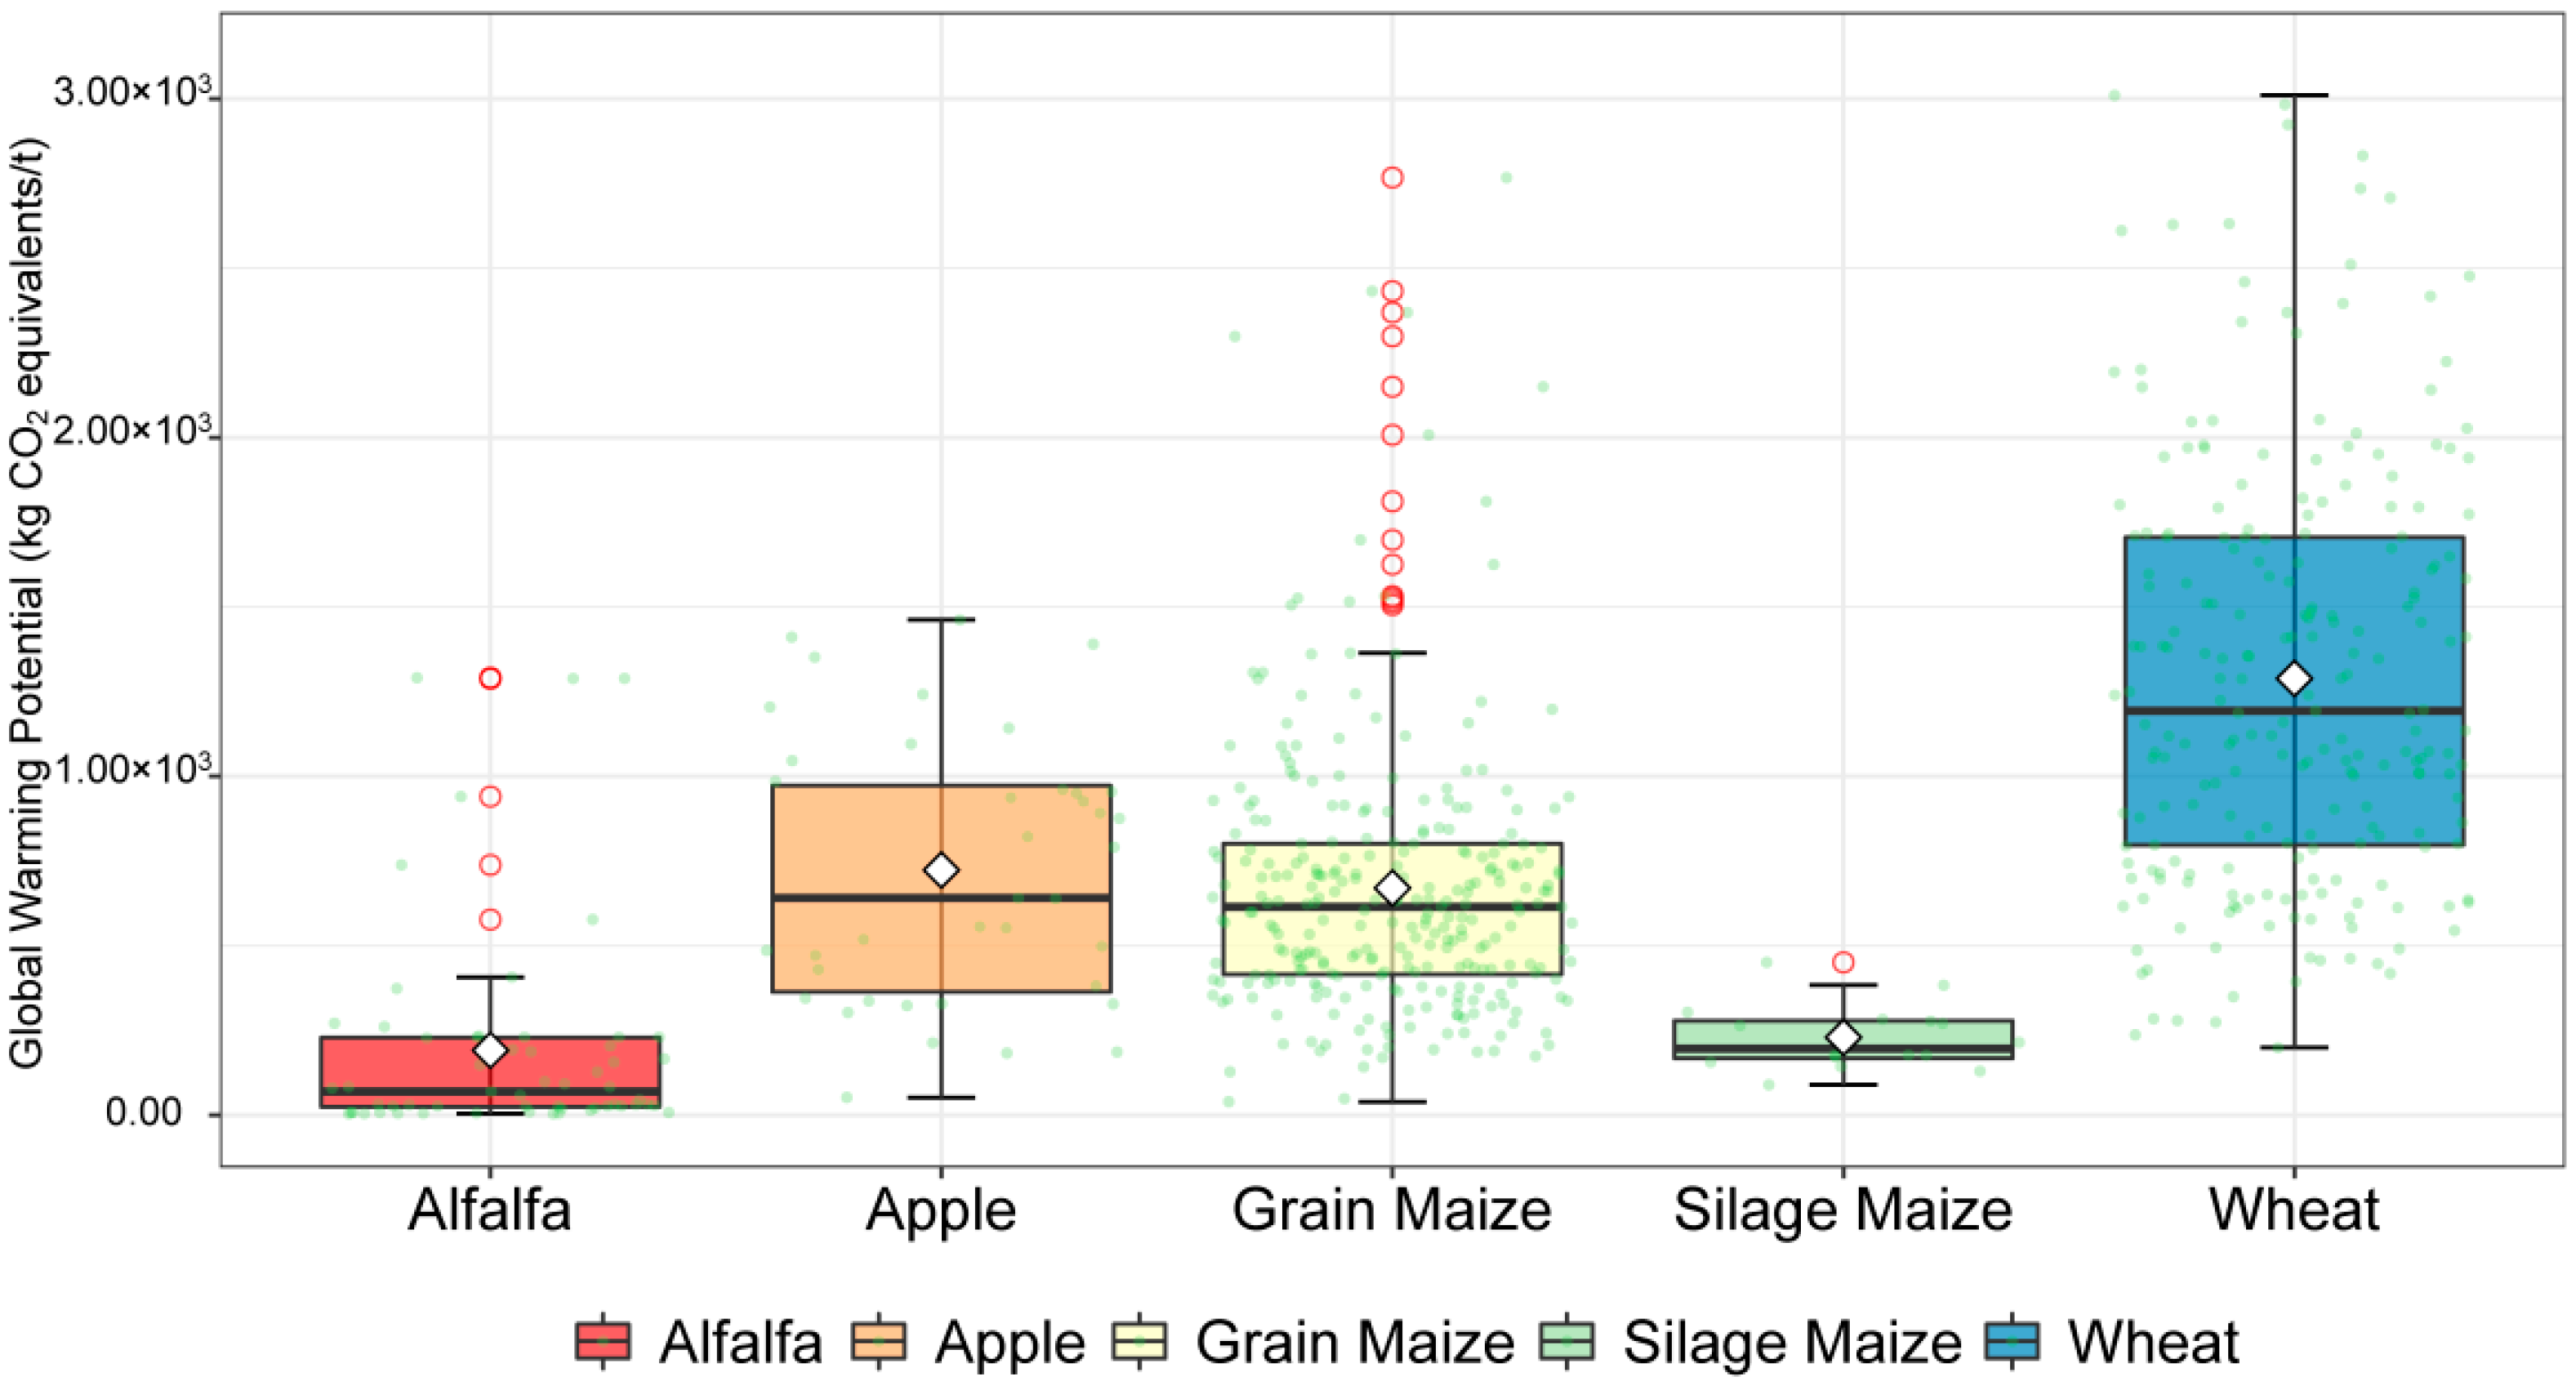
3.1.2. Greenhouse Gas Emissions per Ton of Product Produced

Taking 1 t of product as the benchmark unit, the greenhouse gas emissions resulting from the cultivation of the five crops during the entire life cycle are shown in Figure 4.
Carbon emissions per unit mass product from high to low were as follows (unit, kg CO2-eq): wheat > apple > grain maize > silage maize > alfalfa. The emission intensity for cultivating wheat was significantly higher than that of other crops. Similar to the AC results, the greenhouse gas emissions per ton yield of alfalfa and silage maize were low while those of grain maize and apple were in the middle and varied little. The results of WC analysis mainly depended on the yield of crops and the input of farmers during production. Based on both the WC and AC results, the study found that the main problem in growing wheat with high carbon emissions is that the yield per unit area is too low. Although apple required a large input in the production process with the largest AC emissions, its yield is high, thus the WC value of apple is less than that of wheat. Silage maize and alfalfa are typically harvested as whole plants which make full use of biomass resources. Hence, the outputs are large, resulting in small WC values.

3.2. Profit Calculation Observations

The input-output of crops were statistically analyzed (Table 1). By calculating the profit ratio and comparing the productivity of the five main crops analyzed here, the profit ratio was found from high to low as (unit, %): silage maize > alfalfa > apple > grain maize > wheat. The profit ratio of silage maize was the highest and about 37 times that of wheat. However, the input of silage maize was only 1.56 times that of wheat. Apple had the highest cost due to its chemical fertilizer input and pesticide input being significantly higher than those of other crops. However, the gross receipts of apple were also the highest, and the same goes for the net margin which was 1.35 times that of silage maize. In addition, the cost of alfalfa was the lowest, accounting for only 8.24% of the total cost of apple and 22.97% of the total cost of silage maize. However, the profit ratio of alfalfa is second only to silage maize, indicating that alfalfa has a high marginal benefit.
Among the input of the five crops, chemical fertilizer and machinery accounted for the largest proportion taking up 59.78% of the total input for silage maize, 52.44% of that for alfalfa, and 40.00% of that for wheat. The input of chemical fertilizers accounted for 69.84% of the total input for apple and 35.74% of that for grain maize. In terms of output, silage maize, apple, and alfalfa were significantly higher than that of wheat, the main cereal crop. Moreover, the profit ratios of those crops were higher than that of wheat. Based on the profit ratio per unit area, the productivity and resource use efficiency of cash crops and forage crops were generally high.

3.3. Combining Carbon Footprint Analysis with Economic Performance

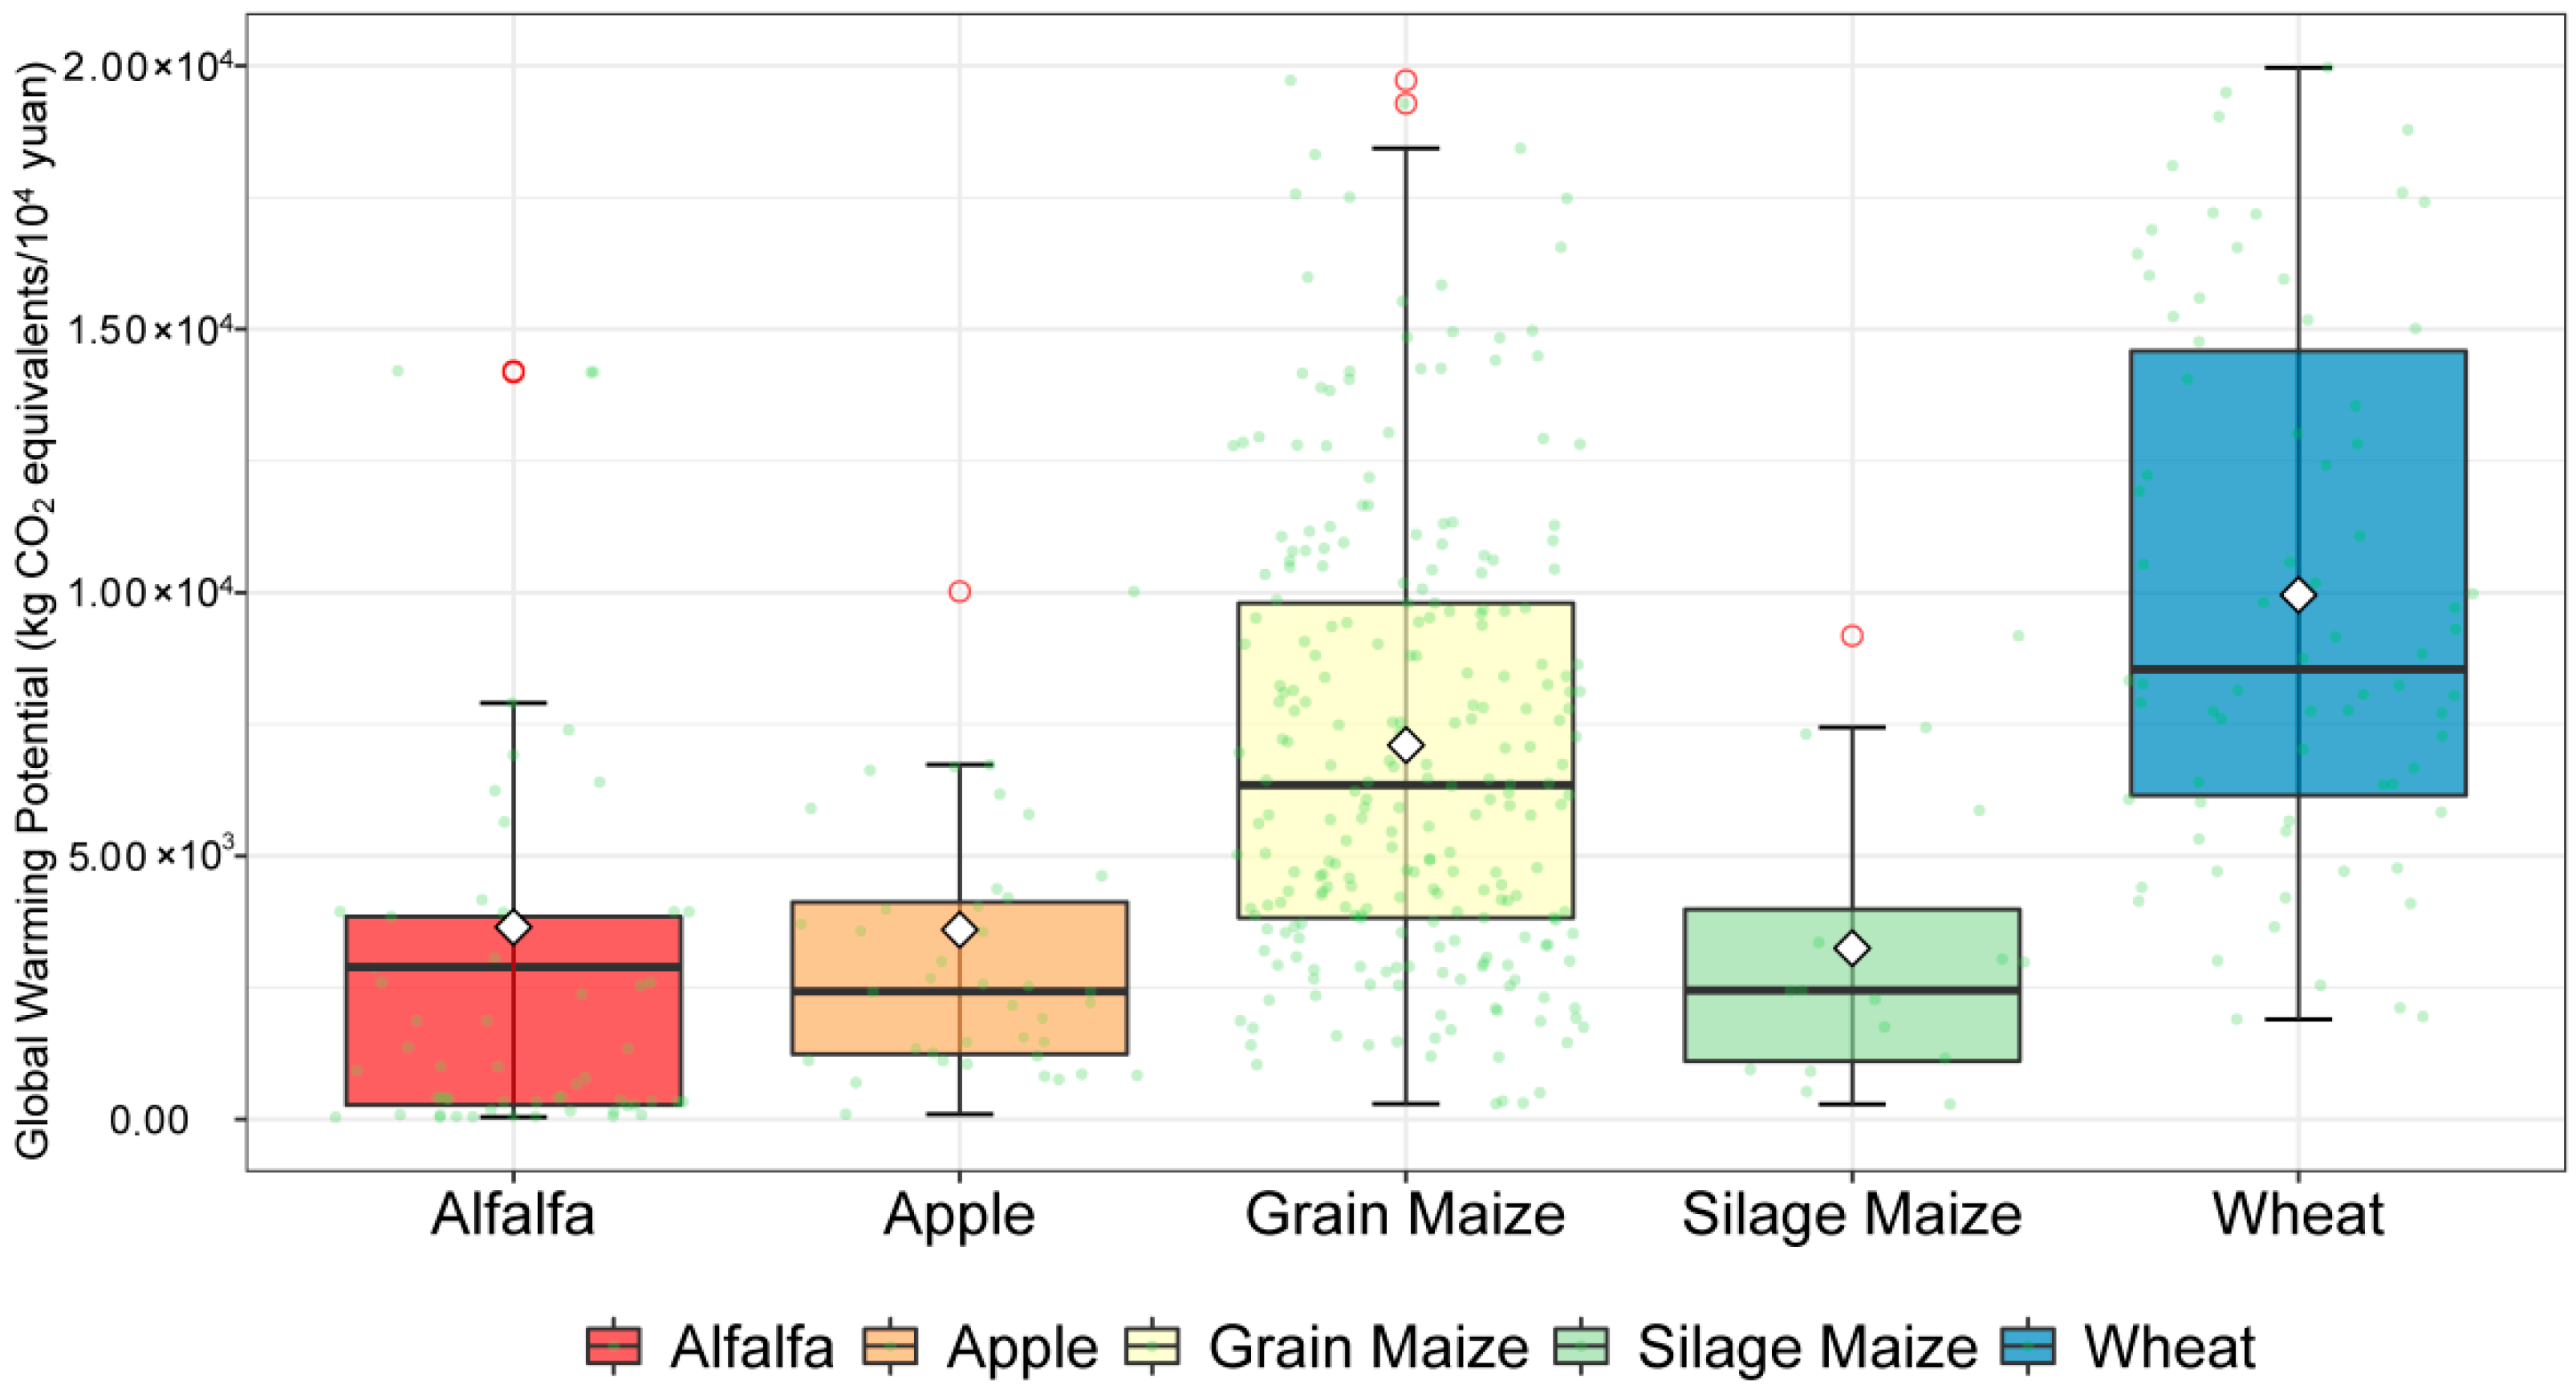
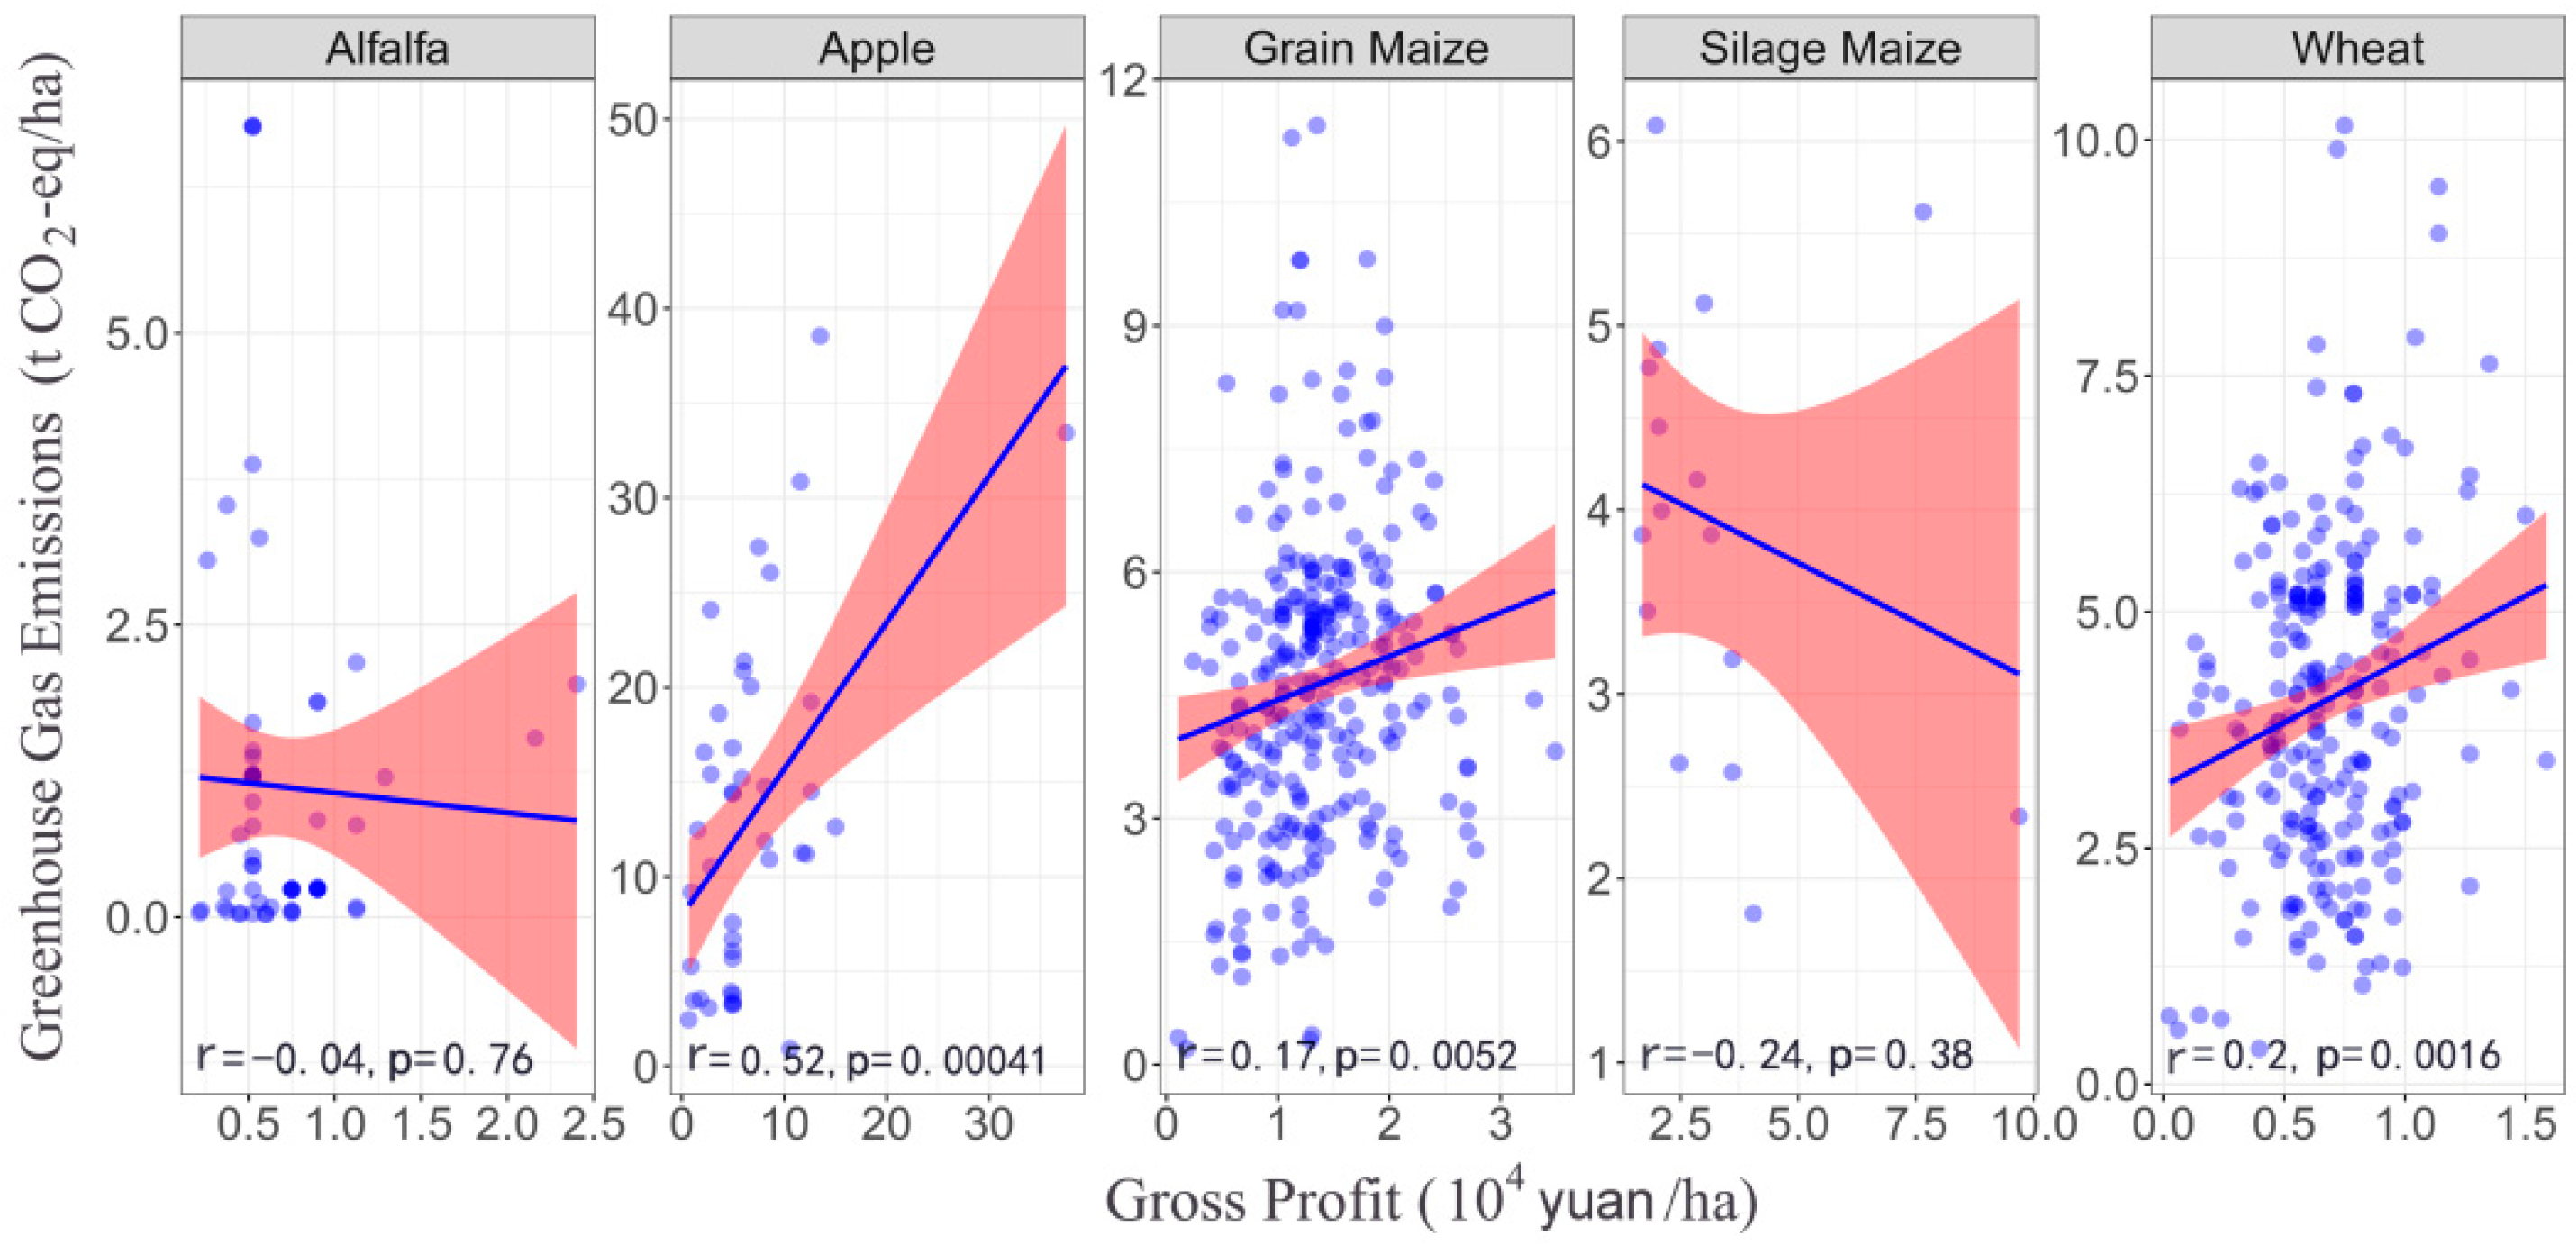
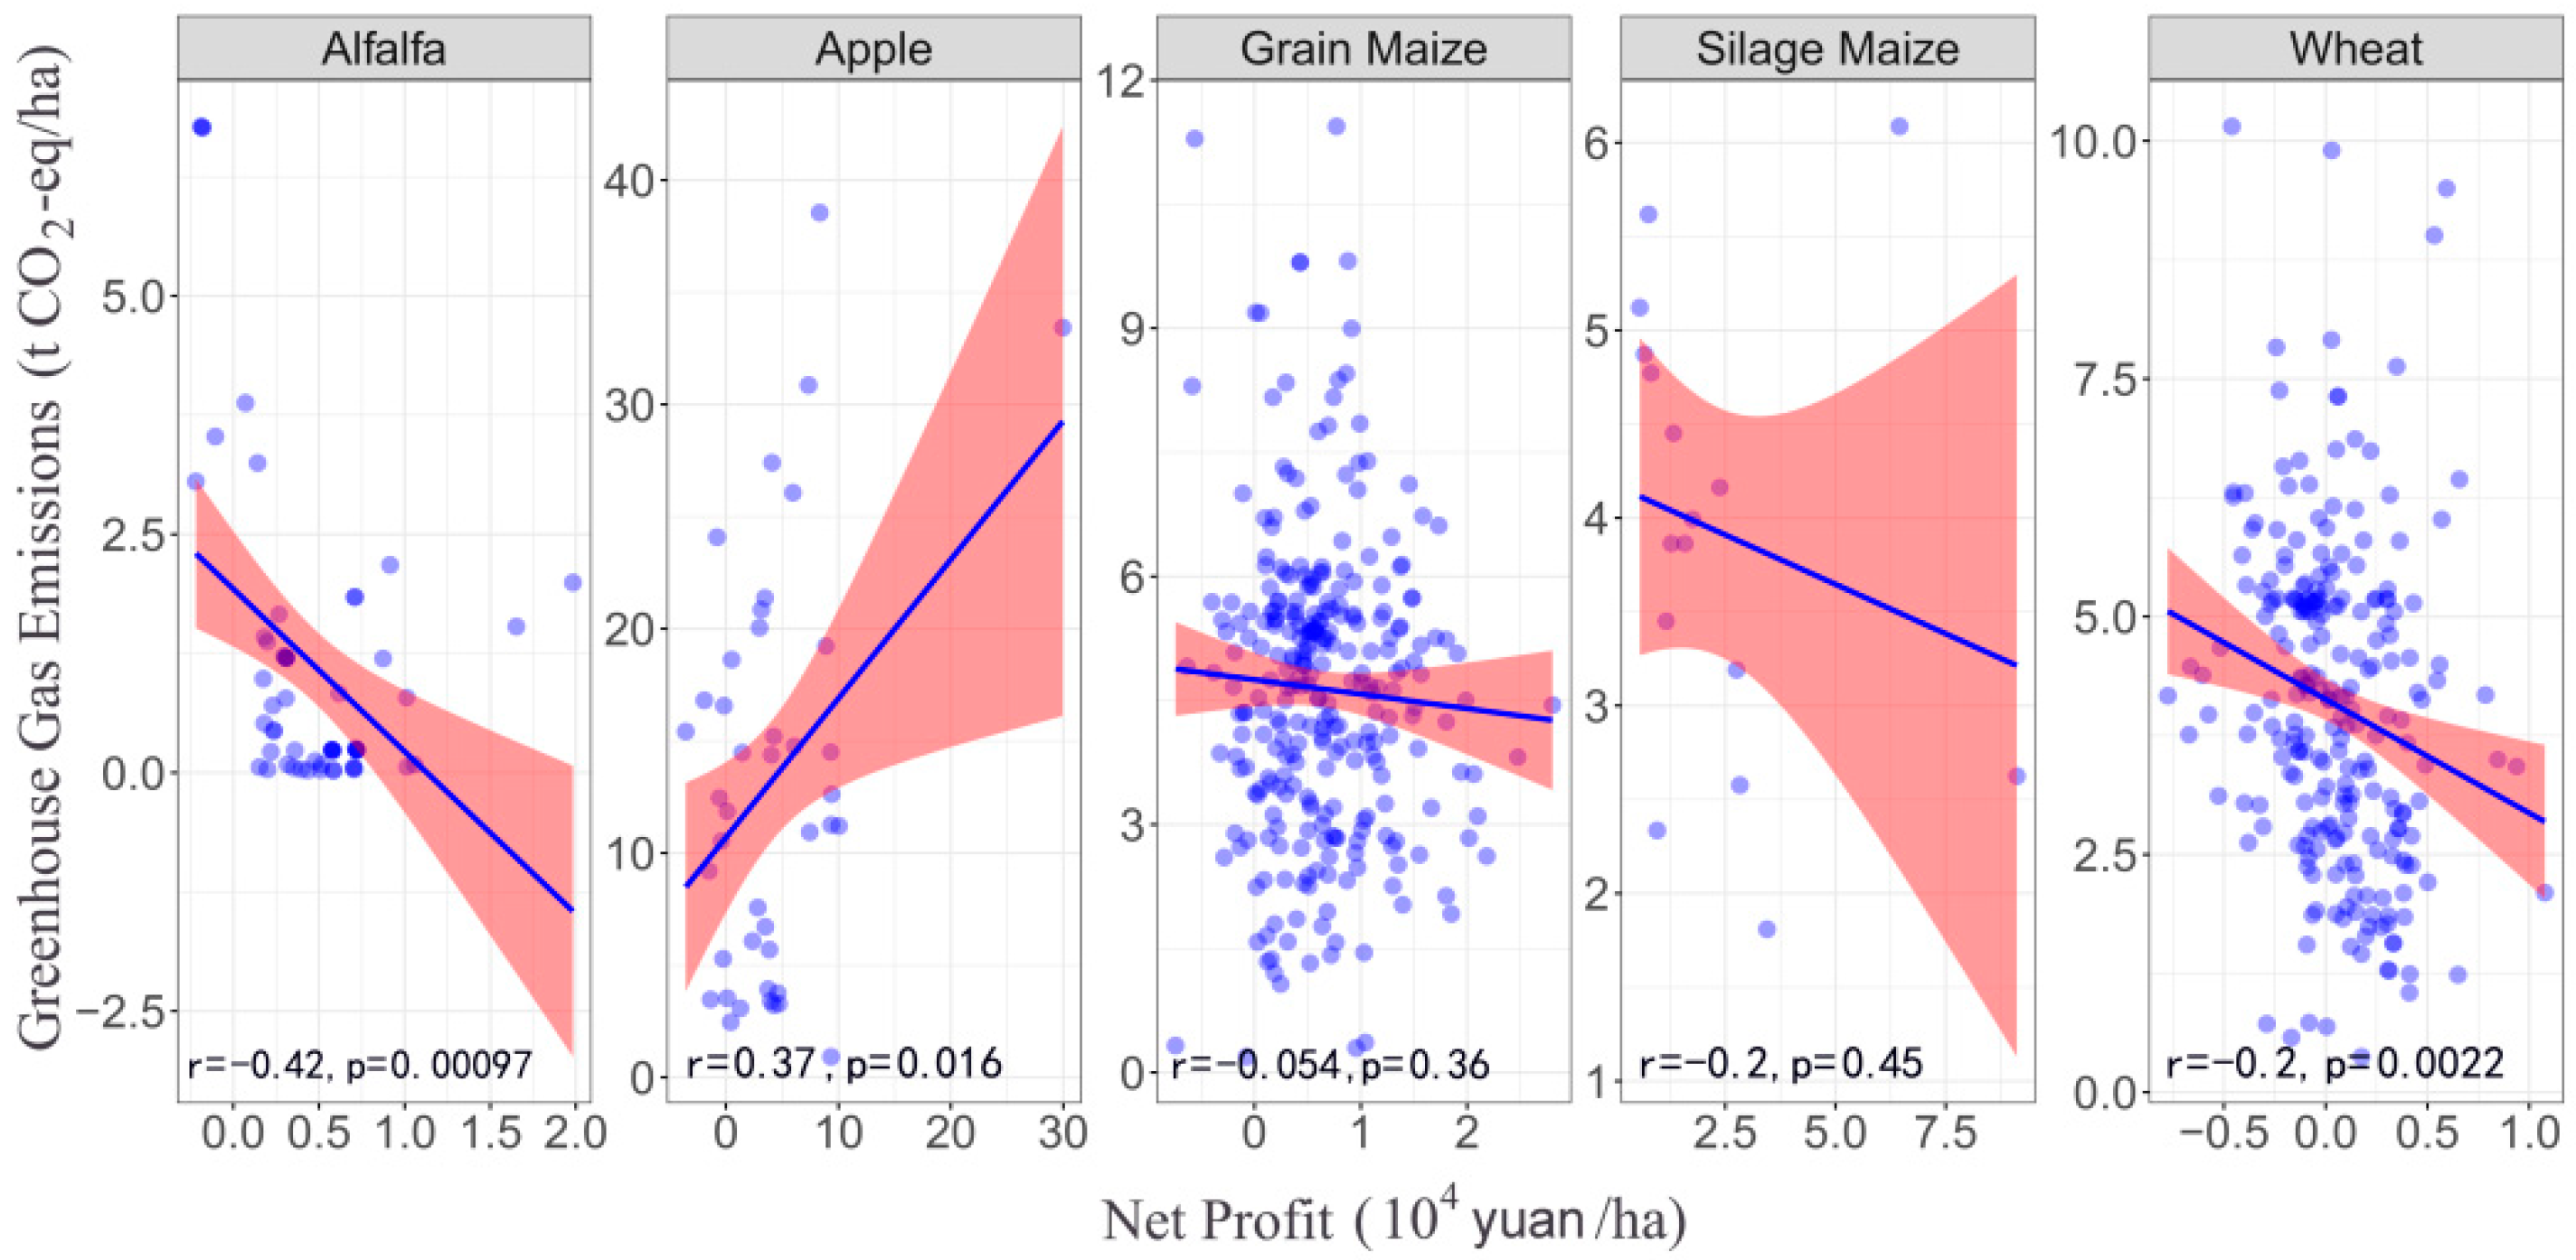
3.3.1. Comparison of Greenhouse Gas Emissions on the Profit Baseline

Taking officially used 10,000 yuan of profit as the benchmark, the greenhouse gas emission results of the five crops are shown in Figure 5. The greenhouse gas emission per 10,000 yuan output of wheat was the highest (the unit here is kg CO2-eq/104 yuan). The main reason is that the profit ratio of wheat was very low. The survey found that some farmers cannot make ends meet by planting wheat. The output for grain maize is about one-fifth that of wheat. The output of apple was about twice that of alfalfa. The best performance was for silage maize, which was only 1/25 of that of wheat and is related to the high yield and high profit. The AC and PC results of the five crops were very different, showing that combining the output is quite different when compared with only considering land use.

3.3.2. Correlations between Carbon Footprint and Margin

The Pearson correlation coefficient was adopted to describe the relationship between CF and margin of each crop. As shown in Figure 6, correlation between CF and gross profit was moderately positive for crops of apple, grain maize, and wheat (p < 0.01), but the association of alfalfa and silage maize was not significant (p = 0.76 and p = 0.38). Nevertheless, CF was inversely correlated with net profit for crops of alfalfa and wheat (p < 0.01), positive for apple (p < 0.05), and not significant for grain maize and silage maize (p = 0.36 and p = 0.45) (Figure 7). The results suggest that correlation varied both among cropping systems and with statistic index, factors such as household management practices and natural conditions play a potential role in explaining the variation in CF and economic performance of cropping systems, but most studies agree that the goal of improving profitability does not adversely affect the CF of agricultural products [16,18,32,33].

4. Discussion

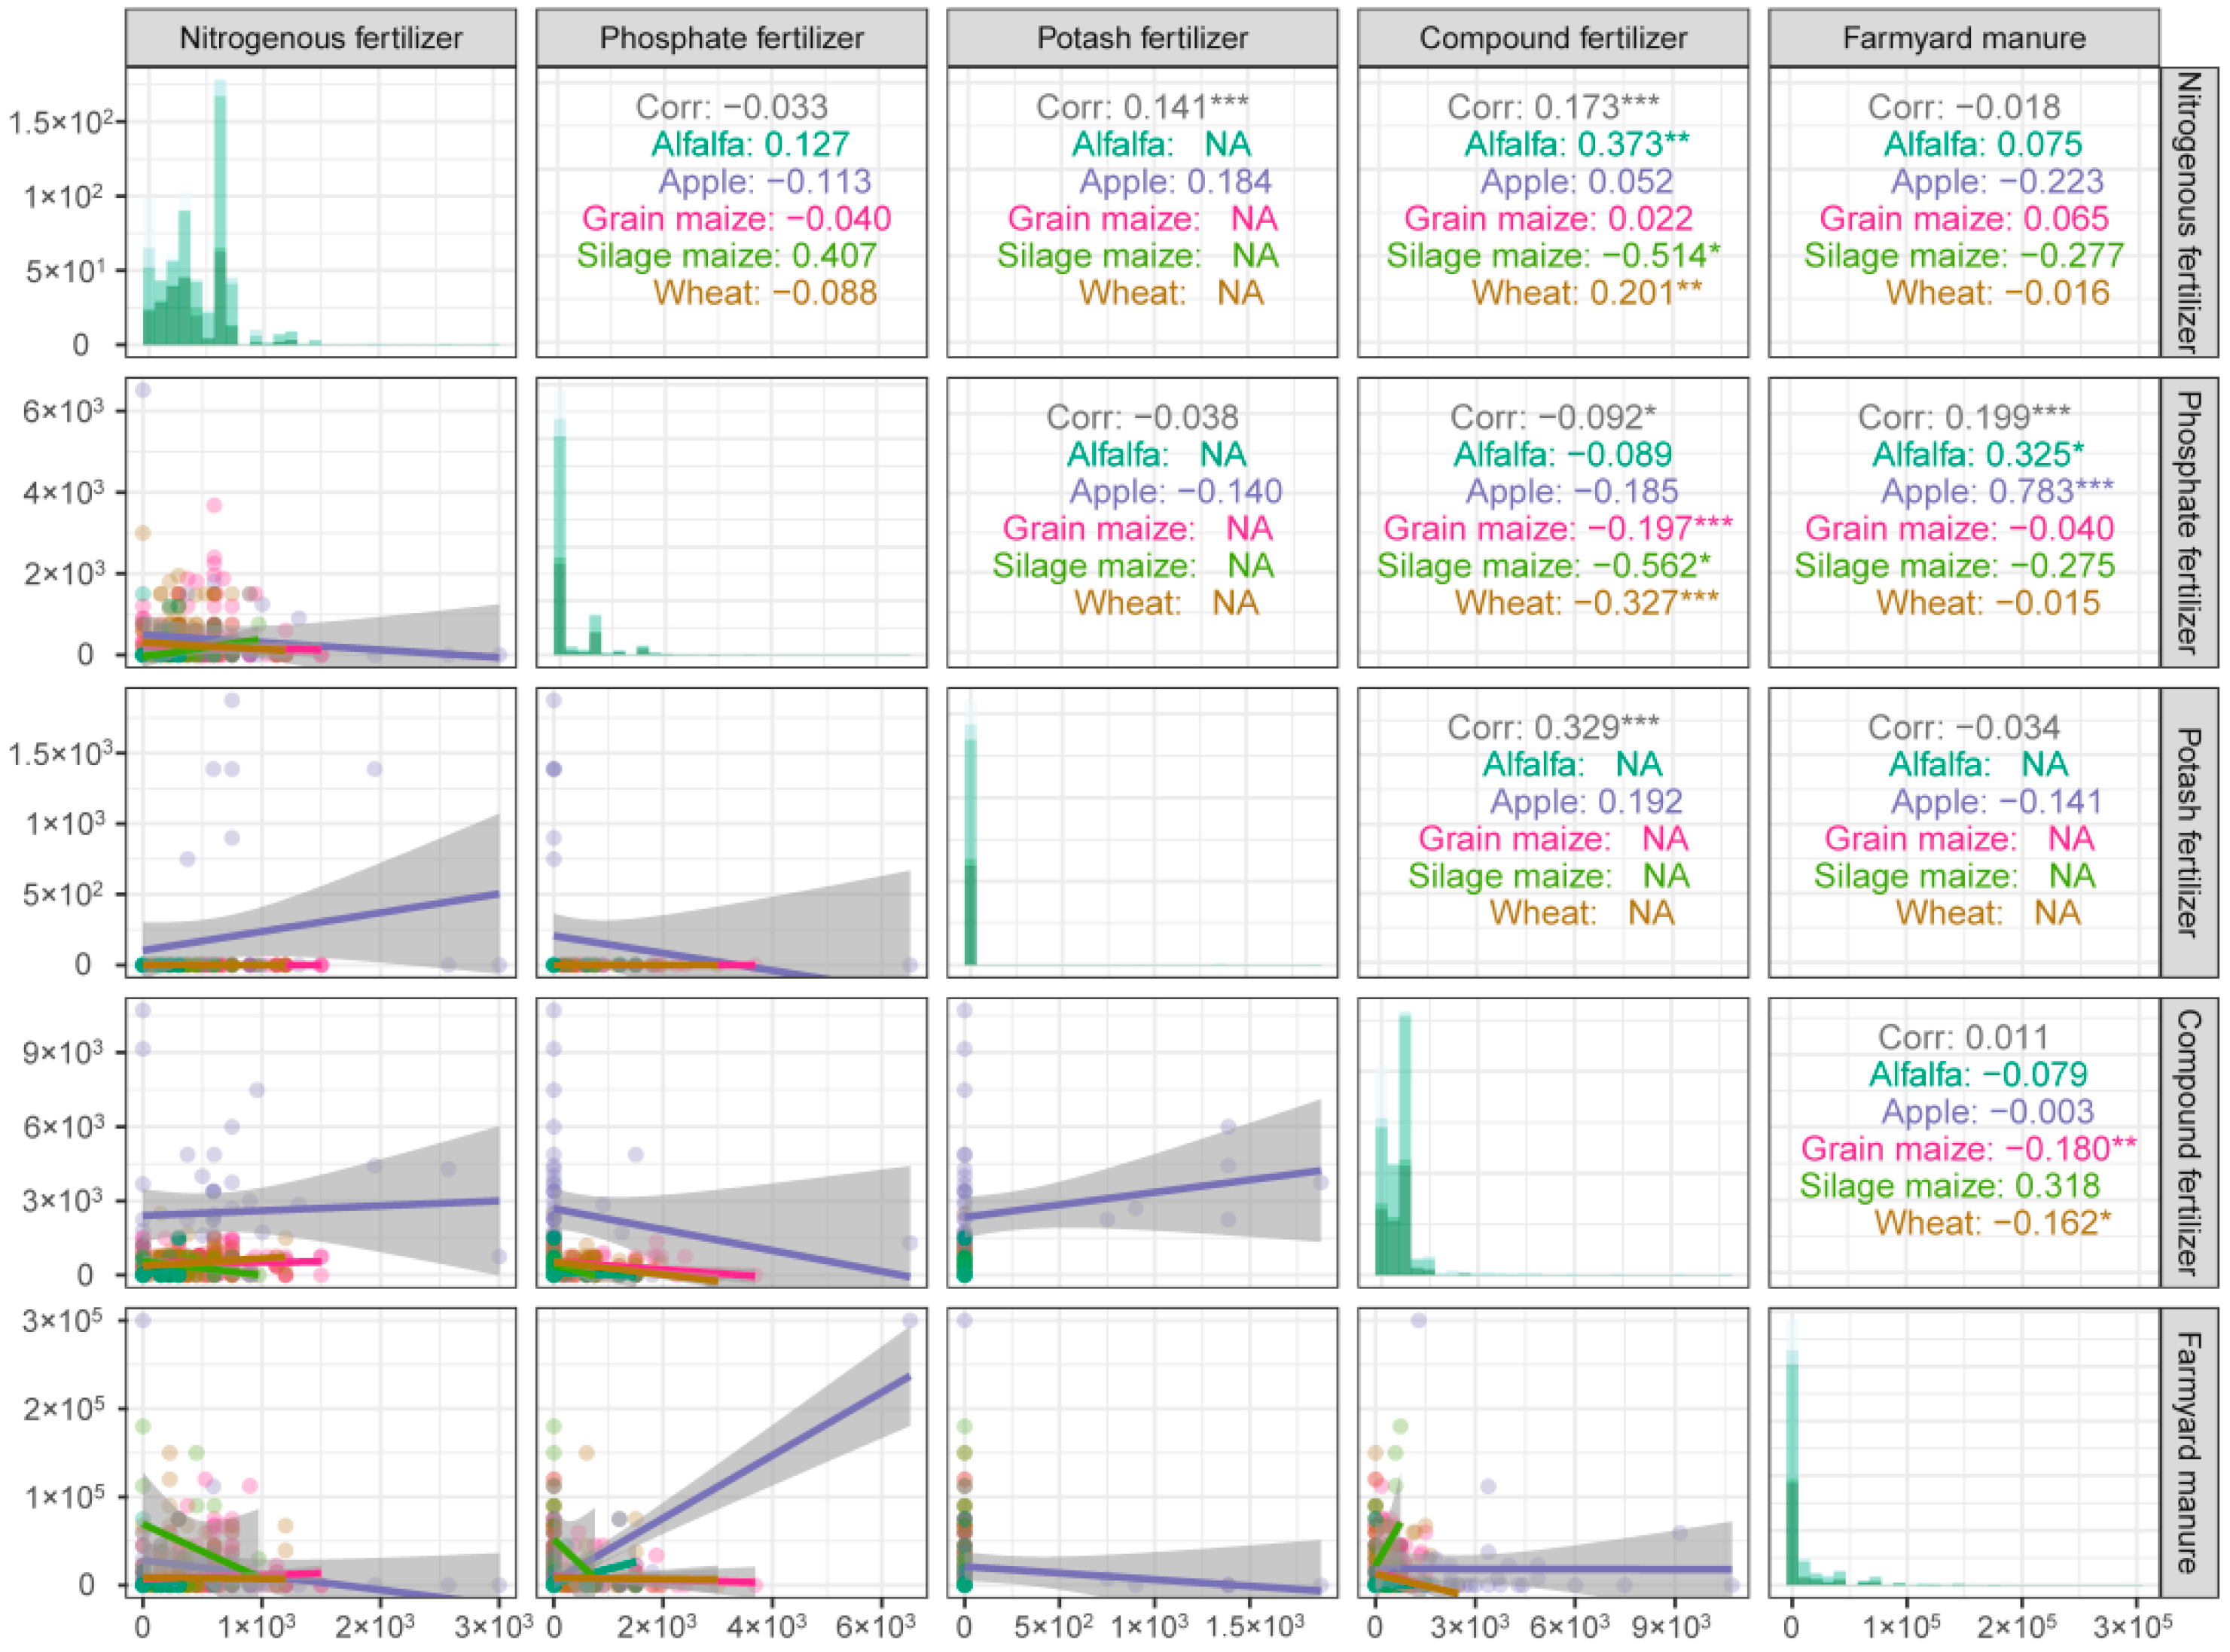
4.1. Inventory Sensitivity Analysis of Greenhouse Gas Emissions

An analysis of inventory sensitivity of greenhouse gas emissions provides the potential improvement points of the whole system [34]; it was carried out using the mean inputs-outputs per hectare land use of all farmer households.
The results revealed that great differences existed in the sensitivity of different material inputs and processes (Figure 8). Among five types of crops, the greenhouse gas emissions from growing apple had a high inventory sensitivity in the production and use of compound fertilizer, accounting for 68.29% of its gross emissions. Regarding grain maize and wheat growing, the inventory sensitivity focused on compound fertilizer and nitrogen fertilizer, accounting for 39.47% and 42.03%, 34.30% and 30.22% of its gross emissions, respectively. For the forage crops, the results also showed a higher sensitivity on the fertilizer application. Production as well as field emissions of compound and nitrogen fertilizers constituted silage maize and alfalfa’s total emissions, were 30.61% and 36.32%, 33.33% and 29.06%, respectively.
The inventory sensitivity results for five crops indicated that the greenhouse gas emissions in the production and use of agricultural materials accounted for most of the proportion, reaching at least 79.94%. This indicated that the cropping systems in the study area depended heavily on the input of agricultural chemicals, especially chemical fertilizer and machinery, which are the main sources for the large amount of greenhouse gas emissions observed during agricultural activities.

4.2. Emission Reduction Opportunities

The sensitivity analysis results of each segment provided by LCA revealed the total change in emissions was caused by the change of unit greenhouse gas emission in this segment. The higher the sensitivity, the greater the change of the total greenhouse gas emissions caused by the change, and the higher the abatement potential. Therefore, the analysis plays a guiding role in greenhouse gas abatement related to crop production. The inventory sensitivity analysis results of the five crops in this study showed that fertilizer production and field emissions have significant impacts on greenhouse gas emissions, especially the production and use of compound and nitrogen fertilizers, which agrees with previous reports for cropping systems. For instance, LCA analysis of the main grains cultivated in Italy (wheat and grain maize) showed that the application of chemical fertilizer in all contributing factors has a sensitivity of more than 70% and 65% to greenhouse gas emissions of the two crops, respectively. In addition, the potential impact of GWP was particularly related to N2O [35]. An LCA analysis of apple production in Canada showed that diesel combustion, fertilizer usage, field emissions, and pest treatment were most closely related to greenhouse gas emissions [36]. Many research results related to cropping systems in China were also congruous with ours. An LCA analysis of China’s agroecosystems showed that nitrogen fertilizer production and field emissions were most sensitive to greenhouse gas emissions [37]. In the agricultural production of cereal and forage crops in the North China Plain, the production, transportation, and application of nitrogen fertilizer also had the greatest environmental impact [38]. In addition to the CF using LCA method, studies based on other methods came to the same conclusion. In a gray correlation analysis of the agricultural CF in western China, the correlation between chemical fertilizer application and CF was the largest at more than 0.91, which has a significant impact on the local agricultural greenhouse gas emissions [39]. An environmental impact analysis of intensive farming in Minqin County, Gansu Province, China, found that without considering soil respiration alone, chemical fertilizer and agricultural film were most sensitive to greenhouse gas emissions of crops [40]. In addition to cereal crops, the fertilizer application intensity of cash crops in China was high as a whole and showed an increasing trend [41]. In the top two cash crops in terms of yield and area, apple cultivation exhibited a significant excess of chemical fertilizer application. Research shows that the annual productivity of apple in China was significantly lower than that in other major apple producing countries. However, a widespread phenomenon of excessive application of chemical fertilizer has been observed in China. The efficiency of chemical fertilizer (especially nitrogen fertilizer) use was low, with high levels of nutrients loss to the environment. Great differences in fertilization were documented among individual farmer households [42]. For example, the CF of apple per unit area in this study reached at least twice that of other crops. The total sensitivity of compound and nitrogen fertilizers reached 82.98%, far exceeding the average value of crop CF chemical fertilizer sensitivity in China [39].
The high sensitivity of chemical fertilizer to creating greenhouse gas emissions highlights the widespread problem of excessive chemical fertilizer use in China’s agriculture sector [43]. Relevant studies have also shown that about two thirds of the chemical fertilizer in China is wasted on excessive fertilizer application [44], and this phenomenon is particularly common in cereal crops [45]. Among farmers who grow wheat and grain maize in China, the proportion on overuse chemical fertilizer is 83% and 60%, respectively [46]. Only 15% and 4% of wheat and grain maize growers, respectively, have realized the efficient use of chemical fertilizer in the North China Plain, China’s main grain cultivation area [47]. In this study, the excessive input of chemical fertilizer in the production process of the five crops was also found to be a very serious problem. The use of chemical fertilizer for apple, grain maize, wheat, silage maize, and alfalfa reached an average of 3.62 × 10³, 1.17 × 10³, 1.10 × 10³, 8.72 × 10², and 2.95 × 10² kg/ha, respectively, far exceeding the upper limit of the international recommended standard of 2.25 × 10² kg/hm2. In addition to chemical fertilizer, the use of organic fertilizer in crops is also high, reaching 2.00 × 10⁴, 9.00 × 10³, 8.26 × 10³, 4.43 × 10⁴, and 3.56 × 10³ kg/ha, respectively. This indicates that farmers in the study area use a very large amount of fertilizer unnecessarily, which far exceeds the actual need.
The main reason for the excessive use of chemical fertilizer is that farmers lack accurate science-based guidance related to using chemical fertilizer. According to the principle of reasonable fertilization, there should be a substitution effect in the use of different fertilizer types. For instance, there should be a negative correlation between the amount of compound fertilizer and other fertilizers or between organic fertilizer and other fertilizers. Figure 9 illustrates the correlation analysis of fertilizer inputs for nitrogen, phosphorus, potassium, compound, and organic fertilizers used in the production of the five crops analyzed in this study. Negative correlations were only found between compound and nitrogen fertilizers used in silage maize production and between compound and phosphorus fertilizers as well as between compound and organic fertilizers used in wheat and grain maize production. The compound and nitrogen fertilizers used in producing alfalfa and wheat showed a positive correlation, meaning the inputs were irrational. Nevertheless, as a high-quality fertilizer, organic fertilizer has a good effect on reducing the carbon footprint of crop production. For example, the greenhouse gas emissions caused by the use of organic fertilizer for apple, grain maize, wheat, silage maize, and alfalfa accounted for only 0.08%, 0.17%, 0.18%, 1.28%, and 0.38% of the total emissions, respectively [48]. Studies showed that choosing the appropriate combination of organic and chemical fertilizers to replace the use of only a single chemical fertilizer can ensure crop yield while reducing greenhouse gas emissions [49,50]. Under reasonable fertilization scenarios, organic fertilizer can replace part of the chemical fertilizer used in production, so the use of these two fertilizers should show a negative correlation. However, the results in Figure 9 show that when organic fertilizer was applied, farmers still used an excessive amount of chemical fertilizer so that the amount of chemical fertilizer used did not decrease significantly. The use of organic fertilizer only had a negative correlation with the use of compound fertilizer in the production of wheat and grain maize.
The main mitigation measure that could be used to reverse the excessive use of chemical fertilizer by farmers is technical intervention. Previous studies have shown that the main reason for excessive fertilization in agriculture is a lack of scientific information and professional recommendations; farmers tend to rely too much on their own preferences. Technical guidance and expertise such as soil testing and appropriate formulation of fertilizer application can effectively change this situation. The rate of fertilization can often be reduced by 50% through soil testing and formula-based fertilization [51]. Compared with conventional fertilization, the rates of nitrogen, phosphorus, and potassium fertilizer use can be increased by 10%, 7–10%, and more than 7%, respectively [52]. In this study, because farmers lacked information about the soil nutrient status and the different nutrients required by different crops, farmers utilized a large amount of compound fertilizers that are rich in a variety of nutrients rather than applying fertilizer in a targeted manner to provide any nutrients that are lacking in the soil; this led to the surplus of some nutrients [53]. An important reason why some farmers fail to test the soil is that the land in the study area is relatively fragmented [54] with only small-scale production. Detecting the soil nutrients content for each farmer household will require a large amount of time and money. Certain studies also show that large-scale agricultural production requires fewer resources than small-scale production [55]. Thus, cropland integration should continue to be promoted with the process of urbanization in China. Nevertheless, the government should also provide more public services related to scientifically sound fertilization such as soil testing and continuing education opportunities for farmers.

4.3. Cropland Use Optimization in the Future

According to the features of greenhouse gas emissions per 10,000 yuan and profit ratio, the five crops were clustered by K-means method. It is assumed that the cluster is divided into (C1, C2 ... Ck) [56], the goal is to minimize the square error E
E = i = 1 k x C i | | x μ i | | 2 2
where μi is the mean vector of cluster Ci, and it was calculated as:
μ i = 1 | C i | x C i x
In terms of clustering analysis results, the five crops can be divided into three clusters (Figure 10), including crop with poor comprehensive performance (wheat) and crops with a better comprehensive performance (apple and grain maize), as well as a best performance (alfalfa and silage maize). This indicates that planting apple, grain maize, and wheat will result in a higher cost of greenhouse gas emissions in order to obtain the same profit compared with the other two crops. Moreover, similar to Xia et al., the CF of wheat production in Gansu Province is higher than the national average [57], mainly due to the excessive fertilizer input by farmers attempting to increase production and low output efficiency [58,59]. In particular, the profit ratio of wheat in eastern Gansu was low and its competitiveness was weaker when compared with the other four crops analyzed here. Similarly, in agreement with Ren et al., the production efficiency of grain maize in northwest China was low while the labor input was high. However, the unit yield was insufficient and the use of excessive amounts of nitrogen fertilizer was common, resulting in high levels of greenhouse gas emissions [60,61,62].
The results combining CF and economic output can provide a certain level of understanding of the land use of the cropping systems in the study area. Different crop types have different levels of adaptability to various natural conditions, and different levels of resilience towards damage caused by extreme weather incidents while undergoing climate change, which constitutes the theoretical basis for land use planning. The comprehensive index of the five crops indicates that the production of alfalfa and silage maize in the study area has better ecological and economic efficiency. Therefore, the scale of planting of these crops can be appropriately expanded here. The planting area of grain maize and wheat should be reduced because the environmental cost per unit of economic output is high. This adjustment is conducive to reducing greenhouse gas emissions generally while still obtaining profit from agricultural activity, which is also consistent with China’s current agricultural policy. The Chinese government has successively issued policies designed to adjust the structure of the cropping systems since 2015, attempting to gradually expand the planting area of forage and cash crops in the entire northern agri-pastoral transition zone, including the area considered in this study [63]. Figure 11 shows the land use in the study area for the production of wheat, grain maize, and apple production from 2010 to 2020. The results reveal that there is little difference in wheat. The demand of China’s livestock development for animal feed has resulted in an increase in the price of grain maize during the past 10 years, resulting in a 12.71% increase in the proportion of all crop land used to grow grain maize. In addition, farmers in the study area had little experience in planting alfalfa and silage maize, leading to a small planting area for these crops. As the survey results show, only 17.00% and 4.61% of farmers grow alfalfa and silage maize, respectively. Therefore, we believe that it is necessary to provide farmers of alfalfa and silage maize the same subsidies as farmers who plant other cereal crops and to provide them with technical training and public service related to agriculture and crop fertilization.

5. Conclusions

Regional agricultural production efficiency and sustainable development are closely related to the crop types that farmers choose to plant. In order to provide the basis for the efficient use of land resources and the greenhouse gas abatement during crop production, five crops of wheat, grain maize, apple, alfalfa, and silage maize were studied in eastern Gansu Province by adopting the LCA method combined with the profit analysis method of input-output.
The results showed that the greenhouse gas emissions per hectare of land use of the five crops from large to small were: apple > grain maize > wheat > silage maize > alfalfa, while the emissions per ton of product output from small to large were: alfalfa < silage maize < grain maize < apple < wheat. The inventory sensitivity analysis of the crop greenhouse gas emissions showed that the use of agricultural materials such as chemical fertilizer, machinery, and agricultural film were the major source for the high carbon emissions of the five crops, of which the excessive use of chemical fertilizer accounted for the largest proportion. To reduce greenhouse gas emissions during the production of these five crops, farmers should pay special attention to conservative use of fertilization and improve the efficiency of using chemical fertilizer.
Combined with the results of the carbon footprint and economic performance, the greenhouse gas emissions per 10,000 yuan of net margin from small to large were silage maize < alfalfa < apple < grain maize < wheat. The carbon efficiency and profit ratio of grain maize and wheat were low, those of apple were not balanced, and those of alfalfa and silage maize were high. Therefore, according to the natural conditions and output performance in the study area, the land use of wheat and grain maize can be appropriately reduced, and the planting area of alfalfa and silage maize can be increased. Moreover, this conclusion is consistent with the goal of land use planning and structural adjustment of cropping systems in the agri-pastoral transition zone in north China.

Author Contributions

Conceptualization, X.C.; methodology, G.X. and D.L.; software, J.L. and D.L.; validation, G.X. and D.L.; formal analysis, D.L. and J.L.; investigation, D.L., J.L., H.Q. and S.S.; resources, X.C.; data curation, D.L.; writing—original draft preparation, D.L. and X.C.; writing—review and editing, D.L. and X.C.; visualization, D.L. and G.X.; supervision, X.C.; project administration, X.C.; funding acquisition, G.X. and X.C. All authors have read and agreed to the published version of the manuscript.

Funding

This study is supported by the National Natural Science Foundation of China (31702174), and the Key Science and Technology Projects of Gansu Province (2020-0103-SFC-0061).

Institutional Review Board Statement

Not applicable.

Informed Consent Statement

Not applicable.

Data Availability Statement

The data presented in this study are available upon request from the corresponding author.

Conflicts of Interest

The authors declare that they have no known competing financial interest or personal relationship that could have appeared to influence the work reported in this paper.

References

  1. Rogelj, J.; den Elzen, M.; Hoehne, N.; Fransen, T.; Fekete, H.; Winkler, H.; Chaeffer, R.S.; Ha, F.; Riahi, K.; Meinshausen, M. Paris Agreement climate proposals need a boost to keep warming well below 2 degrees C. Nature 2016, 534, 631–639. [Google Scholar] [CrossRef] [PubMed] [Green Version]
  2. Zheng, X.; Streimikiene, D.; Balezentis, T.; Mardani, A.; Cavallaro, F.; Liao, H. A review of greenhouse gas emission profiles, dynamics, and climate change mitigation efforts across the key climate change players. J. Clean. Prod. 2019, 234, 1113–1133. [Google Scholar] [CrossRef]
  3. Wei, L.U.; Yu-Shang, L.I.; Lee, Y.-K. Impact of the Paris Agreement on China’s Carbon Reduction and the Economy. J. Asian Stud. 2021, 24, 129–150. [Google Scholar]
  4. Sustainable Development Goals. Available online: http://www.fao.org/sustainable-development-goals/goals/goal-7/zh/ (accessed on 2 May 2022).
  5. World Agriculture towards 2030/2050: The 2012 Revision. Available online: http://www.fao.org/economic/esa (accessed on 2 May 2022).
  6. Martinez-Blanco, J.; Lazcano, C.; Christensen, T.H.; Munoz, P.; Rieradevall, J.; Moller, J.; Anton, A.; Boldrin, A. Compost benefits for agriculture evaluated by life cycle assessment. A review. Agron. Sustain. Dev. 2013, 33, 721–732. [Google Scholar] [CrossRef] [Green Version]
  7. Liu, Y.; Pan, X.; Li, J. A 1961–2010 record of fertilizer use, pesticide application and cereal yields: A review. Agron. Sustain. Dev. 2015, 35, 83–93. [Google Scholar] [CrossRef] [Green Version]
  8. Zhang, W. Global pesticide use: Profile, trend, cost/benefit and more. Proc. Int. Acad. Ecol. Environ. Sci. 2018, 8, 1. [Google Scholar]
  9. Sharma, G.D.; Shah, M.I.; Shahzad, U.; Jain, M.; Chopra, R. Exploring the nexus between agriculture and greenhouse gas emissions in BIMSTEC region: The role of renewable energy and human capital as moderators. J. Environ. Manag. 2021, 297, 113316. [Google Scholar] [CrossRef]
  10. Searchinger, T.D.; Wirsenius, S.; Beringer, T.; Dumas, P. Assessing the efficiency of changes in land use for mitigating climate change. Nature 2018, 564, 249. [Google Scholar] [CrossRef]
  11. Hoekstra, A.Y.; Wiedmann, T.O. Humanity’s unsustainable environmental footprint. Science 2014, 344, 1114–1117. [Google Scholar] [CrossRef]
  12. Hua, G.; Cheng, T.C.E.; Wang, S. Managing carbon footprints in inventory management. Int. J. Prod. Econ. 2011, 132, 178–185. [Google Scholar] [CrossRef]
  13. Davis, K.F.; Gephart, J.A.; Emery, K.A.; Leach, A.M.; Galloway, J.N.; D’Odorico, P. Meeting future food demand with current agricultural resources. Glob. Environ. Change-Human Policy Dimens. 2016, 39, 125–132. [Google Scholar] [CrossRef]
  14. Falcon, W.P. Transforming Traditional Agriculture—Schulitz, TW. Am. J. Agr. Econ. 1988, 70, 198–200. [Google Scholar] [CrossRef]
  15. Arbuckle, J.G., Jr.; Morton, L.W.; Hobbs, J. Understanding Farmer Perspectives on Climate Change Adaptation and Mitigation: The Roles of Trust in Sources of Climate Information, Climate Change Beliefs, and Perceived Risk. Environ. Behav. 2015, 47, 205–234. [Google Scholar] [CrossRef] [PubMed]
  16. Beukes, P.C.; Gregorini, P.; Romera, A.J.; Levy, G.; Waghorn, G.C. Improving production efficiency as a strategy to mitigate greenhouse gas emissions on pastoral dairy farms in New Zealand. Agric. Ecosyst. Environ. 2010, 136, 358–365. [Google Scholar] [CrossRef]
  17. O’Brien, D.; Shalloo, L.; Grainger, C.; Buckley, F.; Horan, B.; Wallace, M. The influence of strain of Holstein-Friesian cow and feeding system on greenhouse gas emissions from pastoral dairy farms. J. Dairy Sci. 2010, 93, 3390–3402. [Google Scholar] [CrossRef] [Green Version]
  18. Bonnin, D.; Tabacco, E.; Borreani, G. Variability of greenhouse gas emissions and economic performances on 10 Piedmontese beef farms in North Italy. Agric. Syst. 2021, 194, 103282. [Google Scholar] [CrossRef]
  19. Ling, L.; Shuai, Y.; Xu, Y.; Zhang, Z.; Wang, B.; Liangzhi, Y.; Sun, Z.; Zhang, H.; Zhan, M.; Li, C.; et al. Comparing rice production systems in China: Economic output and carbon footprint. Sci. Total Environ. 2021, 791, 147890. [Google Scholar]
  20. Nolan, S.; Unkovich, M.; Yuying, S.; Lingling, L.; Bellotti, W. Farming systems of the Loess Plateau, Gansu Province, China. Agric. Ecosyst. Environ. 2008, 124, 13–23. [Google Scholar] [CrossRef]
  21. Ren, Y.; Lu, Y.; Fu, B.; Comber, A.; Li, T.; Hu, J. Driving Factors of Land Change in China’s Loess Plateau: Quantification Using Geographically Weighted Regression and Management Implications. Remote Sens. 2020, 12, 453. [Google Scholar] [CrossRef] [Green Version]
  22. Bindi, M.; Olesen, J.E. The responses of agriculture in Europe to climate change. Reg. Environ. Chang. 2011, 11, S151–S158. [Google Scholar] [CrossRef]
  23. Altieri, M.A.; Nicholls, C.I.; Henao, A.; Lana, M.A. Agroecology and the design of climate change-resilient farming systems. Agron. Sustain. Dev. 2015, 35, 869–890. [Google Scholar] [CrossRef] [Green Version]
  24. Yang, X.; Li, Z.; Cui, S.; Cao, Q.; Deng, J.; Lai, X.; Shen, Y. Cropping system productivity and evapotranspiration in the semiarid Loess Plateau of China under future temperature and precipitation changes: An APSIM-based analysis of rotational vs. continuous systems. Agric. Water Manag. 2020, 229, 105959. [Google Scholar] [CrossRef]
  25. Statistical Data. Available online: http://tjj.gansu.gov.cn/tjj/c109464/info_disp.shtml (accessed on 2 May 2022).
  26. Corominas, L.; Foley, J.; Guest, J.S.; Hospido, A.; Larsen, H.F.; Morera, S.; Shaw, A. Life cycle assessment applied to wastewater treatment: State of the art. Water Res. 2013, 47, 5480–5492. [Google Scholar] [CrossRef] [PubMed]
  27. Hellweg, S.; Mila i Canals, L. Emerging approaches, challenges and opportunities in life cycle assessment. Science 2014, 344, 1109–1113. [Google Scholar] [CrossRef]
  28. Klopffer, W. Life-cycle based methods for sustainable product development. Int. J. Life Cycle Asses 2003, 8, 157–159. [Google Scholar] [CrossRef]
  29. Tillman, A.M. Environmental Assessment and Management in the Food Industry: Life Cycle Assessment and Related Approaches; Sonesson, U., Berlin, J., Ziegler, F., Eds.; Woodhead Publishing Series in Food Science Technology and Nutrition: Berlin, Germany, 2010; pp. 59–82. [Google Scholar]
  30. Pryshlakivsky, J.; Searcy, C. Life Cycle Assessment as a decision-making tool: Practitioner and managerial considerations. J. Clean. Prod. 2021, 309, 127344. [Google Scholar] [CrossRef]
  31. Goglio, P.; Smith, W.N.; Worth, D.E.; Grant, B.B.; Desjardins, R.L.; Chen, W.; Tenuta, M.; McConkey, B.G.; Williams, A.; Burgess, P. Development of Crop.LCA, an adaptable screening life cycle assessment tool for agricultural systems: A Canadian scenario assessment. J. Clean. Prod. 2018, 172, 3770–3780. [Google Scholar] [CrossRef] [Green Version]
  32. O’Brien, D.; Hennessy, T.; Moran, B.; Shalloo, L. Relating the carbon footprint of milk from Irish dairy farms to economic performance. J. Dairy Sci. 2015, 98, 7394–7407. [Google Scholar] [CrossRef] [Green Version]
  33. Lambotte, M.; De Cara, S.; Brocas, C.; Bellassen, V. Carbon footprint and economic performance of dairy farms: The case of protected designation of origin farms in France. Agric. Syst. 2021, 186, 102979. [Google Scholar] [CrossRef]
  34. Wei, W.; Larrey-Lassalle, P.; Faure, T.; Dumoulin, N.; Roux, P.; Mathias, J.-D. How to Conduct a Proper Sensitivity Analysis in Life Cycle Assessment: Taking into Account Correlations within LCI Data and Interactions within the LCA Calculation Model. Environ. Sci. Technol. 2015, 49, 377–385. [Google Scholar] [CrossRef]
  35. Fantin, V.; Righi, S.; Rondini, I.; Masoni, P. Environmental assessment of wheat and maize production in an Italian farmers’ cooperative. J. Clean. Prod. 2017, 140, 631–643. [Google Scholar] [CrossRef]
  36. Keyes, S.; Tyedmers, P.; Beazley, K. Evaluating the environmental impacts of conventional and organic apple production in Nova Scotia, Canada, through life cycle assessment. J. Clean. Prod. 2015, 104, 40–51. [Google Scholar] [CrossRef] [Green Version]
  37. Liang, L.; Lal, R.; Ridoutt, B.G.; Du, Z.; Wang, D.; Wang, L.; Wu, W.; Zhao, G. Life Cycle Assessment of China’s agroecosystems. Ecol. Indic. 2018, 88, 341–350. (In Chinese) [Google Scholar] [CrossRef]
  38. Yang, X.; Sun, B.; Gao, W.; Chen, Y.; Sui, P. Carbon footprints of grain-, forage-, and energy-based cropping systems in the North China plain. Int. J. Life Cycle Assess. 2019, 24, 371–385. [Google Scholar] [CrossRef]
  39. Liu, Y.; Yuan, Z.; Guo, L.; Sun, B.; Kong, W.; Tang, S. Carbon footprint of crop production in China from 1993 to 2013 and its spatial distribution. J. Appl. Ecol. 2017, 28, 2577–2587. [Google Scholar]
  40. Yan, Z.; Li, W.; Yan, T.; Chang, S.; Hou, F. Evaluation of energy balances and greenhouse gas emissions from different agricultural production systems in Minqin Oasis, China. PeerJ 2019, 7, e6890. [Google Scholar] [CrossRef] [Green Version]
  41. Chen, X.; Ma, C.; Zhou, H.; Liu, Y.; Huang, X.; Wang, M.; Cai, Y.; Su, D.; Muneer, M.A.; Guo, M.; et al. Identifying the main crops and key factors determining the carbon footprint of crop production in China, 2001–2018. Resour. Conserv. Recycl. 2021, 172, 105661. [Google Scholar] [CrossRef]
  42. Wang, N.; Joost, W.; Zhang, F.-S. Towards sustainable intensification of apple production in China-Yield gaps and nutrient use efficiency in apple farming systems. J. Integr. Agric. 2016, 15, 716–725. [Google Scholar] [CrossRef] [Green Version]
  43. Li, Z.; Zhang, Q.; Wei, W.; Cui, S.; Tang, W.; Li, Y. Determining effects of water and nitrogen inputs on wheat yield and water productivity and nitrogen use efficiency in China: A quantitative synthesis. Agric. Water Manag. 2020, 242, 106397. [Google Scholar] [CrossRef]
  44. Wu, Y. Chemical fertilizer use efficiency and its determinants in China’s farming sector Implications for environmental protection. China Agric. Econ. Rev. 2011, 3, 117–130. [Google Scholar] [CrossRef]
  45. Zhang, G.; Wang, X.; Sun, B.; Zhao, H.; Lu, F.; Zhang, L. Status of mineral nitrogen fertilization and net mitigation potential of the state fertilization recommendation in Chinese cropland. Agric. Syst. 2016, 146, 1–10. [Google Scholar] [CrossRef]
  46. Ji, Y.; Zhang, H.; Lu, W.; Liu, H. Differentiation, incomplete information, and farmers’ excessive application of chemical fertilizers. J. Agric. Technol. Econ. 2016, 2, 14–22. (In Chinese) [Google Scholar]
  47. Li, S.; Lei, Y.; Zhang, Y.; Liu, J.; Shi, X.; Jia, H.; Wang, C.; Chen, F.; Chu, Q. Rational trade-offs between yield increase and fertilizer inputs are essential for sustainable intensification: A case study in wheat-maize cropping systems in China. Sci. Total Environ. 2019, 679, 328–336. [Google Scholar] [CrossRef] [PubMed]
  48. Wang, P.; Zhang, W.; Li, M.; Han, Y. Does Fertilizer Education Program Increase the Technical Efficiency of Chemical Fertilizer Use? Evidence from Wheat Production in China. Sustainability 2019, 11, 543. [Google Scholar] [CrossRef] [Green Version]
  49. Duan, Y.; Xu, M.; Gao, S.; Liu, H.; Huang, S.; Wang, B. Long-term incorporation of manure with chemical fertilizers reduced total nitrogen loss in rain-fed cropping systems. Sci. Rep. 2016, 6, 33611. [Google Scholar] [CrossRef] [Green Version]
  50. Yan, L.; Wang, Y.; Tumbalam, P.; Zhang, T.; Gao, Q.; Zhang, W.; Wei, D.; Yaa, O.-K. Spatiotemporal Distribution of Chemical Fertilizer Application and Manure Application Potential in China. Environ. Eng. Sci. 2019, 36, 1337–1348. [Google Scholar] [CrossRef]
  51. Rui, Y.-K.; Peng, Y.-F.; Wang, Z.-R.; Shen, J.-B. Stem perimeter, height and biomass of maize (Zea mays L.) grown under different N fertilization regimes in Beijing, China. Int. J. Plant Prod. 2009, 3, 85–90. [Google Scholar]
  52. Li, H.; Zhang, W.; Zhang, F.; Du, F.; Li, L. Chemical fertilizer use and efficiency change of main grain crops in China. J. Plant Nutr. Fert. 2010, 16, 1136–1143. [Google Scholar]
  53. Demurger, S.; Xu, H. Return Migrants: The Rise of New Entrepreneurs in Rural China. World Dev. 2011, 39, 1847–1861. [Google Scholar] [CrossRef]
  54. Liang, Z.; Zhang, L.; Zhang, J. Land consolidation and fertilizer reduction: Quasi-natural experimental evidence from China’s well-facilitated capital farmland construction. Chin. Rural Econ. 2021, 4, 123–144. (In Chinese) [Google Scholar]
  55. Wang, X.; Chen, Y.; Sui, P.; Yan, P.; Yang, X.; Gao, W. Preliminary analysis on economic and environmental consequences of grain production on different farm sizes in North China Plain. Agric. Syst. 2017, 153, 181–189. [Google Scholar] [CrossRef]
  56. Wang, X.; Bai, Y. The global Minmax k-means algorithm. SpringerPlus 2016, 5, 1665. [Google Scholar] [CrossRef] [PubMed] [Green Version]
  57. Xia, L.; Ti, C.; Li, B.; Xia, Y.; Yan, X. Greenhouse gas emissions and reactive nitrogen releases during the life-cycles of staple food production in China and their mitigation potential. Sci. Total Environ. 2016, 556, 116–125. [Google Scholar] [CrossRef] [PubMed]
  58. Zhang, D.; Feng, J. Efficiency of wheat production in China: Results based on DEA method. J. Agric. Technol. Econ. 2005, 3, 48–54. (In Chinese) [Google Scholar]
  59. Yuan, Q.; Han, Y. Evaluation analysis of wheat total factor productivity in China—Based on DEA-Malmquist index method. Agric. Technol. 2018, 30, 19–24. (In Chinese) [Google Scholar]
  60. Wang, D.; Feng, H.; Liu, X.; Li, Y.; Zhou, L.; Zhang, A.; Dyck, M. Effects of gravel mulching on yield and multilevel water use efficiency of wheat-maize cropping system in semi-arid region of Northwest China. Field Crop. Res. 2018, 218, 201–212. [Google Scholar] [CrossRef]
  61. Ren, H.; Han, K.; Liu, Y.; Zhao, Y.; Zhang, L.; He, Q.; Li, Z.; Zhang, J.; Liu, P.; Wang, H.; et al. Improving smallholder farmers’ maize yields and economic benefits under sustainable crop intensification in the North China Plain. Sci. Total Environ. 2021, 763, 143035. [Google Scholar] [CrossRef]
  62. Sun, T.; Zhao, C.; Feng, X.; Yin, W.; Gou, Z.; Lal, R.; Deng, A.; Chai, Q.; Song, Z.; Zhang, W. Maize-based intercropping systems achieve higher productivity and profitability with lesser environmental footprint in a water-scarce region of northwest China. Food Energy Secur. 2021, 10, e260. [Google Scholar] [CrossRef]
  63. Notice of the Ministry of Agriculture on Printing and Distributing the Implementation Plan of Changing Grain to Feed. Available online: http://www.moa.gov.cn/nybgb/2017/dlq/201712/t20171231_6133718.htm (accessed on 2 May 2022).
Figure 1. Study area in the cities of Pingliang and Qingyang, Gansu Province and land use patterns; an inset map shows the location of the study area within the administrative areas of China.
Sustainability 14 05844 g001
Figure 2. System boundary of the life cycle assessment in cropping systems. There are four main subsystems for apple, grain maize, and wheat; but three for alfalfa and silage maize due to no coproducts treatment.
Sustainability 14 05844 g002
Figure 3. Greenhouse gas emissions per ha produced by five dominant crops in the study area: alfalfa, apple, grain maize, silage maize, and wheat. The square, middle line, and red dot represent the average value, median, and outlier, respectively. Note: some outliers were omitted to ensure that some of the boxes were not over-compressed.
Sustainability 14 05844 g003
Figure 4. Greenhouse gas emissions per ton of product produced by five dominant crops in the study area: alfalfa, apple, grain maize, silage maize, and wheat. The square, middle line, and red dot represent the average value, median, and outlier, respectively. Note: some outliers were omitted to ensure that some of the boxes were not over-compressed.
Sustainability 14 05844 g004
Figure 5. Greenhouse gas emissions of five dominant crops per 10,000 yuan in the study area: alfalfa, apple, grain maize, silage maize, and wheat; the square, middle line, and red dot represent the average value, median and outlier, respectively. Part of wheat farms do not show because they could not make ends meet. Note: some outliers were omitted to ensure that some of the boxes were not over-compressed.
Sustainability 14 05844 g005
Figure 6. Correlations between greenhouse gas emissions and gross profit of alfalfa, apple, grain maize, silage maize, and wheat. The color band is the 95% confidence interval.
Sustainability 14 05844 g006
Figure 7. Correlations between greenhouse gas emissions and net profit of alfalfa, apple, grain maize, silage maize, and wheat. The color band is the 95% confidence interval.
Sustainability 14 05844 g007
Figure 8. Inventory sensitivity of greenhouse gas emissions of the five crops (per ha benchmark). The contribution proportion relates to the total emissions of each crop.
Sustainability 14 05844 g008
Figure 9. A pairwise correlation analysis of fertilizer for the five crops. The scatter diagram in the lower left shows the distribution of the amount of pair fertilizers for five crops, and the color band is the 95% confidence interval; the middle diagonal shows the distribution of the amount of each fertilizer used in the production of five crops; and the upper right shows the correlation coefficient and its significance for pair fertilizers for five crops. NA indicates that all the sampled farmer households do not use potassium fertilizer in the production of this crop. Note: *** p < 0.001, ** p < 0.01, * p < 0.05.
Sustainability 14 05844 g009
Figure 10. Clustering analysis of five crops by the K-means method, using the features of greenhouse gas emissions per 10,000 yuan and profit ratio.
Sustainability 14 05844 g010
Figure 11. Land use change in wheat, grain maize, and apple production in the study area for 2010–2020. Note: Alfalfa and silage maize were not included due to a lack of statistics in the early part of this period.
Sustainability 14 05844 g011
Table 1. Average economic performance of five main crops in the study area: apple, grain maize, wheat, alfalfa, and silage maize.
Crop SpeciesOutputInputEconomic
Performance
YieldPriceGross MarginSeedFertilizerPesticideMulchMachineryEmployeeTotalNet ReturnProfit Ratio
(kg/ha)(CNY/kg)(CNY/ha)(CNY/ha)(CNY/ha)(CNY/ha)(CNY/ha)(CNY/ha)(CNY/ha)(CNY/ha)(CNY/ha)(%)
Apple17,680.003.9069,000.000.0019,140.003459.00672.901780.002355.0027,410.0041,590.001.43
Grain Maize7916.001.7313,707.001171.002595.00129.501126.002226.0012.357260.006447.000.89
Wheat3289.002.066787.001198.002373.00143.2043.732507.003.866269.00518.000.08
Alfalfa6884.001.027023.00473.70532.1021.2943.391184.003.102257.004766.002.11
Silage Maize60,580.000.6438,978.00776.302121.00145.70871.905875.0038.139828.0029,150.002.97
Yield is exclusive of coproducts; apple costs no seed by grafting and propagating; fertilizer is composed of cost of nitrogen fertilizer, phosphorus fertilizer, potassium fertilizer, compound fertilizer, and farm manure; machinery is composed of operation cost of field operations and harvesting; labor cost consists only of the charges of hired labor.
Publisher’s Note: MDPI stays neutral with regard to jurisdictional claims in published maps and institutional affiliations.

