Article

Simulation and Evaluation of Hydrothermal Conditions in Crop Growth Period: A Case Study of Highland Barley in the Qinghai-Tibet Plateau

1
School of Geographic Science, Qinghai Normal University, Xining 810008, China
2
Faculty of Geographical Science, Beijing Normal University, Beijing 100875, China
3
Academy of Plateau Science and Sustainability, Xining 810008, China
*
Author to whom correspondence should be addressed.
Sustainability 2022, 14(10), 5932; https://0-doi-org.brum.beds.ac.uk/10.3390/su14105932
Submission received: 26 April 2022 / Revised: 11 May 2022 / Accepted: 11 May 2022 / Published: 13 May 2022

Abstract

:
WXGEN, a weather generator model based on stochastic process theory and mathematical statistics, was widely used in hydrological monitoring models, crop yield estimation models and derived fields of meteorological data. In this study, we used WXGEN to evaluate the simulation accuracy of hydrothermal conditions in the highlands of the Qinghai–Tibet Plateau. Results showed that: (1) The Markovian chain transfer parameters P(W|D) and P(W|W) of each station were between 0.03–0.30 and 0.12–0.74, which was basically consistent with the temporal and spatial distribution of actual precipitation; (2) In the thermal data simulation, more than 96% of the meteorological stations passed the 0.05 level in three different significance tests of monthly mean minimum and maximum temperature and solar radiation, and the measured deviations of simulated annual mean temperature and solar radiation were 0.686 °C and 1.65 MJ/m2, respectively. In all, 94% of the stations in the hydrological simulation passed the monthly precipitation significance test; (3) The simulated vs. measured deviations of annual precipitation, heavy rain days and wet days were 8.04 mm, 1.023 d and 8.374 d, respectively; (4) The simulation of extreme hydrothermal conditions that may affect the yield of highland barley was very close to the measured situation, and the R2 of simulation and measured value was all above 0.85. The simulation of freezing damage was less accurate, but also higher than 0.85.

1. Introduction

Weather generators are models that generate meteorological data by using random process theory combined with probability theory and mathematical statistics. Their main function is to generate high-resolution daily and hourly meteorological data from low-resolution meteorological data in areas without meteorological stations. They have been used for agricultural yield estimation [1], soil erosion modelling [2] and hydrological modelling [3,4]. In recent years, weather generators have been used successfully in the study of regional drainage basin or local climate change and crop yield estimation in the context of global warming [5,6,7]. The use of a random weather generator has two main objectives: one is to generate a high-resolution time series of meteorological data with statistical characteristics, and the other is to expand the simulation of existing time series of meteorological data to places that have no or missing observations [8]. The weather generator can simulate daily and even hourly weather data in the region according to the characteristics of regional weather and climate. The meteorological data that can be generated include: precipitation, maximum temperature, minimum temperature, solar radiation, wind speed. Common weather generators include: WXGEN, CLIGEN, LARS-WG, MODAWEC, Wea-GETs.
The first research on weather generators can be traced back to Israeli scientists using a Markov chain to predict the dry and wet days of Tel Aviv [9]. Initially, weather generators were mainly used to simulate the average temperature and evaporation [10] and predict crop diseases and pests [11]. Later, WXGEN, which was widely used thereafter, was created and introduced into agricultural yield estimation [2]. A Windows program was developed for weather generators, named LARS-WG [12]. The weather generator MODAWEC was combined with the Environmental Policy Integrated Climate (EPIC, originally known as Erosion Productivity Impact Calculator) model, as WXGEN could not be directly used in the EPIC model [13]. Semi-empirical models have been introduced in weather generators [14]. Weather generators have been used in the simulation and evaluation of temperature and precipitation under climate change scenarios [15], downscaling of meteorological data [16], and to fill in missing measurement data and grain yield prediction [17].
In recent years, research on weather generators has mainly focused on the use, test and evaluation of simulations, and the adjustment of model parameters [18,19] to improve simulations at regional level. For example, based on the model principles and the characteristics of China’s climate, China Agricultural University [20], National Climate Center of China Meteorological Administration [21] and other institutions have successively developed weather generators suitable for China. Weather generators have been widely used and discussed in crop yield models [22,23]. Research has mostly concentrated on wheat [24,25] and corn [26], and the scope of application has focused on the main production areas of these crops.
Highland barley is a variety of barley belonging to the gramineous family unique to the Qinghai–Tibet Plateau. It is the main food source of people on the Plateau and it plays an extremely important role in human activities and economic and social development on the Qinghai–Tibet Plateau [27]. Highland barley is the main food of herdsmen in the Qinghai–Tibet Plateau; taking the Tibet as an example, it accounts for more than 70% of herdsmen’s food. Meanwhile, the highland barley industry, including related food, drinks, drugs and health products, has developed rapidly in the last 20 years. [28]. Faced with the uncertainty of global climate change and the multiple risks faced on the Qinghai–Tibet Plateau [29], it is of great significance for the development of Plateau agriculture to carry out research on the meteorological conditions and yield of highland barley growing areas. There are few meteorological stations in the Qinghai–Tibet Plateau, the observation data are generally missing, are often with low resolution, and the time series of meteorological data are mostly incomplete. Therefore, it is difficult to directly use meteorological observation data to study the meteorological conditions and yield of crops in the Qinghai–Tibet Plateau. Weather generators can produce substitute data with an ideal length and resolution, but there is little simulation research in the Qinghai–Tibet Plateau. Month scale meteorological data in the highland barley planting area of the Qinghai–Tibet Plateau are relatively complete. In this paper, we take the temperature, solar radiation and precipitation index of the highland barley planting area as the reference point to explore the reduction degree of the weather generator of hydrothermal conditions during the crop growth period on the Plateau. If the simulations of the weather generator in the highland barley planting area are good in the Qinghai–Tibet Plateau, the model can accurately simulate the hydrological and thermal conditions during the barley crop growth period. The model can also be used to simulate the hydrological and thermal conditions of other crops in the growth period on this Plateau. In addition, the simulation results of the model in this area can be extended to other unmonitored areas.
We first evaluated the applicability of the Markov chain, which is the theoretical basis model of the weather generator, in the Qinghai–Tibet Plateau. Secondly, the efficiency of the weather generator to restore the weather data was evaluated, focusing on monthly and yearly average temperature, solar radiation, precipitation during the growth period of highland barley, as well as extreme weather conditions that may affect the yield. Our study can provide theoretical support for the application of the model in crop yield simulation and disaster damage research in the context of future climate change in the Qinghai–Tibet Plateau.

2. Materials and Methods
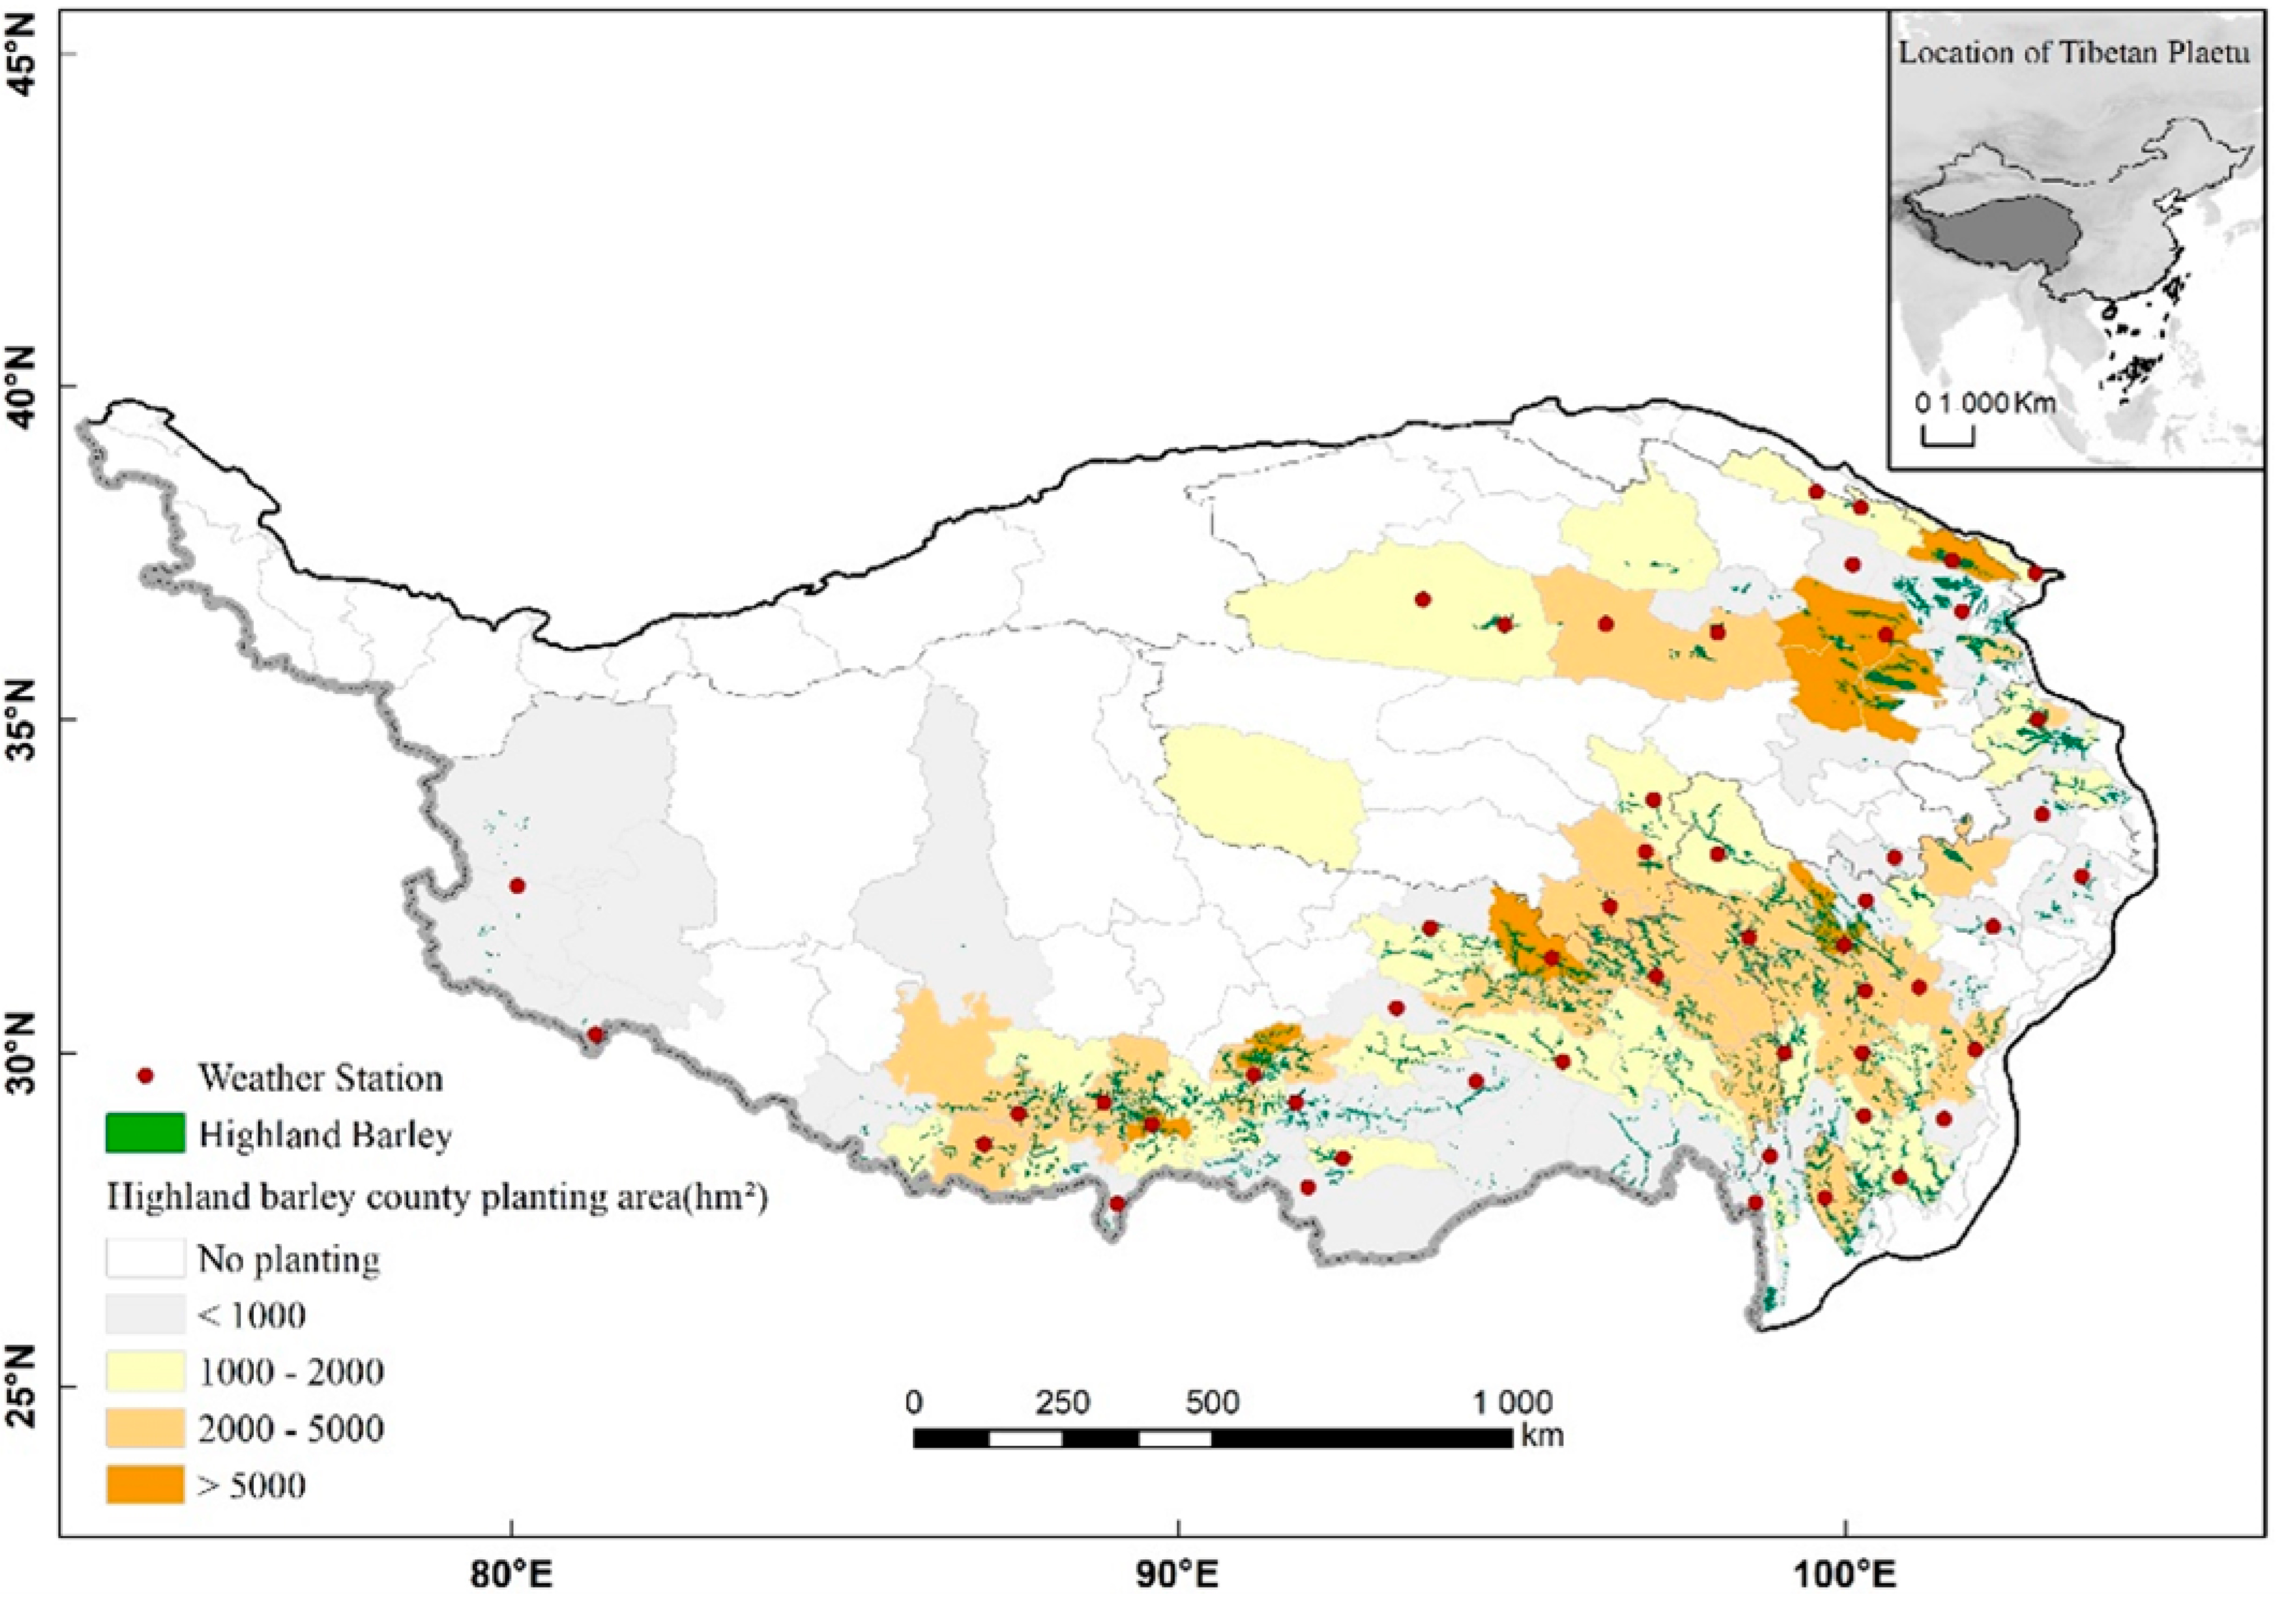
The methodology applied in this study included the following steps: (1) Compilation of meteorological data in the highland barley planting area, (2) Data preprocessing with Matlab v2019a, (3) Generation of weather data using the WXGEN weather generator.

2.1. Study Area

The Qinghai–Tibet Plateau has the highest average altitude in the world and is the largest plateau in China. It is known as the “Roof of the world” or the “Third pole” [30,31]. The average annual temperature in the area above 4500 m is lower than 0 °C, and the solar radiation on the plateau is as high as 540–800 kJ/(cm2·a), 50–100% higher than other areas at the same latitude. With high altitude, cold, lack of oxygen, and strong solar radiation, most areas are not suitable for the growth of many crops. Highland barley is the main crop grown on the Qinghai–Tibet Plateau, and its planting area is widely distributed on the whole plateau. The output of each county and the actual planting distribution of highland barley [32] are shown in Figure 1. The main production areas are concentrated in Lhasa, Shigatse, Changdu and Shannan in southern Tibet; Haibei, Haixi and Hainan Prefecture in Qinghai Province; Ganzi and Aba prefectures in the northwest of Sichuan Province; Gannan Prefecture in the south of Gansu Province; and Diqing and Lijiang City in the north of Yunnan Province [28]. The growth period of “Dulihuang”, the most common highland barley variety in the Qinghai–Tibet Plateau, is roughly from April to September. Its growth period includes eight stages: sowing (late April), emergence (early May), tillering (late May), jointing (mid June), booting (late June), heading (early July), filling (mid July) and maturation period (early September).

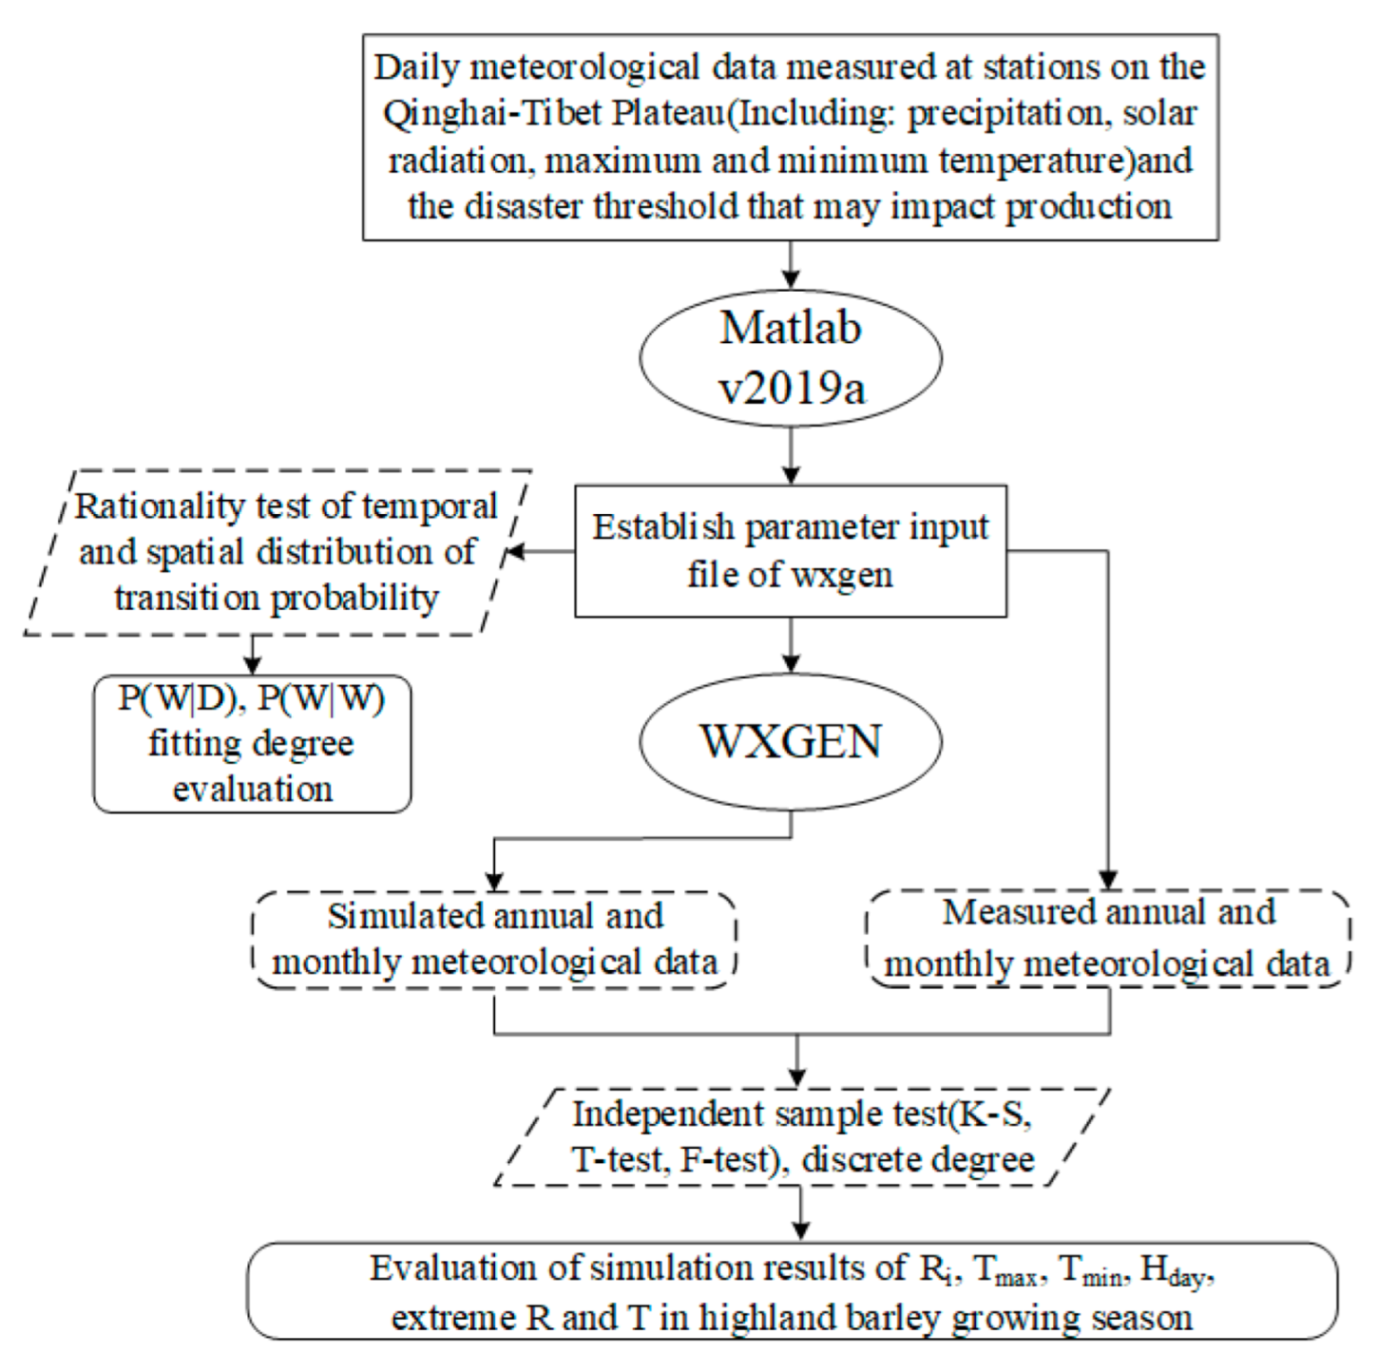
2.2. Models and Data

This study uses WXGEN v.1011 weather generator (source: Texas A & M University https://epicapex.tamu.edu/software/) as well daily precipitation, temperature and solar radiation data; there are 71 meteorological stations in the region, of which 51 are highland barley meteorological stations. (source: China Meteorological Data Network http://data.cma.cn). We collected data on hydrological and thermal conditions that may affect the yield of highland barley in the typical highland barley planting area of Qinghai Province (source: Menyuan County Meteorological Bureau). According to the observed meteorological data in the highland barley growth area, the annual and monthly average temperature and precipitation at different growth stages, we selected thresholds of extreme water and heat indices affecting the development of highland barley to simulate and analyze the hydrological and thermal indexes during the growth period (Table 1).

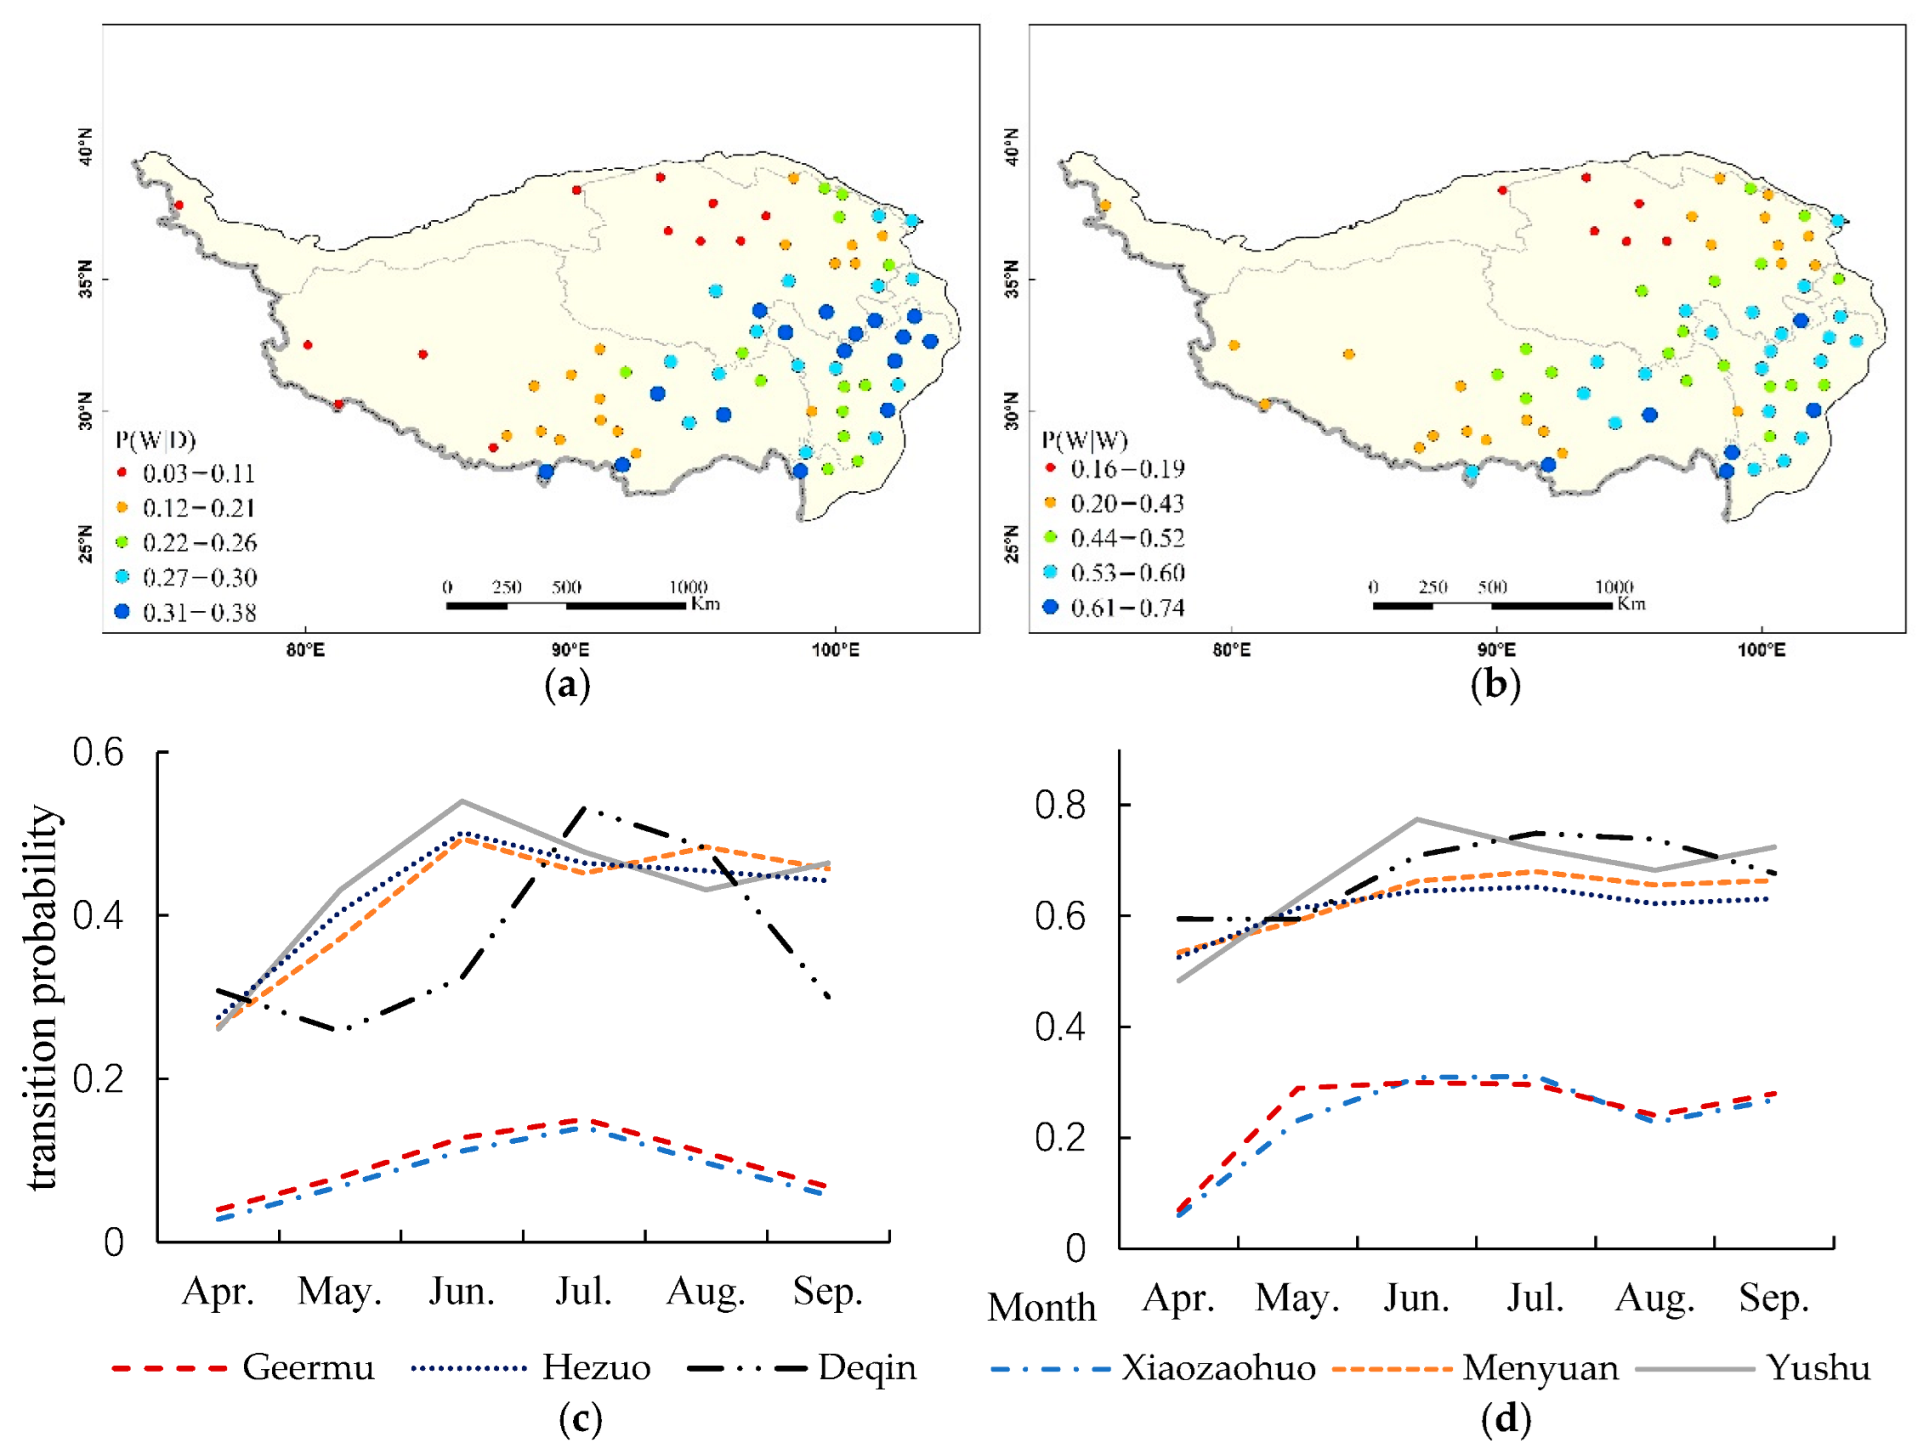
2.3. Simulation of Transition Probability

The WXGEN weather generator uses a Markov chain to simulate a precipitation sequence. First, the probability of dry and wet days is calculated according to the transfer probability of the Markov chain, and then the precipitation is calculated according to the dry and wet days. After the precipitation data are simulated, other weather conditions are generated according to the precipitation. In the Markov chain model, assuming that a day with precipitation greater than or equal to 0.1 mm is a wet day (precipitation day), which is recorded as P ( W ) , a day with precipitation less than 0.1 mm is a dry day (no precipitation day), which is recorded as P ( D ) . P ( W | D )   is the probability of wet days (precipitation) after dry days, P ( W | W ) is the probability of continuous precipitation for more than 24 h after a wet day. These are calculated as follows:
P ( W ) = n W n
P ( W | D ) = b 1 × P W
P ( W | W ) = 1.0 b 1 + P ( W | D )
where, P ( W )   is the probability of rainy days, n W is the number of rainy days and   n   is the number of days in a month. In the calculation of P ( W | D ) , b 1 is an empirical parameter, usually between 0.6–0.9. In the calculation of P ( W | W ) , when b 1 = 1.0 , the number of wet days does not affect the rainfall probability: P ( W | D ) = P ( W | W ) = P ( W ) . Conversely, a low b 1 value will produce a high rainfall probability: b 1 = 0 , P ( W | W ) = 1.0 , P ( W | D ) = 0 . WXGEN generally adopts b 1 = 0.75   as default.

2.4. Simulation of Precipitation

Precipitation simulation is the simulation of dry and wet conditions and daily precipitation after calculating the transfer probability. After calculating the precipitation transfer probability P ( W | D ) and P ( W | W ) , a random number R N between 0–1 is generated according to the first-order Markov chain model. When the initial day of the simulated time series is a dry day, the model compares P ( W | D ) with the probability of wet days after dry days; if P ( W | W ) > R N , a precipitation event occurs when a dry day is followed by a wet day. When the previous day of the simulated time series is a wet day, the model uses P ( W | W ) for comparison; if P ( W | W ) > R N , then precipitation continues, and the next day is a wet day. The precipitation state of the next day is determined by the previous day. As the simulation continues, a random precipitation time series can be generated.
For the calculation of precipitation, the model uses the following exponential distribution:
R i = R W × ( l n ( R N ) )
where,
R W = R M / n w
On rainy days, daily precipitation is generated by the modified exponential equation. R i is the daily precipitation on day i , R W is the average wet daily precipitation of each month, and R N is a uniform random number. R W is the average monthly precipitation R M divided by the average number of wet days per month   n w .

2.5. Simulation of Temperature and Solar Radiation

The simulation of air temperature is based on an equilibrium process model. The residual element is multiplied by the monthly standard deviation and added to the monthly average. This is calculated as follows:
T m a x = μ m a x m o n   + χ i 1 · δ m a x m o n
T m i n = μ m i n m o n   + χ i 2 · δ m i n m o n
H d a y = μ r a d m o n   + χ i 3 · δ r a d m o n
where, P ( W )   is the probability of rainy days, n W is the number of rainy days and   n   is the number of days in a month; In the calculation of P ( W | D ) , b 1 is an empirical parameter, usually between 0.6–0.9; P ( W | W ) , when b 1 = 1.0 , the number of wet days does not affect the rainfall probability: P ( W | D ) = P ( W | W ) = P ( W ) . Conversely, low b 1 value will produce a heavy precipitation day effect: b 1 = 0 , P ( W | W ) = 1.0 , P ( W | D ) = 0 . WXGEN generally adopts b 1 = 0.75   as default.

2.6. Experimental Protocol

This paper uses WXGEN to simulate daily meteorological data, and then compares the results with the measured meteorological data in the highland barley planting area of the Qinghai–Tibet Plateau. This is done in the following five steps: (1) Based on the daily precipitation data of Qinghai–Tibet Plateau, call Matlab v2019a to establish the input file of the parameters required by WXGEN; (2) Calculate the transition probability and evaluate its temporal and spatial distribution, the theoretical basis of WXGEN; (3) Call WXGEN to simulate precipitation, minimum and maximum temperature and solar radiation; (4) Carry out an independent sample test and a dispersion test on simulated and measured meteorological data, then analyze the fitting degree of simulation results; (5) Based on the measured extreme weather indicators affecting crop yield and the simulated daily temperature and precipitation data, analyze the fitting degree of extreme weather affecting crop yield.
The overall research framework for the study is shown in Figure 2.

3. Results

3.1. Analysis of Precipitation Transition Probability

Using the protocol described above, we calculated the probability of precipitation occurrence P ( W | D ) and the probability of continuous precipitation P ( W | W ) in the annual precipitation transfer probability of each meteorological station from 1961 to 2020. From Figure 3, the P ( W | D ) of each meteorological station is between 0.03–0.38, which is generally lower than for China as a whole [33]. The high value areas of P ( W | D ) are concentrated in the south of Qinghai, north of Sichuan, northwest of Yunnan and south and east of Tibet, ranging from 0.03 to 0.38. Under the influence of the southwest monsoon, these areas have abundant water vapor. On the Plateau, including central and Western Tibet, central and Northern Qinghai and southern Xinjiang, P ( W | D ) is between 0.03–0.21, and the probability of precipitation is low. The precipitation probability in the southern margin of Qilian mountains, an area of medium precipitation probability, ranges from 0.21 to 0.30. P ( W | W ) reflects the probability of continuous precipitation over one day. The overall distribution pattern is basically the same as P ( W | D ) . The high value P ( W | W ) areas, between 0.53 and 0.74, are concentrated in the south of eastern Tibet, the south of Qinghai, the north of Sichuan and the northwest of Yunnan. These areas are located in the front of the southwest monsoon, especially in the southeast of Tibet and the west of Yunnan. Affected by monsoons, these areas are the rainy centers of southwest China. The western, central and northern parts of the plateau are the low value areas of P ( W | W ) , ranging from 0.16 to 0.43, under the two probabilities of P ( W | D ) or P ( W | W ) . In the rainy area of Southwest China, there are some relatively arid areas, which may be related to the distribution of dry-hot valleys in Hengduan Mountain region.
The distribution of P ( W | D ) and P ( W | W ) during the growth period of highland barley varies greatly with the season. From Figure 3, the distribution of P ( W | D ) is generally low in spring, high in summer and autumn, and the peak appears in summer. P ( W | D ) varies with the region. The Xiaozaohuo and Golmud, with low precipitation, have little change during the year, and the difference between the lowest month and the highest month is only about 0.1. In Deqin, Yushu and other areas with higher precipitation, the change of P ( W | D ) during the year is obvious, especially in the late spring and early summer. At the same time, the gap between the lowest month and the highest month is larger, up to about 0.5. The monthly variation of P ( W | W ) is relatively gentle, higher in June, July and September, but lower in other months. In areas with less precipitation, such as Xiaozaohuo and Golmud, the difference between the highest and lowest in the year is about 0.2, and the peak appears in late spring and early summer. In Deqin, Yushu and other areas with higher precipitation, the difference between the monthly maximum and minimum can reach more than 0.6, and the peak value lags slightly, in July and August. In conclusion, the distribution of the Markov chain precipitation transition probability in the Qinghai–Tibet Plateau is consistent with the actual situation, and the actual distribution of precipitation in different months and seasons in the plateau is well restored. Therefore, the use of the WXGEN weather generator in the Qinghai–Tibet Plateau is validated.

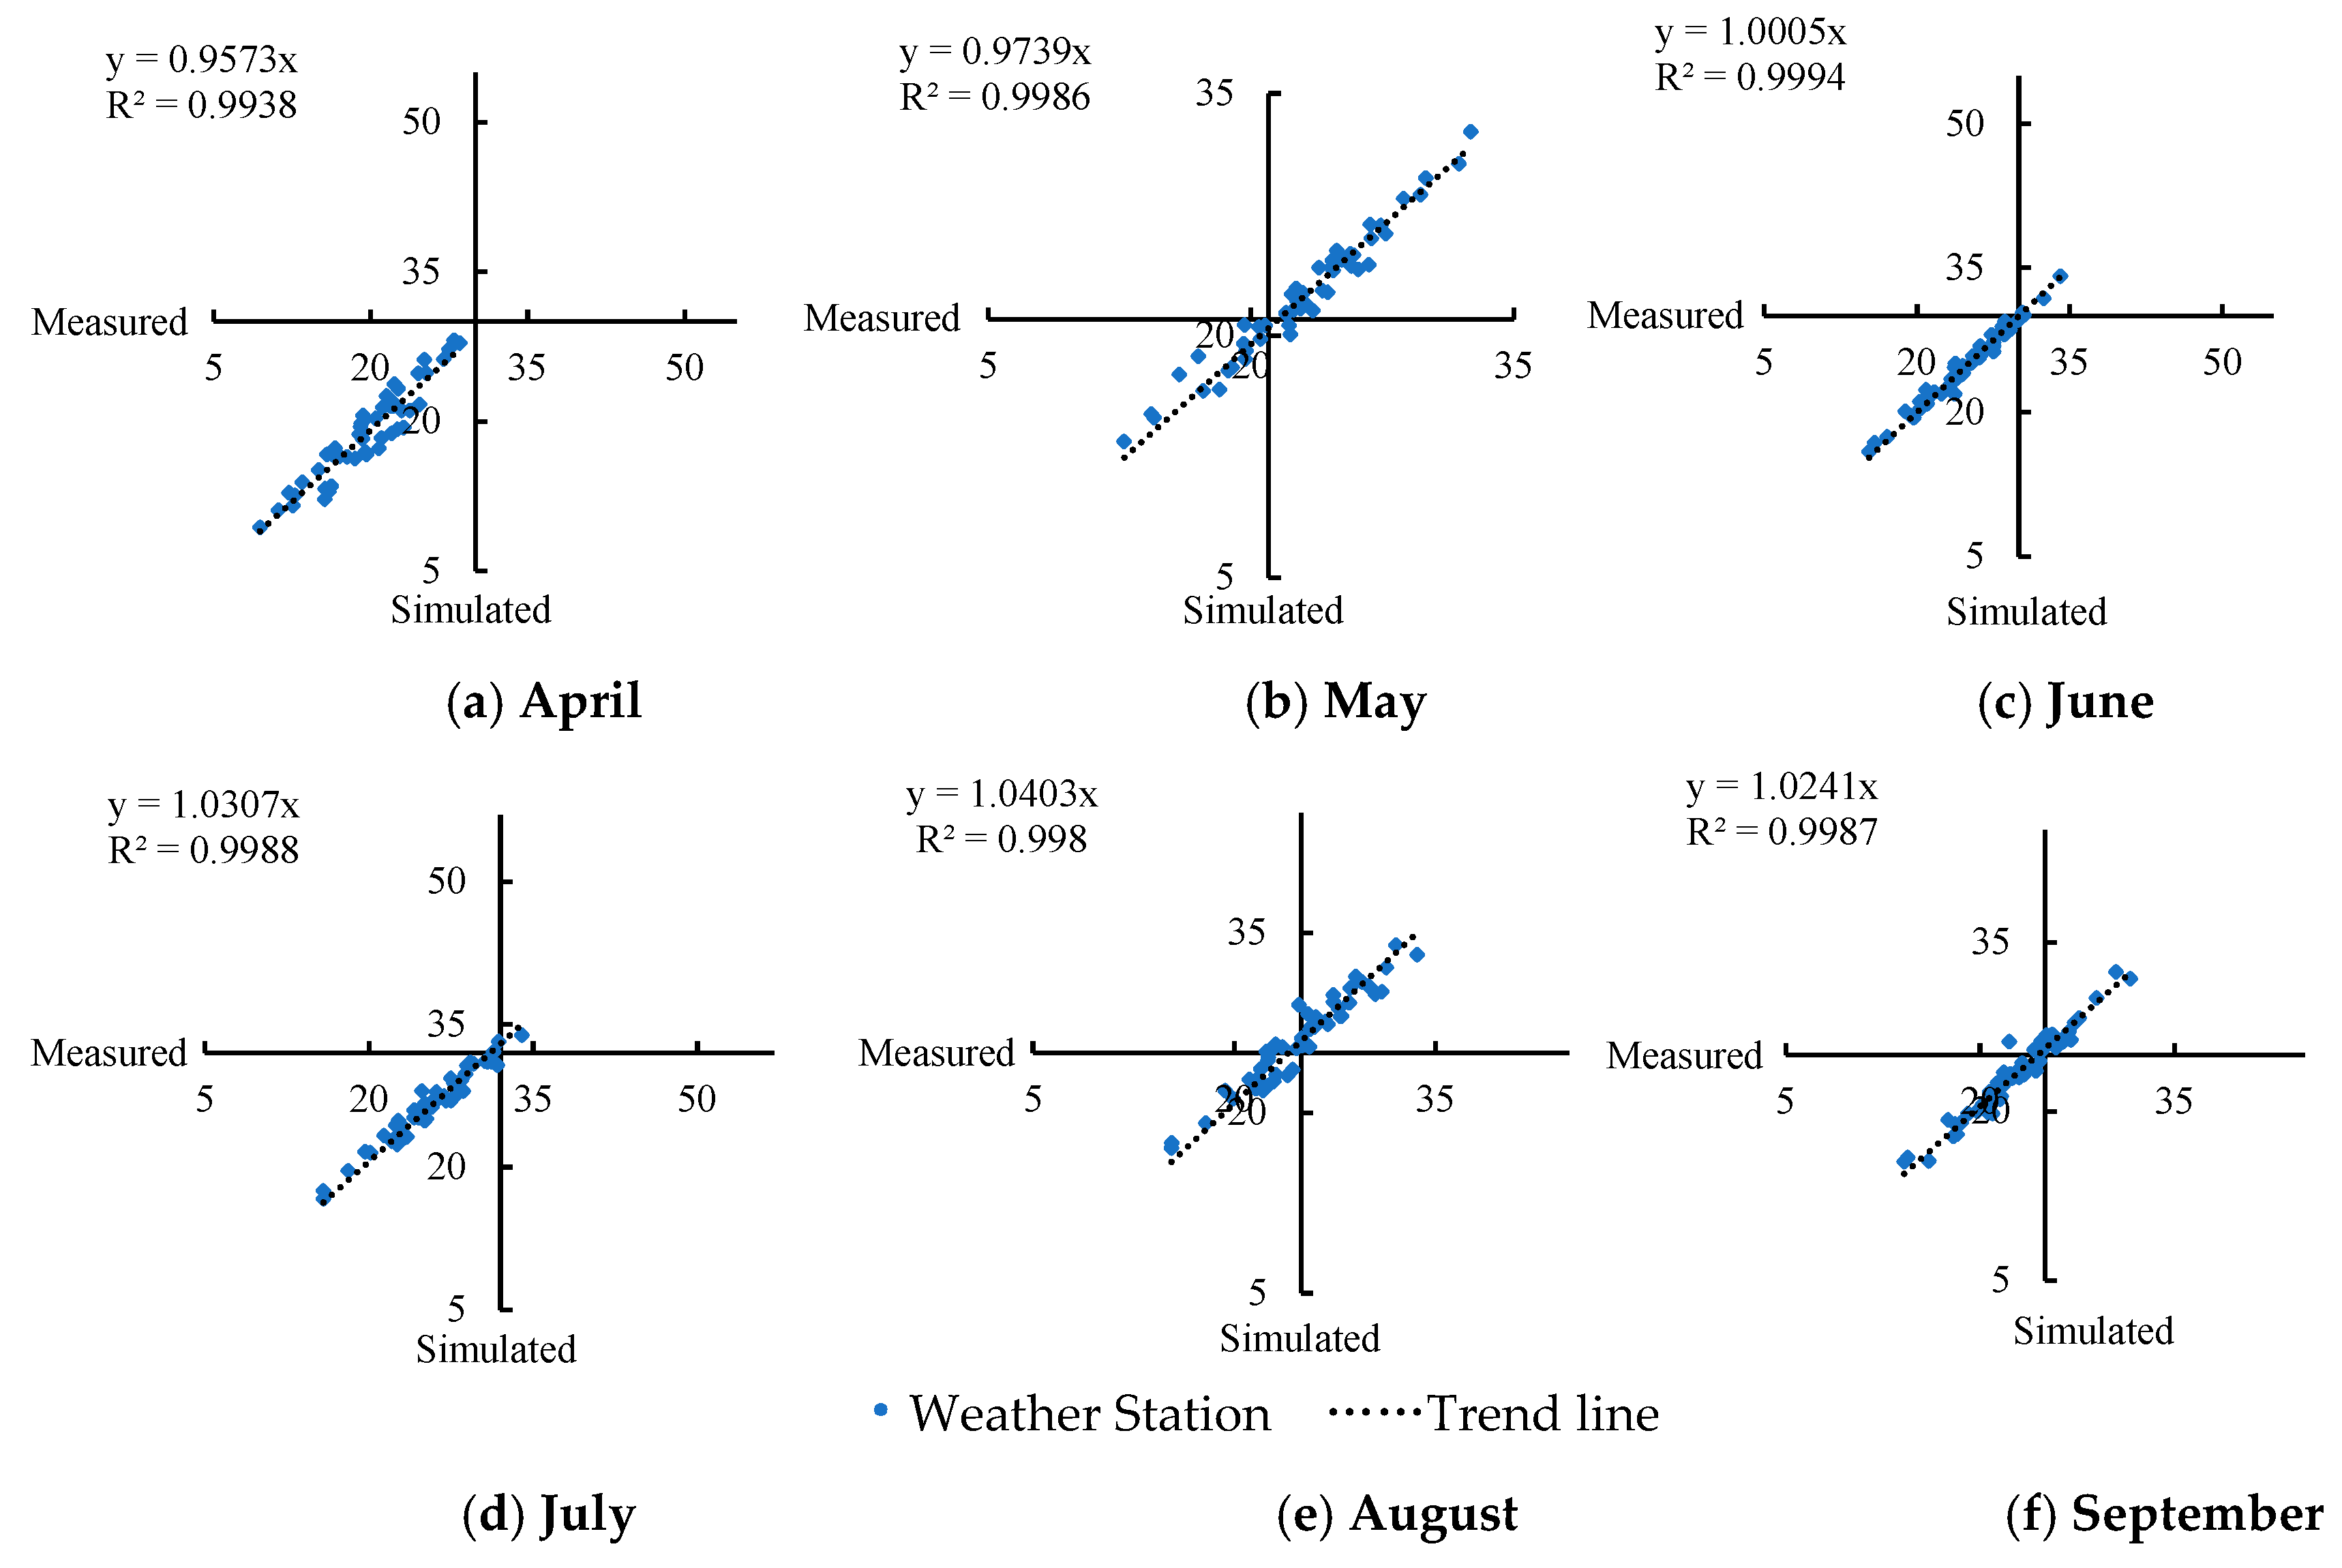
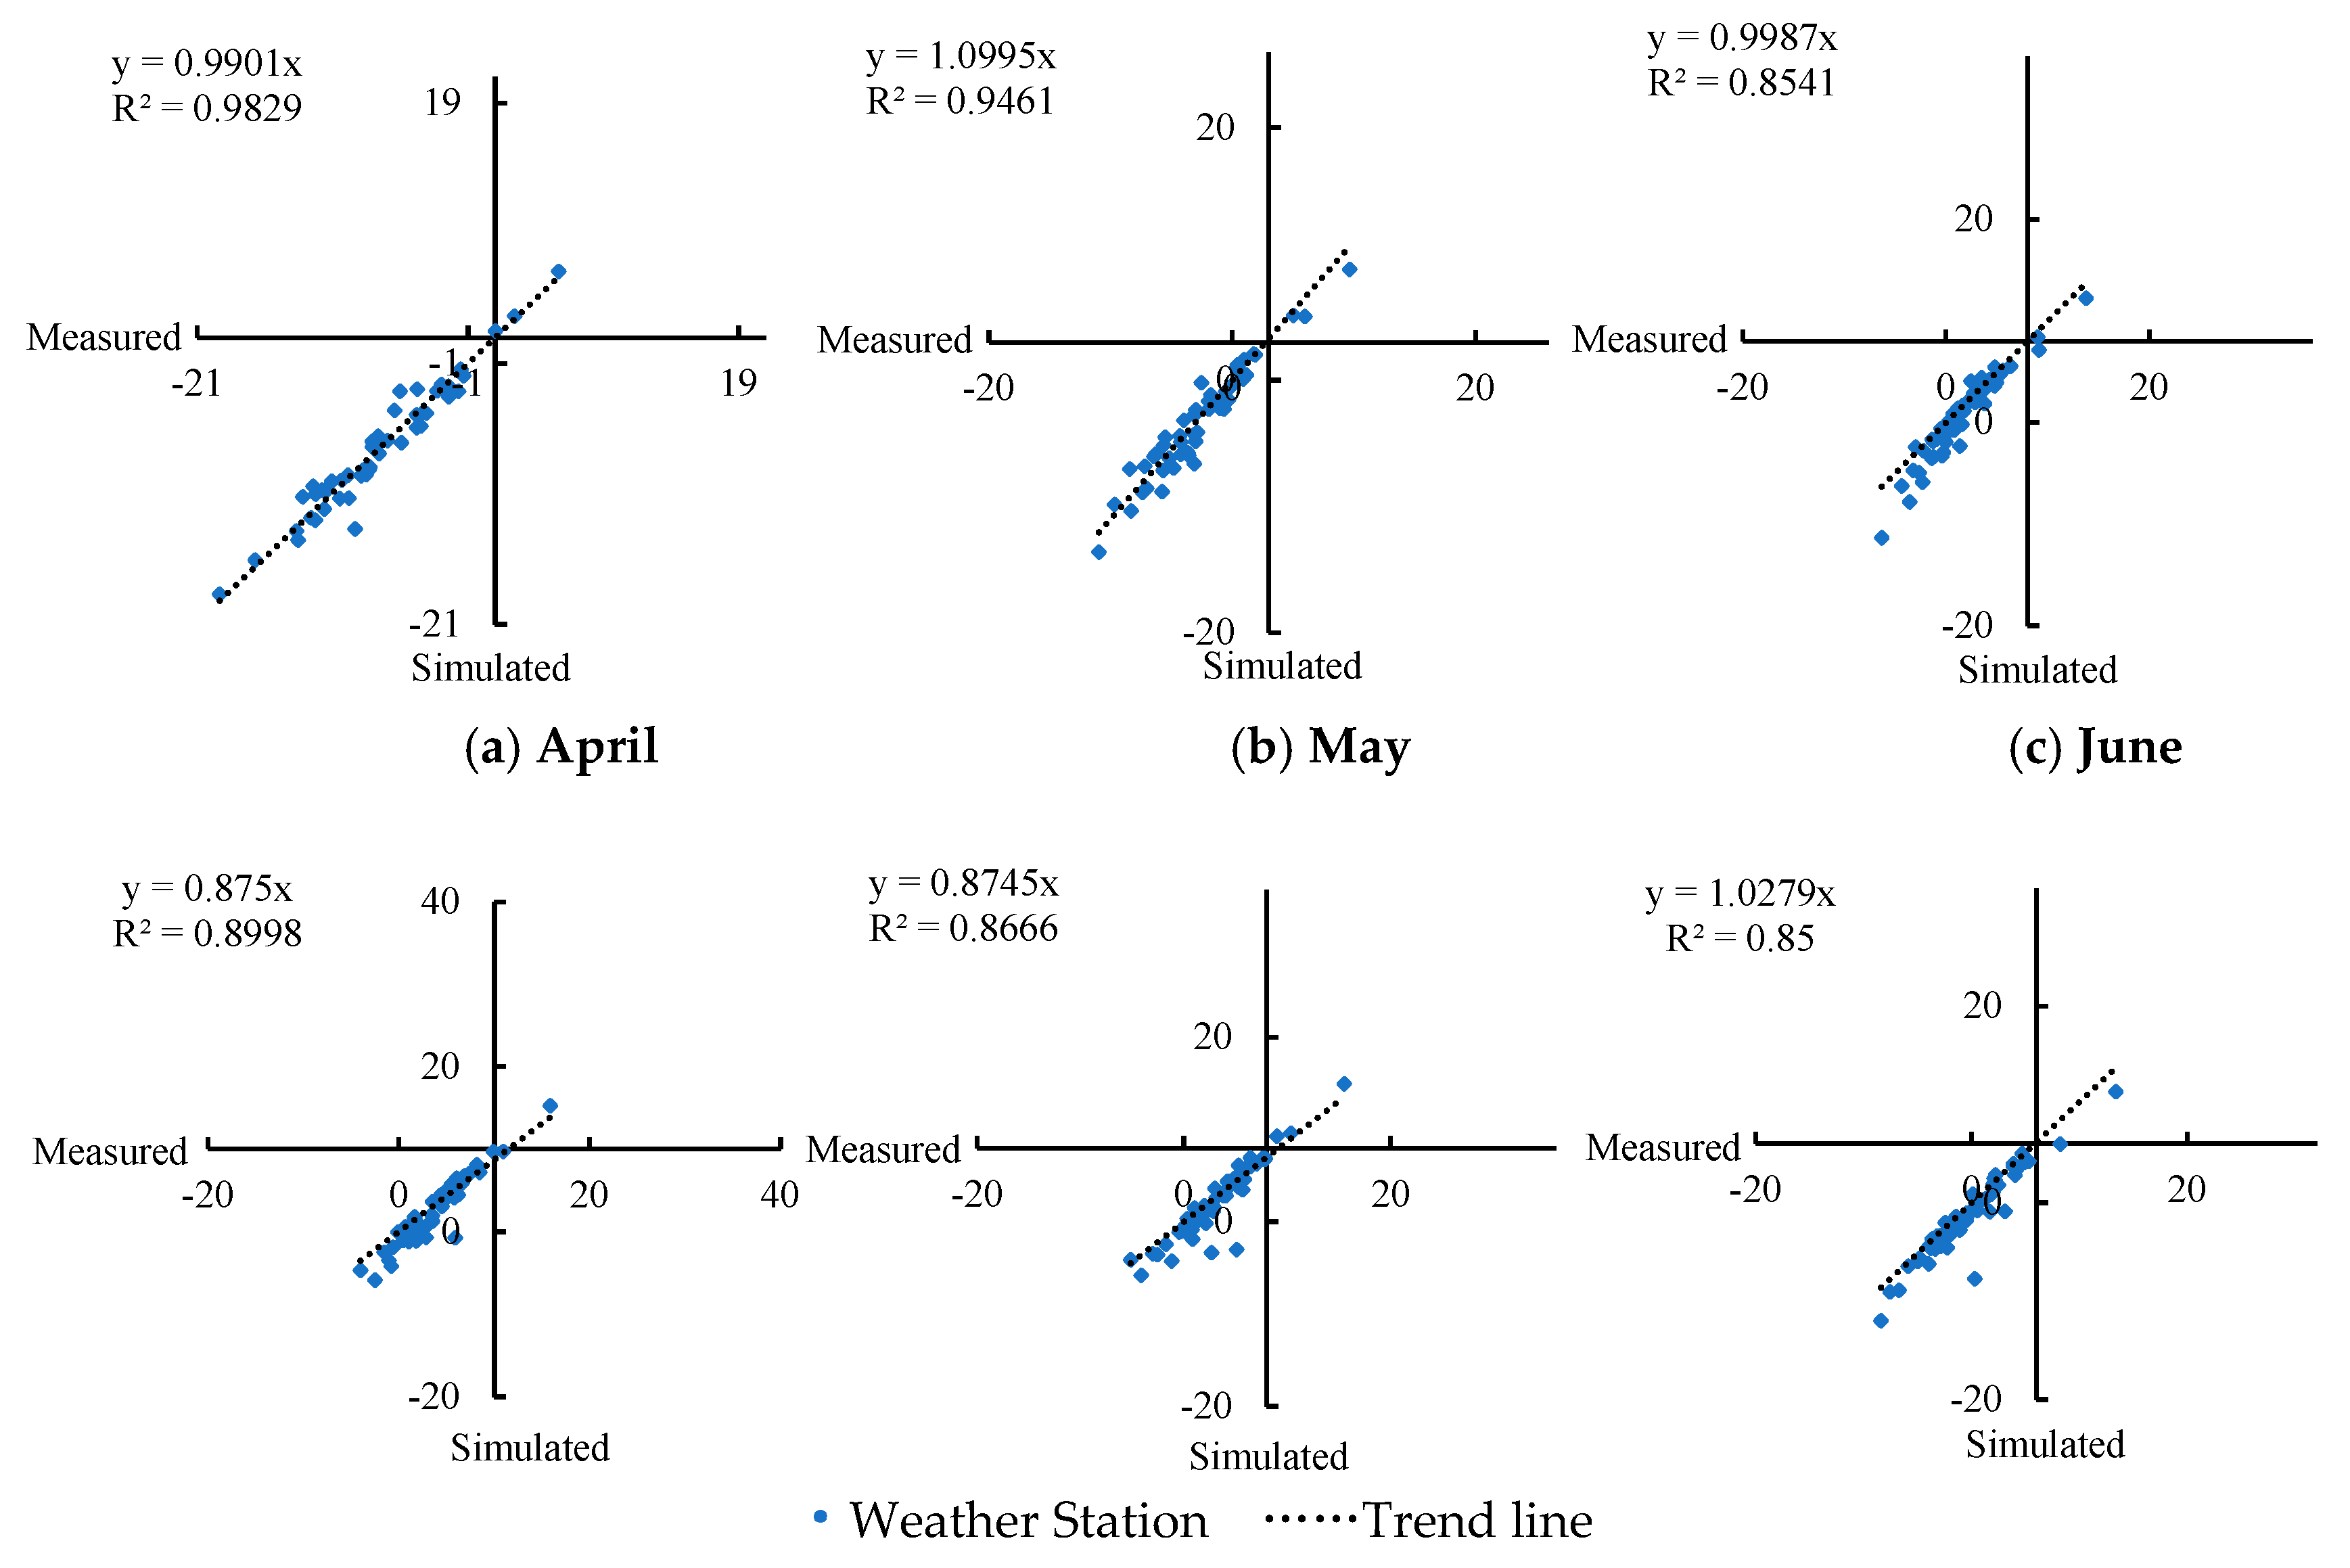
3.2. Analysis of Temperature Simulations in the Growth Period

The WXGEN weather generator was used to simulate temperature with resolution corresponding to the observed temperature data of 51 meteorological stations with relatively complete records in the main planting areas of highland barley. K-S test, F-test and T-test were then used to compare measured and simulated monthly average meteorological data by independent sample tests. We also tested the dispersion degree of the annual average temperature of each station. In the highland barley planting area of the Qinghai–Tibet Plateau, the test results of WXGEN under the significance level of 0.05 for the reduction degree of monthly average minimum and maximum temperature are shown in Table 2. The simulated results agree with the measurements of each station, the simulated maximum temperature is better than the minimum temperature, and the simulated temperature reproduces the annual climate characteristics of the meteorological station. The meteorological stations with poor simulation effect have two characteristics: 1. Spatially distributed on the edge of the plateau; 2. Climatically distributed on relatively extreme areas in the plateau. For example, Shiquanhe is one of the driest stations in the sample.
The accuracy of 60a annual mean temperature simulated by the weather generator is evaluated using four indexes: univariate regression slope, determination coefficient (R2), bias, and root mean square error (RMSE). It can be seen from Table 3 that the simulation effect of the annual average temperature is good, and the values of the four verification results are very good. The root mean square deviation is only 0.7 °C, and the measured simulation deviation of most stations is no more than 1 °C. WXGEN simulates the average annual temperature in the growth period well overall.

3.3. Analysis of Simulation Radiation Results in the Growth Period

We used the WXGEN weather generator to simulate solar radiation, and the monthly average data was tested by independent sample tests. Under the significance level of 0.05, the simulated-measured solar radiation tests are shown in Table 4. Compared with the simulation of the monthly average maximum temperature and the minimum temperature, the reduction degree of monthly average solar radiation by WXGEN is the worst, and the stations that fail the K-S test reach 10% of the total. These meteorological stations are situated in relatively extreme areas on the Plateau. Among them, Xiaozaohuo and Shiquanhe are representative stations in extreme dry areas, and they even fail to pass the test of two independent samples at the same time.
The dispersion degree test was carried out for the annual average radiation of each station, and the results are shown in Table 5. The average annual solar radiation reduction effect of each meteorological station is poor. Compared with the actual measurements, the simulation results are larger, with a deviation of 0.047 and an average annual RSME of 1.65 MJ/m2. The main reason for the large deviation is that a small number of meteorological stations have a large deviation, which affects the overall fit. WXGEN’s simulation deviation of annual average solar radiation in the growth period of highland barley on the Qinghai–Tibet Plateau is large, and the simulation value is too large as a whole.

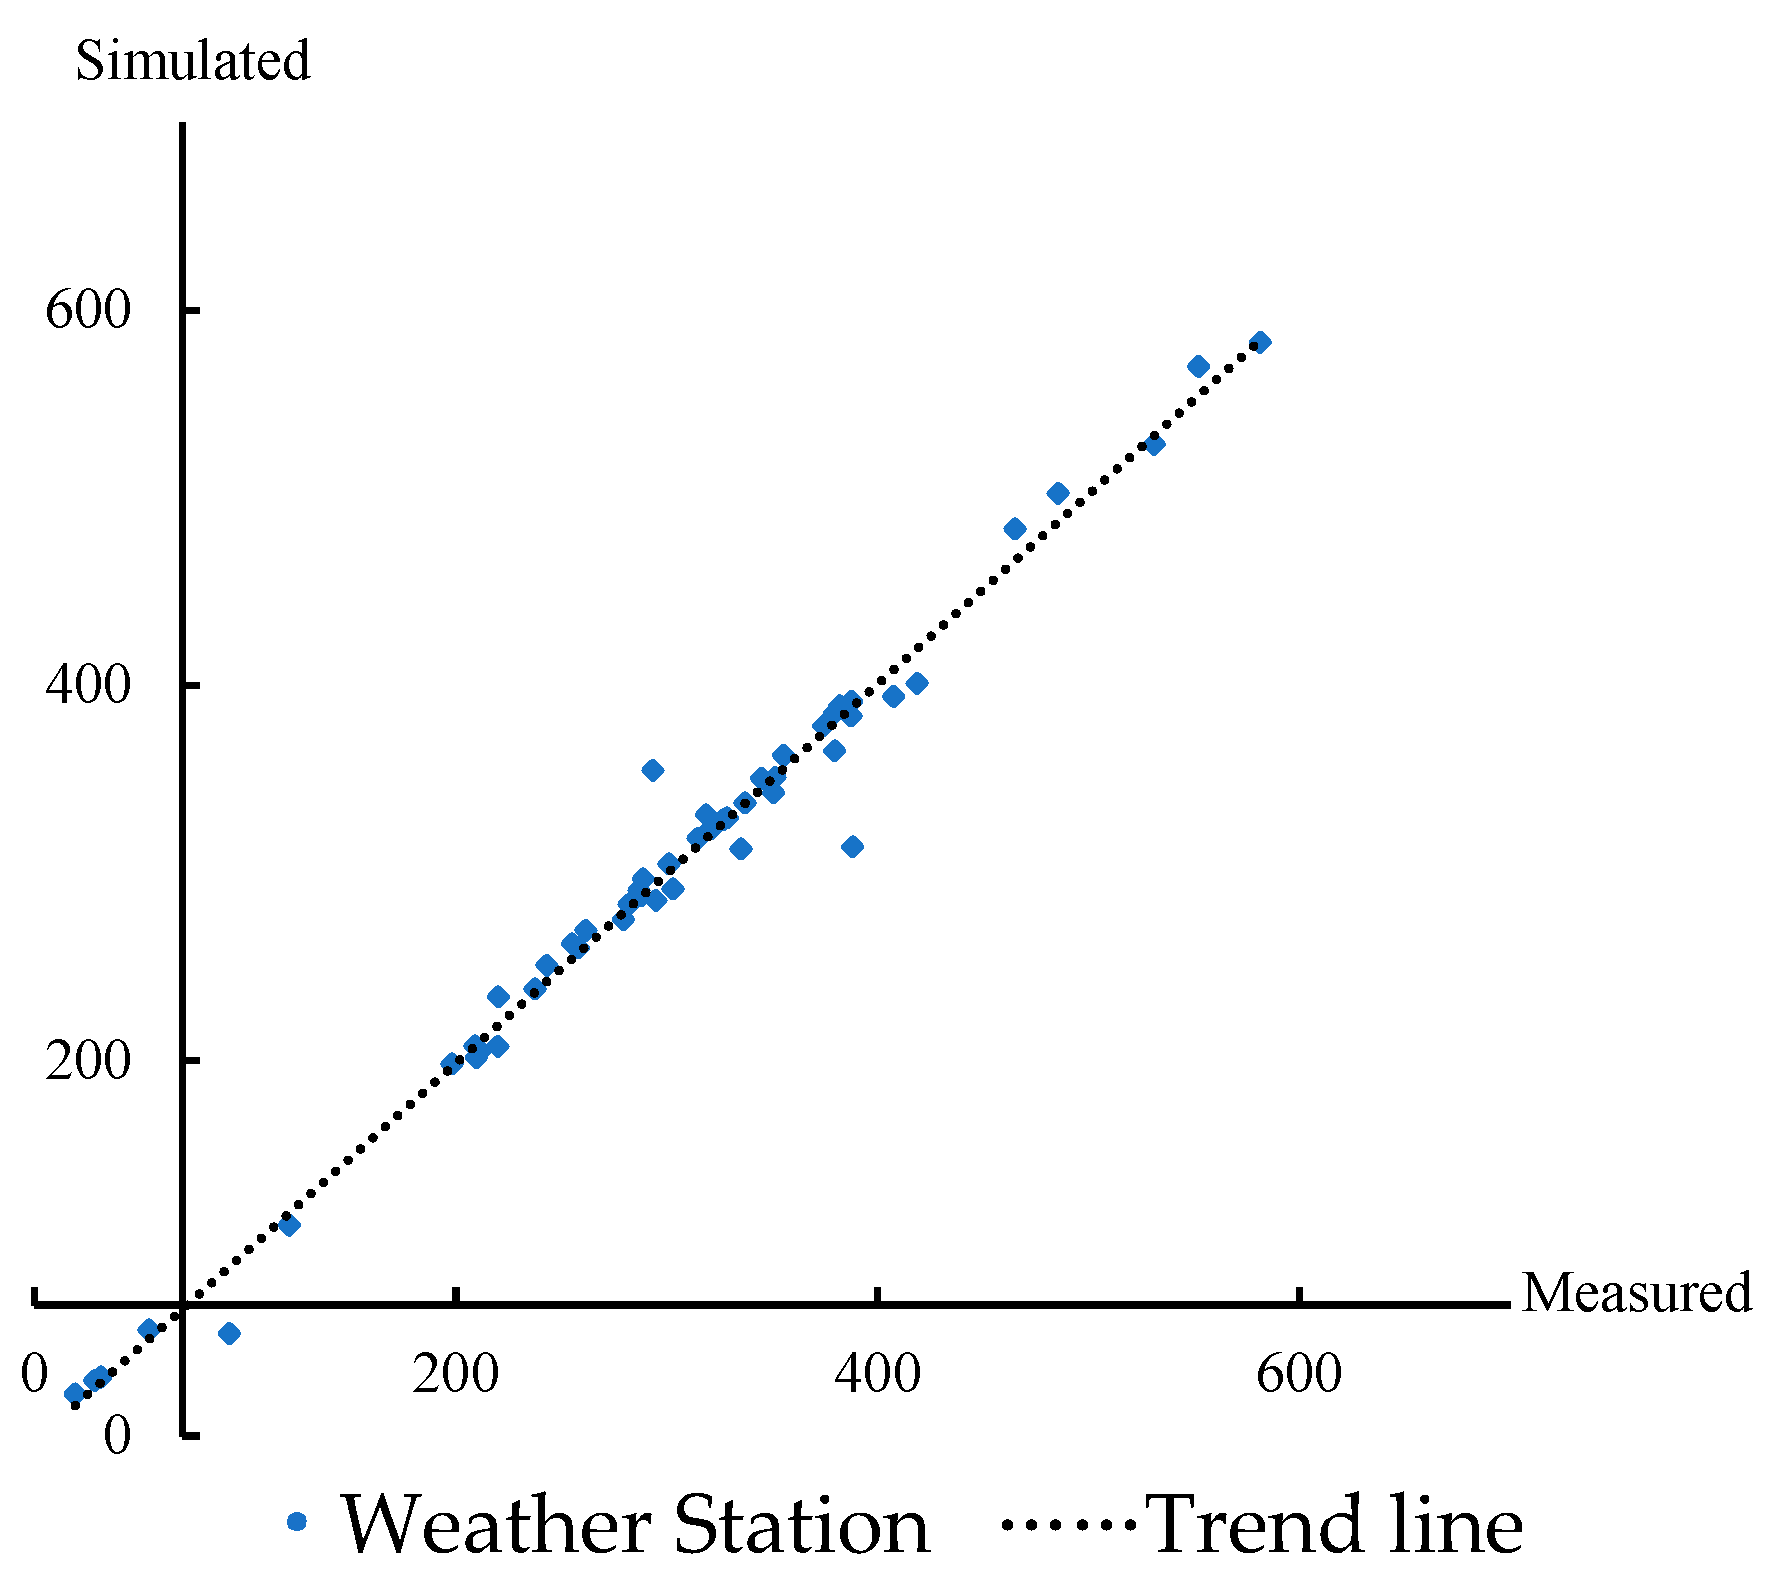
3.4. Analysis of Precipitation Results in the Growth Period

As with temperature and solar radiation simulations, the average annual and monthly precipitation of highland barley in the growth period were simulated and tested. Because the highland barley planting area on the Qinghai–Tibet Plateau is not prone to heavy precipitation, the extreme precipitation index during the growth period of highland barley is focused on meteorological drought to test the simulation of precipitation by the weather generator. Independent sample test and reduction tests were carried out for the measured simulated monthly average precipitation. In the highland barley growing area, the results of WXGEN at the significance level of 0.05 for the reduction degree of monthly average precipitation are shown in Table 6. Compared with the simulation results of temperature, the simulation effect of monthly average precipitation is poorer, but the deviation of the simulation result is still very small. The simulated precipitation reproduces the annual climate change characteristics of the weather station.
The annual simulation results are shown in Table 7. The different fitting indicators are very good. Among them, the simulation of average annual wet days is poorest, with average annual deviation reaching 8.3 d. This is caused by too many low precipitation days (less than 1 mm per day) produced by the weather generator, but this has little impact on the growth of highland barley. The simulation of average annual precipitation is the best, the regression slope is nearly 1, the deviation is the smallest, and the average annual root mean square error is only 8.0 mm. The error between simulated and measured average annual precipitation at most stations is no more than 10 mm, and only a few stations (such as Gongshan, Jiulong, Kangding, Muli) exceed 10 mm. The simulation of annual heavy rain days is also very good. The difference between the simulated and measured average annual heavy rain days of all weather stations is no more than 2 days. Except in Gongshan, Yunnan, the average annual heavy rain days are less than 10 days. The stations with poorer simulated heavy rain days are also mostly distributed in the areas in the Plateau with more precipitation, in Northwest Yunnan, Eastern Sichuan and southern Tibet.

3.5. Analysis of Extreme Weather Conditions during the Growth Period

As part of the evaluation of WXGEN’s simulation of hydrological and thermal indicators in the growth period of crops, we first selected the monthly maximum temperature and minimum temperature in the growth period of each station and the extreme temperature threshold that may affect the yield (Table 1). We then analyzed the simulated extreme temperatures that may affect the yield in the growth period of highland barley. From Figure 4, the difference between measured and simulated extreme high temperature values at most stations is within 2 °C. It is most accurate in June and relatively poor in April. May, August and September are the months when highland barley is vulnerable to heat damage. In these months, the difference between the maximum temperature simulated by the weather generator and the measured value is very small. From Figure 5, the points are concentrated near the trend lines, indicating that the reduction effect of the minimum temperature is also good, but it is obviously worse than the maximum temperature, mainly because the deviation between simulated-measured value of individual points is greater than 5 °C. This impacts the overall fit, especially in Pulan and Shiquanhe stations. Highland barley is vulnerable to low temperatures in each month during the growth period, and the reduction degree of WXGEN to the occurrence of low temperature that may affect production in each month is also within the acceptable range. To summarize, the weather generator can restore the minimum and maximum temperatures in the growth period of highland barley planting area well, and the simulated highest temperature is very accurate. Because it is affected by individual weather stations, the overall lowest temperature simulation is relatively poor, but the simulated-measured deviation of most stations is within the acceptable range. This is a good indication for the use of the WXGEN weather generator to study the effects of extreme temperatures in the growth process of highland barley.
Highland barley has a short growth period and strong drought resistance. According to the data from agricultural meteorological station [34], the tillering to filling period is the period when highland barley needs most water. This period occurs from June to August every year. At this time, if the monthly precipitation is less than 70mm, it will significantly affect the yield of highland barley. However, rainstorms are rare in highland barley planting areas, and highland barley is not affected by flooding. The measured and simulated precipitation indexes of 51 stations in highland barley planting areas from June to August are shown in Figure 6. The weather generator has a good reduction effect on meteorological drought in highland barley during the period from tillering to grain filling: the slope of the trend line is very close to 1, and R2 is 0.997. There are three meteorological stations in the whole planting area. The measured total precipitation from June to August during the study period is less than 70 mm, that is, these three stations are very prone to drought events. The error between measured and simulated precipitation values is within 2 mm. Other stations have abundant precipitation. Except Pulan, Razi and Shangri La, the difference between the measured and simulated precipitation of most stations from June to August is within 20 mm, indicating that the weather generator simulates well the meteorological drought during the critical period of highland barley growth. At the same time, precipitation in most meteorological stations during this period is greater than the minimum requirements for the growth of highland barley. Only Xiaozaohuo, Golmud, Nomuhong and Shiquan River have less than 70 mm precipitation, indicating meteorological drought events. These areas are not suitable for the cultivation of highland barley. We found the R2 for temperature prediction is most accurate in June and poor in April for maximum temperature but the other way around for minimum temperature, and we believe that this is because the difference of the extreme value of the highest temperature in June is greater than that in April, while the extreme value of the lowest temperature is just the opposite.

4. Conclusions and Perspectives

4.1. Analysis of Precipitation Transition Probability

WXGEN is used to simulate meteorological data in a variety of regions, so it needs to be evaluated for applicability in different regions [35,36]. This paper evaluates the accuracy of the weather generator to model hydrological and thermal conditions during the growth period of highland barley on the Qinghai–Tibet Plateau. The adjustment and improvement of WXGEN according to the climate characteristics of different climate regions are further research directions. Due to the unique climate of the Qinghai–Tibet Plateau, it is difficult to calibrate the weather generator model on the daily scale, and the growth period of crops is long, so it is not sensitive to the daily scale meteorological data. This study evaluates the simulation of annual and monthly average meteorological data. The weather generator presents large deviations in the restoration of meteorological elements in extreme climate areas [37]. Although these events are rare in most highland barley planting areas, the impact of short-term heavy precipitation on highland barley growth cannot be ignored, and there is still a lack of relevant research on the relationship between heavy precipitation and highland barley yield. Therefore, the influence of heavy rainfall on highland barley and the restoration of heavy rainfall events by weather generators should be further analyzed. Based on the above analysis, the following conclusions are drawn:
(1) The Markov chain transfer parameters of the weather generator in various regions of the Qinghai–Tibet Plateau are basically consistent with the actual precipitation. P(W|D) and P(W|W) of each meteorological station are between 0.03–0.38 and 0.16–0.74, respectively. P(W|D) is generally low in winter and spring, high in summer and autumn, and peaks in summer. P(W|W) is generally high from May to September, while it is low in other months, and the change is relatively abrupt. While preserving the climate characteristics of the Qinghai–Tibet Plateau, the simulation of the occurrence and duration probability of precipitation generated by the Markov chain is very close to the actual situation, so the use of the WXGEN weather generator is appropriate.
(2) In the simulation of temperature and solar radiation in highland barley planting area by WXGEN, more than 96% of the meteorological stations with monthly average meteorological data passed three different 0.05 significance level tests. The deviations of annual mean temperature and annual average solar radiation of annual meteorological data are 0.686 °C and 1.65 MJ/m2, respectively. The monthly average solar radiation simulation is better than that of the annual average, and the weather generator can better restore monthly heat data. In the simulation of extreme temperature during the growth period of highland barley, the deviation between the simulated value and the actual value is within 2 °C in most stations, and more than 5 °C in some points. The simulation effect of the weather generator on temperature and radiation is very good.
(3) In the simulation of precipitation, more than 94% of the meteorological stations with monthly average precipitation data passed the significance level test. The deviations of annual precipitation and annual heavy rain days are 8.04 mm and 1.023 d, respectively, and the simulation results are very good. However, the deviation between measured and simulated values on wet days is 8.374 d. The weather generator produces too many precipitation events with daily precipitation of less than 1 mm, but this has little impact on the use of the weather generator to simulate the growth of highland barley. In the simulation of meteorological drought in the tillering to grain filling period of highland barley (June to August), the simulated-measured difference of stations with low precipitation is almost 2 mm, and within 20 mm for most other stations. The measured-simulated deviations of meteorological data in stations such as Pulan, Razi and Shangri La are large, which affects the overall reduction. In general, the use of the weather generator to study meteorological drought during the growth period of highland barley is appropriate, and the model can be used to evaluate meteorological drought during the growth period of crops in areas lacking measurements. The weather generator has poor reducibility to extreme climate, especially in areas with extreme precipitation.
In this study, the WXGEN weather generator was used to verify the simulation of mean and extreme values of the key hydrothermal indicators in the growth period in the highland barley planting area of the Qinghai–Tibet Plateau. In conclusion, WXGEN’s simulation of the average and extreme values of temperature and precipitation in the highland barley planting area of Qinghai–Tibet Plateau conform to measured values, and there is a statistically significant high correlation between the simulated data and the measured data. Therefore, using the WXGEN weather generator to restore meteorological elements in the highland barley planting area of the Qinghai–Tibet Plateau is appropriate, and the use of the model could be extended to other regions on the Plateau.

4.2. Potential Applications

Firstly, WXGEN can generate high-resolution meteorological data with high correlation with the actual data, and good fit with the mean extreme values of hydrothermal indexes. For the areas of Qinghai–Tibet Plateau where meteorological data are missing, WXGEN can be used to scale down the existing monthly average data to daily data, to meet the needs of crop growth research. Secondly, WXGEN can also be used to simulate non observed or missing locations based on the time series of existing meteorological data on the Qinghai–Tibet Plateau, to fill the blanks of meteorological data for agricultural research. Last but not least, the application of WXGEN provides a basis for the prediction of industry departments, and then guides farmers to make corresponding disaster prevention and reduction measures. Highland barley planting in the study area is a dry land without irrigation, so the simulation under irrigation conditions is not considered.
Different climate scenarios in the future can also make full use of the widening and downscaling applications of the weather generator. For example, CMIP6 mode has established emission paths, the temperature change is preset in this model [38], and it is insufficient for researching the potential damage of climate change on crop growth. Due to the high reducibility of the weather generator, WXGEN can be used to artificially set a certain step increase or decrease of monthly average temperature, precipitation and even solar radiation under benchmark meteorological stresses. The weather generator can scale down the time scale of climate data to daily values. For example, the EPIC model requiring daily value weather data can be combined with a weather generator to simulate the yield of highland barley and other crops under various meteorological stresses. At the same time, the resolution scale of CMIP6 data is generally low, and the maximum resolution of the data is 100 km. Combining this model with a weather generator can reduce the spatial scale of this low-resolution model so as to serve the needs of small and medium-sized research under future climate scenarios.

Author Contributions

Y.Z. conducted the research, analyzed the data, and wrote the paper; W.M. provided the data; F.L. made suggestions to this paper; J.W. conceived the research and provided project support. All authors have read and agreed to the published version of the manuscript.

Funding

This research was funded by the Second Tibetan Plateau Scientific Expedition and Research (STEP) (Grant No. 2019QZKK0606), the Second Tibetan Plateau Scientific Expedition and Research (STEP) (Grant No. 2019QZKK0906) and the National Key Research and Development Program of China (Grant No. 2016YFA0602402).

Institutional Review Board Statement

Not applicable.

Informed Consent Statement

Not applicable.

Data Availability Statement

Data sharing not applicable.

Acknowledgments

In the process of writing this article, I have received the help of Gao Yuan and Jiang Yao from Beijing Normal University, Jia Wei and Su Peng of Qinghai Normal University. I would like to express my thanks to all.

Conflicts of Interest

The authors declare no conflict of interest.

References

  1. Wallis, T.W.R.; Griffiths, J.F. An assessment of the weather generator (WXGEN) used in the erosion/productivity impact cal-culator (EPIC). Agric. For. Meteorol. 1995, 73, 115–133. [Google Scholar] [CrossRef]
  2. Erosion/Productivity Impact Calculator, Model Documentation. Available online: http://agrilife.org/epicapex/files/2015/05/EpicModelDocumentation.pdf (accessed on 12 March 2022).
  3. Generating Climatic Data for a Water Erosion Prediction Model. Available online: https://agris.fao.org/agris-search/search.do?recordID=US8843444 (accessed on 12 March 2022).
  4. Baffault, C.; Nearing, M.A.; Nicks, A.D. Impact of CLIGEN parameters on WEPP-predicted average annual soil loss. Trans. ASAE 1995, 39, 447–457. [Google Scholar] [CrossRef]
  5. Khoi, D.N.; Suetsugi, T. Uncertainty in climate change impacts on streamflow in Be River Catchment, Vietnam. Water Environ. J. 2012, 26, 530–539. [Google Scholar] [CrossRef]
  6. Zhang, X.J.; Lin, S.J.; Ma, C. Design rainstorm estimation of Qiantang River Basin under HadCM3 model. ‪Hydrology‬ 2013, 33, 21–26. [Google Scholar]
  7. Wang, X.B.; Wang, S.Q.; Chen, J.H. Simulation of production potential of Chinese super hybrid rice in Meng-India-Myanmar region. Acta Geogr. Sin. 2018, 73, 2184–2197. [Google Scholar]
  8. Zhou, Y.T.; Gao, Y.; Liu, F.G.; Wang, J.A. Application of weather generator in disaster risk assessment. J. Catastrophology 2022, 37. [Google Scholar]
  9. Gabriel, K.R.; Neumann, J.A. Markov chain model for daily rainfall occurrence in Tel Aviv Israel. Q. J. R. Meteorol. Soc. 1962, 88, 90–95. [Google Scholar] [CrossRef]
  10. Jones, P.D.; Reid, P.A. Assessing future changes in extreme precipitation over Britain using regional climate model integra-tions. Int. J. Climatol. A J. R. Meteorol. Soc. 2001, 21, 1337–1356. [Google Scholar] [CrossRef]
  11. Bruhn, J.A.; Fry, W.E.; Fick, G.W. Simulation of Daily Weather Data Using Theoretical Probability Distributions. J. Appl. Meteorol. 1980, 19, 1029–1036. [Google Scholar] [CrossRef] [Green Version]
  12. USDA-Water Erosion Prediction Project Hillslope Profile and Watershed Model Documentation. Available online: https://www.ars.usda.gov/midwest-area/west-lafayette-in/national-soil-erosion-research/docs/wepp/wepp-model-documentation/ (accessed on 12 March 2022).
  13. Liu, J.; Williams, J.R.; Wang, X.; Yang, H. Using MODAWEC to generate daily weather data for the EPIC model. Environ. Model. Softw. 2009, 24, 655–664. [Google Scholar] [CrossRef]
  14. Semenov, M.A.; Barrow, E.M. Use of a stochastic weather generator in the development of climate change scenarios. Clim. Chang. 1997, 35, 397–414. [Google Scholar] [CrossRef]
  15. Zubaidi, S.L.; Kot, P.; Hashim, K.; Alkhaddar, R.; Abdellatif, M.; Muhsin, Y.R. Using LARS –WG model for prediction of temperature in Columbia City, USA. IOP conference series. Mater. Sci. Eng. 2019, 584, 12026. [Google Scholar]
  16. Mahmood, R.; Jia, S. Observed and simulated hydro-climatic data for the lake Chad basin, Africa. Data Brief. 2019, 25, 104043. [Google Scholar] [CrossRef] [PubMed]
  17. Wang, X.; Wang, S.; Chen, J.; Cui, H.; Wu, Y.; Ravindranath, N.H.; Rahman, A. Simulating potential yields of Chinese super hybrid rice in Bangladesh, India and Myanmar with EPIC model. J. Geogr. Sci. 2018, 28, 1020–1036. [Google Scholar] [CrossRef] [Green Version]
  18. Ding, Y.G.; Zhang, J.L.; Jiang, Z.H. Simulation experiment of extreme precipitation based on Multi-state Markov chain model. Acta Meteorol. Sin. 2009, 67, 20–27. [Google Scholar]
  19. Zhang, G.H. Adaptability of CLIGEN weather Generator in the Yellow River Basin. J. Soil Water Conserv. 2004, 18, 175–178. [Google Scholar]
  20. Ma, X.G.; Shen, Z.R. Visual programming of random weather generator and its future application in agroecology. Sci. Agric. Sin. 2002, 35, 1473–1478. [Google Scholar]
  21. Liao, Y.M.; Chen, D.L.; Gao, G.; Xie, Y. Impacts of Climate Changes on Parameters of a Weather Generator for Daily Precipi-tation in China. Acta Geogr. Sin. 2009, 64, 871–878. [Google Scholar]
  22. Teng, Y.Q.; Ma, W.J. Risk assessment of rice planting based on generalized linear model. Math. Pract. Cogn. 2019, 49, 1–17. [Google Scholar]
  23. Wang, Y.L.; He, L.Y. Research and application of crop growth simulation models. J. Huazhong Agric. Univ. 2005, 5, 107–113. [Google Scholar]
  24. Lu, X.H. Simulation of Climate Change on Conservation Tillage of Winter Wheat in Western Region of Henan Province. Available online: https://kns.cnki.net/kcms/detail/detail.aspx?dbcode=CDFD&dbname=CDFD0911&filename=2010147433.nh&uniplatform=NZKPT&v=Xh3ydTXgkezun1sWf3a-9I5i9mMRevCGshaOomgFPMsRMag31EeIRF83BHeDfznE (accessed on 16 September 2010).
  25. Zhang, Y.; Ren, X.C.; Zhao, Y.; Cao, H.; Feng, H. Impact and simulation of climate change on water consumption and yield of winter-wheat in Guanzhong Region. Agric. Res. Arid. Areas 2016, 34, 220–228. [Google Scholar]
  26. Yan, Y.J.; Xu, J.X.; Xiao, H. Summer Maize Net Irrigation Water Requirement to Climate Change in Henan Province in China during 2021−2050. Clim. Chang. Res. 2017, 13, 138–148. [Google Scholar]
  27. Zou, W.; He, W.Z.; Li, D.Y.; He, L.X.; Xie, S.Q. Presence Problem of Highland Barley Production and the Way of Increasing Yield in Yunnan Plateau. Chin. Agric. Sci. Bull. 2003, 6, 71–72. [Google Scholar]
  28. Ma, W.D.; Su, P.; Jia, W.; Liu, F.G.; Wang, J.A. Advances in the Research on the Exposure of Highland Barley Natural Disasters on the Background of Climate Change. J. Catastrophology 2020, 35, 215–221. [Google Scholar]
  29. Wang, R.; Jiang, Y.; Zhang, A.Y.; Gao, Y.; Wang, J.A. Review on Crop Exposure of Natural Disasters. J. Catastrophology 2019, 2, 215–221. [Google Scholar]
  30. Xu, X.D.; Dong, L.L.; Zhao, Y.; Wang, Y.J. Effect of the Asian Water Tower over the Qinghai-Tibet Plateau and the characteristics of atmospheric water circulation. Chin. Sci. Bull. 2019, 64, 2830–2841. (In Chinese) [Google Scholar] [CrossRef] [Green Version]
  31. Li, J.J.; Wen, S.X.; Zhang, Q.S.; Wang, F.B.; Zheng, B.X.; Li, B.Y. Discussion on the age, amplitude and form of the uplift of the Qinghai Tibet Plateau. Sci. China 1979, 6, 608–616. [Google Scholar]
  32. Ma, W.D.; Jia, W.; Su, P.; Feng, X.Y.; Liu, F.G.; Wang, J.A. Mapping Highland Barley on the Qinghai–Tibet Combing Land-sat OLI Data and Object-Oriented Classification Method. Land 2021, 10, 1022. [Google Scholar] [CrossRef]
  33. Liao, Y.M.; Zhang, Q.; Chen, D.L. Precipitation simulation in China With a weather Generator. Acta Geogr. Sin. 2004, 59, 417–426. [Google Scholar]
  34. National Intelligent Agricultural Meteorological data—Main meteorological indicators in Menyuan County, Menyuan County Meteorological Bureau. 2020.
  35. Shi, W.L.; Yang, Q.K.; Mu, W.H. Applicability test of CLIGEN in Loess Plateau. Sci. Soil Water Conserv.-Tion 2006, 2, 18–23. [Google Scholar]
  36. Zhang, H.; Huang, G.H.; Wang, D.; Zhang, X. Uncertainty assessment of climate change impacts on the hydrology of small prairie wet-lands. J. Hydrol. 2011, 396, 94–103. [Google Scholar] [CrossRef] [Green Version]
  37. Hayhoe, H. Relationship between weather variables in observed and WXGEN generated data series. Agric. For. Meteorol. 1998, 90, 203–214. [Google Scholar] [CrossRef]
  38. Zhang, L.X.; Chen, X.L.; Xin, X.G. Short commentary on CMIP6 Scenario Model Intercomparison Project (ScenarioMIP). Clim. Chang. Res. 2019, 15, 519–525. [Google Scholar]
Figure 1. The distribution of highland barley and county planting area in Qinghai–Tibet Plateau.
Sustainability 14 05932 g001
Figure 2. Research framework of applicability evaluation of WXGEN in barley growing process.
Sustainability 14 05932 g002
Figure 3. Temporal and spatial distribution of precipitation transfer probability of meteorological stations in the Qinghai–Tibet Plateau. (a) P(W|D) Spatial distribution; (b) P(W|W) Spatial distribution; (c) P(W|D) Temporal distribution; (d) P(W|W) Temporal distribution.
Sustainability 14 05932 g003
Figure 4. Scatter chart of monthly measured-simulated maximum temperature from April to September. (a) April max temperature not exceed 30 °C; (b) May max temperature not exceed 21 °C; (c) June max temperature not exceed 30 °C; (d) July max temperature not exceed 32 °C; (e) August max temperature not exceed 25 °C; (f) September max temperature not exceed 25 °C. Note: the first quadrant refers to the meteorological stations that may have extreme high temperatures affecting the yield during the growth period of highland barley.
Sustainability 14 05932 g004
Figure 5. Scatter chart of monthly measured-simulated minimum temperature from April to September. (a) April min temperature not lower 1 °C; (b) May min temperature not lower 3 °C; (c) June min temperature not lower 8 °C; (d) July min temperature not lower 10 °C; (e) August min temperature not lower 8 °C; (f) September min temperature not lower 6 °C. Note: the third quadrant refers to the meteorological stations that may have extreme low temperatures affecting the yield during the growth period of highland barley.
Sustainability 14 05932 g005
Figure 6. Scatter diagram of simulated measured precipitation from tiller to grain-filling period (June to August). Note: the third quadrant refers to the meteorological stations that may have meteorological drought affecting yield during the growth period of highland barley.
Sustainability 14 05932 g006
Table 1. Hydrological and thermal indexes affecting the development of highland barley during the growth period.
Growth PeriodMonthIndexes
Sowing-emergence periodAprilTemperature: Min 1 °C; Max 35 °C
Tillering periodMayTemperature: Min 3 °C; Max 21 ℃
Jointing-booting periodJunTemperature: Min 3 °C; Max 21 °C;
Precipitation: not less than 70 mm
Booting-heading periodJulyTemperature: Min 10 °C; Max 32 °C;
Precipitation: not less than 70 mm
Filling-maturation periodAugust and SeptemberTemperature: Min 10 °C; Max 25 °C;
Precipitation: not less than 70 mm
Table 2. Test of temperature reduction degree at highland barley planting area.
Test IndexTest MethodNumber of Passing Test StationsProportion (%)Failed to Pass
Monthly minimum temperatureK-S Test4996Pulan, Shangri-La
F-Test5098Pulan
T-Test51100-
Monthly maximum temperatureK-S Test4996Pulan, Shangri-La
F-Test51100-
T-Test5098Shangri-La
Table 3. Measured-simulated dispersion test of annual average temperature.
Test IndexSlopeR2BIASRMSE
Annual average temperature1.0860.993−0.0180.686 (°C)
Table 4. Test of solar radiation reduction degree at highland barley planting area.
Test IndexTest MethodNumber of Passing Test StationsProportion (%)Failed to Pass
Monthly solar radiationK-S Test4690Pulan, Shangri-La, Xiaozaohuo, Shiquanhe, Gongshan
F-Test5098Shangri-La
T-Test4996Xiaozaohuo, Shi-quanhe
Table 5. Measured-simulated dispersion test of annual average solar radiation.
Test IndexSlopeR2BIASRMSE
Annual average solar radiation1.1120.9280.0471.65 (MJ/m2)
Table 6. Test of monthly precipitation reduction degree at highland barley planting area.
Test IndexTest MethodNumber of Passing Test StationsProportion (%)Failed to Pass
Monthly precipitationK-S Test4894Pulan, Shiquanhe, Shangri-La
F-Test5098Shiquanhe
T-Test51100-
Table 7. Measured-simulated dispersion test of annual precipitation index.
Test IndexSlopeR2BIASRMSE
Annual average number of wet days1.0690.994−0.0678.374 (d)
Annual average precipitatio-n1.0070.999−0.0068.040 (mm)
Annual average heavy rain days0.9490.9540.1821.023 (d)
Publisher’s Note: MDPI stays neutral with regard to jurisdictional claims in published maps and institutional affiliations.

