
Land Cover Change Analysis to Assess Sustainability of Development in the Mongolian Plateau over 30 Years


Abstract
:1. Introduction
2. Materials and Methods
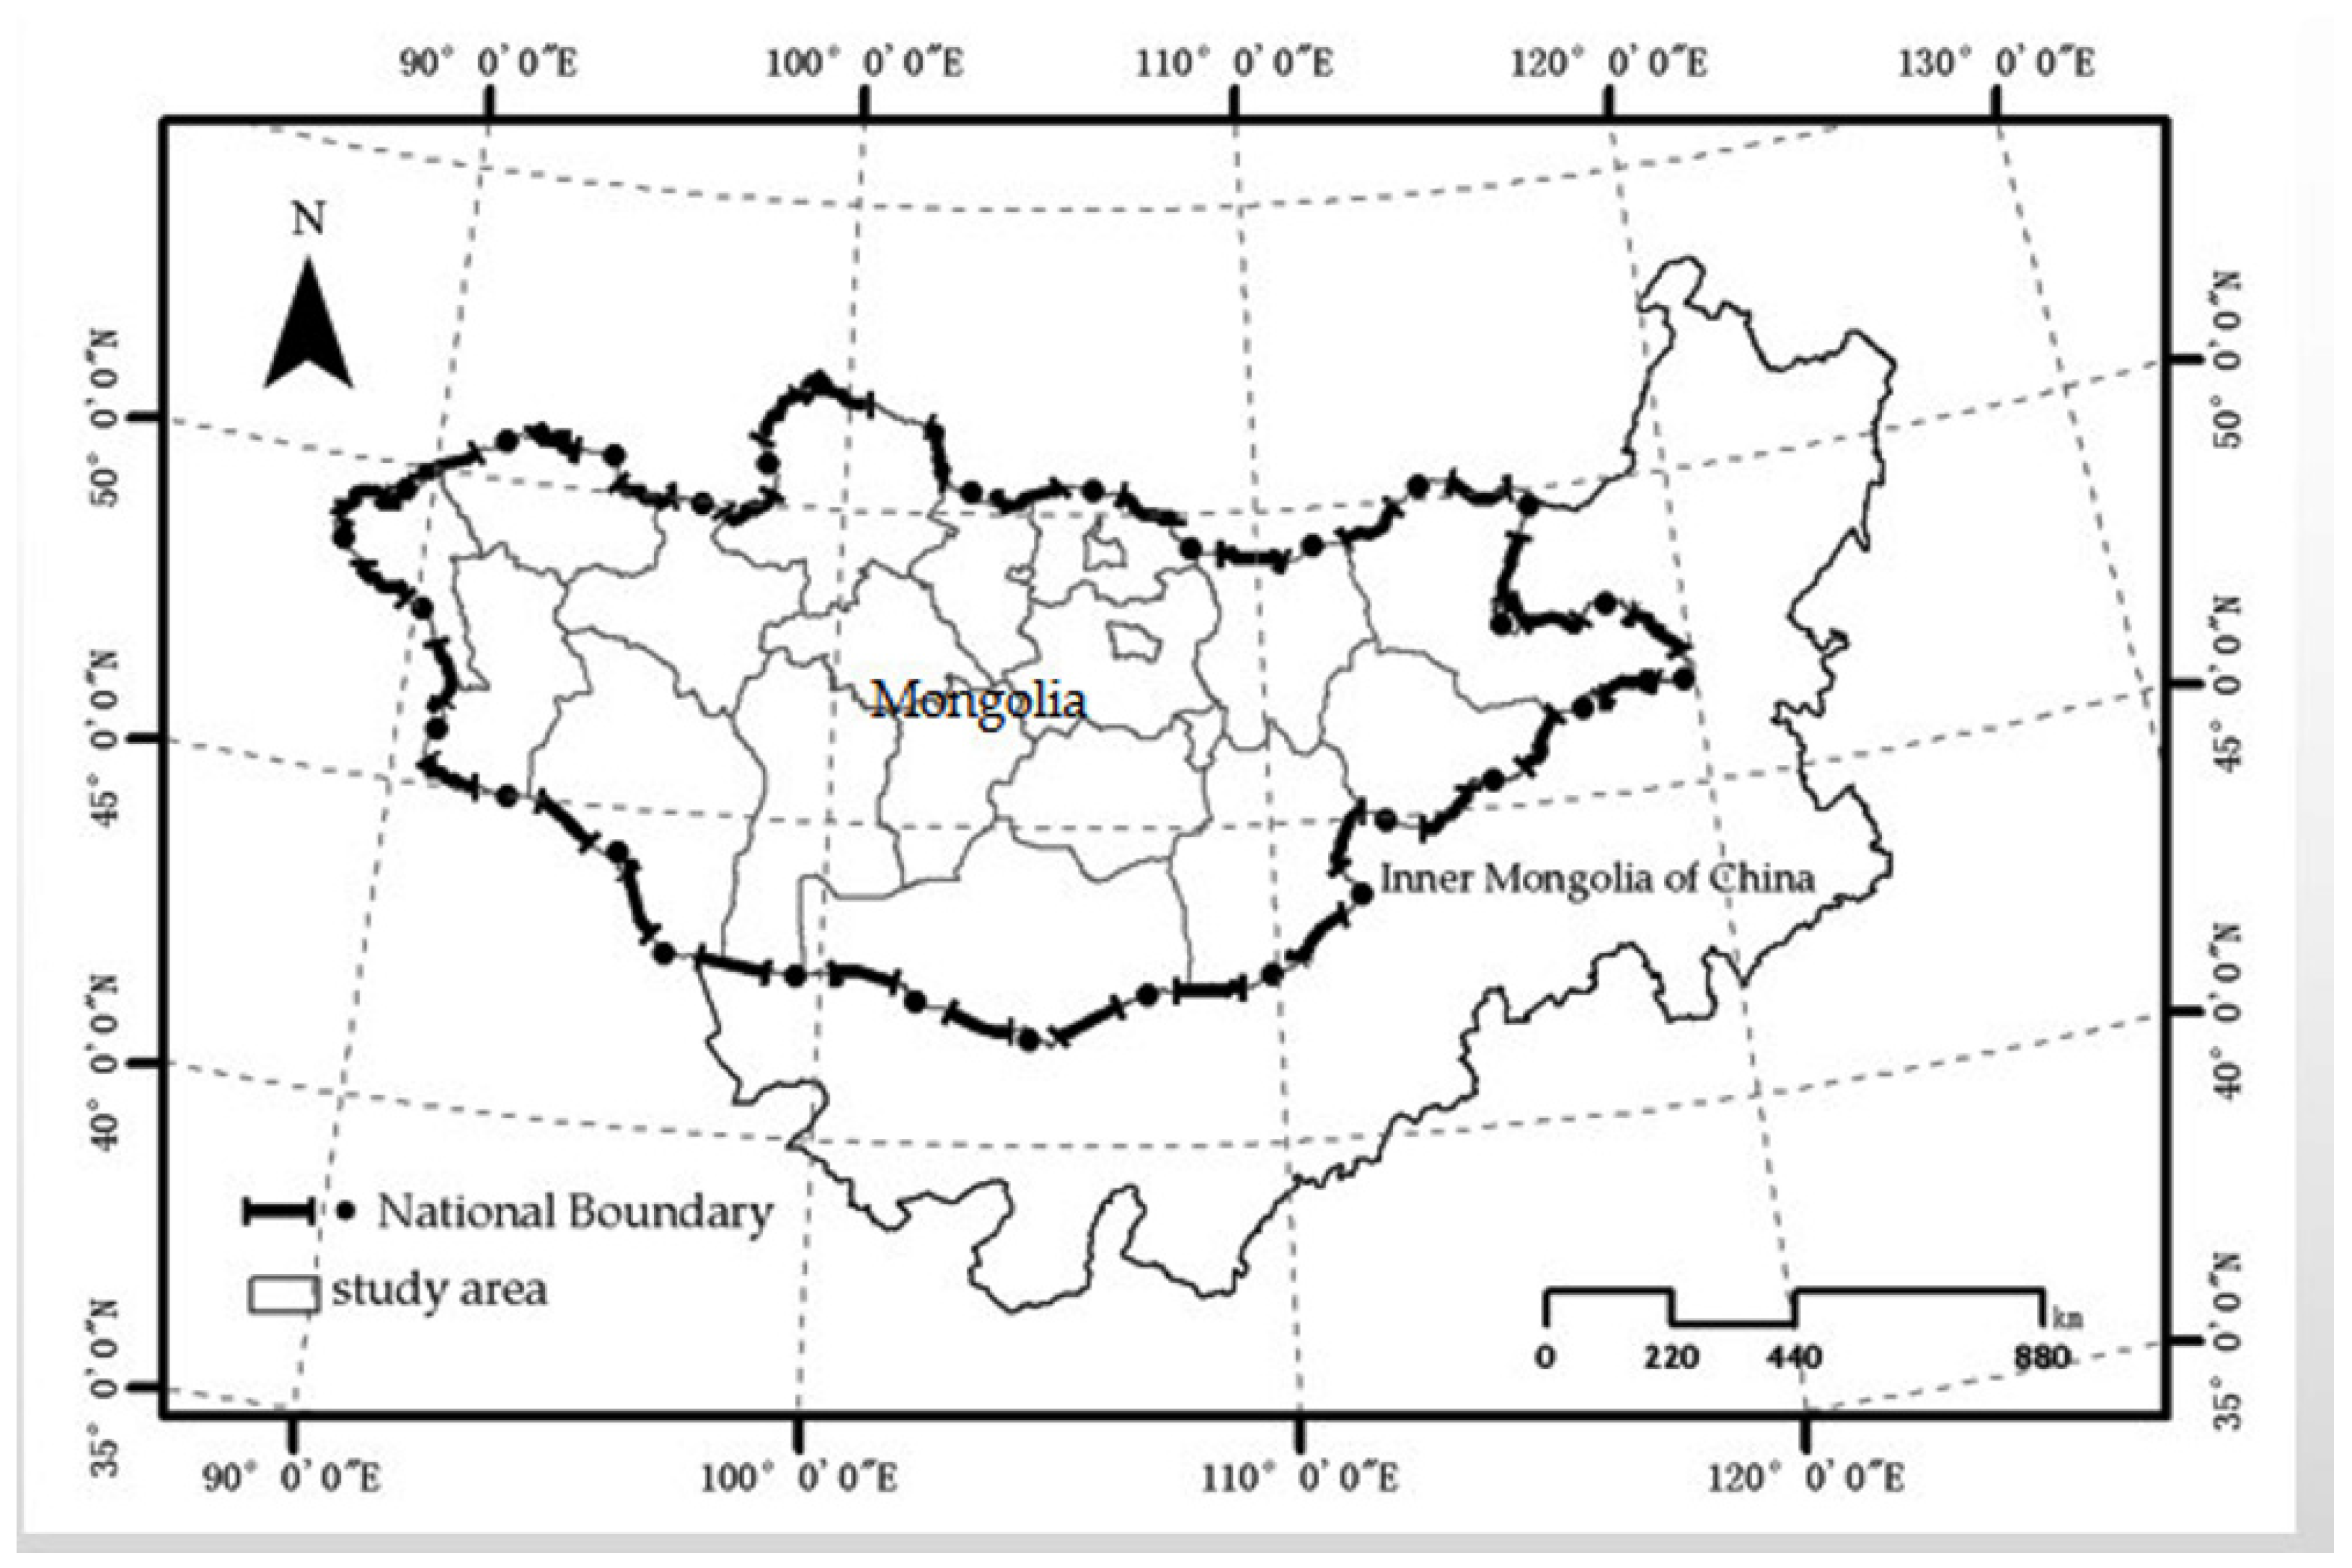
2.1. Study Area
2.2. Data Sources
2.3. Model and Methods
2.3.1. Analysis of the Distribution Pattern
2.3.2. Analysis of Rate of Change
2.3.3. Analysis of Change Direction
2.3.4. Analysis of the Land Utilization Degree
2.3.5. Comparative Analysis of Mongolia and Inner Mongolia
3. Results
3.1. Pattern and Change of Land Use
3.1.1. Forest Area
3.1.2. Grassland Area
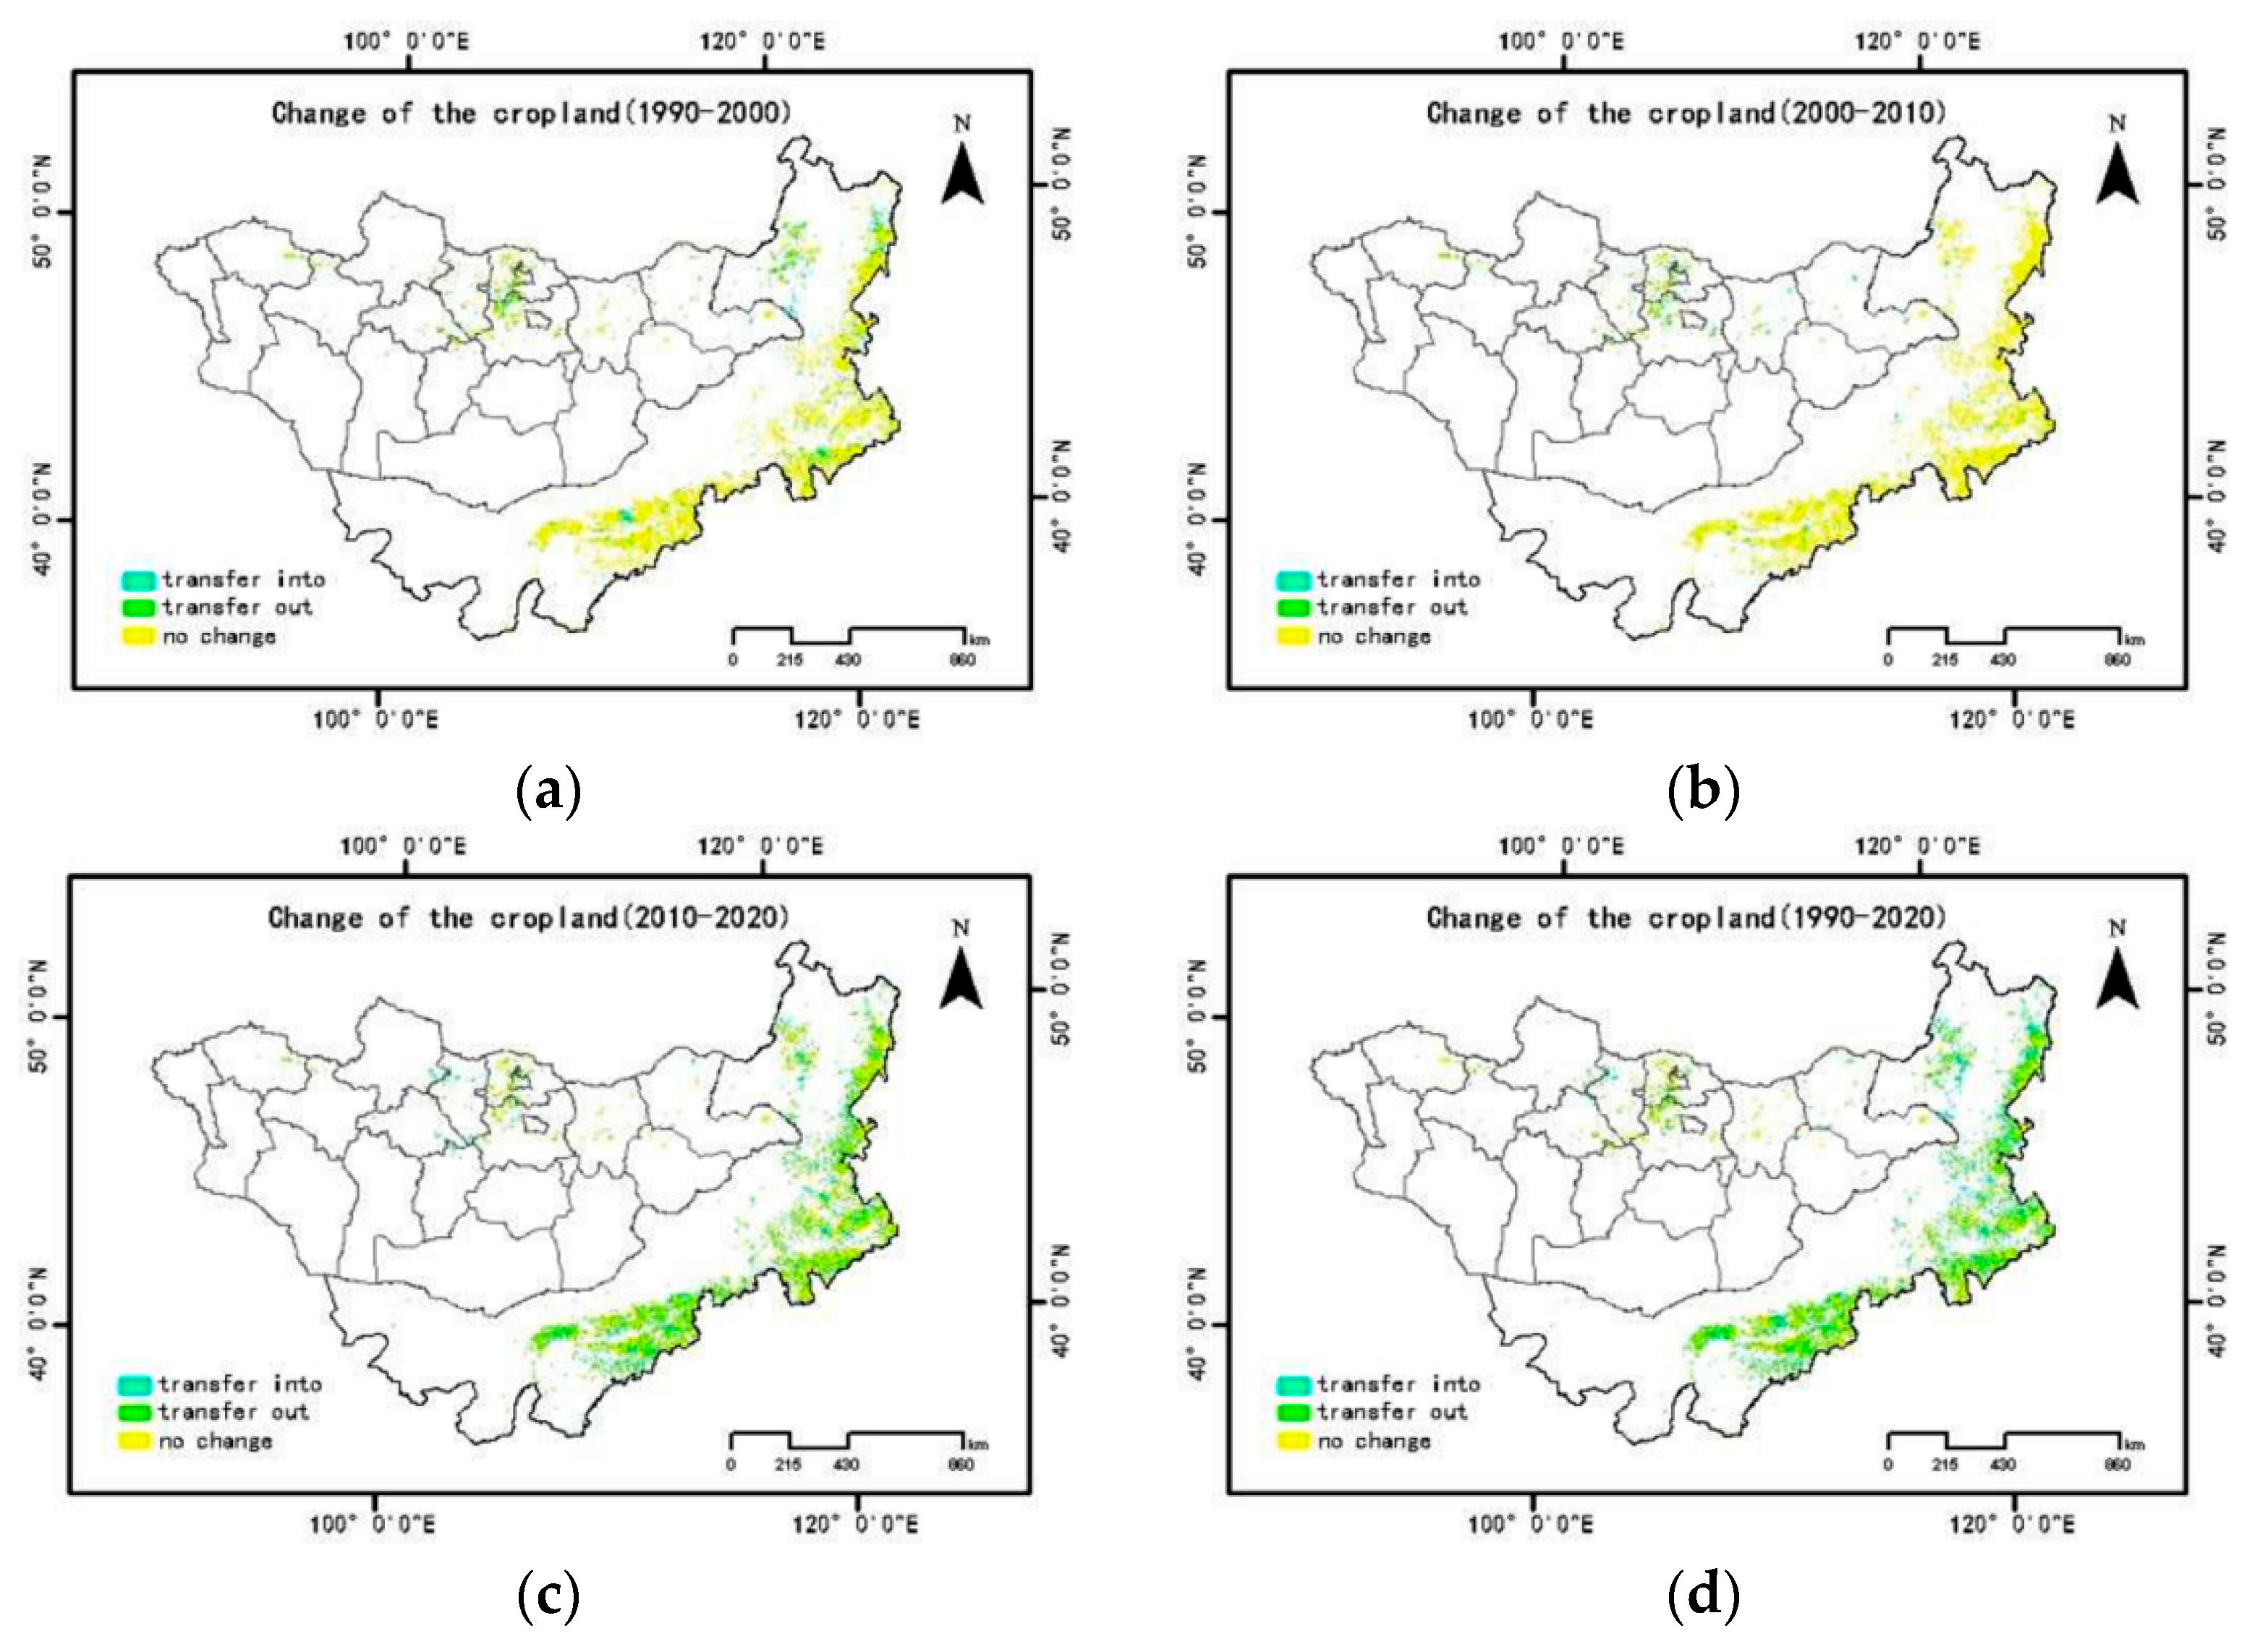
3.1.3. Cropland Area
3.1.4. Built Area
3.1.5. Water Area
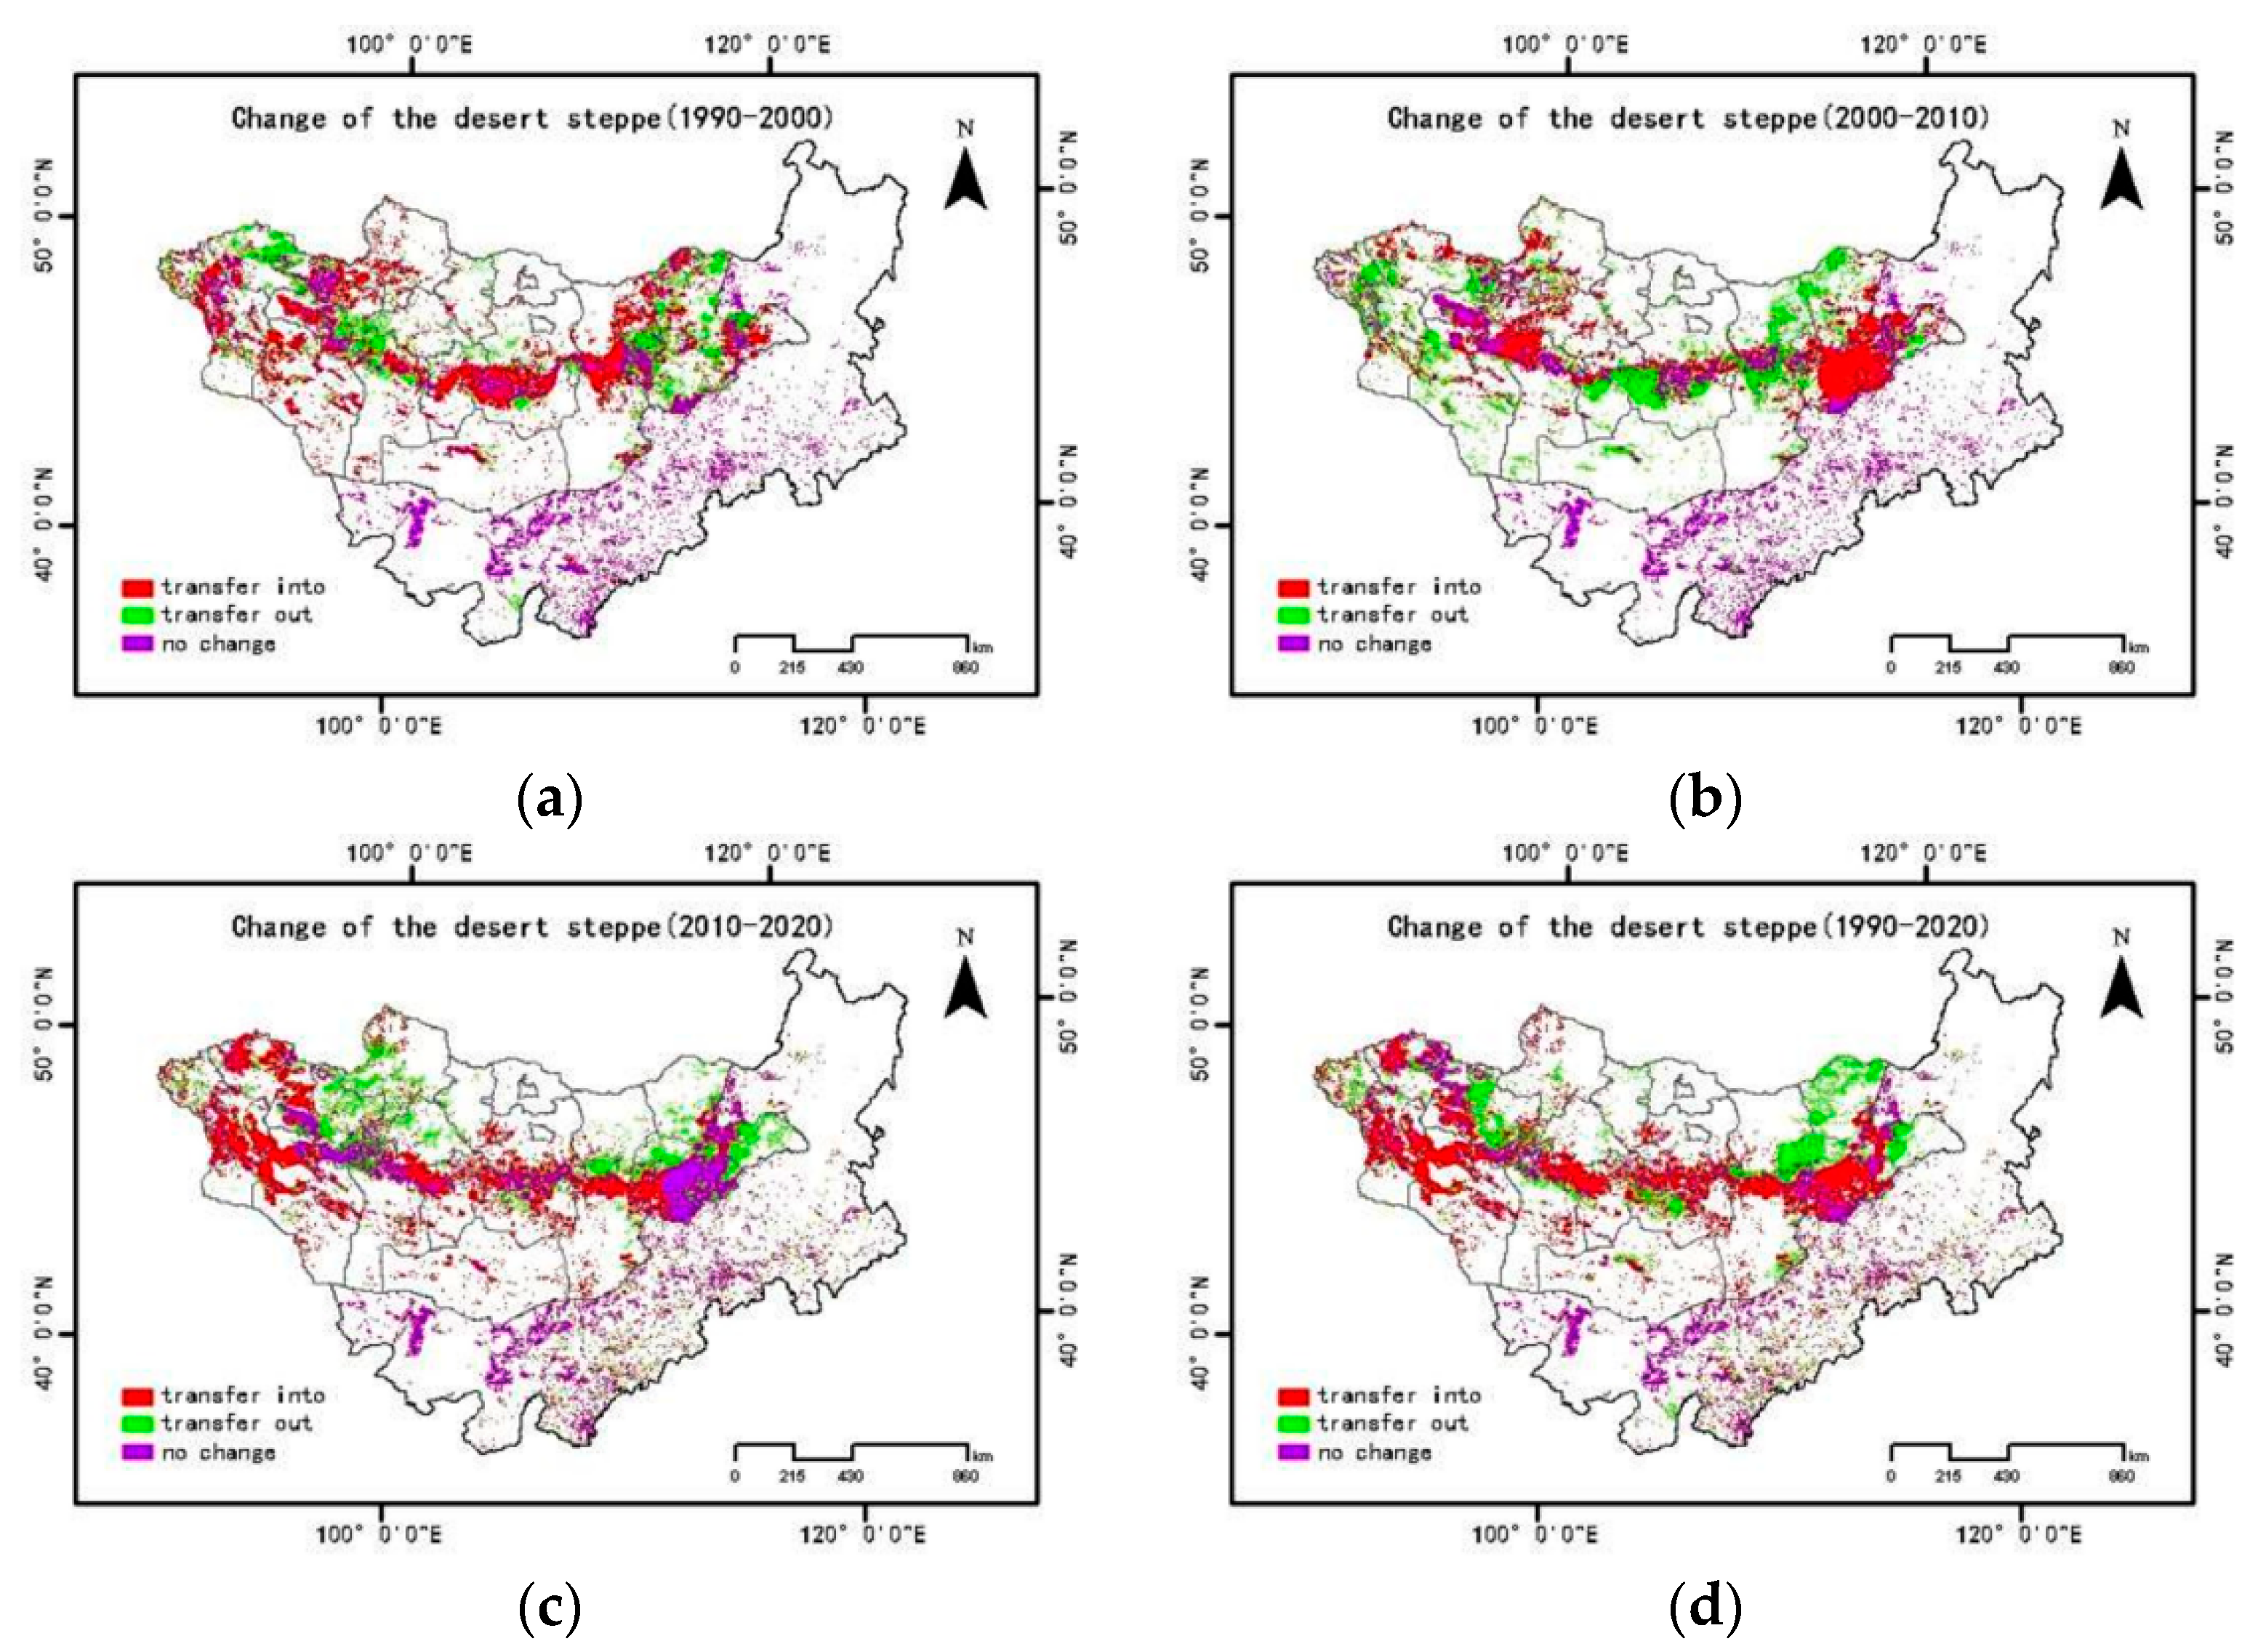
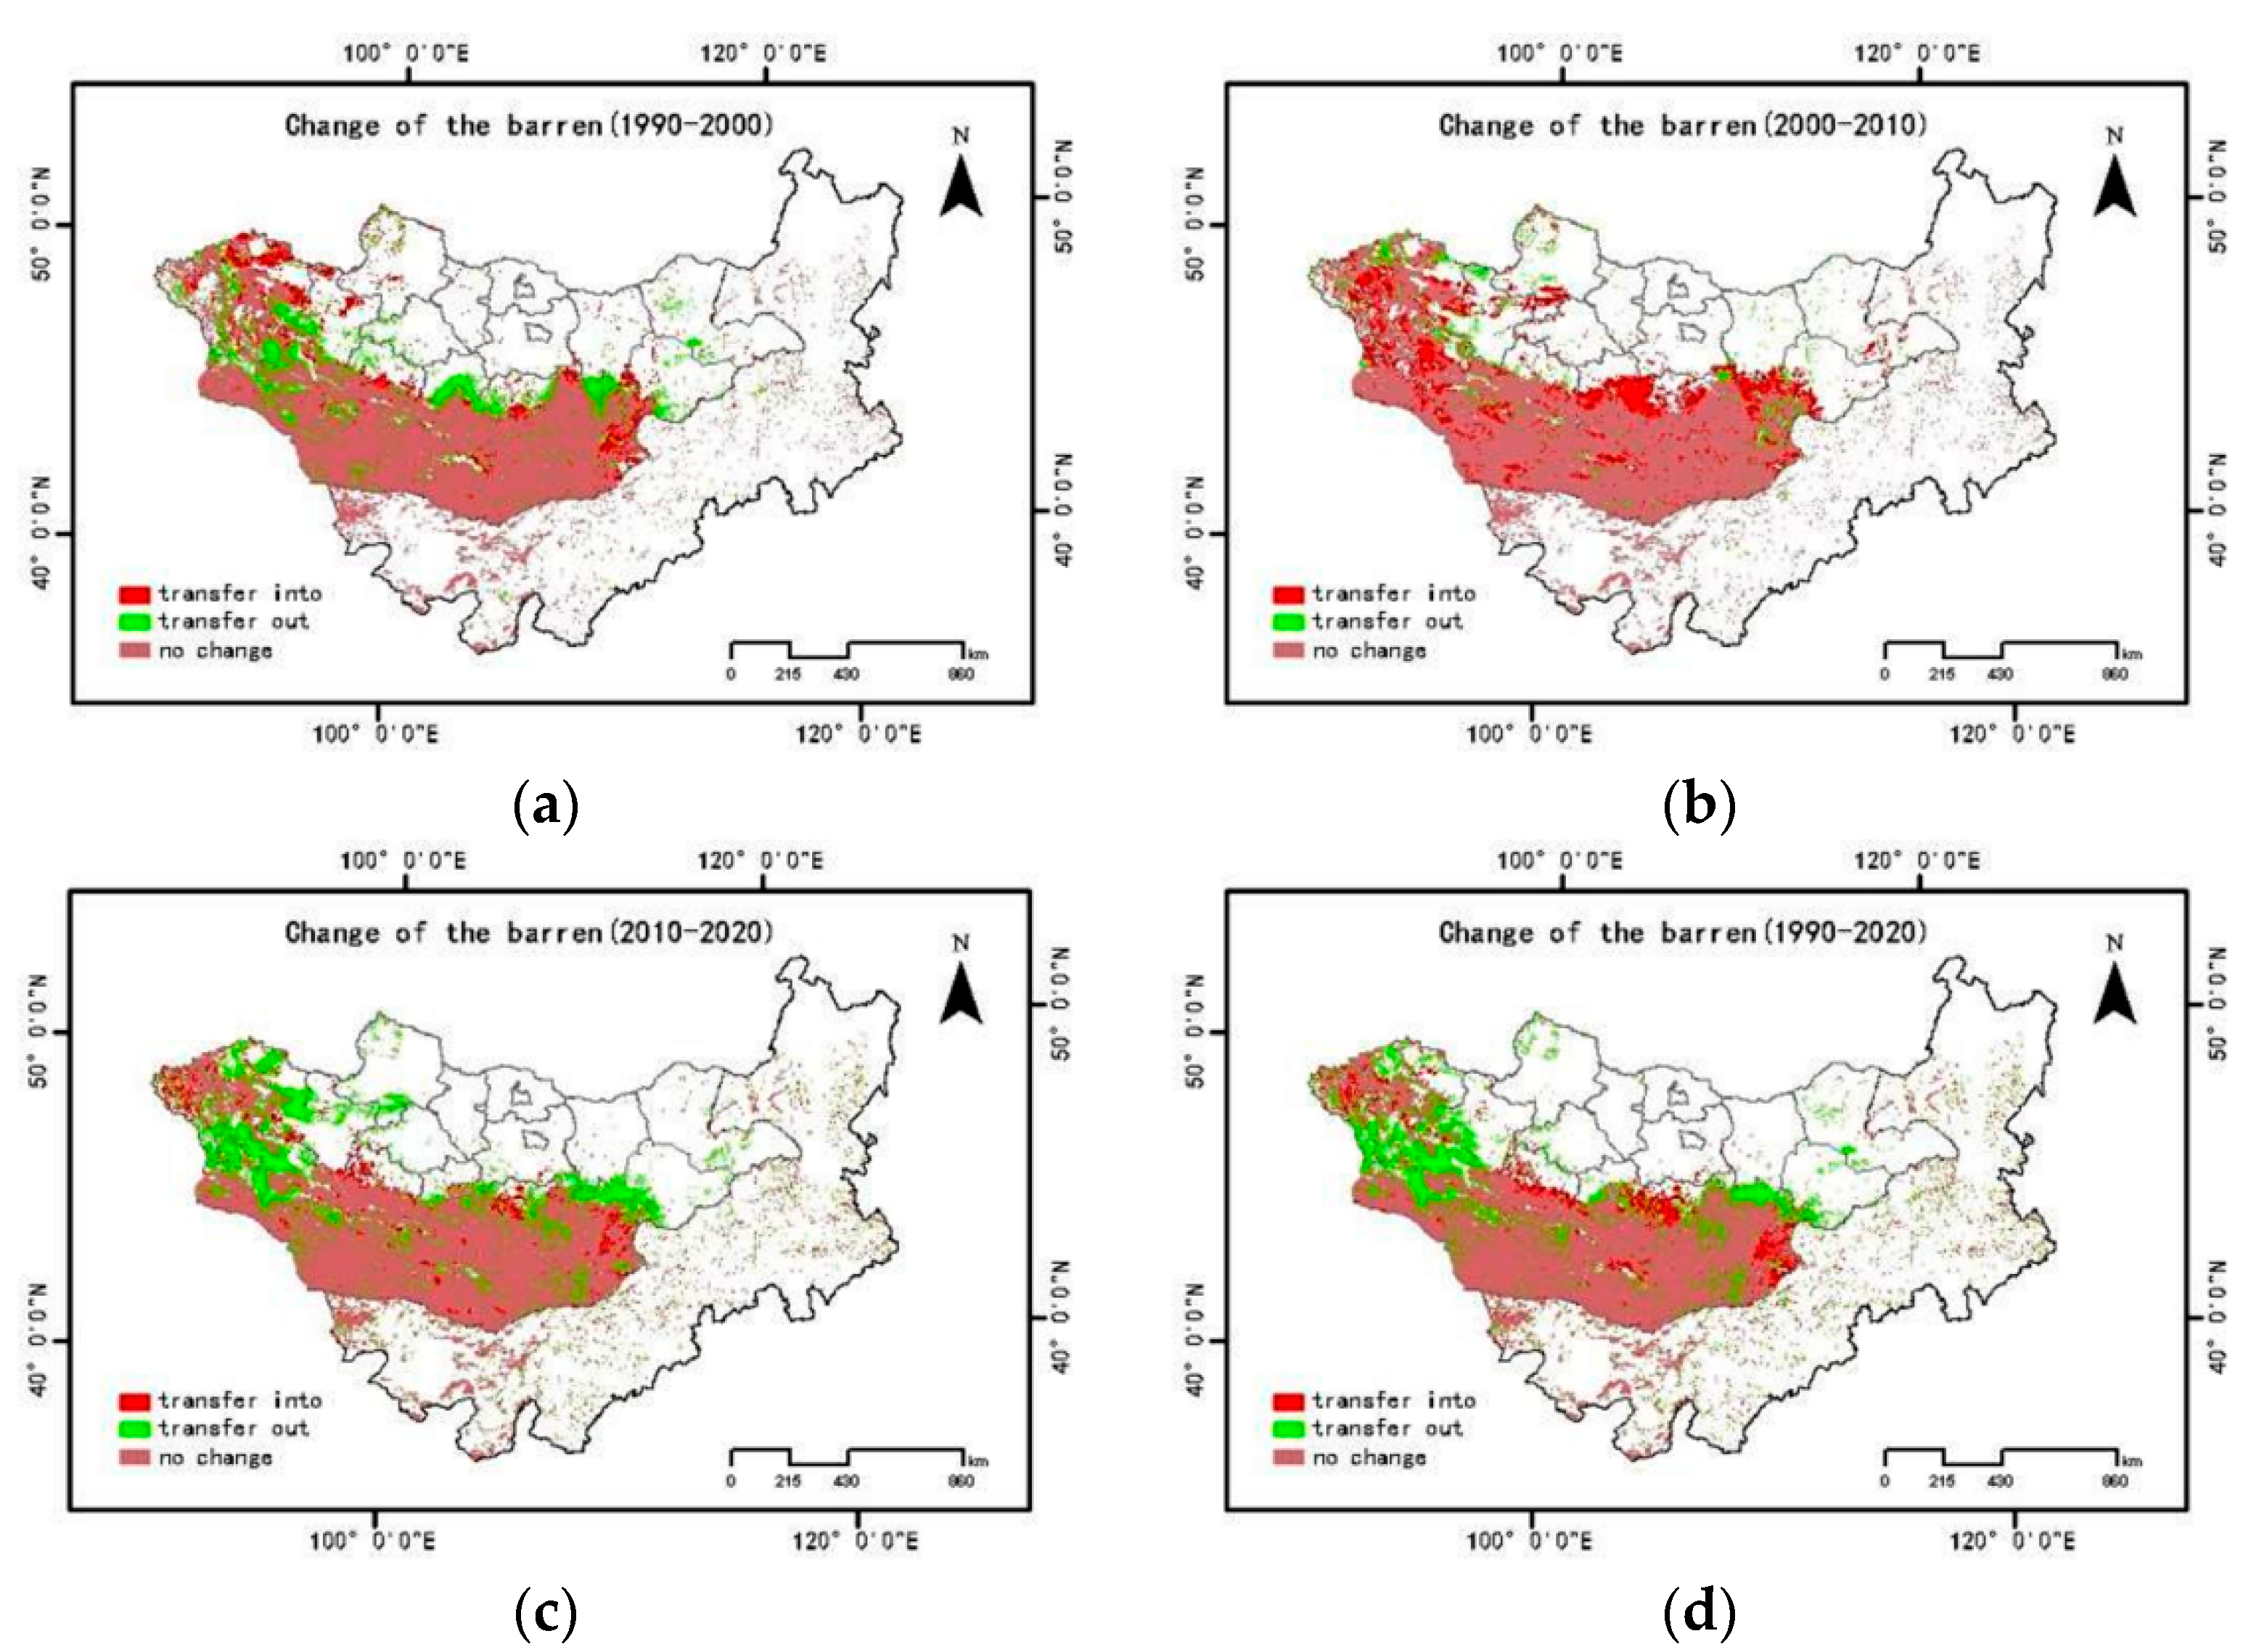
3.1.6. Barren Area
3.1.7. Sand Area
3.2. Analysis of Land Use Degree
3.2.1. Land Use Dynamic Degree
3.2.2. Comparative Analysis of Mongolia and Inner Mongolia
4. Analysis and Discussion of Sustainable Development Status
4.1. Cropland (Related to SDG2)
4.2. Water (Related to SDG6)
4.3. Built Area (Related to SDG11)
4.4. Forest, Grassland, Barren, and Sand Areas (Related to SDG15)
4.4.1. Forest Coverage Rate
4.4.2. Land Degradation
5. Conclusions
Author Contributions
Funding
Institutional Review Board Statement
Informed Consent Statement
Data Availability Statement
Acknowledgments
Conflicts of Interest
References
- Buren, G. Research on the Status, Causes of Desertification and the Prospect of Grassland Animal Husbandry in Mongolia. Master’s Thesis, Inner Mongolia University, Hohhot, China, 2011. [Google Scholar]
- Wang, Y.X. Empirical Study on Grassland Resource Degradation and Its Influencing Factors in Inner Mongolia. Master’s Thesis, Inner Mongolia Agricultural University, Hohhot, China, 2010. [Google Scholar]
- Wei, Y.Q.; Li, X.; Gao, F.; Huang, C.L.; Song, X.Y.; Wang, B.; Ma, H.Q.; Wang, P.L. The United Nations 2030 Sustainable Development Goals Framework and the China Response Strategy. Earth Prog. 2018, 33, 1084–1093. [Google Scholar]
- Oyungerel, A. Sustainable Development of Animal Husbandry in Mongolia. Master’s Thesis, Chinese Academy of Agricultural Sciences, Beijing, China, 2018. [Google Scholar]
- Yang, I. Research on Sustainable Animal Husbandry Development in Inner Mongolia. Master’s Thesis, Chinese Academy of Agricultural Sciences, Beijing, China, 2010. [Google Scholar]
- Wei, Y.J.; Zhen, L.; Liu, X.L.; Ochirbat, B. Land use change in Mongolia in 1992–2005. J. Appl. Ecol. 2008, 9, 1995–2002. [Google Scholar]
- Wang, N.; Yang, G.; Han, X.Y.; Jia, G.P.; Liu, F.; Li, T.; Jia, N. Land use change and ecosystem service value in Inner Mongolia from 1990–2018. J. Soil Water Conserv. 2020, 34, 244–250. [Google Scholar] [CrossRef]
- Ulan, T. Characteristics of plateau grassland utilization in Mongolia and its country differences. J. Geogr. 2021, 76, 1722–1731. [Google Scholar]
- Li, J.W.; Dong, S.C.; Li, Y.; Yang, Y.; Boldanov, T. Study on the land use change pattern and its driving factors of the China-Mongolia-Russia Economic Corridor. Geogr. Res. 2021, 40, 3073–3091. [Google Scholar]
- Cheng, K.; Wang, J.L.; Jaahanaa, D.; Han, X.H. Analysis of urban expansion and driving force of Ulaanbaatar, Mongolia in nearly 30 a. Remote Sens. Technol. Appl. 2019, 34, 90–100. [Google Scholar]
- Gao, H.D.; Zachura; Meng, F.H.; Luo, M.; Wang, M.L.; Zhang, H.C. The analysis of the spatial and temporal dynamics of permafrost on the Mongolian Plateau in Year ADIYASaruulzaya 2003–2019. Drought Zone Resour. Environ. 2022, 36, 99–106. [Google Scholar] [CrossRef]
- Yao, J.Y. Analysis of Water Extraction and Its Geographical Influence of Selinger River Basin in Mongolia Based on GEE. Master’s Thesis, Shandong University of Technology, Qingdao, China, 2021. [Google Scholar] [CrossRef]
- Zhang, W.J. Analysis of the Spatial and Temporal Changes and Driving Force of Cultivated Land in Mongolia in the Past 20 Years. Master’s Thesis, Inner Mongolia Normal University, Baotou, China, 2019. [Google Scholar]
- Shi, H.D.; Zhou, X.D.; Meng, F.H. LUCC regional differentiation between Mongolia and Inner Mongolia for 30 years. J. Earth Inf. Sci. 2013, 15, 719–725. [Google Scholar]
- Zhou, X.Y.; Shi, H.D.; Wang, X.R. Effects of climate change and human activity on vegetation cover changes in the Mongolian Plateau. Drought Zone Study 2014, 31, 604–610. [Google Scholar] [CrossRef]
- Wang, J.L.; Cheng, K.; Zhu, J.X.; Liu, Q. Development and spatial pattern analysis of 30-m-resolution land cover products in Mongolia. J. Earth Inf. Sci. 2018, 20, 1263–1273. [Google Scholar]
- Liu, J.Y.; Kuang, W.H.; Zhang, Z.X.; Xu, X.L.; Qin, Y.H.; Ning, J.; Zhou, W.; Zhang, S.W.; Li, R.D.; Yan, Y.Z.; et al. The Basic Characteristics and Space Pattern of Land Use Changes in China since the late 1980s. J. Geogr. 2014, 69, 3–14. [Google Scholar]
- Xie, H.L.; Liu, L.M.; Li, B.; Zhang, X.S. Multiscale spatial autocorrelation analysis of land use changes—Takes Onniu Banner, Inner Mongolia as an example. J. Geogr. 2006, 4, 389–400. [Google Scholar]
- Liu, J.Y.; Zhang, Z.X.; Xu, X.L.; Kuang, W.H.; Zhou, W.; Zhang, S.W.; Li, R.D.; Yan, C.Z.; Yu, D.S.; Wu, S.X. Spatial pattern and driving force analysis of land use change in China in the early 201st century. J. Geogr. 2009, 64, 1411–1420. [Google Scholar]
- Li, J.J. Land Use/Covering Change and Its Driving Force Analysis in the Loess Plateau. Master’s Thesis, Northwest A&F University, Xianyang, China, 2017. [Google Scholar]
- Li, Y.; Liu, G. Characterizing Spatiotemporal Pattern of Land Use Change and Its Driving Force Based on GIS and Landscape Analysis Techniques in Tianjin during 2000–2015. Sustainability 2017, 9, 894. [Google Scholar] [CrossRef] [Green Version]
- Zhang, B.; Zhang, Q.; Feng, C. Understanding Land Use and Land Cover Dynamics from 1976 to 2014 in Yellow River Delta. Land 2017, 6, 20. [Google Scholar] [CrossRef] [Green Version]
- Li, X.W.; Fang, C.Y.; Park, S.L. Land use changes and their ecological environment effects in the lower reaches of the Yangtze River in the past 10 years. J. Geogr. 2003, 5, 659–667. [Google Scholar]
- Fu, B.; Chen, L.D.; Ma, C. Index system and method for the evaluation of sustainable land utilization. J. Nat. Resour. 1997, 12, 112–118. [Google Scholar]
- Geng, Y.; Liang, X.Y.; Li, T.; Liu, D.; Xu, J.Y. Study on multifunctional spatial-temporal division and zoning management of Loess Plateau in Northern Shaanxi. J. Northwestern Univ. (Nat. Sci. Ed.) 2022, 52, 32–42. [Google Scholar] [CrossRef]
- Zhang, J.Y.; Lu, F.T.; Mai, J.K.; Wang, Y.Y.; Wang, B. Analysis of landscape ecological risk evolution based on land use/overchange. Geospat. Inf. 2021, 19, 44–49. [Google Scholar]
- Li, X.W.; Wang, Z.Q. Analysis of the coupling law of land use and ecological environment in Urumqi based on GIS. Resour. Ind. 2021, 23, 86–94. [Google Scholar] [CrossRef]
- Hong, H. Evaluation of spatial layout of land use planning under GIS. Mapp. Spat. Geogr. Inf. 2021, 44, 113–117. [Google Scholar]
- Zhao, J.C.; Niu, Y.W.; Xiao, J.; Zhang, Z.X. Study on spatiotemporal Pattern of Carbon emission in Yueyang Based on Land Use Change. J. Hunan Univ. Technol. 2022, 36, 10–19. [Google Scholar]
- Wang, J.F. Match Relationship between Salinization and Utilization of Yellow Triangle Land and Its Functional Suitability Evaluation. Master’s Thesis, Shandong Agricultural University, Tai’an, China, 2021. [Google Scholar] [CrossRef]
- Shu, T.; Xiong, K.N.; Lisa, C. Land use and landscape pattern change under rocky desertification control. Southwest Agric. J. 2022, 35, 446–452. [Google Scholar] [CrossRef]
- Li, Y.B.; Jin, X.B.; Wu, K.; Han, B.; Sun, R.; Jiang, G.D.; Zhou, Y.K. Evaluation of the regional sustainable development of land use system: Method and evidence. J. Nat. Resour. 2022, 37, 166–185. [Google Scholar]
- Diao, H.T.; Leng, G.L. Research on Land Desertification in Tamusi Banner, Inner Mongolia Based on Remote sensing. Agric. Technol. 2022, 42, 92–95. [Google Scholar] [CrossRef]
- Zhang, T. Study on the Mechanism of Sandstorm Disaster Formation and Desertification Control in Northern China. Bachelor’s Thesis, Lanzhou University, Lanzhou, China, 2008. [Google Scholar]
- Xu, N. Application of remote sensing and GIS technology in basic farmland protection—Takes Yangjiapo Town, Binhai New Area, Tianjin as an example. Tianjin Agric. Sci. 2019, 25, 23–26. [Google Scholar]
- Zhou, T.; Shao, D.G.; Gu, W.Q.; Yao, L. Effect of land use change on soil erosion in farming areas of the Qinghai-Tibet Plateau. Rural. Water Resour. Hydropower China 2022, 3, 120–126+133. [Google Scholar]
- Wang, D. Study on Water Quality Evaluation and Its Relationship with Land Use/Cover-Landscape Pattern in Typical Areas of Lake Abby Basin. Master’s Thesis, Xinjiang University, Urumqi, China, 2021. [Google Scholar] [CrossRef]
- Zhang, P. China’s forest policy for the 21st century. Science 2000, 288, 2135–2136, Erratum in 2000, 289, 16916. [Google Scholar] [CrossRef] [Green Version]
- Liu, B. Research on greenhouse gas emissions and net carbon sequestration of “Grain for Green” Program in China. Ying Yong Sheng Tai Xue Bao 2016, 27, 1693–1707. [Google Scholar]
- Cher; Wang, Y.; Zhen, H.; Xia, T.T.; Remina, S. Spatial coupling of land use/cover change and its ecological effect in Xinjiang Kashgar River Basin from 1990–2018. Southwest J. Agric. 2022, 35, 596–607. [Google Scholar] [CrossRef]
- Luan, J.K. Changes and Attribution of Surface Area and Actual Evapotranspiration in Mongolia Plateau. Master’s Thesis, Xi’an University of Technology, Xi’an, China, 2019. [Google Scholar]
- Ge, Y.X.; Ma, C. Takes the closed-flow zone of Pojianghaizi wetland as an example. Soil Water Conserv. Res. 2022, 29, 376–385. [Google Scholar] [CrossRef]
- Song, C.T.; Chen, Y.B.; Yin, G.Y.; Hou, Y.M.; Chen, Y.Y. Study on the correlation between land network and spatial heterogeneity in the main urban area of Qingdao as an example. J. Xi’an Univ. Technol. 2022. Available online: http://kns.cnki.net/kcms/detail/61.1294.n.20211213.1016.002.html (accessed on 13 March 2022).
- Rong, F.F. Study on Urban Land Use Change Based on RS Technology. Beijing Surv. Mapp. 2021, 35, 36–40. [Google Scholar] [CrossRef]
- Feng, Y.M.; Zheng, Y.; Dong, J.X.; Wan, R. Study on the Urban Extension Trend of Kunming City Based on Land Use Data. Geospat. Inf. 2020, 18, 85–89. [Google Scholar]
- Zhang, S.J.; Du, S.Y.; Liu, X.Y.; Niu, W.T. Study on the spatial and temporal differences and influencing factors of land use ecological efficiency in the Lower Yellow River urban agglomeration. Resour. Dev. Mark. 2022, 38, 280–289. [Google Scholar]
- Tong, W.; Lang, F.K. Remote sensing monitoring and analysis of land use/cover change in Wuhan in the past 20 years. Mapp. Geogr. Inf. 2021, 46, 83–87. [Google Scholar] [CrossRef]
- Zhou, P.P.; Shu, Y.G.; Chen, Z.L.; Chen, Q.S. Chemical weathering characteristics of lime soil under different land use methods in karst mountains. Grass Ind. J. 2020, 29, 38–49. [Google Scholar]
- Pan, Y. Research on Important Issues of the 5th Phase of the Construction of Three North Shelter Forest System; China Forestry Publishing House: Beijing, China, 2010. [Google Scholar]
- Bureau of Three North Protection Forest Construction, Ministry of Forestry. The “Three North” Protection Forest System Construction of China; China Forestry Publishing House: Beijing, China, 1992.
- Luo, M.; Long, H. Summary of Land Degeneration Studies. Ecol. Environ. 2005, 2, 287–293. [Google Scholar] [CrossRef]
- Liu, J.Y.; Xu, X.L.; Shao, Q.Q. Spatiotemporal characteristics of grassland degradation in the Sanjiangyuan region of Qinghai Province in recent 30 years. J. Geogr. 2008, 4, 364–376. [Google Scholar]
- Duan, B.; Liu, X.W.; Guo, R.X.; Song, Q.; Di, X.H.; Duan, M.K. Analysis of the causes of the “3 15” strong sandstorm in the north. Drought Weather. 2021, 39, 541–553. [Google Scholar]
- Haas; Gai, Z.Y. Research on Desertification Control in China Based on Policy Process. Res. Sci. Manag. 2021, 39, 29–36. [Google Scholar] [CrossRef]
- Wang, P.L.; Gao, F.; Huang, C.L.; Song, X.Y.; Wang, B.; Wei, Y.Q.; Niu, Y.B. Progress Study on the Evaluation Index System of Urban Sustainable Development for SDGs. Remote Sens. Technol. Appl. 2018, 33, 784–792. [Google Scholar]
- Xue, J.C.; Wu, T. Evaluation of Inner Mongolia based on three-stage SBM-DEA. Ecol. Econ. 2020, 36, 98–103 + 111. [Google Scholar]
- Cao, J.B. Spatiand temporal distribution of Xilin Gol League and its response to drought. Master’s Thesis, Inner Mongolia Normal University, Baotou, China, 2021. [Google Scholar] [CrossRef]
- Li, X.B.; Li, Y.F.; Chen, L.; Su, Y.; Zhu, Z.Y. Effects of different land use methods on soil active organic carbon in Ningxia desert grassland. North. Gard. 2021, 1, 91–99. [Google Scholar]
- Fan, Y.D.; Shi, P.J.; Zhou, J.H.; Ji, M.M. Analysis of the sandstorm change trend of China in the past 50 years. J. Nat. Disaster 2005, 3, 22–28. [Google Scholar]
- Jiang, L.; Xiao, Y.; Rao, E.M.; Wang, L.Y.; Yang, Z.Y. Effect of land use changes in Inner Mongolia on windbreak and sand fixation function in Inner Mongolia. J. Ecol. 2016, 36, 3734–3747. [Google Scholar]
- Wang, X.; Diao, Z.Y.; Zheng, Z.R.; Jin, S.L.; Ma, P.; Lu, S.H. Study on spatial-temporal dynamics of desertification in adjacent grassland areas of China and Mongolia. Environ. Sci. Res. 2021, 34, 2935–2944. [Google Scholar] [CrossRef]
- Liu, Q. Analysis of Land Cover Landscape and Change in Cross-Border Areas in the Past 20 Years. Master’s Thesis, Jiangxi Agricultural University, Nanchang, China, 2016. [Google Scholar]
- Zhang, J.; Liu, J.H.; Wang, Z.W.; Li, Z.G.; Han, H.D.; Qu, Z.Q. Response of Inner Mongolia desert grassland plant community characteristics to grazing utilization and precipitation conditions. Chin. J. Meadows 2020, 42, 67–74. [Google Scholar] [CrossRef]
- Guo, X.N. The Evolution Trend, Driving Mechanism and Ecological Effect of Desertification on the Mongolian Plateau in the Past 20 Years. Bachelor’s Thesis, East China Normal University, Shanghai, China, 2021. [Google Scholar] [CrossRef]
- Wang, H.; Xiao, H. Desertification Control and Achievements in Mongolia. World Knowl. 2021, 9, 33–35. [Google Scholar]
- Zhang, L.; Fan, F.; Wu, H.; Zou, Y.H.; Zhou, Z.H.; Zhang, X.; Gao, S.B. Diagnosis of sandstorm weather process and analysis of dust pollution transportation process in northern China on March 14–16, 2021. J. Environ. Sci. 2022, 42, 1–13. [Google Scholar] [CrossRef]


| Type | Barren and Sand | Forest, Water and Grassland | Cropland | Built Area |
|---|---|---|---|---|
| Land use grading index | 1 | 2 | 3 | 4 |
| Type | 1990 | 2000 | 2010 | 2015 | 2020 |
|---|---|---|---|---|---|
| Area (km2) | Area (km2) | Area (km2) | Area (km2) | Area (km2) | |
| forest | 297,307.71 | 274,890.71 | 271,041.79 | 275,259.98 | 292,824.09 |
| meadow steppe | 269,024.80 | 250,092.97 | 261,140.46 | 266,330.59 | 270,401.97 |
| real steppe | 598,047.25 | 640,716.12 | 570,165.39 | 568,514.86 | 629,169.69 |
| desert steppe | 335,509.89 | 398,305.17 | 364,323.40 | 452,786.43 | 429,568.01 |
| cropland | 120,292.07 | 125,679.53 | 124,648.73 | 123,006.46 | 126,183.75 |
| built | 10,388.93 | 10,624.71 | 11,112.45 | 13,974.20 | 15,290.70 |
| barren | 815,336.66 | 745,567.10 | 842,159.09 | 760,906.61 | 705,819.13 |
| water | 32,406.27 | 32,039.37 | 31,980.00 | 32,715.97 | 32,225.39 |
| sand | 227,978.21 | 228,405.51 | 229,728.38 | 236,781.62 | 239,466.57 |
| Areas | 1990–2000 | 2000–2010 | 2010–2015 | 2015–2020 | 1990–2020 |
|---|---|---|---|---|---|
| forest | 0.15 | 0.18 | 0.03 | 0.00 | 0.54 |
| meadow steppe | 0.09 | 0.01 | 0.02 | 1.26 | 0.08 |
| real steppe | 0.09 | 0.08 | 1.04 | 0.14 | 0.33 |
| desert steppe | 0.02 | 0.03 | 0.02 | 0.02 | 0.04 |
| cropland | 0.33 | 0.03 | 0.01 | 0.00 | 0.37 |
| built | 0.68 | 3.25 | 0.87 | 0.06 | 0.27 |
| barren | 0.10 | 0.00 | 0.12 | 0.01 | 0.16 |
| water | 0.73 | 1.42 | 1.66 | 0.49 | 0.88 |
| sand | 0.09 | 0.87 | 0.01 | 0.00 | 0.02 |
| 1990 | 2000 | 2010 | 2015 | 2020 | |
|---|---|---|---|---|---|
| Mongolian Plateau | 166.66 | 169.44 | 165.82 | 168.99 | 171.23 |
| Mongolia | 153.97 | 158.23 | 151.97 | 157.14 | 160.93 |
| Inner Mongolia | 184.05 | 184.80 | 184.79 | 185.47 | 185.63 |
Publisher’s Note: MDPI stays neutral with regard to jurisdictional claims in published maps and institutional affiliations. |
© 2022 by the authors. Licensee MDPI, Basel, Switzerland. This article is an open access article distributed under the terms and conditions of the Creative Commons Attribution (CC BY) license (https://creativecommons.org/licenses/by/4.0/).
Share and Cite
Zhang, Y.; Wang, J.; Wang, Y.; Ochir, A.; Togtokh, C. Land Cover Change Analysis to Assess Sustainability of Development in the Mongolian Plateau over 30 Years. Sustainability 2022, 14, 6129. https://0-doi-org.brum.beds.ac.uk/10.3390/su14106129
Zhang Y, Wang J, Wang Y, Ochir A, Togtokh C. Land Cover Change Analysis to Assess Sustainability of Development in the Mongolian Plateau over 30 Years. Sustainability. 2022; 14(10):6129. https://0-doi-org.brum.beds.ac.uk/10.3390/su14106129
Chicago/Turabian StyleZhang, Yu, Juanle Wang, Yi Wang, Altansukh Ochir, and Chuluun Togtokh. 2022. "Land Cover Change Analysis to Assess Sustainability of Development in the Mongolian Plateau over 30 Years" Sustainability 14, no. 10: 6129. https://0-doi-org.brum.beds.ac.uk/10.3390/su14106129