Article

Spatio-Temporal Evolution Dynamic, Effect and Governance Policy of Construction Land Use in Urban Agglomeration: Case Study of Yangtze River Delta, China

School of Architecture, Southeast University, Nanjing 210096, China
*
Author to whom correspondence should be addressed.
Sustainability 2022, 14(10), 6204; https://0-doi-org.brum.beds.ac.uk/10.3390/su14106204
Submission received: 15 April 2022 / Revised: 11 May 2022 / Accepted: 18 May 2022 / Published: 19 May 2022
(This article belongs to the Special Issue Land Use Change, Air Quality and Environmental Pollution Government)

Abstract

:
The urban construction land change is the most obvious and complex spatial phenomenon in urban agglomerations which has attracted extensive attention of scholars in different fields. Yangtze River Delta Urban Agglomeration is the most mature urban agglomeration in China, a typical representative in both China and the world. This paper analyzes the evolution dynamic, effect and governance policy of urban construction land in Yangtze River Delta Urban Agglomeration 2011–2020 using a combination of BCG model, decoupling model and GIS tools. The findings are as follows. (1) There are large intercity differences in urban construction land in urban agglomerations, but the spatial heterogeneity is gradually decreasing. (2) The change trends and evolution patterns of urban construction land in urban agglomerations are increasingly diversified, with emergence of a variety of types such as rapid growth, slow growth, inverted U-shape, stars, cows, question and dogs. (3) The population growth, economic development and income improvement corresponding to the change of urban construction land in urban agglomerations have no desirable effect, with most cities in the expansive negative decoupling state. (4) The decoupling types show increasingly complex changes, in evolution, degeneration and unchanged states. Affected by economic transformation and the outbreak of COVID-19, an increasing number of cities are in strong negative decoupling and degeneration states, threatening the sustainable development of urban agglomerations. (5) Based on the division of urban agglomerations into three policy areas of Transformation Leading, Land Dependent, and Land Reduction, the response strategies for each are proposed, and a differentiated land use zoning management system is established.

1. Introduction

1.1. Background

The United Nations Sustainable Development Summit was held on 25 September 2015 at its headquarters in New York, and the 193 member states of the United Nations officially adopted 17 sustainable development goals. Among these goals, to create sustainable cities and human settlements is ranked 11th. Creating jobs and achieving rapid urban growth without leading to land scarcity and resource constraints remains a huge challenge for countries around the world in the process of urbanization. Urban construction land serves as a carrier of social, economic, political and cultural activities of the city, and also a spatial basis to realize the overall functions of the city. Because urban construction land is one of the most scarce resources, optimizing the spatio-temporal evolution pattern of urban construction land and boosting the efficiency of land resource utilization, while reducing the consumption of land resources and improving the comprehensive carrying capacity of cities by leveraging technical and methodological innovation, planning and policy management, are the keys to achieving the sustainable development goals proposed by the United Nations.
Urban agglomeration refers to a spatially compacted, economically connected, and ultimately highly co-located and integrated group of cities, generally with one or more mega-cities as the core and more than one large city and small towns as the constituent units, formed by relying on a developed infrastructure network. Urban agglomeration is the highest form of spatial organization in the mature stage of urban development, and its name varies slightly in different countries; for example, it is known as ‘metropolitan district/area’ in the United States, ‘town cluster’ in the United Kingdom, ‘megalopolis’ in France, and ‘urban agglomeration’ in China, but they share similar or the same meanings. Land use planning and policy is an advanced and strategic arrangement for future land development, utilization, management and protection in space and time in a certain region. It is made according to the requirements of sustainable regional, social, and economic development based on the local natural, economic, and social conditions. Land use planning and policy is designed to reinforce macro-control and management of land use to ensure rational use of land resources and secure the coordinated development of the national economy. As a comprehensive technique for intersectoral land resource allocation and spatio-temporal organization of land use, land use planning and policy has evolved as a common tool for governments around the world to deal with land change and land use management, and also a basis for land use management and land development intensity control.
The urban agglomeration is a product of regional industrialization and urbanization at the advanced stage, and it has become a new geographical unit for countries to participate in global competition and international division of labor. Urban construction land change in urban agglomerations is the most active, dramatic, obvious and complex spatial phenomenon in the region, and it has a comprehensive impact on the country’s economic growth, social development, ecological construction and environmental protection [1]. While urban land use has contributed to economic growth and social progress, it has also led to a series of “urban agglomeration diseases” such as loss of arable land, ecological damage, environmental pollution, and landscape fragmentation, posing a great challenge to the sustainable development of urban agglomerations [2,3]. Trying to figure out spatio-temporal change characteristics and evolution patterns of urban construction land in urban agglomerations and analyzing their economic, social, ecological and environmental effects will help reveal the spatial change patterns of urban agglomerations and also provide a basis for decision making in planning and policy design for high-quality development of urban agglomerations [4]. In general, at a time when urban agglomerations have become the mainstream and trend of urban development in the world, it is of great theoretical significance and practical value to conduct research on the characteristics of urban construction land evolution in urban agglomerations and their effects.
As the world’s largest developing country, China has experienced the world’s largest and fastest urbanization, industrialization, and globalization since its start of reform and opening up in 1978. Attaching great importance to the construction of urban agglomerations, the Chinese government upgraded it to a national strategy in 2006 and incorporated the construction of urban agglomerations into the national five-year development plan and the National New Urbanization Plan. In addition, it also promulgated several national-level special plans for development of urban agglomerations, such as the Yangtze River Delta, Beijing-Tianjin-Hebei, and Chengdu-Chongqing, and formulated a roadmap for the construction of more than 30 urban agglomerations in China. Urban agglomerations have now been the primary form of land and space development in China and the main carrier for promoting urbanization, industrialization and globalization, playing an increasingly prominent role in optimizing the allocation of resources and enhancing the radiation-driven role. Central government policies and local government finances are driving the expansion of urban construction land in China’s urban agglomerations, resulting in the loss of large amounts of arable land and increasing tension between people and land, threatening the sustainable development of regional and national economic, social, and ecological environments. Sustainable and sound urban agglomeration growth is independent of the development of urban construction land. In the development period when China is in transition, it has been a critical research topic to analyze the characteristics and comprehensive effects of urban construction land change in urban agglomerations and to reveal the spatio-temporal evolution patterns, which are necessary for scientific preparation of urban agglomeration development planning and spatial governance policy design [5].
YRDUA is an important intersection of “Belt & Road” and Yangtze River Economic Belt, holding a pivotal strategic position in China’s modernization and opening-up pattern. Covering an area of 358,000 km2 with a population of more than 200 million, YRDUA achieved a regional GDP of more than 20 trillion yuan in 2020. It is the urban agglomeration with the highest degree of concentration, the most developed economy, the largest scale and the most mature development in China. YRDUA has been identified as one of the six world-class urban agglomerations by French geographer Jean Gottmann, along with the Northeast Atlantic Coastal Agglomeration of the United States, the Great Lakes Urban Agglomeration of North America, the Pacific Coastal Agglomeration of Japan, the British Urban Agglomeration, and the Northwest European Urban Agglomeration. They are generally recognized as large world-class city agglomerations globally, and YRDUA is the only agglomeration in China that has been named. With the advancement of urbanization, industrialization and globalization, the scale and spatial characteristics of urban construction land in the Yangtze River Delta are also in constant change, which is quite typical in both China and the world.

1.2. Literature Review

The study of construction land change in urban agglomerations has been an important part of multiple sciences such as urban geography, land use, and urban planning, and many scholars have made rich research results from different professional perspectives, different spatio-temporal scales, and different content dimensions. Spatial monitoring, current characteristics, evolution mechanisms, trend prediction and simulation studies of urban construction land change in urban agglomerations are the mainstream topics, and ecological and environmental effects have become emerging research hotspots, while economic and social effects are under-researched. However, increasingly diverse and complex research methods and increasingly difficult translation to application have led to a certain degree of disconnection of academic and theoretical research from practical application and management needs.

1.2.1. Research on Dynamics and Driving Mechanism of Urban Construction Land

Current characteristics, change trends, and problem diagnosis are traditional fields of urban construction land research in urban agglomerations, with early start and many achievements, revealing that the driving mechanism of construction land changes in urban agglomerations is the focus and hotspot of current research in this field.
In terms of spatial change analysis, Moreira [6] analyzed the land use pattern of Lisbon metropolitan area and concluded that the combination of a static and dynamic view can provide a basis for spatial planning in the suburbs of urban agglomerations. Kim [7] compared and analyzed the relationship of land use change between two urban agglomerations of Los Angeles and Chicago in the United States and pointed out that the evolution of the relationship is largely determined by the history of urban design. Salvati [8] assessed the impact of concentrated and discontinuous urban expansion in 76 metropolitan areas in southern Europe (including Portugal, Spain, southern France, Italy and Greece) on high-quality land consumption. Shrestha [9] concluded that urban construction land fragmentation in the Phoenix Metropolitan Area is clearly characterized by population dynamics, water availability, technology and transport, institutions and topography as the most important driving factors. Depending on Landsat images from 1980, 1990, 2000 and 2010, Lu investigated the spatio-temporal pattern and influencing factors of urban land expansion in Wuhan Urban Agglomeration (WUA) in Central China [10].
In terms of dynamic analysis, Lu [11] analyzed the impact of land use change on landscape indexes of Columbus Metropolitan Area, including size, complexity, diversity, and neighborhood, using a landscape ecology approach. Mallinis [12] monitored land use changes in two suburban mountainous areas of Athens metropolitan area from 1945 to 2007. Lo [13] constructed an analytical model of land use change in the Georgia Metropolitan Area using the cellular automaton model and analyzed the impact of population growth and economic and social development on the expansion of urban construction land. Jiang [14] analyzed the evolution process and driving mechanism of industrial, residential and commercial land use in the Beijing metropolitan area based on multivariate spatial correlation and the Weaver-Tomas composite coefficient, and argued that the government should strengthen macro-control of the scale and spatial layout of urban construction land supply by land use planning. Galimberti [15], based on the case study of the Metropolitan Area of Rosario of Argentina, explained the characteristics, causes and social territorial impact of urban expansion in Latin America.
In terms of spatio-temporal evolution analysis, Yin [16] explored the spatio-temporal dynamics and evolution of land use/cover changes and urban expansion in Shanghai metropolitan area. Shoman [17] analyzed the scale, pattern and type of urban construction land change in Istanbul Metropolitan Area (IMA), Turkey from 1975 to 2014 using Remote sensing (RS) and Geographic Information Systems (GIS) tools. Li [18] quantitatively analyzed the magnitude, patterns, modes, types and efficiency of urban land expansion that the urban agglomerations in Brazil have experienced in the past 60 years by calculating annual expansion and landscape metrics, local Moran’s index, and land-use efficiency. Toure [19], Jagarnath [20], Dai [21], Li [22], Cao [23], Mathan [24], Wahyudi [25], Sigler [26], Sarzynski [27], Aguilera [28] analyzed the change process and modes of urban construction land in Ghana metropolitan area, Durban metropolitan area, Zhujiang River Delta, Chang-Zhu-Tan urban agglomeration, Wanjiang City Belt, Chennai Metropolitan Area, Jakarta Metropolitan Area, Australia metropolitan areas, United States metropolitan areas, and Granada Spanish metropolitan area. Medijiang [29] explored the spatio-temporal patterns of land use and population change dynamics in the St. Louis Metropolitan Statistical Area and found a significant causal relationship between the two. Wu [30] analyzed the dynamic characteristics and driving mechanisms of urban construction land in the Hangzhou metropolitan area and found that gross domestic product (GDP), per capita disposable income, population growth, and processes of industrialization and urbanization are the key driving factors.
Construction land change and its driving mechanism in urban agglomerations are rich in research achievements, and it is the most mature research field. However, the use of remote sensing and satellite data for analysis, the inconsistent caliber of sectoral data with the governments of urban agglomerations, and the incompatibility of management tools lead to greater difficulties in translating the findings of most papers into applications. Additionally, the data sources and research methods employed by different scholars vary widely, making it difficult to compare the results of different cases and empirical studies across regions, thus limiting the distillation and construction of universal laws.

1.2.2. Research on the Effect of Urban Construction Land Change

Urban construction land exerts multiple effects including economic growth, social development and ecological change, and current research is mainly focused on the ecological environment. Keys [31] analyzed the changes in the spatial structure of land use in the Phoenix Metropolitan Area from 1970 to 2000 and concluded that urban construction land, especially the central business district, dominated the development of urban agglomerations and had complex effects on employment patterns, traffic congestion, air quality, and climate change. Recanatesi [32] analyzed the impact of construction land change in the Rome Metropolitan Area on the peri-urban environment and flood risk. Marull [33] analyzed the landscape ecology impact of land use changes on the Great Plains–Denver metropolitan edge. Rojas [34] and Basnou [35] evaluated the impact of land use changes on biodiversity conservation in the Concepcion metropolitan area (Chile). Qiao [36] quantitatively analyzed the land use changes corresponding to three economic growth scenarios in Yangtze River Delta in 2035 and their impact on carbon stocks. Wang [37] analyzed the impact of urban construction land change on ecological environment in Yangtze River Delta based on system dynamics and geographically weighted regression models. Hu [38], Yang [39], Darvishi [40], and Akubia [41] analyzed the characteristics of urban construction land change in Pearl River Delta and Beijing-Tianjin-Hebei Urban Agglomeration, Iran Bojnourd and Ghana Greater Accra Metropolitan Area and their eco-environmental effects. Chen [42], Qin [43], Liu [44], and Mascarenhas [45] analyzed the effects of construction land changes on carbon emissions and ecosystem service functions in Chengyu Urban Agglomeration, Qingdao and Pearl River Delta Metropolitan Region, and Lisbon and Barcelona Metropolitan Area. Kim [46] analyzed the impact of construction land change on PM10 concentrations in Korean urban agglomerations. Shairsingh [47], Dirgawati [48] and Rahman [49] analyzed the relationship between construction land change and NO2 concentrations in urban agglomerations of Toronto in Canada and Perth in Australia. Nautiyal [50], Mallick [51], Shen [52], Callejas [53], Shahfahad [54], Chanu [55], Khamchiangta [56], Adulkongkaew [57], Rousta [58] analyzed the relationship between land use change and surface temperature in Dehradun Urban Agglomeration (India), Bisha Watershed urban agglomeration (Saudi Arabia), Yangtze River Delta Urban Agglomeration (China), Cuiaba-Varzea Grande (Brazil), Delhi and Chennai metropolitan city (India), Bangkok Metropolitan Administration (Thailand), and Tehran Metropolitan City (Iran).
The use of decoupling models to study the connection between land resource consumption and economic development is now gaining more attention from scholars. Liu [59] analyzed the decoupling relationship between construction land and economic growth at the national level in China from 2001 to 2009 and proposed a target for total construction land management and control. Mao [60] explained the connection between land urbanization and economic growth by means of the decoupling theory, and Zhang [61] found decoupling between land natural capital utilization dynamic and economic growth in the Three Gorges Reservoir area as a whole. Based on the Tapio decoupling model, Shao concluded that land use intensification was negatively decoupled from the heat island effect in Shijiazhuang from 1995 to 2004, and it was shifted to a weak decoupling state from 2004 to 2016 [62]. Li pointed out that the connection between carbon emissions from construction land and economic growth in Shanghai is mainly characterized by weak decoupling, with economic output of land and energy use intensity being the biggest driving factors [63]. Zhou argued that the decoupling between carbon emissions from agricultural land utilization and economic growth in China is becoming further improved [64].
Studies on the spatio-temporal evolution effects of urban construction land in urban agglomerations mainly focus on ecological and environmental dimensions, with insufficient attention to economic growth and social development. Only a few studies have analyzed the effects of land use in urban agglomerations on employment distribution [65], firm location [66], income and spatial segregation [67], Urban–Rural Integration [68]. Economic growth and social progress are fundamental and key to sustainable development, and they are also a central concern for the majority of urban agglomeration government administrations as well as stakeholders, especially for developing countries and regions such as China, India, Turkey, and Brazil. In terms of the decoupling model application, it has been used by scholars to analyze the performance characteristics of land use change; however, as a new method to evaluate land effects, it still appears less in the literature up to now, and its application to land use planning and policy design has been addressed even less.

1.3. Aim and Question

Urban agglomerations are the most dynamic and potential development spaces, and the change of urban construction land is a direct mapping of their growth. Reasonable control of urban construction land change in urban agglomerations is the core of territorial spatial planning and land use management, and it is also a complex issue that the government must face and solve. Both central and local Chinese governments have issued a series of urban agglomeration development plans and spatial governance policies in recent years. However, influenced by many factors such as policy precision, environmental complexity, implementation strength of actors and intensity of game between interest subjects, the effect of spatial policies for urban agglomerations is not satisfactory, and the expansion of construction land and spatial spread have never been effectively controlled, which requires the government to urgently find a new set of tools to provide a basis for policy design of construction land change management in urban agglomerations. Therefore, this paper tries to conduct an empirical study of YRDUA based on GIS tools and a decoupling model. This paper mainly focuses on the following questions: (1) What are the regular changes of urban construction land in YRDUA in the temporal and spatial dimensions, respectively? (2) What is the state of decoupling between urban construction land change and population growth, economic development and income increase in YRDUA? (3) What are the changing trends in the economic and social effects of urban construction land in YRDUA, and how can they be addressed in policy design? This paper is dedicated to figuring out the above issues, with an attempt to reveal the spatio-temporal evolution of urban construction land in YRDUA and construct a new framework or a new method that integrates “dynamic analysis—effect evaluation—policy design” of urban construction land in urban agglomerations, thus providing new tools for territorial spatial planning and urban agglomeration development governance in the new era.
This paper consists of five parts, and the first part is the Introduction, providing background, literature review, questions and objectives. The second part is Materials and Methods, which introduces the general information and representation of the study area, compares and screens the research methods, designs the research ideas and research steps, selects the analysis indicators, and collects and preprocesses the data. The third part is about results, which provides a detailed analysis of the dynamics of urban construction land evolution and its effect characteristics in Yangtze River Delta Urban Agglomeration. The fourth part is a discussion, which proposes a spatial policy for differential management of urban construction land suitable for Yangtze River Delta Urban Agglomeration based on the results of the analysis and compares the findings of the published literature with the important conclusions of this study to reveal the similarities and differences and their possible causes. The last part gives conclusions, which systematically summarize and refine the core ideas of this study, while attempting to analyze the possible originality and international value of this study and presenting the problems encountered in the study and possible emphases for future research. This paper is an empirical study of Yangtze River Delta Urban Agglomeration for the period 2011–2020, using GIS and Python tools and many analytical procedures, including Coefficient of Variation, Gini Index, Boston Consulting Group Matrix, and Decoupling model.

2. Materials and Methods

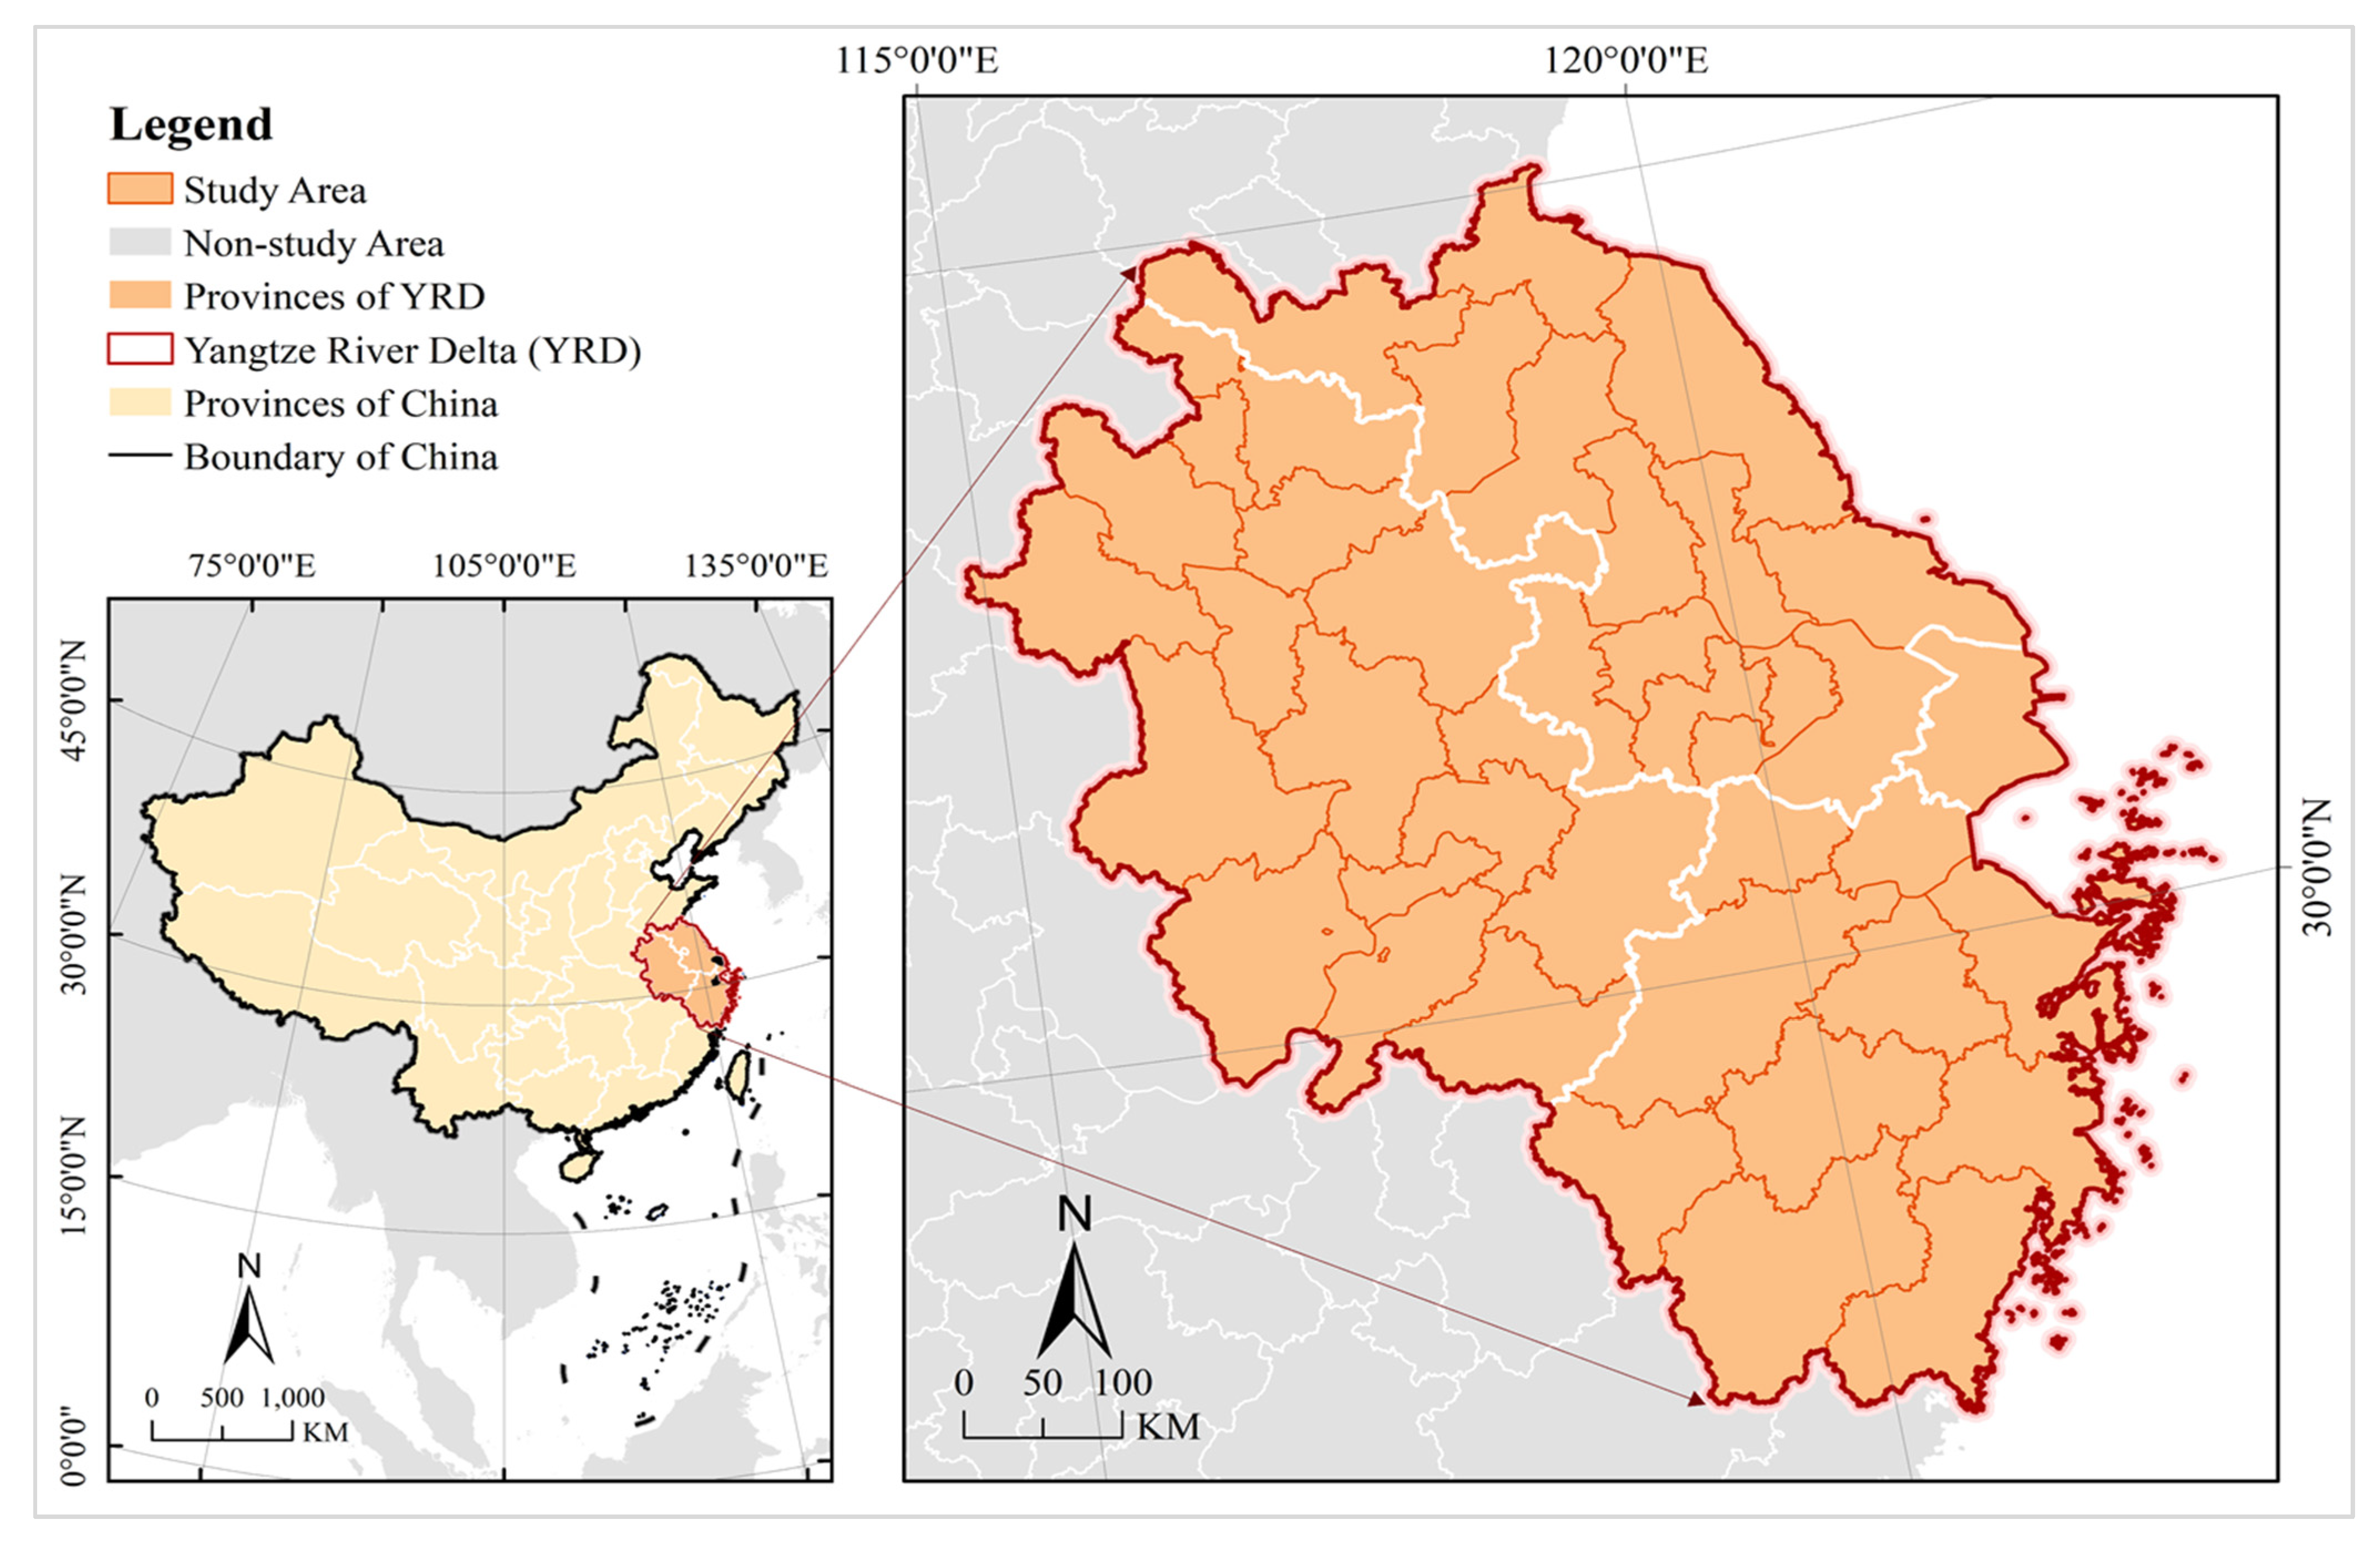
2.1. Study Area: Yangtze River Delta Urban Agglomeration in China

The study area is the Yangtze River Delta Urban Agglomeration (YRDUA) in China, covering 41 cities including Shanghai, Nanjing, Suzhou, Hangzhou, and Hefei (Figure 1). According to the Outline of the Yangtze River Delta Regional Integrated Development Plan issued by the Chinese central government in 2019, YRDUA geographically covers the municipality of Shanghai and all of the three provinces of Jiangsu, Zhejiang and Anhui. In this paper, Taizhou City, Zhejiang Province is abbreviated as Taizhou-ZJ, and Taizhou City, Jiangsu Province as Taizhou-JS for the sake of readability. The study area saw many rounds of administrative division adjustment from 2011 to 2020, such as the merger of Gaochun and Lishui counties into Nanjing City in 2013, Jintan into Changzhou in 2015, and Lin’an into Hangzhou in 2017. In this study, a scope map of the study area is created based on the latest administrative division in 2020, with the construction land, population, and economic development statistics of the counties involved incorporated into the corresponding cities.

2.2. Research Methods

A variety of research methods are adopted in the existing papers, including three types based on change characteristics analysis, interaction mechanism analysis, and simulation analysis. (1) Spatial patterns of urban construction land change in urban agglomerations are analyzed relying on expansion intensity indexes [69], GIS tools and landscape analysis [70], point sampling [71], Dyna-CLUE land use change model [72]. The factors influencing urban construction land change in urban agglomerations are studied based on regression models, correlation coefficients, spatial regression tree models [73], PSR model [74,75], Markov model [76], Stochastic Forest model [77], Bayesian model [78], Support Vector Machines and Artificial Neural Networks [79], bi-level cellular agent-based model [80], geographically weighted regressions [81], GeoDetector [82,83], and other methods. Simulation studies on urban construction land change are performed using gradient boosting decision tree and artificial neural networks [84], Cellular Automata and Markov chain model [85,86,87], naive Bayes and cellular automaton model [88], cellular automata and the SLEUTH models [89], system dynamics [90], and difference-in-differences [91].
There are abundant research methods, and multidisciplinary and multi-method crossover research is increasing. However, the large variation in results based on different disciplines and methods of analysis leads to increasing difficulties in comparing and integrating analysis between the findings of different papers. Additionally, the methodological over-complication and the increasing divergence of findings have made it difficult for government administrations to translate and apply the research methods and findings to the practical applications of urban agglomeration development planning and spatial governance policy design. Analytical means such as system dynamics, meta-automata, geographically weighted regression, GeoDetector, and Bayesian spatial econometric models require both specialized software and good expertise and computer knowledge, which are often difficult for government managers and spatial planners to master, leading to a significant reduction in the value of the application of existing case and empirical studies. In addition, the papers available have adopted the spatial analysis approach, but they have no response to spatial factors in their policy design. The urban construction land in different cities varies greatly in time and space dimensions, with marked diversity and complexity of spatio-temporal evolution patterns and high heterogeneity of land resource development performance, and management by classification and zone at different levels is bound to be an important approach to improve the accuracy of land use planning and policies.
Therefore, there is an urgent need to develop a set of concise and effective tools that integrate spatio-temporal evolution models, performance evaluation, and policy design for urban construction land. The basis for differential policy design is an analysis of spatial heterogeneity, including variability in the current situation, trends, and performance of urban construction land. This paper applies CV and GI to measure spatial heterogeneity, uses Boston Consulting Group Matrix to analyze urban construction land evolution patterns and trends, depends on the decoupling model to analyze urban construction land use performance, and proposes differentiated policy zoning by overlaying and analyzing the results acquired by these methods. Analysis can be carried out directly based on data from the government land management department by these methods, with no need of advanced mathematical knowledge or complex software operation skills. As an integrated set of tools, they enable planners to easily and readily translate them into land use management planning and policy design practices for urban agglomerations.

2.2.1. Coefficient of Variation (CV) and Gini Index (GI)

In this paper, the coefficient of variation and Gini index (used when there is no negative number) are used to analyze the spatial differentiation of urban construction land change in YRDUA. Both are dimensionless, and a larger value represents a higher degree of spatial differentiation. According to the studies of Guan [92], Zhang [93], Ruan [94], Zhao [95], Miyamoto [96], She [97] et al., the spatial differentiation is classified as weak (<0.15), medium, and strong (>0.36) levels according to the CV value. The Gini index (GI) was proposed by Corrado Gini and redefined by Max Otto Lorenz. Its value ranges between 0 and 1, and the spatial differentiation is divided into weak (<0.4), medium and strong (>0.6) levels according to the GI value based on the research of United Nations Development Program and Li [98] et al. The equations to calculate CV and GI are as follows:
C v = 1 X ¯ 1 n 1 i = 1 n ( X i X ¯ ) 2
G i = 1 1 m ( 2 i = 1 m 1 W i + 1 )
where C v represents the coefficient of variation; n represents the number of cities in the study area and X i represents the observed value of an indicator for the ith city; X ¯ is the average of the observed value of an indicator for all cities. The calculation of the Gini index is complicated and the steps are as follows: the raw data (without negative values) are arranged in ascending order into m groups of equal number of cities, with W i to be used as the proportion of the cumulative value of the city variable from group 1 to group i to the total cumulative value of that variable; the Gini index can be defined by definite integral to divide the integral of Lorentz curve into the sum of the areas of equal-height trapezoids. Any method has strengths and weaknesses, and the combination of CV and GI achieves reasonable complementarity between them. CV is simple to calculate and is applicable to both positive and negative numbers, but its calculation result is less reliable when the average value is zero. The GI is complex to calculate, but it has no special requirements for the average value and has a universal grading standard set by the United Nations, with wide consensus and universality across the world.

2.2.2. Boston Consulting Group Matrix: BCG

BCG, also known as the four-quadrant analysis method, was created in 1970 by Bruce Henderson, a leading American management scientist and founder of the Boston Consulting Group. The method is mainly applied to business management, economics and other concerned fields, and the products or markets are classified into stars, questions, cows, and dog types based on the interaction of two factors “sales growth” and “market share”. With t representing the time, X i and X m a x representing the observed value of city i and the maximum value of all cities, and X i representing the observed value of city i in the base period, the BCG model is calculated as
Relative   share = X i X m a x
Growth   rate = ( X i X i t 1 ) × 100 %
This paper analyzes the urban construction land evolution patterns of urban agglomerations using the BCG model and classifies the cities in the study area into stars (H-H), cows (H-L), questions (L-H), and dogs (L-L) depending on the average of the relative shares and growth rates of the dependent variables. The stars (H-H) represent a high share and high growth of urban construction land in urban agglomerations, where the cities of this type hold an important position and are in a rapid growth stage with a favorable development trend. The cows (H-L) represent a high share but low growth of urban construction land in urban agglomerations, where the cities of this type hold an important position but are in maturity or decline of development. The question (L-H) represents a low share but high growth of urban construction land in urban agglomerations, where the cities of this type are in a low position but with high development potential. Under the guidance of reasonable policies, they have a great chance to become new growth poles of urban agglomerations in the future. The dogs (L-L) represent a low share and low growth of urban construction land in urban agglomerations, with less development strength and potential, which are problematic spaces affecting the sustainable development of urban agglomerations and must be promoted through policy intervention to transform their development. The BCG method is very simple, but it is limited to the analysis within urban construction land, with no correlation to land development performance.

2.2.3. Decoupling Model
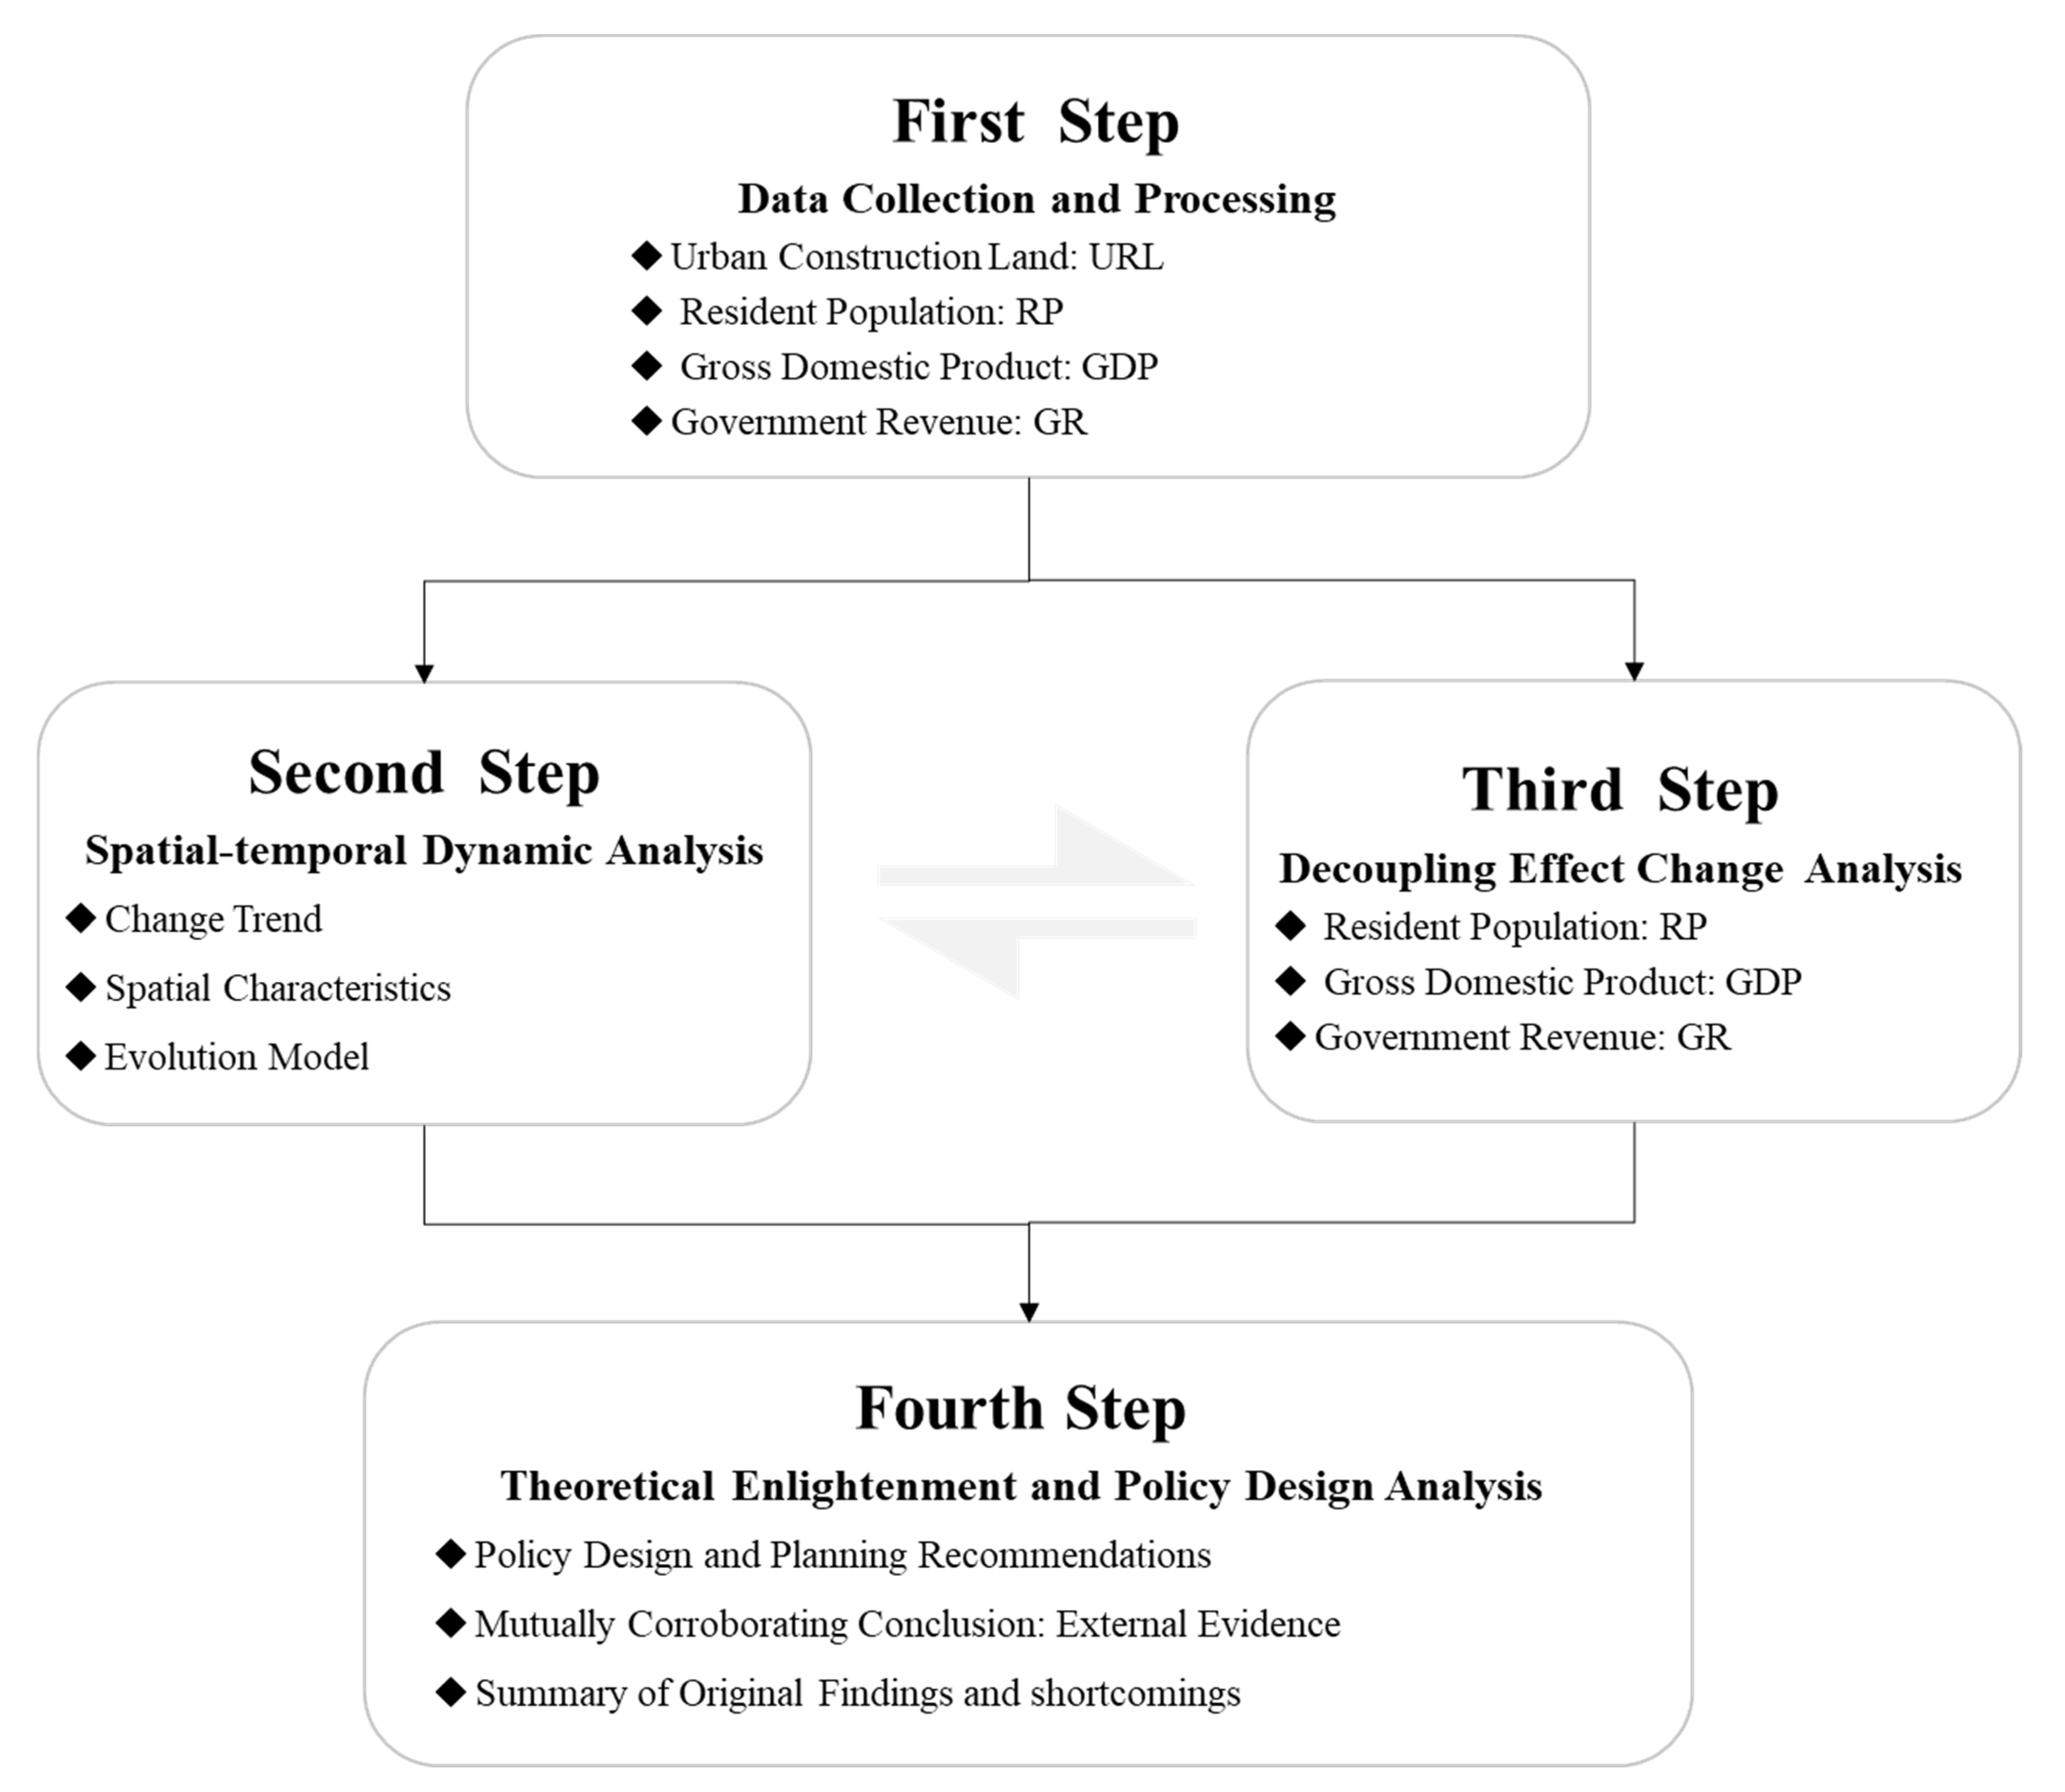
There are two methods on decoupling model calculation at present, that is, OECD [99] and Tapio [100]. In this paper, we adopt Tapio decoupling index in calculations. Decoupling originally refers to the reduction in the inter-relationship between two or more physical quantities, in this case essentially the process of dematerialization and de-pollution in the process of urban economic development, i.e., the process of reduction in the consumption of land resources in economic activities [101]. This paper analyzes the economic and social effects of urban construction land change in urban agglomerations based on a decoupling model to determine whether there is a correlation between land consumption and population growth, economic development, and income improvement in a synchronous or asynchronous change. With γ representing the decoupling index, Δ α representing the growth rate of urban construction land in urban agglomerations, Y i and Y i + n representing the values of urban construction land area in years i and i + n , respectively, Δ β as the growth rate of social and economic development-related indicators (including population, GDP, and government revenue) in cities, X i and X i + n as the annual values of social and economic development-related indicators in years i and i + n , respectively, and k as the study period, the decoupling index is calculated as below:
γ = Δ α Δ β
Δ α = Y i + k Y i Y i
Δ β = X i + k X i X i
Because “decoupling” is a long and iterative process, the choice of study period, especially the base period, is critical when applying the decoupling model. “Decoupling” conceptually emphasizes a long-term trend process. Based on available research [102,103] and the length of time period of research data in this paper, n = 4 in this paper can be depended on to divide the research period into two sections of 2011–2015 and 2016–2020, corresponding to the “12th Five-Year Plan” and “13th Five-Year Plan”, respectively. Based on the positive and negative attributes of Δ α and Δ β , the classification thresholds of 0.8 and 1.2 for γ are used to classify the decoupling patterns into three types and eight subtypes (Table 1) [104,105]. For the decoupling relationship between the change of urban construction land supply and economic growth, strong decoupling is the best state, indicating that along with the gradual reduction of urban construction land change in urban agglomerations while the economic scale is growing, the cities are in the development with quantitative decrease and increased efficiency, achieving high-quality growth as a benchmark. Strong negative decoupling is the worst state, indicating that along with the expansion of urban construction land supply in urban agglomerations, the economy is declining instead of increasing, and the cities are in the development with quantitative increase but efficiency decrease. All cities should try to avoid it. Weak decoupling indicates that both urban construction land change and economic development in urban agglomerations are on the rise, with the economic growth faster than the land consumption growth, and that the cities are in the state with increase in both quantity and quality, characterized by high value-added land output and high land use intensification. Weak negative decoupling indicates that both urban construction land and economic development are in a negative growth, with the decline of economy less than that of land consumption, and that the cities are in the state of decreased quantity and quality. Expansive coupling and recessive coupling indicate that the change in urban construction land in urban agglomerations keeps growing or decreasing simultaneously with economic growth, and that the cities are in a constant state of incremental expansion or contracting shrinkage. Expansive negative decoupling indicates that both urban construction land change and economic growth in urban agglomerations are on the increase, with the economic growth less than the land consumption, and that the cities are in the state of high quantity but low quality with land investment not well converted into economic benefits. Recessive decoupling indicates that both urban construction land change and economic development in urban agglomerations show negative growth, with the economic reduction faster than land consumption, and that the cities are in the state of quantity reduction and quality optimization, where the impact of reduced land supply on economic development is under control.

2.3. Research Steps

This study is including four steps (Figure 2). The first step is to collect and process raw data. The data of the study area from 2011 to 2020 are collation, including urban construction land, resident population, gross domestic product, and government revenue. The second step is to analyze spatio-temporal changes. First, this paper presents the current characteristics, change trends, and evolution patterns of construction land in 41 cities of YRDUA from the time dimension. Secondly, python is used to calculate the coefficient of variation and Gini index, and cluster analysis method of GIS is applied to study the spatial pattern and evolution characteristics of construction land in YRDUA. The third step is to carry out decoupling analysis, where the relationship between the change of urban construction land and the growth of Resident Population, Gross Domestic Product, and Government Revenue in YRDUA is analyzed with the help of decoupling model to explain the economic and social effects of the change of urban construction land in urban agglomerations. The fourth step is theoretical inspiration and policy design. We make a comparative analysis of the main ideas found in the result analysis, reflect and summarize the innovation and research shortcomings of this paper; in addition, according to the evolution pattern of urban construction land in YRDUA, and the change trend of decoupling relationship, we put forward the idea of differentiated management and policy design to provide decision reference for the government to carry out urban agglomeration development planning and spatial governance policy design.

2.4. Index Selection and Data Sources

In view of data accessibility and comparability, four indicators of Urban Construction Land, Resident Population, Gross Domestic Product, and Government Revenue are used in this paper (Table 2). This study makes an empirical analysis on the data in 2011, 2015, 2016 and 2020. Most of the data can be obtained by visiting the following links: https://www.mohurd.gov.cn/gongkai/fdzdgknr/sjfb/tjxx/index.html (accessed on 19 January 2021), https://data.cnki.net/yearbook/Single/N2021050059, http://tjj.sh.gov.cn/tjnj/20220309/0e01088a76754b448de6d608c42dad0f.html, http://tj.jiangsu.gov.cn/col/col4009/index.html, http://tjj.zj.gov.cn/col/col1525563/index.html, and http://tjj.ah.gov.cn/ssah/qwfbjd/tjnj/index.html (accessed on 5 March 2021). China implements the “City Governs County” system, where a city consists of both urban areas and counties. Prefectural and county-level cities vary greatly, and the mixed analysis has a greater impact on the study findings. To make the analysis results more accurate, this paper uses the data of municipal districts, i.e., the data of counties under prefecture-level cities are not included. In the map analysis, the city area is used instead of the urban area in order to maintain the continuity and gracefulness of the map (Table A1 and Table A2 in Appendix A are the standardized data). It should be noted that in 2011, Chaohu city in Anhui was abolished, with one district and four counties under its jurisdiction assigned to the cities of Hefei, Wuhu and Maanshan, respectively. The map of the study area was prepared after the administrative division adjustment, and the indicators of former Chaohu city were assigned to Hefei, Wuhu and Maanshan in the data analysis according to the ratio of 2:2:1.
Urban construction land is derived from the classification of land in the revised Land Administration Law of the People’s Republic of China promulgated in 1998, where usages of land are classified into those of farm or construction use or unused in Article 4. Urban construction land in this paper is consistent with the Code for Classification of Urban Land Use and Planning Standards of Development Land (GB50137-2011), and the data are obtained from the China Urban Construction Statistical Yearbook published by the Ministry of Housing and Construction of China. Urban construction land is the land other than water and other land in urban land, including residential land, land for public administration and public services, land for commercial and service facilities, industrial land, land for logistics and warehousing, land for road traffic facilities, land for public facilities, and land for green areas and squares [106].
In the era of high-quality development, the conflict between people and land has become increasingly intense. The coupled matching of resident population and urban construction land is a significant prerequisite for the sustainable development of urban agglomerations and an important standard to measure the man–land relationship [107,108]. The data of permanent resident population mainly come from the China City Statistical Yearbook, with some missing data from the statistical yearbooks of Shanghai, Jiangsu, Zhejiang, Anhui and their statistical bulletins. The resident population consists of four parts; for example, in Shanghai, one part is the population with Shanghai household registration and actually living in Shanghai at the statistical time; the second part is the population with Shanghai household registration and less than half a year away from Shanghai at the statistical time; the third part is the population with Shanghai household registration and working and studying abroad but not settled there at the statistical time; the fourth part is the population with household registration in other provinces and cities who actually live in Shanghai with half a year or more away from their place of household registration at the statistical time.
Gross Domestic Product reflects the total economic output, and Government Revenue shows the dependence of government revenue, especially local governments, on land finance. Socio-economics plays a dominant role in the construction land expansion, which in most cases is closely related to the economic scale of the region and shows a strong statistical correlation [109,110]. However, the causal relationship between the expansion of construction land and economic growth is not entirely clear, leading to the expansion of construction land and economic growth in individual regions not to be synchronized, and there is even economic stagnation or negative growth when the expansion of construction land continues. Land is the mother of wealth, and land finance refers to the over-reliance on land-resource-related revenues for revenues and expenditures at different levels of government, which is the main manifestation of capitalization and financialization of land resources [111,112]. The legalization and institutionalization of land finance in China began with the Provisions on the Assignment of State-owned Land Use Right through Bid Invitation, Auction and Quotation, which came into effect in 2002. The data of Gross Domestic Product and Government Revenue are mainly from the China City Statistical Yearbook, with some missing data from the statistical yearbooks and statistical bulletins of Shanghai, Jiangsu, Zhejiang, and Anhui.

3. Results

3.1. Dynamic of Construction Land Use

3.1.1. Change Trend

There are diversified trends, with emergence of a variety of types such as “Rapid Growth”, “Slow Growth” and “Inverted U-shape”. For policy reasons, the total amount of urban construction land in Shanghai remained largely unchanged from 2011 to 2015 and 2016 to 2019. Except for Shanghai, the trends of the 40 cities can be divided into three categories. Cities with large amount of urban construction land change and high growth rate are those of Rapid Growth, and YRDUA has the largest number of such cities, accounting for 52.5%, including Nanjing, Wuxi, Xuzhou, Changzhou, Suizhou, Hangzhou, Ningbo, Hefei, and Wuhu. Cities with small amount of urban construction land change (<20 km2), fluctuating and complex change processes (such as N\M\W and other shapes), low growth rate or even negative growth are those of Slow Growth, and such cities in YRDUA account for 35%, including Zhoushan, Lishui, Huainan, Bozhou, Huzhou, and Quzhou. Taizhou-JS, Lianyungang, Taizhou-ZJ, Huai’an, and Tongling are of Inverted U-shape, where the urban construction land went through a process of increase first and then decrease.
Most cities have been increasing the scale of urban construction land, while a few have stagnated or even contracted. From 2011 to 2020, more than 90 percent of the cities saw construction land increase, with the largest growth of more than 200 km2 in Hangzhou. In the same period, there was also significant growth in Nanjing, Hefei, Xuzhou and Shaoxing, with an increase of more than 100 km2. However, Shanghai, Huzhou and Taizhou-ZJ experienced negative growth. Shanghai’s negative growth is the result of its proactive pursuit of reduced development. In 2016, the Shanghai government announced the implementation of the development strategy of “function deconstruction, population control and land use reduction”, and incorporated construction land into the overall urban planning. Shanghai has taken the initiative in recent years to implement the strategy of “locking the total amount, decreasing the increment, optimizing the stock, increasing the efficiency of flow and improving the quality” for high-quality utilization of urban construction land. By industrial structure adjustment and habitat management, it tries to promote the renovation and renewal of inefficient stock construction land and comprehensive improvement with positive incentives and anti-driving mechanism. Now it has become a benchmark for stock and reduction development in Chinese cities. Reduced development is passive in Taizhou-ZJ and Huzhou because, on the one hand, they are located in the peripheral area of YRDUA, with relatively weak transportation conditions, resource endowment and historical foundation; on the other hand, they are closer to Hangzhou, Wuxi and Suzhou that are in the agglomeration development stage, and their siphoning effect has a greater impact on urban construction and development.

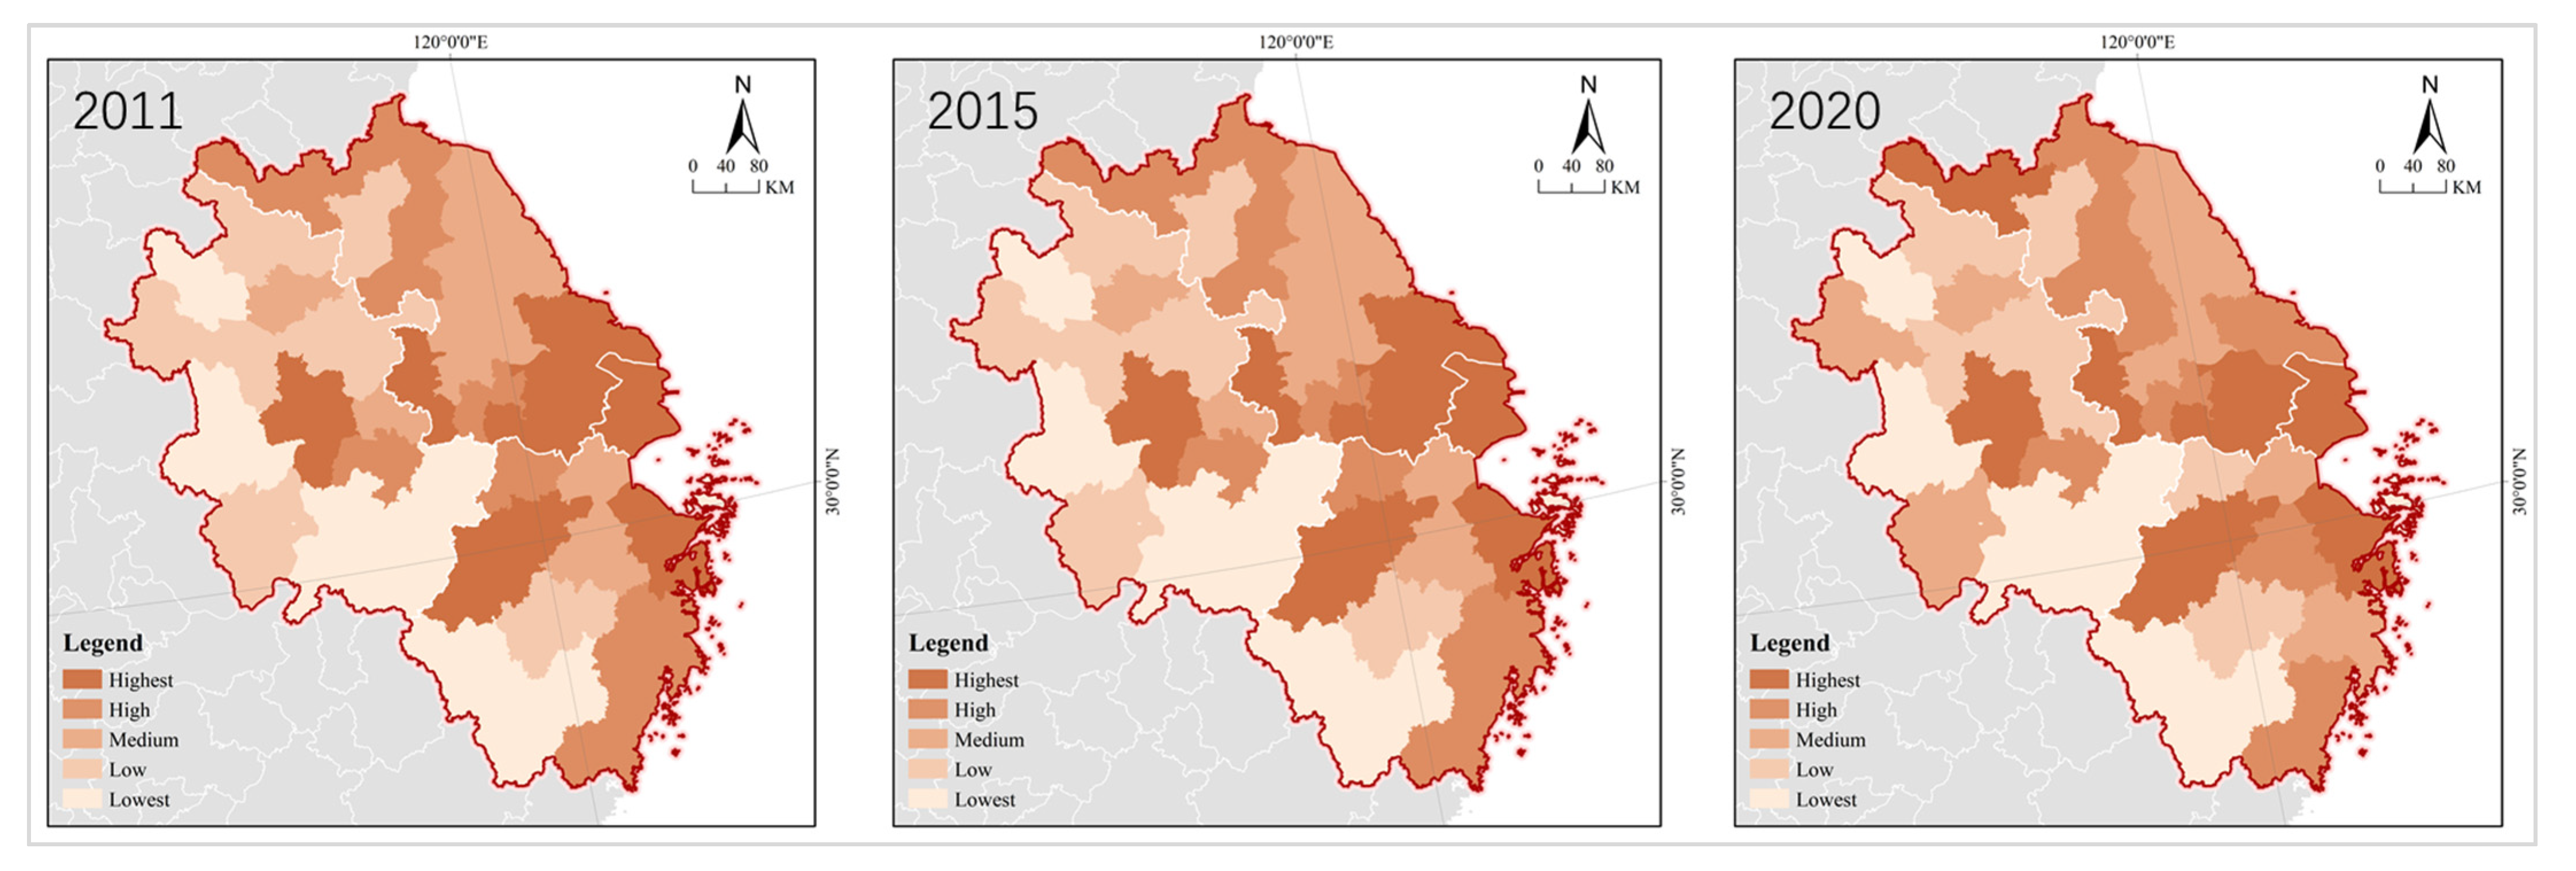
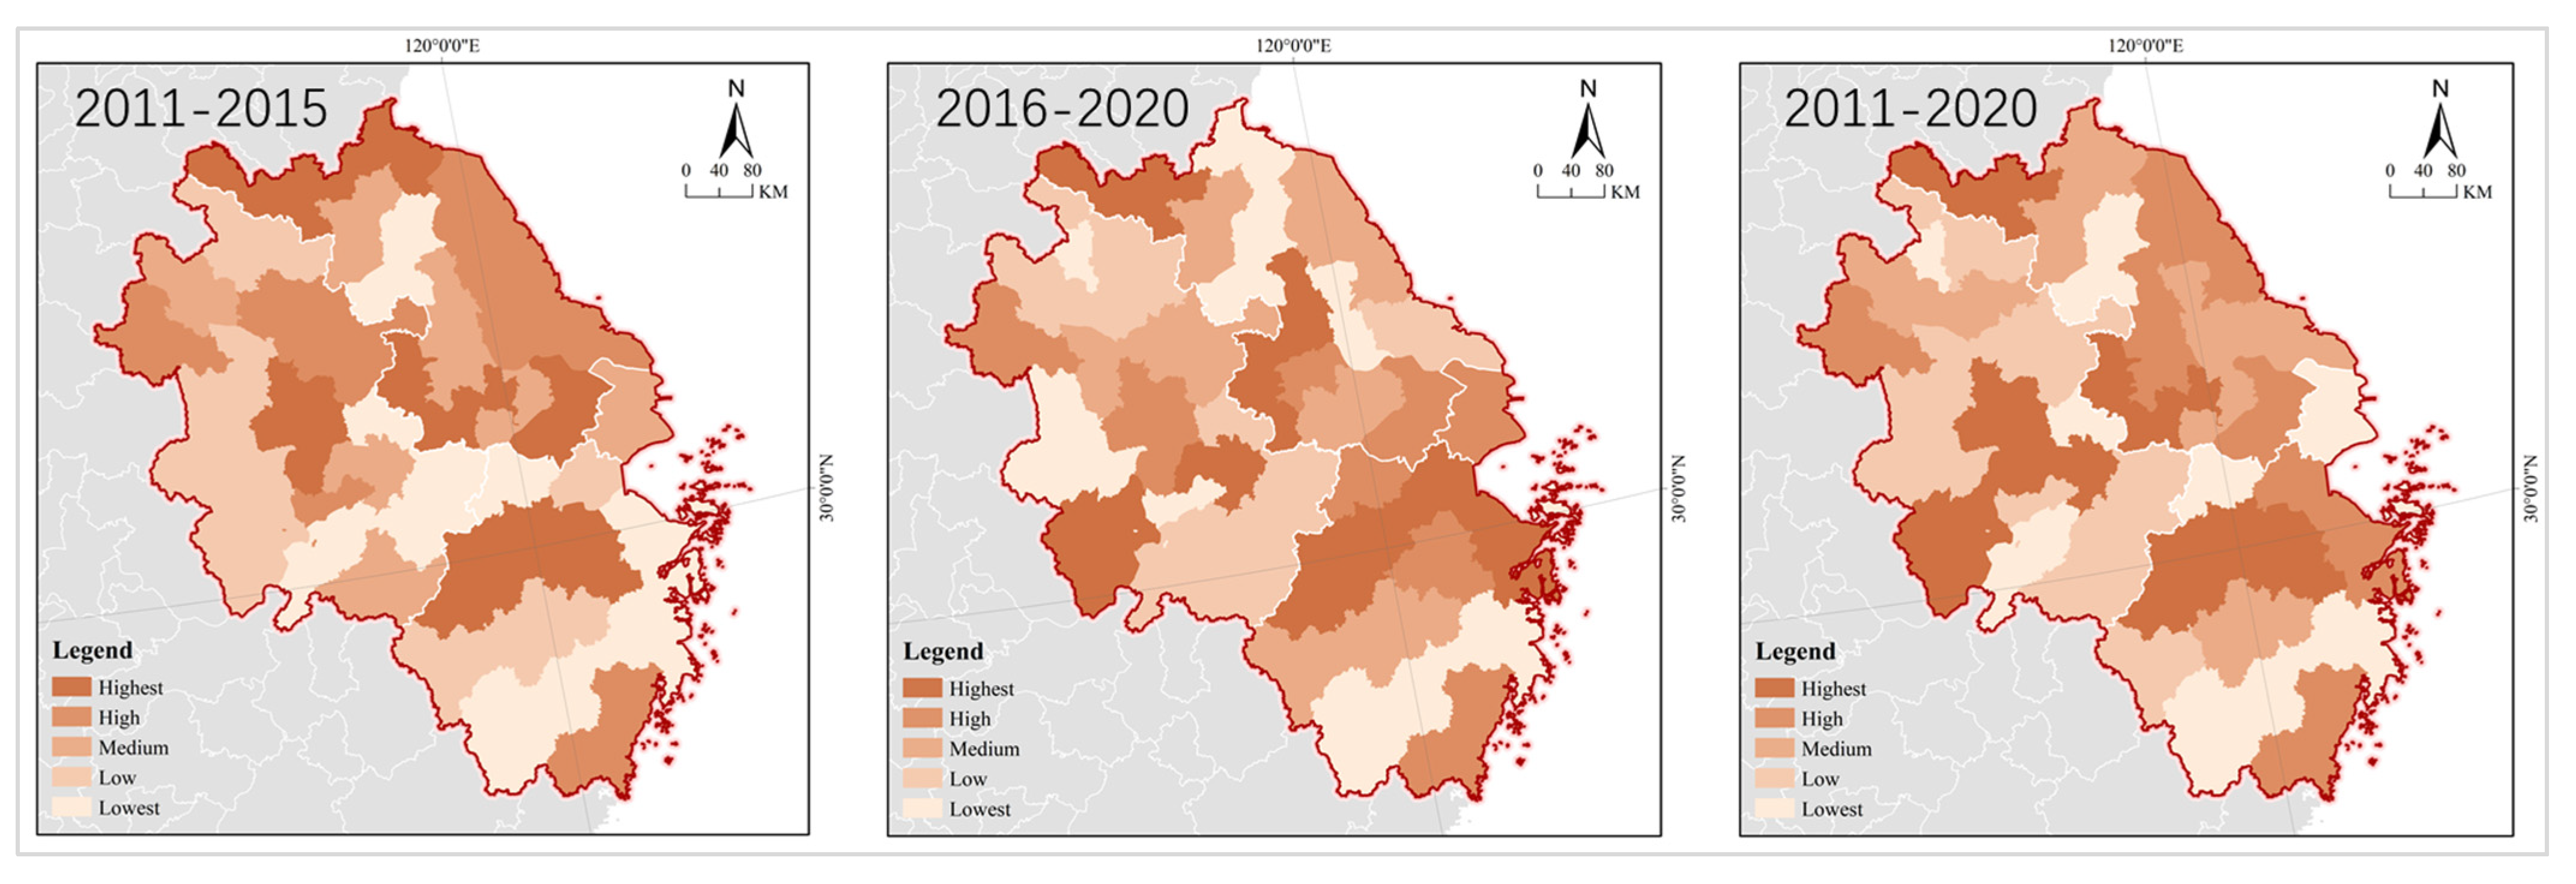
3.1.2. Spatial Characteristics

Intercity urban construction land varies greatly in scale, but the level of spatial heterogeneity is decreasing. From 2011 to 2020, Shanghai remained long at the top of YRDUA in terms of the scale of urban construction land, with a peak of over 2900 km2, and still over 1900 km2 after years of active reduced development. Lishui had the smallest urban construction land area in 2011–2015, less than 40 km2, only 1% of the maximum; in 2016–2020, Chizhou became the smallest city with an area of about 40 km2, raising the proportion of the largest city to 2%. The average urban construction land in YRDUA from 2011 to 2020 was always in the range of 200–250 km2 in size, and it showed a phased growth trend. The coefficient of variation of urban construction land was 2.08 in 2011, followed by gradual decrease, but it was still as high as 1.32 in 2020, much higher than 0.36. The Gini index of urban construction land was 0.57 in 2011, and then it gradually declined but was still as high as 0.48 in 2020, much higher than 0.4. The changes of the coefficient of variation and Gini index from 2011 to 2020 indicate that there is a significant intercity gap and spatial inequality in YRDUA, but the level of heterogeneity is decreasing (Table 3).
The urban construction land is in a “swallow” form in spatial structure, with a solid spatial pattern that changes only in local areas. The 41 cities of YRDUA in 2011, 2015, and 2020 were classified into Higher, High, Medium, Low, and Lower levels based on quantile clustering analysis of GIS (Figure 3). Most of the cities remained the same type from 2011 to 2020, only few cities such as Nantong, Taizhou-ZJ and Chuzhou underwent minor adjustments. The urban construction land in YRDUA is in a “swallow” form in spatial structure, with Shanghai as the head of the swallow, Suzhou, Wuxi and Nanjing as the body, Hangzhou and Hefei as the tail, and Ningbo, Wenzhou, Huai’an, Xuzhou and Lianyungang as the wings.
The amount of change varies widely in space, but there is a solid spatial pattern. From the coefficient of variation, it was 1.06 in 2011–2015, 1.04 in 2016–2020, and 6.15 in 2011–2020, much larger than 0.36, indicating a large spatial difference in the amount of urban construction land change between YRDUA cities. The 41 cities of YRDUA in 2011, 2015, and 2020 were classified into Higher, High, Medium, Low, and Lower levels based on quantile clustering analysis of GIS (Figure 4). The types of most cities remained unchanged from 2011 to 2020, with minor adjustments to Shanghai, Lianyungang, Chuzhou, Wuhu, Xuancheng, Ningbo and Jiaxing. In general, except for Shanghai, the central cities of the urban agglomeration have changed more, while the peripheral cities have changed less, shaping a “central-peripheral” structure in space.

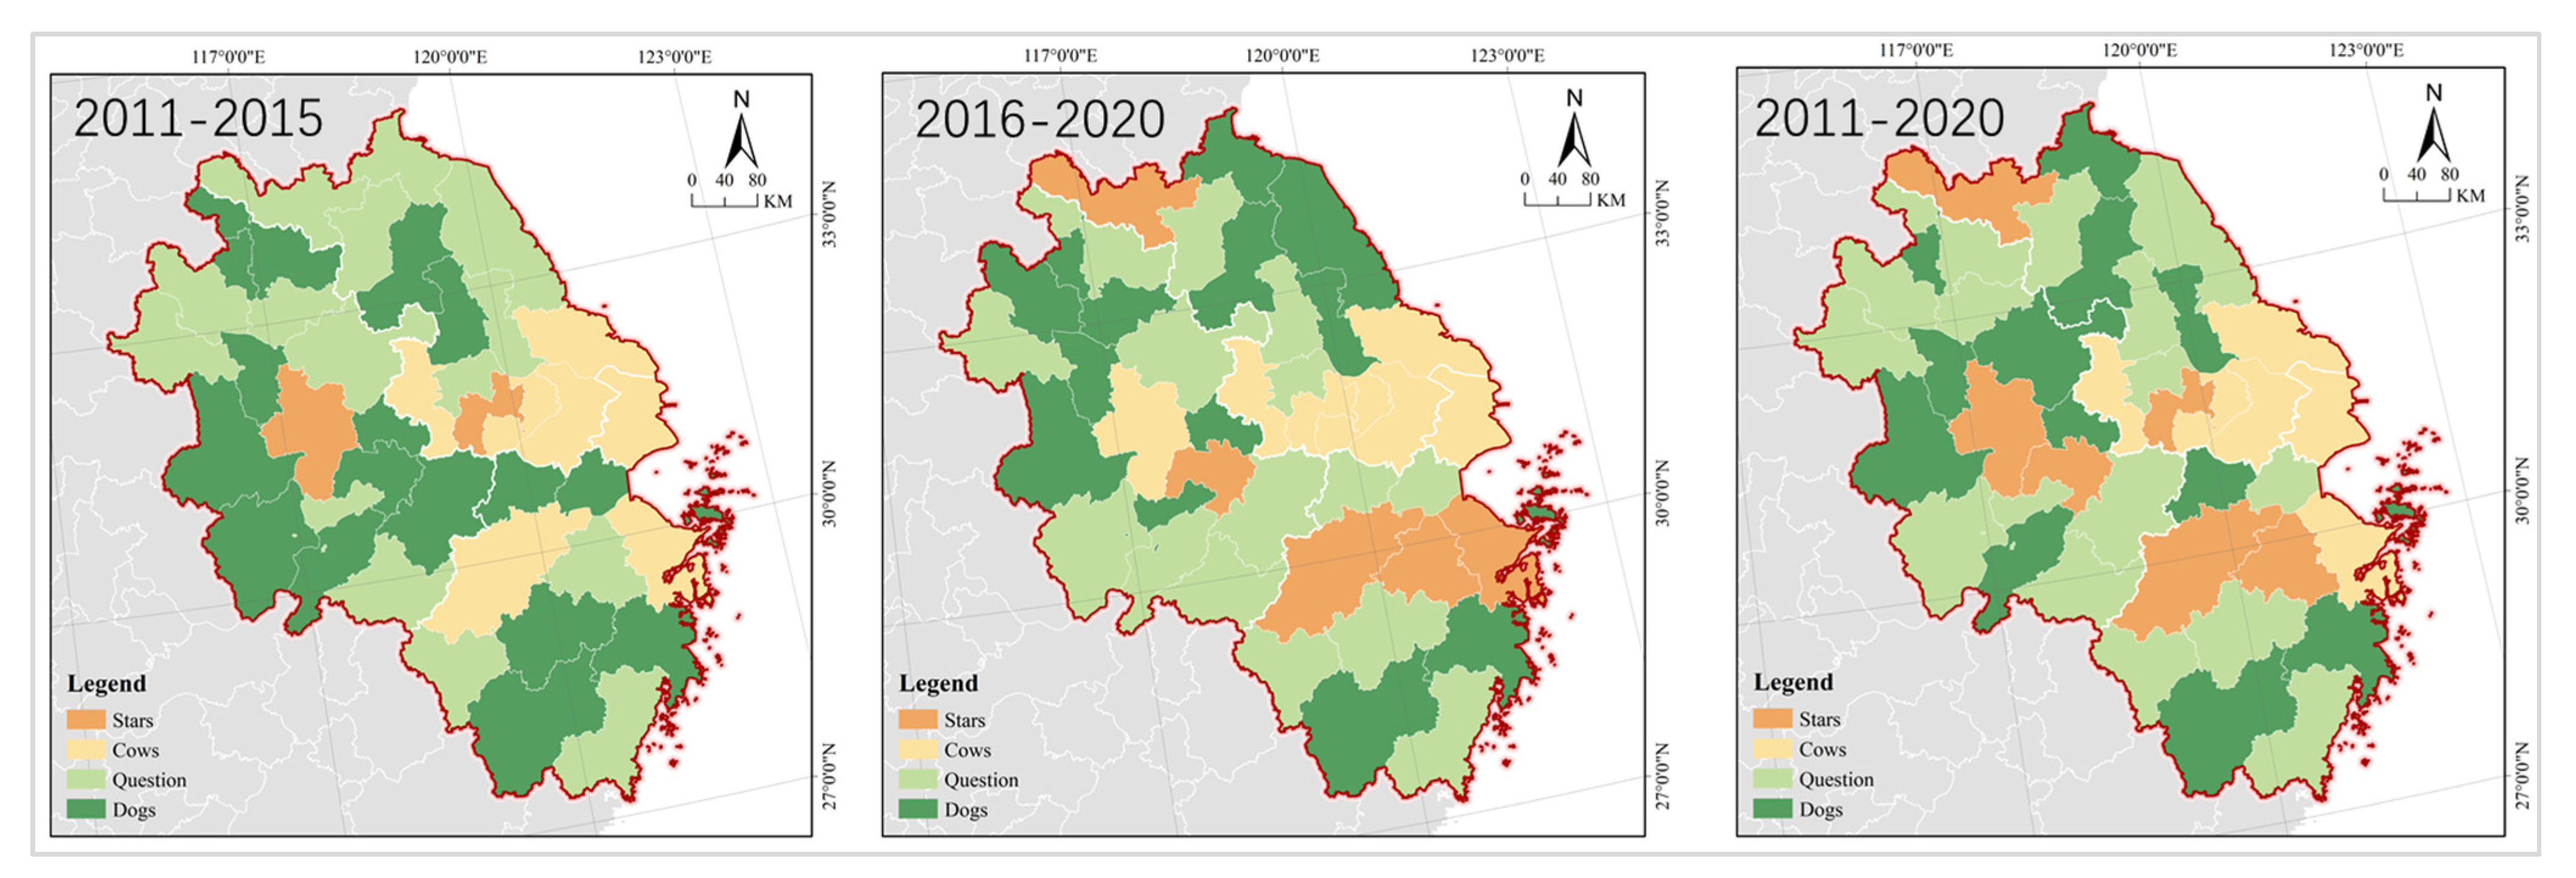
3.1.3. Evolution Model

The average values of Relative Share and Growth Rate of urban construction land in YRDUA were 0.08 and 4.20 from 2011 to 2015, respectively, and four types of cities were ranked as stars < cows < question < dogs in the order of quantity (Table 4 and Figure 5). There were rare cities of stars type, only Hefei and Changzhou. Cities of cow type accounted for 17.07%, including Shanghai, Nanjing, Wuxi, Suzhou, Nantong, Hangzhou, and Ningbo, mostly in Shanghai, the southern Jiangsu region and Hangzhou Bay. Cities of question type accounted for 36.59%, including Xuzhou, Lianyungang, Yancheng, Zhenjiang, Taizhou-JS, Suqian, Bengbu, Fuyang, and Bozhou, mainly in the northern Jiangsu and northern Anhui regions. Cities of dog type accounted for 41.46%, including Huai’an, Yangzhou, Huzhou, Jiaxing, Jinhua, Zhoushan, Taizhou-ZJ, Lishui, Wuhu, Huainan, Maanshan, Anqing and Chizhou, mostly in central Zhejiang, western Anhui and southern Anhui regions.
The average values of Relative share and Growth rate of urban construction land in YRDUA were 0.12 and 2.83 from 2016 to 2020, respectively, and the four types of cities are ranked as stars < cows < dogs < question in the order of quantity. Cities of stars type expanded significantly in number, accounting for 12.20%, including Xuzhou, Hangzhou, Ningbo, Wuhu and Shaoxing, mostly in the south coast area of Hangzhou Bay. Cities of cow type accounted for 17.07%, including Shanghai, Nanjing, Wuxi, Changzhou, Suzhou, Nantong, and Hefei, mostly in Shanghai and southern Jiangsu region. Cities of question type accounted for 36.59%, including Yangzhou, Zhenjiang, Wenzhou, Jiaxing, and Huzhou, mostly in the junction area of Jiangsu, Anhui and Zhejiang. Cities of dog type accounted 31.71%, including Lianyungang, Huai’an, Yancheng, Zhoushan, Taizhou-ZJ, Lishui, Huabei, Huainan, Bengbu, and Bozhou, mostly in the northern Jiangsu, northern Anhui and central Zhejiang regions (Figure 5).
The average values of Relative Share and Growth Rate of urban construction land in YRDUA were 0.12 and 3.31 from 2011 to 2020, respectively, and the four types of cities are ranked as stars = cows < dogs < question in the order of quantity. Cities of stars type expanded significantly in number, accounting for 14.63%, including only Xuzhou, Changzhou, Hangzhou, Hefei, Wuhu and Shaoxing, geographically in decentralized distribution. Cities of cow type accounted for 14.63%, including Shanghai, Nanjing, Wuxi, Suzhou, and Nantong, mostly in Shanghai and its surrounding areas. Cities of question type accounted for 39.02%, including Yancheng, Yangzhou, Zhenjiang, Suqian, Wenzhou, Jiaxing, Tongling, Anqing, Fuyang, and Suzhou, mostly in northern Jiangsu, northern Anhui and western Anhui regions. Cities of dog type accounted 31.71%, including Huai’an, Taizhou-ZJ, Huzhou, Taizhou-ZJ, Huabei, and Huainan, mostly in the northwest and southeast regions of YRDUA, distributed in a belt-like pattern (Figure 5).

3.2. Effect of Construction Land Use

3.2.1. Resident Population

There were the largest number of cities in Expansive negative decoupling state from 2011 to 2015, up to 51.22%, followed by those in Weak decoupling state. There were no cities in Recessive coupling or Weak negative decoupling, and there were few cities in other states. Xuzhou, Changzhou, Suzhou, Nantong, Zhenjiang, Taizhou-ZJ, Lishui, Hefei, Anqing, Chuzhou, Fuyang, and Suizhou were in Expansive negative decoupling, where the intensification of construction land was at a low level, and land resource consumption was faster than population growth. Ningbo, Huzhou and Taizhou-ZJ were in Strong decoupling, while Shanghai, Nanjing, Suqian, Zhoushan, Maanshan, Chizhou and Xuancheng were in Weak decoupling with high land use intensification. Wuxi, Lianyungang, Hangzhou, and Yancheng were in Expansive coupling, with urban construction land growing in tandem with population. Lu’an, Yangzhou, Wuhu, and Huabei were in Strong negative decoupling, with population loss but urban construction land growth, as problematic spaces for urban agglomerations (Figure 6).
The number of cities in Expansive negative decoupling in 2016–2020 decreased significantly, but they still accounted for the largest part, up to 39.02%. In the same period, the number of cities in the Weak decoupling state came second, and there were no cities in the Recessive coupling and Weak negative decoupling state, while the cities in other states increased slightly. Shanghai, Xuzhou, Yangzhou, Suqian, Wenzhou, Jiaxing, Huzhou, Bengbu, Chuzhou, and Xuancheng were in Expansive negative decoupling; Huai’an, Taizhou-JS, Zhoushan, and Taizhou-ZJ were in Strong decoupling; Wuxi, Changzhou, Suzhou, Nantong, Yancheng, Lishui, and Hefei were in Weak decoupling; and Nanjing, Hangzhou, and Ningbo were in Expansive coupling. The cities of Zhenjiang, Huainan, Maanshan, Huabei and Anqing were in Strong negative decoupling as problematic spaces for urban agglomerations.
The change in decoupling types from 2011–2015 to 2016–2020 showed a diversified trend, with cities in evolution, degeneration, and unchanged states distributed in clusters. There were a number of cities in the state of evolution, and degeneration is the same, accounting for 36.59%, respectively. The former included Suzhou, Huai’an, Yancheng, Yangzhou, Hefei, Wuhu, Fuyang, and Bozhou, mostly in the central and coastal regions of Jiangsu and the western and central regions of Anhui; the latter included Shanghai, Nanjing, Jiaxing, Ningbo, Huainan, Anqing, and Tongling, mostly in the Hangzhou Bay, central Jiangsu and southern Anhui regions. More than one fourth of the cities were in unchanged state, including Xuzhou, Hangzhou, Wenzhou, Shaoxing, Jinhua, Quzhou, Bengbu, Huabei, and Suzhou, forming two agglomerations in central Zhejiang and northern Anhui.

3.2.2. Gross Domestic Product

There were the largest number of cities in Weak decoupling state in 2011–2015 and 2016–2020, up to 78.05%. There were no cities in Recessive decoupling, Recessive coupling, Weak negative decoupling, or Strong negative decoupling, and there were few cities in other states. From 2011 to 2015, Huai’an, Ningbo, Taizhou-ZJ, and Huzhou were in Strong decoupling, Shanghai, Nanjing, Wuxi, Suzhou, Nantong, Hangzhou, Wenzhou, Hefei, and Wuhu were in Weak decoupling, Tongling, Huangshan, and Fuyang were in Expansive coupling, and Huainan and Xuzhou were in Expansive negative decoupling. From 2016 to 2020, Huai’an, Taizhou-JS, Zhoushan, Taizhou-ZJ, and Tongling were in Strong decoupling, Shanghai, Nanjing, Wuxi, Nantong, Hangzhou, Wenzhou, Hefei, and Wuhu were in Weak decoupling, Xuzhou and Yangzhou were in Expansive coupling, and Zhenjiang was in Expansive negative decoupling. From the change in decoupling types from 2011–2015 to 2016–2020, most of the cities showed no change, with the evolved cities mainly in the marginal areas of the urban agglomerations and the degraded cities in the central area of the urban agglomerations. Cities in the unchanged state accounted for 70.73%. There were 19.51% of the cities in evolution, including Fuyang, Huangshan, Tongling, Huainan, Zhoushan, Taizhou-ZJ, Lianyungang and Xuzhou. Only Huzhou, Ningbo, Yangzhou, and Zhenjiang were in a state of degeneration (Figure 7).

3.2.3. Government Revenue

The cities in Weak decoupling accounted for the largest part in 2011–2015 and 2016–2020, with increasing diversity of decoupling types. From 2011 to 2015, there were a large number of cities in Weak decoupling, including Shanghai, Nanjing, Wuxi, Hangzhou, Wenzhou, Hefei and Wuhu, accounting for 78.05%. Huai’an, Ningbo, Taizhou-ZJ, and Huzhou were in Strong decoupling, Changzhou and Taizhou-JS were in Expansive coupling, Xuzhou, Huainan, and Tongling were in Expansive negative decoupling, and no cities were in Recessive decoupling, Recessive coupling, Weak negative decoupling, or Strong negative decoupling. From 2016 to 2020, Shanghai, Nanjing, Wuxi, Changzhou, Suzhou, Ningbo, Wenzhou, Hefei and Maanshan were in Weak decoupling, with the proportion reduced to 58.54% in spite of the largest part. Lianyungang, Taizhou-ZJ, Taizhou-ZJ, and Lishui were in Strong decoupling state, Wuhu and Chuzhou were in Expansive coupling state, Xuzhou, Yancheng, Zhenjiang, Suqian, Huainan, and Huangshan were in Expansive negative decoupling state, and no city was in Weak negative decoupling state. Tongling and Huai’an were in Recessive decoupling and Recessive coupling states, respectively, as problematic spaces for urban agglomerations. From the change of decoupling types from 2011–2015 to 2016–2020, only four cities of Changzhou, Lianyungang, Taizhou-JS, and Zhoushan achieved evolution, which is quite rare; most of the cities remained unchanged, and those in degeneration were distributed in southern Anhui and northern Jiangsu regions in clusters. Cities in unchanged state accounted for 58.54%, including Shanghai, Nanjing, Wuxi, Xuzhou, Suzhou, Nantong, Hangzhou, Wenzhou, Jiaxing, Hefei, Huainan and Huabei. There were 31.71% of the cities in degeneration, including Huai’an, Yancheng, Yangzhou, Zhenjiang, Taizhou-JS, Suqian, Tongling, Anqing, Huangshan, and Chuzhou (Figure 8).

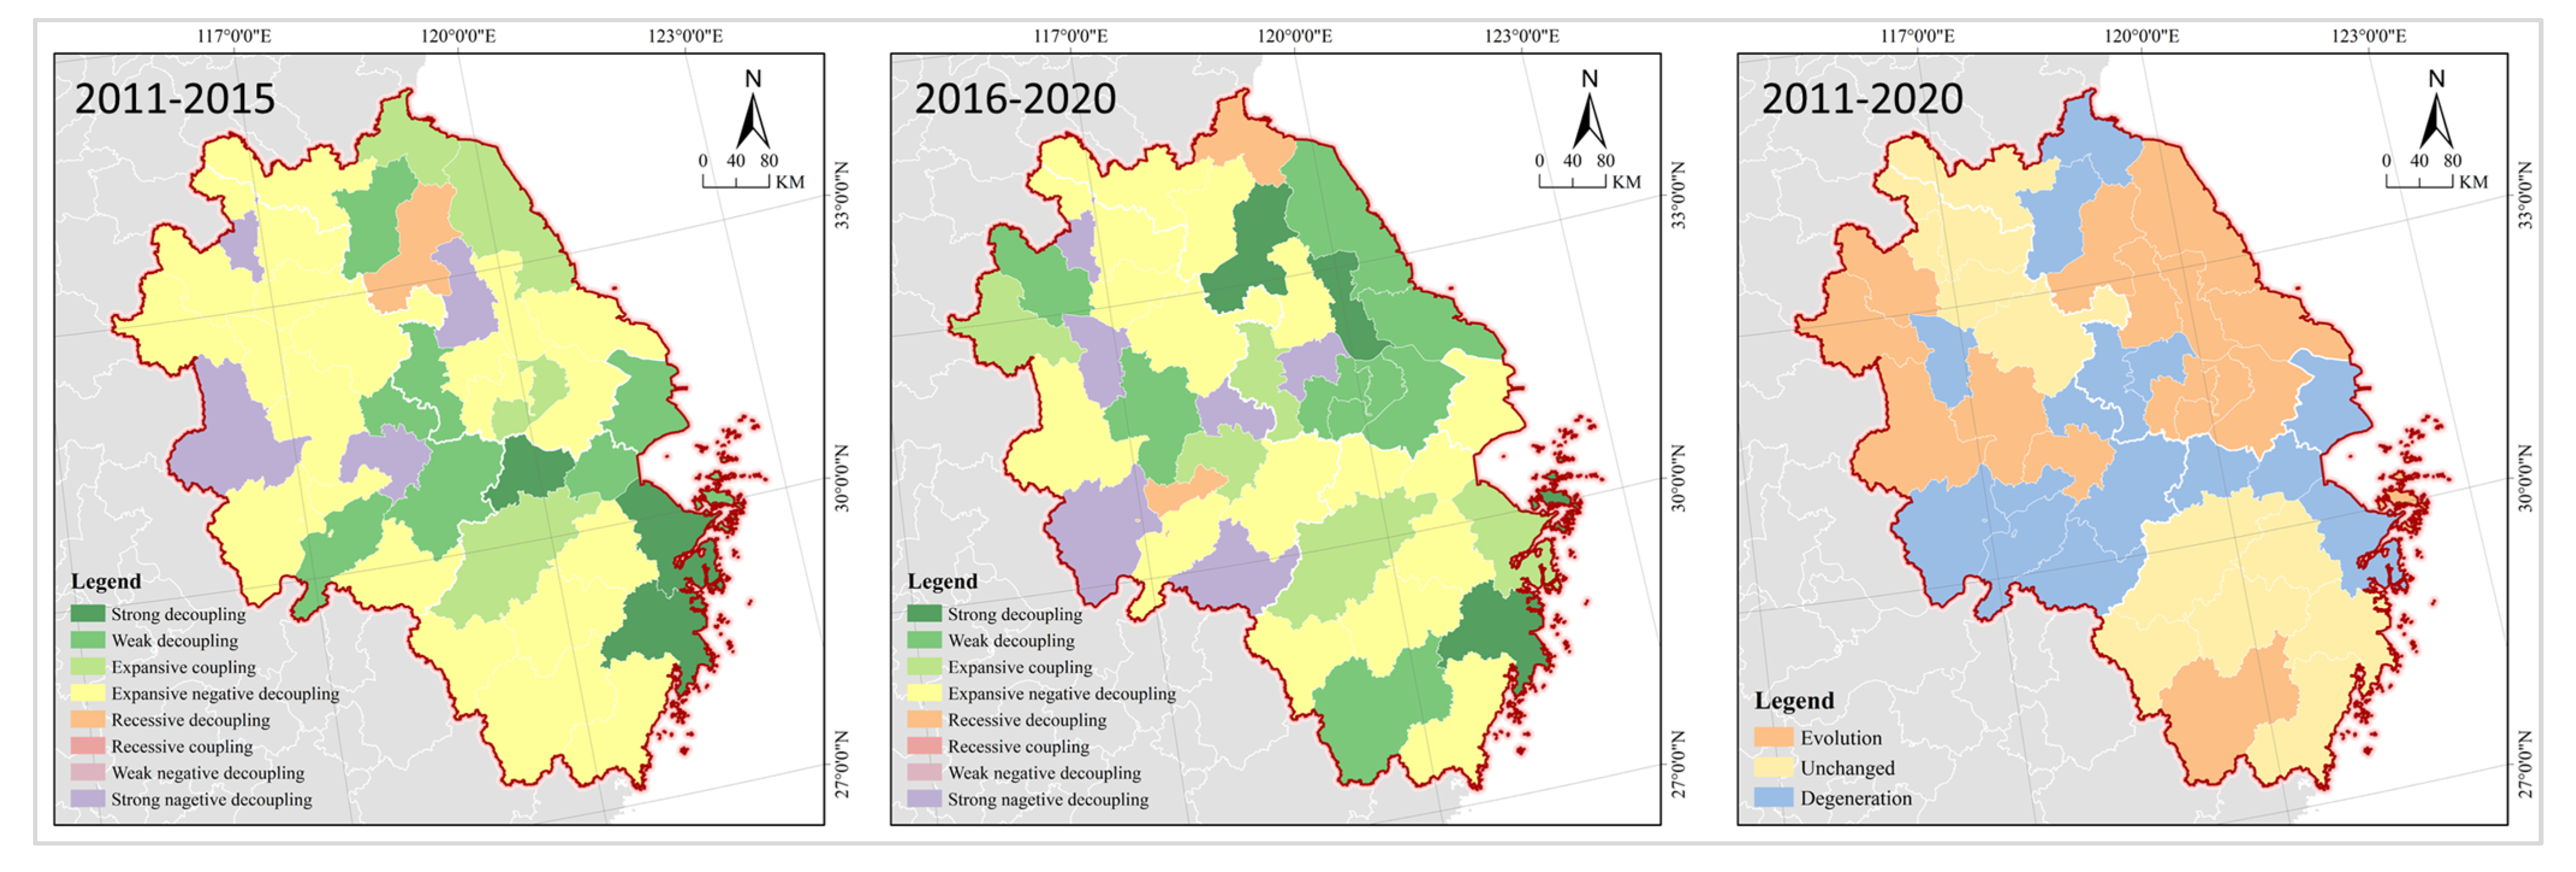
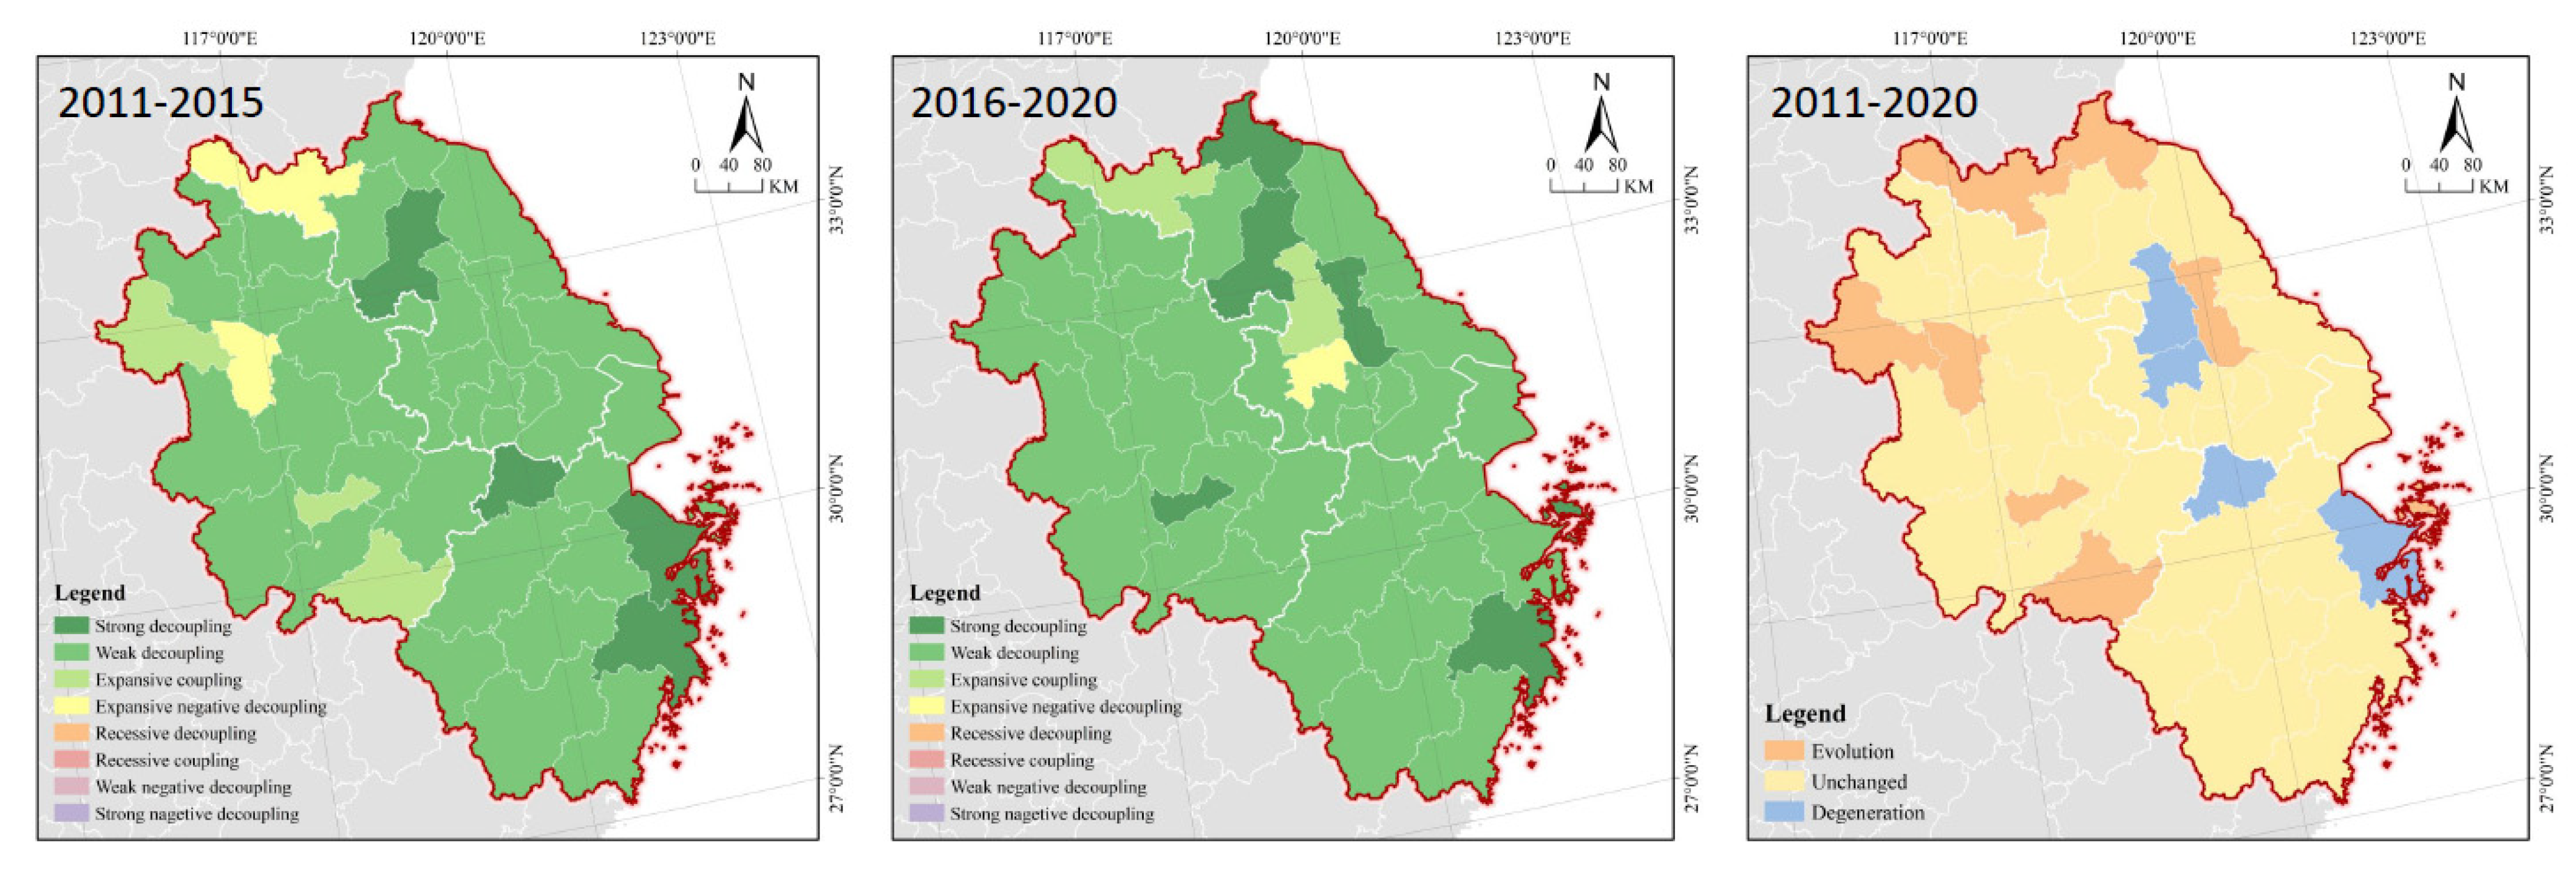
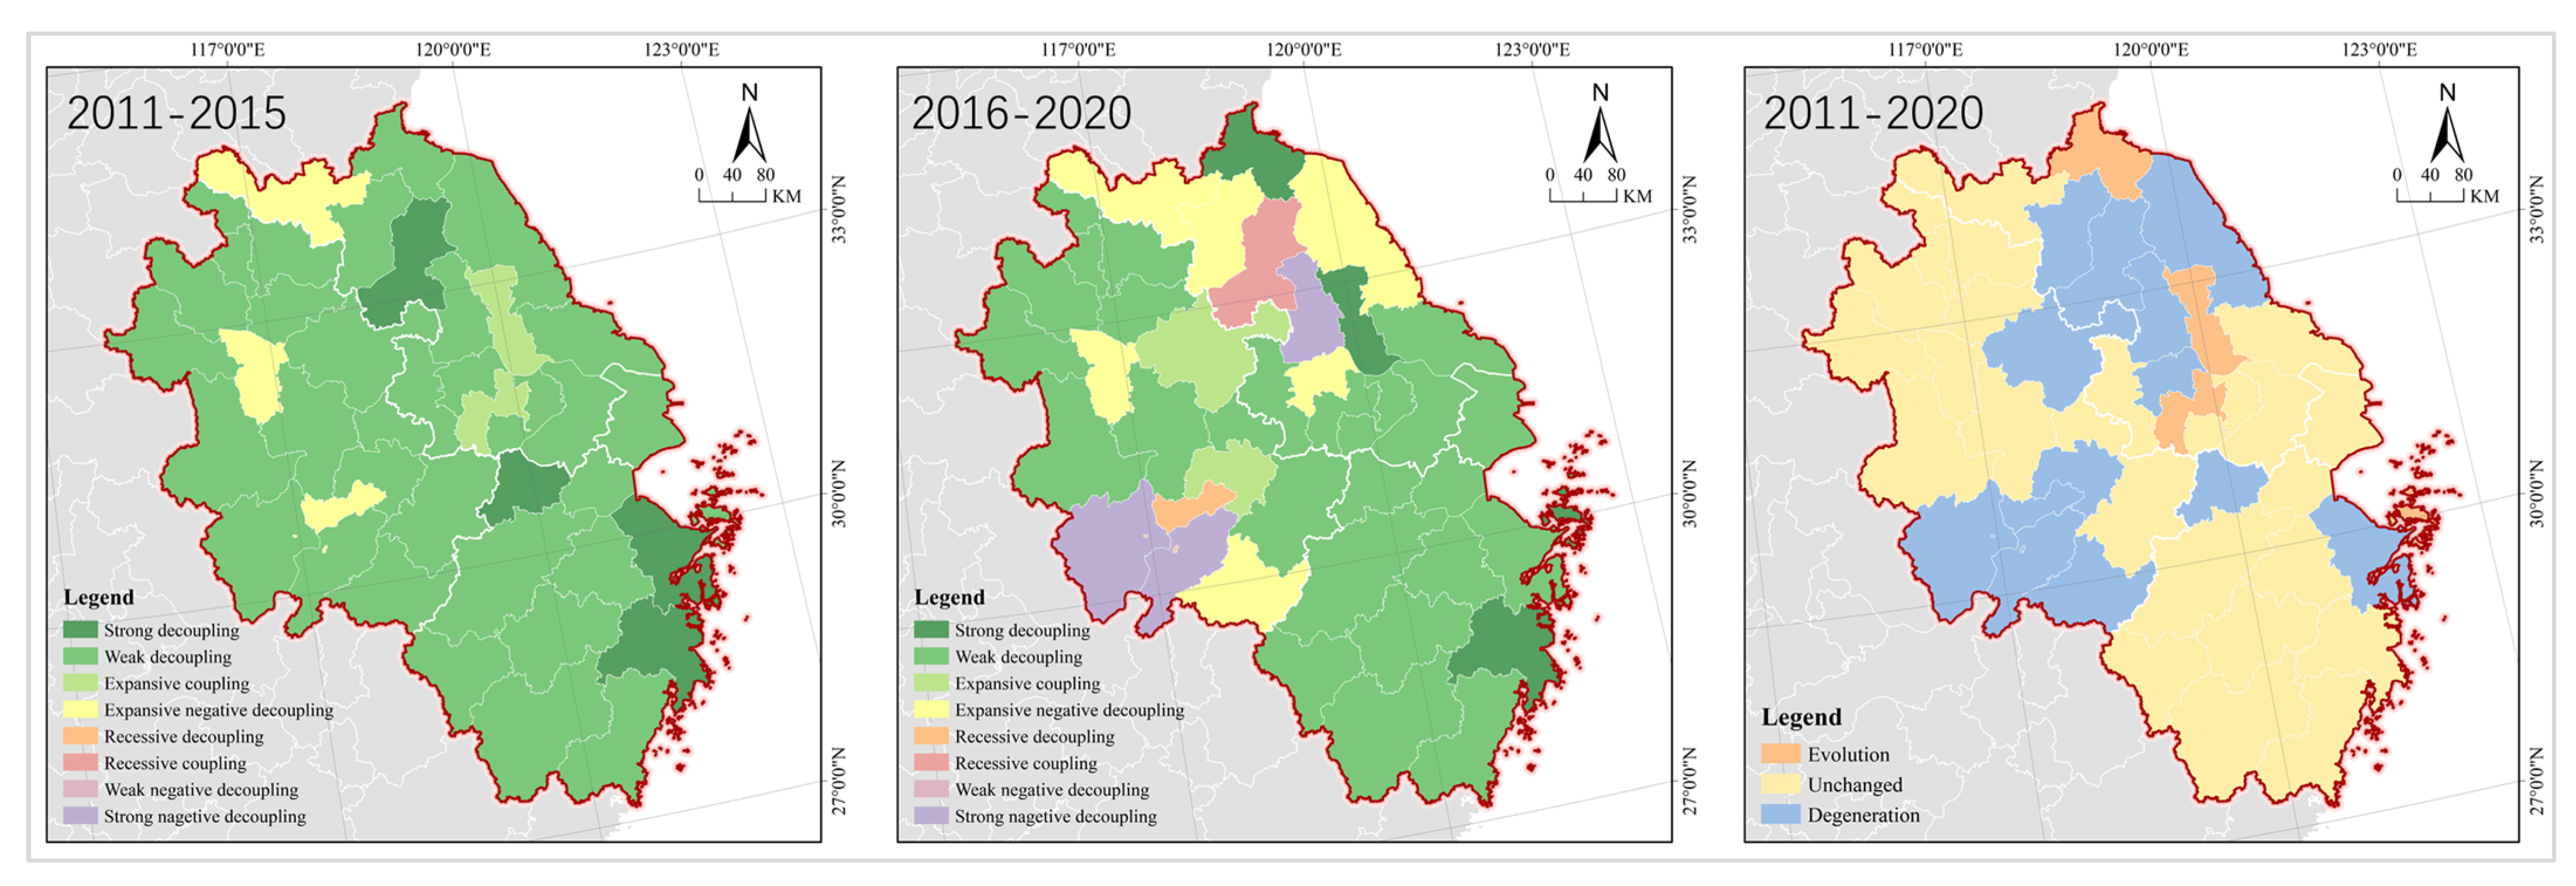
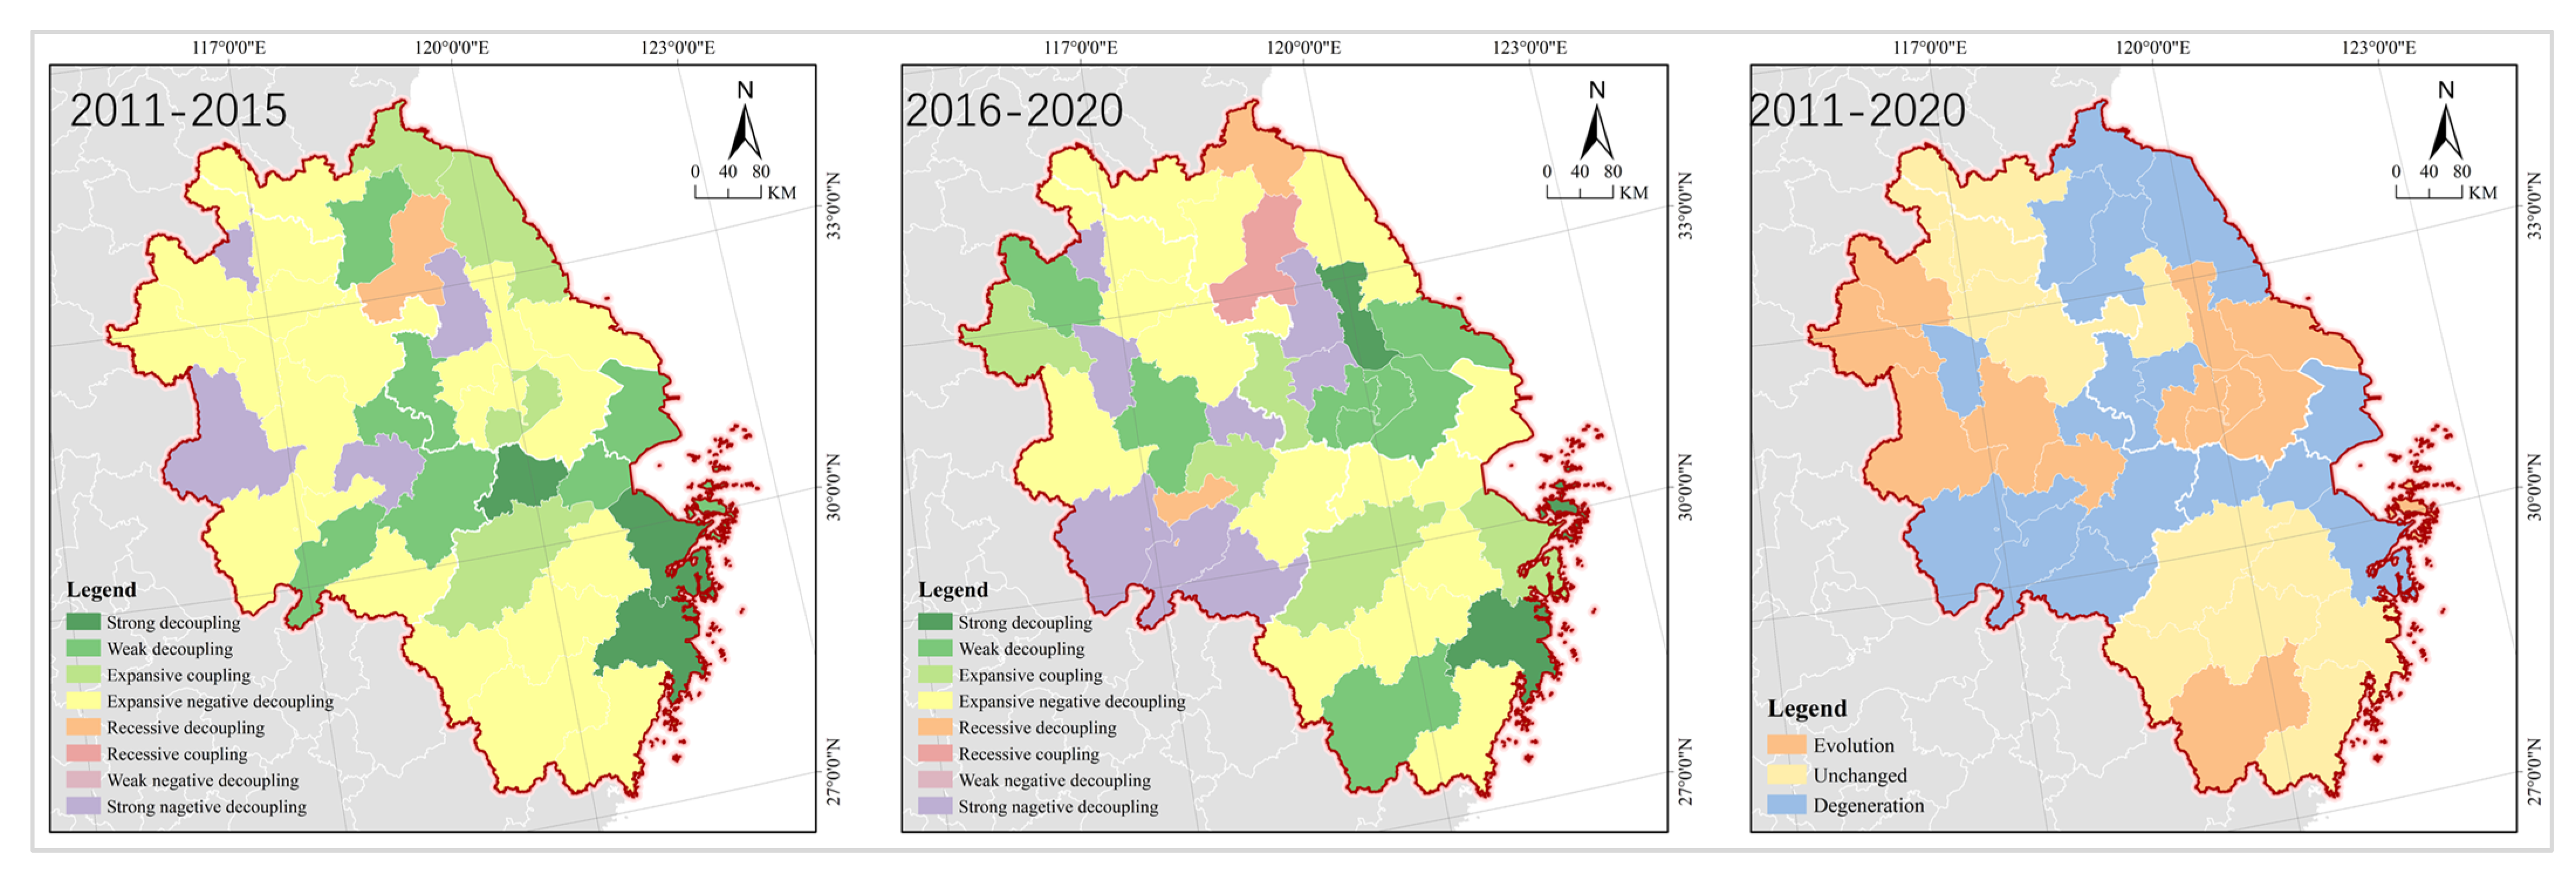
3.2.4. Final Decoupling Result

In summary, the results of the decoupling analysis of urban construction land vary widely from different perspectives of population, economy and finance. To better identify and determine the final decoupling type of each city, this paper adopts the least favorable principle to integrate the results of the decoupling analysis of the three dimensions. The so-called most unfavorable principle is to select the worst analysis result among the three dimensions as the final result. If the Urban Construction Land is in strong decoupling from Resident Population, in Weak decoupling from Gross Domestic Product, and in Expansive coupling from Government Revenue, the most unfavorable Expansive coupling will be chosen as the decoupling result in the end.
The number of cities of different decoupling types was structurally similar, but with slightly different ratios for 2011–2015 and 2016–2020. Cities in Expansive negative decoupling accounted for the largest part in YRDUA, followed by those in Weak decoupling, Expansive coupling, and Strong negative decoupling state. There were rare cities in other types. There have been no cities in Weak negative decoupling, while there are an increasing number of cities in Strong negative decoupling. In addition, a growing number of cities show the sign of re-coupling due to the economic transition and the outbreak of COVID-19 (Table 5).
Ningbo, Huzhou and Taizhou-ZJ were in Strong decoupling in 2011–2015, but they changed to Taizhou-JS, Zhoushan and Taizhou-ZJ in 2016–2020. Shanghai, Nanjing, Suqian, Jiaxing, Zhoushan, Maanshan, Chizhou and Xuancheng were in Weak decoupling in 2011–2015, but they changed to Wuxi, Changzhou, Suzhou, Nantong, Lishui, Hefei and Bozhou in 2016–2020. Wuxi, Lianyungang, Hangzhou and Yancheng were in Expansive coupling in 2011–2015, but they changed to Nanjing, Hangzhou, Ningbo, Wuhu and Fuyang in 2016–2020. Xuzhou, Changzhou and Suzhou were in Expansive negative decoupling in 2011–2015, but they changed to Shanghai, Xuzhou and Yancheng in 2016–2020. Huai’an was in Recessive decoupling in 2011–2015, but it changed to Lianyungang and Tongling in 2016–2020. There were no cities in Recessive coupling in 2011–2015, but Huai’an was in Recessive coupling in 2016–2020. Yangzhou, Wuhu, Huabei, and Liuan were in Strong negative decoupling in 2011–2015, but they changed to Yangzhou, Zhenjiang, Huainan, Maanshan, Huabei, Anqing, Huangshan, and Chizhou in 2016–2020 (Figure 9).
The change in decoupling types from 2011–2015 to 2016–2020 showed that the cities in evolution, degeneration, and unchanged states were distributed in clusters. There were the largest number of cities in degeneration state, accounting for more than 40%, including Shanghai, Nanjing, Lianyungang, Yancheng, Jiaxing, Ningbo, Anqing, Huangshan, and Tongling, mostly distributed in northern Jiangsu, southern Anhui, and Hangzhou Bay regions. The cities in evolution and unchanged states were the same in number, accounting for nearly 30%, respectively. The former included Wuxi, Changzhou, Suzhou, Nantong, Hefei, Fuyang, and Bozhou, mostly in southern Jiangsu, central Anhui and northwest Anhui regions; the latter included Xuzhou, Bengbu, Huabei, Suzhou, Hangzhou, Wenzhou, Shaoxing, Jinhua and Quzhou, mainly distributed in Zhejiang and Huaihai regions in clusters.

4. Discussion

4.1. Research Review and Prospect

4.1.1. The Spatio-Temporal Evolution Has High Expansibility and Heterogeneity

Based on the integrated analysis of urban construction land change trends, evolutionary patterns and effects in YRDUA from 2011 to 2020, this paper verifies the dynamic, divergent and interactive patterns of construction land change in urban agglomerations, which corroborates with the analysis results of existing papers. On the one hand, urban construction land expansion and spread are still the mainstream of spatial changes in urban agglomerations [113,114]. For example, Geymen [115] found that the rapid expansion of urban land in the Istanbul metropolitan area from 1990 to 2005 led to extensive forest and arable land degradation. Asabere [116] studied the evolution and spatial environmental impact of rapid urbanization in Ghana-Accra-City Region and the Greater Kumasi Sub-Region, two metropolitan regions, and put out that the urban construction land area in these urban agglomerations has increased significantly with expansion as a trendy development process for urban agglomerations. Ouyang [117] found that the urban land area of Changsha-Zhuzhou-Xiangtan Urban Agglomeration is expanding, and there are significant differences in the spatial extent of urban expansion across different classes.
On the other hand, this paper finds that the spatial differentiation of urban construction land change in urban agglomerations is significant, and the level of differentiation is decreasing. This finding is generally consistent with the conclusions of Li [118,119], Xue [120], Ren [121], and Zhang [122], who found that there are huge differences in urban construction land between Southern Jiangsu Urban Agglomeration, Shanghai Metropolitan Area, Yangtze River Delta urban agglomeration, urban agglomeration of central and southern Liaoning Province, the Beijing-Tianjin-Hebei Urban Agglomeration and the Guangdong-Hong Kong-Macao Greater Bay Area. Akubia [123] analyzed and evaluated the temporal and spatial dynamics of land use change (LUC) and urban expansion in Greater Accra Metropolitan Area of Ghana and found that the spatial pattern is an uneven and spatially different outward expansion. Tang [124] found that intercity differences in urban construction land in Changsha-Zhuzhou-Xiangtan urban agglomeration are significant, but they are decreasing.
However, some of the findings are not exactly the same as this paper, which is mainly due to the different developmental stages of the study subjects. For example, MA [125] found that the Gini index of urban land in the Central Plains City Cluster increased first, then decreased and next slowly increase, overall fluctuating in the range of 0.2~0.3. Duan [126] found that the trend, spatial pattern, and evolution of urban land expansion are significantly different between Yangtze River Delta and Central Plains Urban Agglomeration, with the former showing a “point-axis-wave cycle” pattern of urban land expansion, with high level of spatial heterogeneity and multiple urban expansion hotspots; the latter showing a “point-axis-net” pattern, with less spatial differentiation and expansion warm spots in the majority.

4.1.2. The Population, Economy and Income Effects of Land Use Are Complex

This paper finds that the decoupling of the urban construction land change from population growth, economic development and income improvement in urban agglomerations is dominated by Expansive negative decoupling, but some scholars believe that Weak decoupling or Strong negative stays in the lead. They are not fully in agreement with the finds of this paper, and these conflicts are mainly due to the differences in the scope of the study area and the choice of analysis indicators. For example, Liu pointed out expansive negative decoupling and weak decoupling between urban construction land expansion and the number of migrant workers in Hubei Province, China, from 2009 to 2014, and further classified the coordination relations into eight types based on the change of urban land area per capita and the type of decoupling [127]. Li [128] concluded that population and construction land growth in Hebei province are generally in a state of dissonance, mainly manifested by weak decoupling. Wang found that most counties in Hubei are in negative decoupling between population and construction land, with only nine counties in a coordinated state [129].
Significantly, influenced by differences in development stages, basic conditions, resource endowments, and strategic goals, there is a complex relationship between changes in urban construction land and population growth, economic development, and income improvement in different urban agglomerations, with significant dynamics and diversity. Xiao [130], Li [131], Hu [132], Huang [133], and Wu [134] found complex interactions between urban construction land expansion and population growth and economic development in the Shanghai-Hangzhou Bay Urban Agglomeration, Beijing-Tianjin-Hebei Metropolitan Region, and Yangtze River Economic Belt based on coupled coordination degree models, spatial analysis methods, and spatial econometric models. Marshall [135] pointed out that there is a regular proportional relationship between the expansion of land for construction and population growth in urban agglomerations in the United States, which complies with Zipf’s rule. Zhao [136] found that the change in YRDUA construction land from 2003 to 2012 had a positive impact on economic growth through the spatial Durbin panel data model, which showed direct and indirect effects. Rienow [137] found a complex two-way driving network between urban construction land change, population and economy in the Rhine-Ruhr Metropolitan Area. Cao [138] found that urban population agglomeration is the driving force behind the expansion of construction land in urban agglomerations, but its role is weakening as urban agglomerations become mature. Zhu [139] established the structure transition index of urban–rural construction land, and found that YRDUA construction land and mobile population were in Weak decoupling using the decoupling model in 2000–2005 and 2005–2015.

4.2. Differentiated Policy Design of Construction Land Use

Development planning and spatial governance policies play a key role in land development in urban agglomerations and serve as key tools to promote urban agglomerations towards sustainable development. Kinuthia [140] found that public policy has had a significant impact on speculative land development in Nairobi Metropolitan, and that the announcement of infrastructure plans will significantly increase speculative activity on land. Pawe [141] and Jain [142] analyzed the construction land use beyond control in Guwahati Metropolitan Area, India with the help of RS and GIS tools and suggested the authorities formulate urban agglomeration development planning and spatial governance policies early. Colavitti [143], Pendall [144], Pendall, [145], and Wilson [146] found that spatial planning, control policies, and land use regulations have a greater role in land acquisition, land use, and spatial governance of urban agglomerations in Italian, American, and Chinese cities, and they help effectively limit the spread beyond control and unplanned expansion of urban agglomerations. Ioja [147], believing that the emergence of land use conflicts in urban agglomerations reflects the increasing human pressure on the environment, constructed a multi-criteria land use conflict identification and evaluation tool based on the case study of the Bucharest Metropolitan Area and incorporated it into spatial and strategic planning for urban agglomerations. Badia [148] analyzed the opportunities and challenges of land occupation in the Barcelona Metropolitan Region, with an attempt to find alternative solutions to improve regional management and planning.
As mentioned above, the urban construction land in YRDUA varies greatly in scale, with significant spatial differentiation, and huge differences in change trends and evolutionary patterns and their development effects. In the era of ecological civilization and high-quality development, promoting the optimization of the spatial layout and regional configuration of urban construction land and boosting the sustainable development of urban agglomerations have become complex issues that governments must face and solve [149,150]. Neglecting intercity differences is a significant cause for the unsatisfactory results of urban agglomeration development planning and spatial governance policies. Therefore, in the face of the increasingly serious contradictions and conflicts between people and land, there is an urgent need for the government to formulate and implement a differentiated urban construction land supply policy based on the development conditions and strategic goals of different cities in urban agglomerations, with “classified guidance, zoning management”, while maintaining expenditures in some areas while reducing them in others, so as to improve the allocation and utilization efficiency of construction land and alleviate land conflicts. Based on the results of decoupling analysis, the 41 cities of YRDUA are divided into three types of policy areas of Transformation Leading, Land Dependent, and Problem Oriented, and it is suggested to implement a differential management system for urban construction land change of cities in different policy areas of urban agglomerations (Figure 10). The decoupling analysis result here is comprehensive rather than single, and it is the final result of overlapping analysis of three dimensions of Resident Population, Gross Domestic Product, and Government Revenue which helps ensure the objectivity and accuracy of land use planning and policy zoning.

4.2.1. Transformation Leading Policy Area

Transformation Leading Policy Area includes Wuxi, Changzhou, Suzhou, Nantong, Taizhou-JS, Zhoushan, Taizhou-ZJ, Lishui, Hefei, and Bozhou. These cities are in Strong decoupling or Weak decoupling, with urban construction land, population, economy and income in a sustained growth. For the cities in this policy area, economic growth and social development rely little on urban construction land input, and the urban development momentum has shifted from relying on land resource factor input to an innovation factor-driven development.
Cities in this policy area should transform their economic development and land use on the basis of controlling the total amount and increment of construction land, increase the input of capital, technology, talent and other innovative factors per unit area of construction land, and optimize and reconfigure the combination and matching relationship between urban construction land and the input of capital, technology, talent and other factors [151]. Moreover, they should try to establish an urban–rural land replacement mechanism for the needs of rural revitalization and urban–rural integrated development, vigorously promote the linkage of urban–rural construction land increase and decrease, while planning and building some demonstration areas or pilot areas for urban–rural integrated development [152]. In addition, these cities should try to establish intercity land index trading market and platform, explore intercity trading mechanism of urban construction land index, sell their own surplus index to other cities with demand in the city cluster, and meet the demand of land use of the city while providing financial guarantee for land improvement and economic development.
For Hefei, the comprehensive effect of urban construction land change in 2016–2020 was in Weak decoupling, indicating a high degree of land use intensification and a leading position in YRDUA. In addition, with the land use change in the pattern of cow, Hefei saw a slow growth of urban construction land, but there was a large stock area. Therefore, appropriate measures should be taken for Hefei to control the urban construction land supply, make additional investment in innovation elements, accelerate the construction of Hefei Binhu Science City and High-Tech Development Zone, create new development platforms such as innovation neighborhoods, science and technology parks and makers spaces with stock land, with focus on boosting the digital development of new infrastructure and industries, improving the innovation and entrepreneurship ecosystem, and driving the concentration of regional high-end talents in Hefei.

4.2.2. Land Dependent Policy Area

Land Dependent Policy Area includes Nanjing, Hangzhou, Ningbo, Wuhu, and Fuyang. These cities are in Expansive coupling, with urban construction land growing in tandem with population, economy and income over time. The urban development in this policy area is still highly dependent on construction land and is still in the stage of agglomeration development. Therefore, the normal demand for construction land of these cities should be guaranteed in the future.
The first is in the spatial planning of land and the annual plan preparation for land use to scientifically measure the demand for land and appropriately supply a certain amount of urban construction land to meet the land needs for the production, living, major ecological projects. The second is to, oriented by national strategies, promote the planning and construction of new cities and new districts, industrial development zones, hub areas, and special functional areas, such as university towns, science and technology cities, logistics parks, aviation cities, high-speed rail cities, tourism cities, ecological cities, industrial parks or bases, at the right time according to the development strategy needs of the city cluster and this city, and steadily increase the total amount of land for construction in large cities [153]. The third is to innovate the way of supplying urban construction land and to enrich the sources of urban construction land through intercity trading of urban construction land indexes, redevelopment of inefficient use, and urban–rural land exchange so as to acquire more urban construction land indexes and continuously increase the scale of urban construction land. The fourth is to enhance the supervision of urban construction land use, actively carry out the evaluation of urban construction land saving and intensification, establish a system linking the allocation of new construction land indicators with the effectiveness of land saving and intensification, gradually reduce the dependence of urban development on land resources, improve the population carrying capacity and economic added value of urban construction land per unit area [154,155], and promote the decoupling of urban development from land resource input early.
For Nanjing, the comprehensive effect of urban construction land change in 2016–2020 was in Expansive coupling, indicating a high dependence on land resources for population, economic and income growth. In addition, the land use change in Nangjing was in the pattern of cow with slow growth of urban construction land and a large stock area. However, as a famous historical and cultural city, Nanjing faces many constraints, difficulties and challenges in the reconstruction of stock land. Additionally, Nanjing is also a regional center city with a low primacy, having a strong demand to grow into a large scale. Therefore, Nanjing should focus on promoting the construction of Jiangbei New District, the Airport Economic Demonstration Zone and the New High-speed Railway District, further enlarging the framework of Nanjing’s urban space development, promoting the deep integration of modern industries and urban functions, and enhancing its primacy as the capital of Jiangsu Province and the central city of YRDUA.

4.2.3. Land Reduction Policy Area

Problem Oriented Policy Area includes Shanghai, Xuzhou, Yungang, Huai’an, Yancheng, Yangzhou, Zhenjiang, Suqian, Wenzhou, Jiaxing, Huzhou, Shaoxing, Jinhua, Quzhou, Bengbu, Huainan, Ma’anshan, Huaibei, Tongling, Anqing, Huangshan, Chuzhou, Suzhou, Lu’an, Chizhou and Xuancheng. The types of decoupling in these cities include Expansive negative decoupling, Recessive decoupling, Recessive coupling, Weak negative decoupling, Strong negative decoupling, where urban construction land change remains asynchronous with population growth, economic development, and income improvement for a long time, resulting in extensive land use and even waste or city shrinkage. Therefore, for cities in this policy area, promoting the reduction of urban construction land supply and raising land development intensification are the key considerations. For the cities in this policy area, special or thematic studies in different categories are required to analyze the advantages, problems, opportunities, and challenges of different cities so as to develop adaptive and graded response policies.
(1)
For cities in Expansive negative decoupling, such as Shanghai, Xuzhou, and Yancheng, the supply of urban construction land should be changed from “demand-driven supply” to “supply-adjusted demand” [156] to promote the cities to achieve reduced development early. According to the idea of framing the total amount, revitalizing the stock and improving the quality, the sustainable development of the city should be achieved by revitalizing, optimizing, tapping the potential and upgrading the stock of land under the condition that the total amount of urban construction land remains unchanged or even reduced, and the urban space does not expand or even contract. The cities of such type should accelerate the preparation and implementation of urban renewal and transformation planning, comprehensive environmental improvement planning, transportation improvement and infrastructure upgrading planning, historical district and landscape protection planning, industrial upgrading and park integration planning, land preparation and demolition and resettlement planning. For example, Shanghai has taken the lead in building a comprehensive land quantization management system in China, including introducing a mechanism to link new construction land plans with construction land reduction, setting up special supportive funds for municipal land reduction, and incorporating land reduction into the performance assessment system for leading cadres of district and county governments.
(2)
For cities in Recessive Decoupling or Recessive Coupling, such as Lianyungang, Tongling, and Huai’an, priority should be given to promoting cities from negative to positive growth, and promoting the efficiency of urban construction land use in the process. On the one hand, it is necessary to carry out stricter supervision and investigation on “granting, supplying, using, replenishing, and investigating” urban construction land to comprehensively implement the remediation and redevelopment of low-utility land, to import high value-added industries, and to promote industrial upgrading and economic transformation; on the other hand, it is necessary to establish and improve the standards of urban construction land use and supply to set norms for investment and output intensity of urban construction land by level, by industry, and by function, to introduce a catalog of industries that meet the city’s priority and preferential land supply, and to force the transformation of investment through the innovation of urban construction land supply standards, so as to promote the sustainable development of urban economy.
For example, Tongling is a resource-based city, with a large proportion of traditional industries such as mining and metal smelting, chemical raw materials and chemical products manufacturing, characterized by scattered industrial land layout, and relatively extensive land use. Therefore, on the one hand, it is necessary to enhance the supervision and investigation of the inefficient use of stock land resources in traditional industries in Tongling, trying to force the transformation and renewal of the land use to extend the industrial chain by leveraging the output per area index management. On the other hand, it is necessary to increase the supply of land for strategic emerging industries such as copper-based new materials, advanced structural materials and green building materials, simplify the approval procedures, lower the investment threshold, and build industrial R&D and innovation platforms to push the industrial value chain in Tongling forward to the high end.
(3)
For cities in Weak negative decoupling and Strong negative decoupling state, such as Yangzhou, Zhenjiang, Huainan, Maanshan, Huabei, Anqing, Huangshan, and Chizhou, urban construction land is still in positive growth in the context of population loss and negative economic growth. In these cities, mostly resource-based cities, tourism-based cities and marginal cities, urban construction land has been found to have experienced serious extensive development and even waste of resources, and urban development has been in a period of decline. It is important to carry out a dedicated single case analysis to identify the cruxes and obstacles that prevent the capitalization of urban construction land resources, and accordingly design and synchronize the implementation of multiple measures to promote urban revitalization for them. First of all, measures should be taken to strictly control the conversion of cultivated land and ecological land into urban construction land and limit the development of new towns and new areas, except for the national strategic projects arranged by the central government, urban agglomeration sharing projects and major livelihood and ecological projects of the city. Secondly, development plans for urban construction land reduction should be prepared and implemented, the list of reduction tasks should be refined, the reduction tasks should be decomposed to each subdistrict and included in the government performance assessment, and the total amount of urban construction land should be steadily and continuously promoted to be reduced. Again, efforts should be made to promote the restoration of suburban areas or scattered layout enclave-like urban construction land to arable land for rural revitalization and park city construction needs, implement special treatment actions for urban inefficient and idle land, and transform them into new industrial land or green space to improve economic development and the quality of human living environment [157,158].
For example, Zhenjiang is a marginal city in Nanjing metropolitan area, and affected by Nanjing’s siphon effect, it is facing serious loss of population, talents and development factors such as funds and capital, with the city’s economy and land in a state of contraction. Therefore, the focus of Zhenjiang for its future development is to figure out the strategies for linkage development with cities in the region, especially comprehensive connection to and deep integration into Nanjing, with a view of achieving the integrated development of Ningbo, Zhenjiang and Yangzhou.

5. Conclusions

Urban construction land change has long been a hot spot and key area of urban research worldwide, and it has aroused extensive attention of scholars across different circles. Urban agglomerations are the most dynamic and potential regions in the development of urbanization, industrialization and globalization across the world. Analyzing the spatio-temporal evolution dynamics and change effects of urban construction land in urban agglomerations is of theoretical significance to have an insight for the growth process and development law of urban agglomerations, and of practical value to the design of urban agglomeration development policies and the preparation of territorial spatial planning. Chinese urban agglomerations, especially YRDUA, are typically representative in the world. In this paper, we have empirically studied the pattern of urban construction land change and evolutionary effects in YRDUA from 2011 to 2020 by a combination of BCG model, decoupling model and GIS tools. The findings are presented as follows:
(1)
The urban construction land in the city cluster has a high level of spatial heterogeneity, and in a “swallow” form it is solid in spatial structure, with increasingly diversified trends and patterns of change. According to time series analysis of urban construction land in YRDUA, the change trends are divided into three categories of “Rapid Growth”, “Slow Growth” and “Inverted U-shape”. The spatial difference of urban construction land varies greatly, and its spatial distribution is characterized by “center-periphery” structure. Furthermore, urban construction land in urban agglomerations varies greatly between cities, but the spatial heterogeneity is decreasing. Moreover, the evolution patterns are divided into four types of stars, cows, questions, and dogs based on the BCG model, and different types are geographically distributed in clusters with spatial agglomeration.
(2)
Changes in urban construction land in urban agglomerations have not brought about the desired effects on population growth, economic development and income improvement, and changes in decoupling types are becoming increasingly complex, with an increasing number of degraded or recoupled cities. The effect of YRDUA urban construction land change is dominated by Expansive negative decoupling, followed by Weak decoupling, Expansive coupling, and Strong negative decoupling, and the analysis results based on different perspectives of population, economy and finance vary greatly. Cities with decoupling type changes in evolution, degeneration, and unchanged states are distributed in clusters, with the largest number of degenerated cities and the same number of evolved and unchanged cities. The number of cities in Strong negative decoupling is increasing due to the economic transition and the outbreak of COVID-19, and as typical problematic spaces, they have been a major threat to sustainable development of urban agglomerations.
(3)
Based on the decoupling types and their changes, coupled with the change trend and evolution pattern of urban construction land, the urban agglomerations are divided into three policy areas of Transformation Leading, Land Dependent and Problem Oriented, with establishment of a differentiated management system of urban construction land in urban agglomerations. For cities in each type of policy area, targeted policy design recommendations are made, which significantly improves the precision of policy design and development planning.
This study is dedicated to three innovative explorations. The first is innovation in research framework. This paper aims to provide a set of scientific, objective, simple and feasible technical tools for urban construction land management in urban agglomerations. By combining the BCG model, decoupling model and spatial econometric model, we have built a new framework of “Evolution Dynamic + Change Effect + Policy Design” for urban construction land change research in urban agglomerations, which provides a quantitative decision basis for the preparation of territorial spatial planning and land use policy design, which is the biggest innovation of this paper. The second is innovation in research methods. The urban development life cycle determines that there are multiple development stages of urban growth: incremental expansion, stock renewal, reduction and optimization, and contraction and decay. With the change in development environment and endogenous power, most cities are bound to transform from increment to stock at the right time. Based on the analysis of the trends and evolution patterns of urban construction land in urban agglomerations, integration of multi-dimensional indicators of land, population, economy, and society into the same holistic analysis framework based on the decoupling model will help quantitatively evaluate the economic and social benefits of urban land use, while enabling comprehensive assessment of the pressure, potential, and capacity of different cities to transform their development, thus laying the foundation for developing technical tools to quantitatively identify the transformation of cities from incremental to stock development. The third is innovation in research applications. Different from the existing papers, this paper proposes a differentiated management and policy design method for urban construction land in urban agglomerations, which improves the precision, scientific integrity and adaptability of governmental decision making, which is another innovation of this paper.
The analysis framework provided in this paper is conducive to more rational land use planning and policy making, and it also helps to better integrate quantitative analysis into policy design and implementation, providing valuable reference and decision basis for city governments to carry out precise, differentiated and adaptive policy design. The technical framework and research findings presented in this paper are not only applicable to China, but they also provide valuable references for decision making on urban construction land management in urban agglomerations in developed countries such as the United States, Germany, France, the United Kingdom, Italy, Japan, and South Korea, and especially in developing countries such as India, Iran, Brazil, Russia, Egypt, and Indonesia. Urban agglomerations have long been the main form of spatial development in Europe and the United States, but along with urbanization and industrialization, urban agglomerations in developing countries are experiencing a period of rapid development and are becoming a new challenge for territorial spatial planning and governance. Empirical studies and case studies on urban agglomerations in these countries based on the technical framework and research methods in this paper may help them identify their problems and challenges, formulate and implement targeted spatial planning and intervention policies in time, while contributing to sustainable development of the urban agglomerations.
However, due to the limitation of data and information availability, this paper inevitably has some shortcomings and defects in the selection of indicators and universality of research findings for a case study. For example, land finance is only a part of urban revenue, and due to the lack of urban land finance data, urban revenue indicators are used directly in this paper as an alternative, which affects the accuracy of the analysis results to a certain extent. Due to the rapid development of urban agglomerations, YRDUA has experienced the most complicated administrative division adjustment in China, such as conversion townships into towns, towns into subdistricts, and counties into districts, and even splitting a prefecture-level city in an extreme case, resulting in the raw data of some city-related indicators inevitably split up and integrated, and thus affecting the analysis results and conclusions of this paper to some extent. Moreover, the development mechanism of urban agglomerations and the supply and demand system of urban construction land are complex, and due to no comparative analysis between urban agglomerations in China or different urban agglomerations in different countries, the universality of the findings and conclusions of this paper should be corroborated, supplemented and improved by more empirical studies.
Due to the limitations of many factors such as data and research techniques, this study has only conducted an exploratory study on the dynamics and effects of urban construction land change in urban agglomerations and their governance policies, with insufficient analysis of the driving forces behind the change. Urban construction land change in urban agglomerations is a complex adaptive system involving multiple elements such as population, economy, society, ecology and even politics. In the future research, we will further explore the influencing factors of urban construction land change in urban agglomerations at different stages of development, trying to reveal deeper driving mechanisms, and thus provide more targeted and constructive reference for urban agglomeration development planning and territorial spatial governance in the new era.

Author Contributions

Conceptualization, B.Z.; methodology, B.Z. and Z.Z.; software, D.S. and Z.Z.; validation, B.Z., D.S. and Z.Z.; formal analysis, B.Z. and D.S.; investigation, B.Z. and Z.Z.; resources, B.Z.; data curation, B.Z. and Z.Z.; writing—original draft preparation, B.Z.; writing—review and editing, B.Z. and D.S.; visualization, D.S. and Z.Z.; supervision, B.Z. and D.S.; project administration, B.Z.; funding acquisition, B.Z. All authors have read and agreed to the published version of the manuscript.

Funding

This research was funded by National Key R&D Program of the Ministry of Science and Technology of the People’s Republic of China, grant number 2018YFD1100302.

Institutional Review Board Statement

Not applicable.

Informed Consent Statement

Not applicable.

Data Availability Statement

Most of the data can be obtained by visiting the following links: https://www.mohurd.gov.cn/gongkai/fdzdgknr/sjfb/tjxx/index.html (accessed on 19 January 2021), https://data.cnki.net/yearbook/Single/N2021050059 (accessed on 3 February 2021), http://tjj.sh.gov.cn/tjnj/20220309/0e01088a76754b448de6d608c42dad0f.html (accessed on 16 February 2021), http://tj.jiangsu.gov.cn/col/col4009/index.html (accessed on 16 February 2021), http://tjj.zj.gov.cn/col/col1525563/index.html (accessed on 1 March 2021), and http://tjj.ah.gov.cn/ssah/qwfbjd/tjnj/index.html (accessed on 5 March 2021).

Conflicts of Interest

The authors declare no conflict of interest.

Appendix A

Table A1. Index data based on maximum standardization method in 2011 and 2015.
NumberCityConstruction
Land Use
Resident
Population
Gross Domestic
Product
Government
Revenue
20112015201120152011201520112015
1Shanghai1.0000 1.0000 1.0000 1.0000 1.0000 1.0000 1.0000 1.0000
2Nanjing0.2256 0.2522 0.2146 0.2408 0.2920 0.3914 0.1744 0.1867
3Wuxi0.0919 0.0984 0.0825 0.0875 0.1879 0.1752 0.1150 0.0931
4Xuzhou0.0492 0.0821 0.0627 0.0707 0.1115 0.1172 0.0545 0.0496
5Changzhou0.0597 0.0858 0.0513 0.0632 0.1431 0.1826 0.0856 0.0750
6Suzhou0.1159 0.1561 0.0889 0.1063 0.2141 0.3017 0.1289 0.1518
7Nantong0.0741 0.0813 0.0470 0.0471 0.0840 0.0912 0.0553 0.0499
8Lianyungang0.0583 0.0796 0.0321 0.0414 0.0267 0.0477 0.0262 0.0316
9Huai’an0.0710 0.0665 0.0542 0.0517 0.0553 0.0659 0.0402 0.0426
10Yancheng0.0313 0.0480 0.0316 0.0501 0.0410 0.0698 0.0279 0.0411
11Yangzhou0.0422 0.0478 0.0435 0.0395 0.0920 0.1063 0.0445 0.0427
12Zhenjiang0.0393 0.0472 0.0336 0.0329 0.0539 0.0634 0.0297 0.0296
13Taizhou-JS0.0328 0.0524 0.0263 0.0344 0.0347 0.0617 0.0276 0.0295
14Suqian0.0242 0.0290 0.0218 0.0280 0.0247 0.0311 0.0152 0.0181
15Hangzhou0.1356 0.1576 0.1172 0.1375 0.2946 0.3512 0.2010 0.2079
16Ningbo0.1135 0.1020 0.0617 0.0626 0.1909 0.1964 0.1348 0.1291
17Wenzhou0.0512 0.0625 0.0530 0.0598 0.0716 0.0757 0.0376 0.0344
18Jiaxing0.0364 0.0397 0.0171 0.0189 0.0353 0.0351 0.0228 0.0198
19Huzhou0.0502 0.0351 0.0217 0.0219 0.0364 0.0374 0.0151 0.0142
20Shaoxing0.0348 0.0754 0.0224 0.0402 0.0288 0.1066 0.0174 0.0428
21Jinhua0.0253 0.0275 0.0198 0.0197 0.0246 0.0260 0.0138 0.0135
22Quzhou0.0203 0.0241 0.0123 0.0122 0.0202 0.0197 0.0091 0.0092
23Zhoushan0.0181 0.0198 0.0174 0.0208 0.0297 0.0323 0.0187 0.0171
24Taizhou-ZJ0.0502 0.0441 0.0409 0.0406 0.0517 0.0522 0.0265 0.0235
25Lishui0.0112 0.0128 0.0063 0.0064 0.0110 0.0114 0.0065 0.0065
26Hefei0.1071 0.1506 0.0963 0.1014 0.1255 0.1517 0.0804 0.0817
27Wuhu0.0527 0.0578 0.0462 0.0426 0.0525 0.0600 0.0273 0.0305
28Bengbu0.0372 0.0472 0.0332 0.0335 0.0214 0.0274 0.0123 0.0147
29Huainan0.0332 0.0367 0.0452 0.0445 0.0271 0.0222 0.0169 0.0109
30Ma’anshan0.0361 0.0372 0.0229 0.0244 0.0382 0.0337 0.0182 0.0260
31Huaibei0.0291 0.0309 0.0342 0.0326 0.0216 0.0212 0.0089 0.0081
32Tongling0.0165 0.0250 0.0166 0.0172 0.0256 0.0289 0.0108 0.0096
33Anqing0.0282 0.0321 0.0264 0.0272 0.0179 0.0170 0.0057 0.0084
34Huangshan0.0125 0.0167 0.0130 0.0139 0.0092 0.0099 0.0089 0.0082
35Chuzhou0.0276 0.0397 0.0140 0.0151 0.0112 0.0136 0.0079 0.0101
36Fuyang0.0284 0.0400 0.0307 0.0306 0.0154 0.0178 0.0083 0.0112
37Suzhou0.0222 0.0255 0.0184 0.0201 0.0173 0.0209 0.0030 0.0097
38Lu’an0.0222 0.0255 0.0168 0.0162 0.0112 0.0152 0.0080 0.0087
39Bozhou0.0161 0.0215 0.0123 0.0126 0.0116 0.0134 0.0041 0.0078
40Chizhou0.0125 0.0128 0.0109 0.0112 0.0103 0.0117 0.0069 0.0111
41Xuancheng0.0165 0.0173 0.0087 0.0099 0.0093 0.0107 0.0037 0.0044
Table A2. Index data based on maximum standardization method in 2016 and 2020.
NumberCityConstruction
Land Use
Resident
Population
Gross Domestic
Product
Government
Revenue
20162020201620202016202020162020
1Shanghai1.0000 1.0000 1.0000 1.0000 1.0000 1.0000 1.0000 1.0000
2Nanjing0.4024 0.4323 0.2441 0.2656 0.3727 0.3829 0.1784 0.2324
3Wuxi0.1498 0.1554 0.0893 0.0978 0.1685 0.1660 0.0837 0.0977
4Xuzhou0.1276 0.1478 0.0731 0.0810 0.1090 0.0960 0.0419 0.0406
5Changzhou0.1364 0.1425 0.0640 0.0742 0.1769 0.1736 0.0658 0.0770
6Suzhou0.2394 0.2468 0.1087 0.1227 0.2842 0.2443 0.1436 0.1760
7Nantong0.1285 0.1466 0.0474 0.0614 0.0878 0.1326 0.0411 0.0526
8Lianyungang0.1258 0.1146 0.0413 0.0391 0.0464 0.0502 0.0226 0.0247
9Huai’an0.1279 0.1068 0.0543 0.0598 0.0732 0.0697 0.0365 0.0280
10Yancheng0.0773 0.0849 0.0502 0.0573 0.0669 0.0618 0.0310 0.0294
11Yangzhou0.0773 0.0953 0.0433 0.0444 0.1029 0.0939 0.0368 0.0321
12Zhenjiang0.0728 0.0875 0.0329 0.0327 0.0607 0.0493 0.0241 0.0224
13Taizhou-JS0.0850 0.0772 0.0347 0.0363 0.0610 0.0589 0.0272 0.0266
14Suqian0.0449 0.0535 0.0288 0.0309 0.0305 0.0309 0.0158 0.0165
15Hangzhou0.2647 0.3260 0.1404 0.1713 0.3490 0.3901 0.2068 0.2841
16Ningbo0.1783 0.2127 0.0739 0.0896 0.1978 0.2040 0.1213 0.1528
17Wenzhou0.0942 0.1043 0.0620 0.0649 0.0729 0.0699 0.0318 0.0399
18Jiaxing0.0621 0.0829 0.0193 0.0213 0.0344 0.0388 0.0194 0.0261
19Huzhou0.0549 0.0650 0.0221 0.0228 0.0359 0.0380 0.0137 0.0202
20Shaoxing0.1119 0.1285 0.0407 0.0442 0.0994 0.0922 0.0399 0.0516
21Jinhua0.0512 0.0567 0.0232 0.0243 0.0246 0.0236 0.0128 0.0136
22Quzhou0.0376 0.0439 0.0123 0.0124 0.0188 0.0198 0.0086 0.0110
23Zhoushan0.0308 0.0295 0.0209 0.0214 0.0322 0.0261 0.0155 0.0188
24Taizhou-ZJ0.0679 0.0656 0.0407 0.0474 0.0501 0.0496 0.0227 0.0235
25Lishui0.0202 0.0219 0.0067 0.0100 0.0109 0.0105 0.0061 0.0080
26Hefei0.2378 0.2497 0.1005 0.1139 0.1488 0.1766 0.0737 0.0806
27Wuhu0.0923 0.1263 0.0430 0.0574 0.0589 0.0765 0.0301 0.0402
28Bengbu0.0745 0.0786 0.0333 0.0341 0.0264 0.0281 0.0145 0.0151
29Huainan0.0575 0.0631 0.0448 0.0443 0.0209 0.0209 0.0101 0.0092
30Ma’anshan0.0573 0.0593 0.0243 0.0241 0.0323 0.0324 0.0129 0.0145
31Huaibei0.0478 0.0494 0.0281 0.0247 0.0194 0.0162 0.0067 0.0084
32Tongling0.0420 0.0379 0.0182 0.0181 0.0267 0.0216 0.0113 0.0102
33Anqing0.0520 0.0778 0.0272 0.0251 0.0162 0.0204 0.0111 0.0099
34Huangshan0.0260 0.0299 0.0142 0.0102 0.0095 0.0106 0.0073 0.0074
35Chuzhou0.0446 0.0534 0.0158 0.0166 0.0131 0.0229 0.0102 0.0114
36Fuyang0.0621 0.0753 0.0316 0.0394 0.0172 0.0228 0.0098 0.0141
37Suzhou0.0406 0.0455 0.0203 0.0224 0.0204 0.0218 0.0088 0.0101
38Lu’an0.0398 0.0414 0.0181 0.0184 0.0171 0.0199 0.0092 0.0094
39Bozhou0.0359 0.0380 0.0128 0.0142 0.0130 0.0181 0.0075 0.0096
40Chizhou0.0194 0.0218 0.0113 0.0114 0.0111 0.0122 0.0070 0.0058
41Xuancheng0.0280 0.0332 0.0109 0.0111 0.0103 0.0113 0.0040 0.0082

References

  1. Surya, B.; Salim, A.; Hernita, H.; Suriani, S.; Menne, F.; Rasyidi, E.S. Land Use Change, Urban Agglomeration, and Urban Sprawl: A Sustainable Development Perspective of Makassar City, Indonesia. Land 2021, 10, 556. [Google Scholar] [CrossRef]
  2. Salvati, L.; Ferrara, A.; Tombolini, I.; Gemmiti, R.; Colantoni, A.; Perini, L. Desperately Seeking Sustainability: Urban Shrinkage, Land Consumption and Regional Planning in a Mediterranean Metropolitan Area. Sustainability 2015, 7, 11980–11997. [Google Scholar] [CrossRef] [Green Version]
  3. Surya, B.; Ahmad, D.N.A.; Sakti, H.H.; Sahban, H. Land Use Change, Spatial Interaction, and Sustainable Development in the Metropolitan Urban Areas, South Sulawesi Province, Indonesia. Land 2020, 9, 95. [Google Scholar] [CrossRef] [Green Version]
  4. Egidi, G.; Cividino, S.; Quaranta, G.; Alhuseen, A.; Salvati, L. Land mismatches, urban growth and spatial planning: A contribution to metropolitan sustainability. Environ. Impact Assess. Rev. 2020, 84, 106439. [Google Scholar] [CrossRef]
  5. Dong, L.K.; Li, X. Evolution of Urban Construction Land Structure Based on Information Entropy and Shift-Share Model: An Empirical Study on Beijing-Tianjin-Hebei Urban Agglomeration in China. Sustainability 2022, 14, 1244. [Google Scholar] [CrossRef]
  6. Moreira, F.; Fontes, I.; Dias, S.; Silva, J.B.E.; Loupa-Ramos, I. Contrasting static versus dynamic-based typologies of land cover patterns in the Lisbon metropolitan area: Towards a better understanding of peri-urban areas. Appl. Geogr. 2016, 75, 49–59. [Google Scholar] [CrossRef]
  7. Kim, J.H. Crossing-over between land cover and land use: Exploring spatially varying relationships in two large US metropolitan areas. Appl. Geogr. 2015, 60, 37–45. [Google Scholar] [CrossRef] [Green Version]
  8. Salvati, L.; Tombolini, I.; Ippolito, A.; Carlucci, M. Land quality and the city: Monitoring urban growth and land take in 76 Southern European metropolitan areas. Environ. Plan. B-Urban Anal. City Sci. 2018, 45, 691–712. [Google Scholar] [CrossRef]
  9. Shrestha, M.K.; York, A.M.; Boone, C.G.; Zhang, S. Land fragmentation due to rapid urbanization in the Phoenix Metropolitan Area: Analyzing the spatiotemporal patterns and drivers. Appl. Geogr. 2012, 32, 522–531. [Google Scholar] [CrossRef]
  10. Lu, S.S.; Guan, X.L.; He, C.; Zhang, J.L. Spatio-Temporal Patterns and Policy Implications of Urban Land Expansion in Metropolitan Areas: A Case Study of Wuhan Urban Agglomeration, Central China. Sustainability 2014, 6, 4723–4748. [Google Scholar] [CrossRef] [Green Version]
  11. Lu, J.; Guldmann, J.M. Landscape ecology, land-use structure, and population density: Case study of the Columbus Metropolitan Area. Landsc. Urban Plan. 2012, 105, 74–85. [Google Scholar] [CrossRef]
  12. Mallinis, G.; Koutsias, N.; Arianoutsou, M. Monitoring land use/land cover transformations from 1945 to 2007 in two peri-urban mountainous areas of Athens metropolitan area, Greece. Sci. Total Environ. 2015, 490, 262–278. [Google Scholar] [CrossRef] [PubMed]
  13. Lo, C.P.; Yang, X.J. Drivers of land-use/land-cover changes and dynamic modeling for the Atlanta, Georgia Metropolitan Area. Photogramm. Eng. Remote Sens. 2022, 68, 1073–1082. [Google Scholar]
  14. Jiang, G.H.; Ma, W.Q.; Wang, D.Q.; Zhou, D.Y.; Zhang, R.J.; Zhou, T. Identifying the internal structure evolution of urban built-up land sprawl (UBLS) from a composite structure perspective: A case study of the Beijing metropolitan area, China. Land Use Policy 2017, 62, 258–267. [Google Scholar] [CrossRef]
  15. Galimberti, C. Nuevos procesos de expansión metropolitana: Incremento acelerado de suelo urbano en el Área Metropolitana de Rosario (1990–2010). Eure-Rev. Latinoam. Estud. Urbano Reg. 2021, 47, 51–71. [Google Scholar] [CrossRef]
  16. Yin, J.; Yin, Z.E.; Zhong, H.D.; Xu, S.Y.; Hu, X.M.; Wang, J.; Wu, J.P. Monitoring urban expansion and land use/land cover changes of Shanghai metropolitan area during the transitional economy (1979–2009) in China. Environ. Monit. Assess. 2011, 177, 609–621. [Google Scholar] [CrossRef]
  17. Shoman, W.; Korkutan, M.; Alganci, U.; Tanik, A.; Demirel, H. Dynamic Monitoring of Land Cover Change: A Recent Study for Istanbul Metropolitan Area. Fresenius Environ. Bull. 2019, 28, 688–693. [Google Scholar]
  18. Li, Z.C.; Gurgel, H.; Li, M.M.; Dessay, N.; Gong, P. Urban Land Expansion from Scratch to Urban Agglomeration in the Federal District of Brazil in the Past 60 Years. Int. J. Environ. Res. Public Health 2022, 19, 1032. [Google Scholar] [CrossRef]
  19. Toure, S.I.; Stow, D.A.; Clarke, K.; Weeks, J. Patterns of land cover and land use change within the two major metropolitan areas of Ghana. Geocarto Int. 2020, 35, 209–223. [Google Scholar] [CrossRef]
  20. Jagarnath, M.; Thambiran, T.; Gebreslasie, M. Modelling urban land change processes and patterns for climate change planning in the Durban metropolitan area, South Africa. J. Land Use Sci. 2019, 14, 81–109. [Google Scholar] [CrossRef]
  21. Dai, J.L.; Wang, K.Y.; Gao, X.L. Spatial Structure and Land Use Control in Extended Metropolitan Region of Zhujiang River Delta, China. Chin. Geogr. Sci. 2010, 20, 298–308. [Google Scholar] [CrossRef]
  22. Li, Z.; Jiang, W.G.; Wang, W.J.; Lei, X.; Deng, Y. Exploring spatial-temporal change and gravity center movement of construction land in the Chang-Zhu-Tan urban agglomeration. J. Geogr. Sci. 2019, 29, 1363–1380. [Google Scholar] [CrossRef] [Green Version]
  23. Cao, Y.H.; Liu, M.Y.; Cao, Y.D.; Chen, C.; Zhang, D.P. Change pattern and driving mechanism of construction land in China’s undertaking industrial transfer demonstration area: Taking the Wanjiang City Belt along the Yangtze River as an Example. Earth Sci. Res. J. 2020, 24, 215–223. [Google Scholar] [CrossRef]
  24. Mathan, M.; Krishnaveni, M. Monitoring spatio-temporal dynamics of urban and peri-urban land transitions using ensemble of remote sensing spectral indices-a case study of Chennai Metropolitan Area, India. Environ. Monit. Assess. 2020, 192, 15. [Google Scholar] [CrossRef]
  25. Wahyudi, A.; Liu, Y.; Corcoran, J. Combining Landsat and landscape metrics to analyse large-scale urban land cover change: A case study in the Jakarta Metropolitan Area. J. Spat. Sci. 2019, 64, 515–534. [Google Scholar] [CrossRef]
  26. Sigler, T.; Searle, G.; Martinus, K.; Tonts, M. Metropolitan land-use patterns by economic function: A spatial analysis of firm headquarters and branch office locations in Australian cities. Urban Geogr. 2016, 37, 416–435. [Google Scholar] [CrossRef]
  27. Sarzynski, A.; Galster, G.; Stack, L. Evolving United States metropolitan land use patterns. Urban Geogr. 2014, 35, 25–47. [Google Scholar] [CrossRef] [Green Version]
  28. Aguilera, F.; Valenzuela, L.M.; Botequilha-Leitao, A. Landscape metrics in the analysis of urban land use patterns: A case study in a Spanish metropolitan area. Landsc. Urban Plan. 2011, 99, 226–238. [Google Scholar] [CrossRef]
  29. Maimaitijiang, M.; Ghulam, A.; Sandoval, J.S.O.; Maimaitiyiming, M. Drivers of land cover and land use changes in St. Louis metropolitan area over the past 40 years characterized by remote sensing and census population data. Int. J. Appl. Earth Obs. Geoinf. 2015, 35, 161–174. [Google Scholar] [CrossRef]
  30. Wu, K.Y.; Zhang, H. Land use dynamics, built-up land expansion patterns, and driving forces analysis of the fast-growing Hangzhou metropolitan area, eastern China (1978–2008). Appl. Geogr. 2012, 34, 137–145. [Google Scholar] [CrossRef]
  31. Keys, E.; Wentz, E.A.; Redman, C.L. The spatial structure of land use from 1970–2000 in the Phoenix, Arizona, Metropolitan Area. Prof. Geogr. 2007, 59, 131–147. [Google Scholar] [CrossRef]
  32. Recanatesi, F.; Petroselli, A. Land Cover Change and Flood Risk in a Peri-Urban Environment of the Metropolitan Area of Rome (Italy). Water Resour. Manag. 2020, 34, 4399–4413. [Google Scholar] [CrossRef]
  33. Marull, J.; Cunfer, G.; Sylvester, K.; Tello, E. A landscape ecology assessment of land-use changes on the Great Plains-Denver (CO, USA) metropolitan edge. Reg. Environ. Change 2018, 18, 1765–1782. [Google Scholar] [CrossRef] [Green Version]
  34. Rojas, C.; Pino, J.; Basnou, C.; Vivanco, M. Assessing land-use and -cover changes in relation to geographic factors and urban planning in the metropolitan area of Concepcion (Chile). Implications for biodiversity conservation. Appl. Geogr. 2013, 39, 93–103. [Google Scholar] [CrossRef]
  35. Basnou, C.; Alvarez, E.; Bagaria, G.; Guardiola, M.; Isern, R.; Vicente, P.; Pino, J. Spatial Patterns of Land Use Changes Across a Mediterranean Metropolitan Landscape: Implications for Biodiversity Management. Environ. Manag. 2013, 52, 971–980. [Google Scholar] [CrossRef]
  36. Qiao, W.Y.; Guan, W.H.; Huang, X.J. Assessing the Potential Impact of Land Use on Carbon Storage Driven by Economic Growth: A Case Study in Yangtze River Delta Urban Agglomeration. Int. J. Environ. Res. Public Health 2021, 18, 11924. [Google Scholar] [CrossRef]
  37. Wang, X.; Che, L.; Zhou, L.; Xu, J.G. Spatio-temporal Dynamic Simulation of Land use and Ecological Risk in the Yangtze River Delta Urban Agglomeration, China. Chin. Geogr. Sci. 2021, 31, 829–847. [Google Scholar] [CrossRef]
  38. Hu, P.P.; Li, F.; Sun, X.; Liu, Y.L.; Chen, X.C.; Hu, D. Assessment of Land-Use/Cover Changes and Its Ecological Effect in Rapidly Urbanized Areas-Taking Pearl River Delta Urban Agglomeration as a Case. Sustainability 2021, 13, 5075. [Google Scholar] [CrossRef]
  39. Yang, Y.Y.; Bao, W.K.; Li, Y.H.; Wang, Y.S.; Chen, Z.F. Land Use Transition and Its Eco-Environmental Effects in the Beijing-Tianjin-Hebei Urban Agglomeration: A Production-Living-Ecological Perspective. Land 2020, 9, 285. [Google Scholar] [CrossRef]
  40. Darvishi, A.; Yousefi, M.; Marull, J. Modelling landscape ecological assessments of land use and cover change scenarios. Application to the Bojnourd Metropolitan Area (NE Iran). Land Use Policy 2020, 99, 105098. [Google Scholar] [CrossRef]
  41. Akubia, J.E.K.; Ahmed, A.; Bruns, A. Assessing How Land-Cover Change Associated with Urbanisation Affects Ecological Sustainability in the Greater Accra Metropolitan Area, Ghana. Land 2020, 9, 182. [Google Scholar] [CrossRef]
  42. Chen, Y.Z.; Lu, H.W.; Li, J.; Xia, J. Effects of land use cover change on carbon emissions and ecosystem services in Chengyu urban agglomeration, China. Stoch. Environ. Res. Risk Assess. 2020, 34, 1197–1215. [Google Scholar] [CrossRef]
  43. Qin, X.C.; Fu, B.H. Assessing and Predicting Changes of the Ecosystem Service Values Based on Land Use/Land Cover Changes with a Random Forest-Cellular Automata Model in Qingdao Metropolitan Region, China. IEEE J. Sel. Top. Appl. Earth Obs. Remote Sens. 2020, 13, 6484–6494. [Google Scholar] [CrossRef]
  44. Liu, W.; Zhan, J.Y.; Zhao, F.; Yan, H.M.; Zhang, F.; Wei, X.Q. Impacts of urbanization-induced land-use changes on ecosystem services: A case study of the Pearl River Delta Metropolitan Region, China. Ecol. Indic. 2019, 98, 228–238. [Google Scholar] [CrossRef]
  45. Mascarenhas, A.; Haase, D.; Ramon, T.B.; Santos, R. Pathways of demographic and urban development and their effects on land take and ecosystem services: The case of Lisbon Metropolitan Area, Portugal. Land Use Policy 2019, 82, 181–194. [Google Scholar] [CrossRef]
  46. Kim, H.; Hong, S. Relationship between Land-Use Type and Daily Concentration and Variability of PM10 in Metropolitan Cities: Evidence from South Korea. Land 2022, 11, 23. [Google Scholar] [CrossRef]
  47. Shairsingh, K.K.; Brook, J.R.; Mihele, C.M.; Evans, G.J. Characterizing long-term NO2 concentration surfaces across a large metropolitan area through spatiotemporal land use regression modelling of mobile measurements. Environ. Res. 2021, 196, 111010. [Google Scholar] [CrossRef]
  48. Dirgawati, M.; Barnes, R.; Wheeler, A.J.; Arnold, A.L.; McCaul, K.A.; Stuart, A.L.; Blake, D.; Hinwood, A.; Yeap, B.B.; Heyworth, J.S. Development of Land Use Regression models for predicting exposure to NO2 and NOx in Metropolitan Perth, Western Australia. Environ. Model. Softw. 2015, 74, 258–267. [Google Scholar] [CrossRef]
  49. Rahman, M.M.; Yeganeh, B.; Clifford, S.; Knibbs, L.D.; Morawska, L. Development of a land use regression model for daily NO2 and NOx concentrations in the Brisbane metropolitan area, Australia. Environ. Model. Softw. 2017, 95, 168–179. [Google Scholar] [CrossRef] [Green Version]
  50. Nautiyal, G.; Maithani, S.; Sharma, A. Exploring the Relationship Between Spatio-temporal Land Cover Dynamics and Surface Temperature Over Dehradun Urban Agglomeration, India. J. Indian Soc. Remote Sens. 2021, 49, 1307–1318. [Google Scholar] [CrossRef]
  51. Mallick, J.; Singh, V.P.; Almesfer, M.K.; Talukdar, S.; Alsubhi, M.; Ahmed, M.; Khan, R.A. Spatio-temporal analysis and simulation of land cover changes and their impacts on land surface temperature in urban agglomeration of Bisha Watershed, Saudi Arabia. Geocarto Int. 2021, 1–27. [Google Scholar] [CrossRef]
  52. Shen, Z.C.; Xu, X.L. Influence of the Economic Efficiency of Built-Up Land (EEBL) on Urban Heat Islands (UHIs) in the Yangtze River Delta Urban Agglomeration (YRDUA). Remote Sens. 2020, 12, 3944. [Google Scholar] [CrossRef]
  53. Callejas, I.J.A.; De Oliveira, A.S.; Santos, F.M.D.; Durante, L.C.; Nogueira, M.C.D.A.; Zeilhofer, P. Relationship between land use/cover and surface temperatures in the urban agglomeration of Cuiaba-Varzea Grande, Central Brazil. J. Appl. Remote Sens. 2011, 5, 053569. [Google Scholar] [CrossRef]
  54. Shahfahad; Naikoo, M.W.; Islam, A.M.T.; Mallick, J.; Rahman, A. Land use/land cover change and its impact on surface urban heat island and urban thermal comfort in a metropolitan city. Urban Clim. 2021, 41, 101052. [Google Scholar] [CrossRef]
  55. Chanu, C.S.; Elango, L.; Shankar, G.R. A geospatial approach for assessing the relation between changing land use/land cover and environmental parameters including land surface temperature of Chennai metropolitan city, India. Arab. J. Geosci. 2021, 14, 132. [Google Scholar] [CrossRef]
  56. Khamchiangta, D.; Dhakal, S. Future urban expansion and local climate zone changes in relation to land surface temperature: Case of Bangkok Metropolitan Administration, Thailand. Urban Clim. 2021, 37, 100835. [Google Scholar] [CrossRef]
  57. Adulkongkaew, T.; Satapanajaru, T.; Charoenhirunyingyos, S.; Singhirunnusorn, W. Effect of land cover composition and building configuration on land surface temperature in an urban-sprawl city, case study in Bangkok Metropolitan Area, Thailand. Heliyon 2020, 6, 04485. [Google Scholar] [CrossRef]
  58. Rousta, I.; Sarif, M.O.; Gupta, R.D.; Olafsson, H.; Ranagalage, M.; Murayama, Y.; Zhang, H.; Mushore, T.D. Spatiotemporal Analysis of Land Use/Land Cover and Its Effects on Surface Urban Heat Island Using Landsat Data: A Case Study of Metropolitan City Tehran (1988–2018). Sustainability 2019, 10, 4433. [Google Scholar] [CrossRef] [Green Version]
  59. Liu, Q.; Nai, L.L. Analysis on Control Objective of Construction Land in China Based on Decoupling Scene. J. Nan-Jing Agric. Univ. (Soc. Sci. Ed.) 2014, 14, 80–85. [Google Scholar]
  60. Mao, T.Y.; Pu, L.J. The decoupling of urbanization and economic growth in Jiangsu Province. Resour. Sci. 2017, 39, 1560–1572. [Google Scholar] [CrossRef] [Green Version]
  61. Zhang, Z.X.; Hu, B.Q.; Shi, K.F.; Su, K.C.; Yang, Q.Y. Exploring the dynamic, forecast and decoupling effect of land natural capital utilization in the hinterland of the Three Gorges Reservoir area, China. Sci. Total Environ. 2020, 718, 134832. [Google Scholar] [CrossRef]
  62. Shao, J.J.; Ge, J.F. Investigation into Relationship between Intensive Land Use and Urban Heat Island Effect in Shijiazhuang City Based on the Tapio Decoupling Theory. J. Urban Plan. Dev. 2020, 146, 04020043. [Google Scholar] [CrossRef]
  63. Li, Y.N.; Cai, M.M.; Wu, K.Y.; Wei, J.C. Decoupling analysis of carbon emission from construction land in Shanghai. J. Clean. Prod. 2019, 210, 25–34. [Google Scholar] [CrossRef]
  64. Zhou, M.; Hu, B.X. Decoupling of carbon emissions from agricultural land utilisation from economic growth in China. Agric. Econ.-Zemed. Ekon. 2020, 66, 510–518. [Google Scholar] [CrossRef]
  65. Lu, J.; Guldmann, J.M. Employment Distribution and Land-Use Structure in the Metropolitan Area of Columbus, Ohio. J. Urban. Plan. Dev. 2015, 141, 04014040. [Google Scholar] [CrossRef]
  66. Orcao, A.I.E.; Lopez, E.C.; Garcia, B.S.V.; Robles, A.L. Influence of Land Politics on Firms’ Location in Metropolitan Areas: The Case of Zaragoza. Scripta Nova. Revista Electrónica de Geografía y Ciencias Sociales. 2007. Available online: http://www.ub.edu/geocrit/sn/sn-240.htm (accessed on 14 April 2022).
  67. Lens, M.C.; Monkkonen, P. Do Strict Land Use Regulations Make Metropolitan Areas More Segregated by Income? J. Am. Plan. Assoc. 2016, 82, 6–21. [Google Scholar] [CrossRef] [Green Version]
  68. Wang, M.; Yang, Y.; Guo, T. Measurement of Urban–Rural Integration Level in Suburbs and Exurbs of Big Cities Based on Land-Use Change in Inland China: Chengdu. Land 2021, 10, 474. [Google Scholar] [CrossRef]
  69. Dadashpoor, H.; Azizi, P.; Moghadasi, M. Land use change, urbanization, and change in landscape pattern in a metropolitan area. Sci. Total Environ. 2019, 655, 707–719. [Google Scholar] [CrossRef]
  70. Liu, D.D.; Chen, N.C. Satellite Monitoring of Urban Land Change in the Middle Yangtze River Basin Urban Agglomeration, China between 2000 and 2016. Remote Sens. 2017, 9, 1086. [Google Scholar] [CrossRef] [Green Version]
  71. Valerio, Q.; Anna, B.; Francesco, C.; Diego, G.; Dalila, R.; Piermaria, C. Monitoring land take by point sampling: Pace and dynamics of urban expansion in the Metropolitan City of Rome. Landsc. Urban Plan. 2015, 143, 126–133. [Google Scholar] [CrossRef]
  72. Pokojska, P. Simulating land use change in the southern part of Warsaw Metropolitan Area with application of Dyna-CLUE model. Geografie 2019, 124, 57–82. [Google Scholar] [CrossRef]
  73. Sroka, W.; Mikolajczyk, J.; Wojewodzic, T.; Kwoczynska, B. Agricultural Land vs. Urbanisation in Chosen Polish Metropolitan Areas: A Spatial Analysis Based on Regression Trees. Sustainability 2018, 10, 837. [Google Scholar] [CrossRef] [Green Version]
  74. Sun, Y.H.; Yang, Z.Y.; Yu, X.Y.; Ding, W.W. Evaluating Sustainable Development of Land Resources in the Yangtze River Economic Belt of China. J. Glob. Inf. Manag. 2022, 30, 6. [Google Scholar] [CrossRef]
  75. Airiken, M.; Zhang, F.; Chan, N.W.; Kung, H.T. Assessment of spatial and temporal ecological environment quality under land use change of urban agglomeration in the North Slope of Tianshan, China. Environ. Sci. Pollut. Res. 2021, 29, 12282–12299. [Google Scholar] [CrossRef]
  76. Benito, P.R.; Cuevas, J.A.; de la Parra, R.B.; Prieto, F.; del Barrio, J.M.G.; Zavala, M.A. Land use change in a Mediterranean metropolitan region and its periphery: Assessment of conservation policies through CORINE Land Cover data and Markov models. For. Syst. 2011, 19, 315–328. [Google Scholar]
  77. Araki, S.; Shima, M.; Yamamoto, K. Spatiotemporal land use random forest model for estimating metropolitan NO2 exposure in Japan. Sci. Total Environ. 2018, 634, 1269–1277. [Google Scholar] [CrossRef]
  78. Deslatte, A.; Tavares, A.; Feiock, R.C. Policy of Delay: Evidence from a Bayesian Analysis of Metropolitan Land-Use Choices. Policy Stud. J. 2018, 46, 674–699. [Google Scholar] [CrossRef]
  79. Jimenez, A.A.; Vilchez, F.F.; Gonzalez, O.N.; Flores, S.M.L.M. Analysis of the Land Use and Cover Changes in the Metropolitan Area of Tepic-Xalisco (1973–2015) through Landsat Images. Sustainability 2018, 10, 1860. [Google Scholar] [CrossRef] [Green Version]
  80. Shen, Y.; Chen, G.N.; Martinez, L.M.; Silva, J.D.E. Bi-level cellular agent-based model: Simulation of potential impacts of high-speed rail on land cover change in the Lisbon Metropolitan Area, Portugal. J. Transport. Land Use 2015, 8, 151–180. [Google Scholar] [CrossRef]
  81. Geng, S.Y.; Ma, M.; Hu, X.K.; Yu, H.C. Multi-Scale Geographically Weighted Regression Modeling of Urban and Rural Construction Land Fragmentation-A Case Study of the Yangtze River Delta Region. IEEE Access 2022, 10, 7639–7652. [Google Scholar] [CrossRef]
  82. Liu, Y.; Cao, X.; Li, T. Identifying Driving Forces of Built-Up Land Expansion Based on the Geographical Detector: A Case Study of Pearl River Delta Urban Agglomeration. Int. J. Environ. Res. Public Health 2020, 5, 1759. [Google Scholar] [CrossRef] [Green Version]
  83. Feng, R.D.; Wang, F.Y.; Wang, K.Y.; Xu, S.J. Quantifying influences of anthropogenic-natural factors on ecological land evolution in mega-urban agglomeration: A case study of Guangdong-Hong Kong-Macao greater Bay area. J. Clean. Prod. 2021, 283, 125304. [Google Scholar] [CrossRef]
  84. Jun, M.J. A comparison of a gradient boosting decision tree, random forests, and artificial neural networks to model urban land use changes: The case of the Seoul metropolitan area. Int. J. Geogr. Inf. Sci. 2021, 35, 2149–2167. [Google Scholar] [CrossRef]
  85. Rahnama, M.R. Forecasting land-use changes in Mashhad Metropolitan area using Cellular Automata and Markov chain model for 2016–2030. Sustain. Cities Soc. 2021, 64, 102548. [Google Scholar] [CrossRef]
  86. Al-sharif, A.A.A.; Pradhan, B. Monitoring and predicting land use change in Tripoli Metropolitan City using an integrated Markov chain and cellular automata models in GIS. Arab. J. Geosci. 2014, 7, 4291–4301. [Google Scholar] [CrossRef]
  87. Osman, T.; Shaw, D.; Kenawy, E. An integrated land use change model to simulate and predict the future of greater Cairo metropolitan region. J. Land Use Sci. 2019, 13, 565–584. [Google Scholar] [CrossRef]
  88. Xiao, R.; Yu, X.Y.; Zhang, Z.H.; Wang, X. Built-up land expansion simulation with combination of naive Bayes and cellular automaton model-A case study of the Shanghai-Hangzhou Bay agglomeration. Growth Chang. 2021, 52, 1804–1825. [Google Scholar] [CrossRef]
  89. Al-shalabi, M.; Billa, L.; Pradhan, B.; Mansor, S.; Al-Sharif, A.A.A. Modelling urban growth evolution and land-use changes using GIS based cellular automata and SLEUTH models: The case of Sana’a metropolitan city, Yemen. Environ. Earth Sci. 2013, 70, 425–437. [Google Scholar] [CrossRef]
  90. Li, J.Z.; Ouyang, X.; Zhu, X. Land space simulation of urban agglomerations from the perspective of the symbiosis of urban development and ecological protection: A case study of Changsha-Zhuzhou-Xiangtan urban agglomeration. Ecol. Indic. 2021, 126, 107669. [Google Scholar] [CrossRef]
  91. Han, H.Y.; Huang, C.; Ahn, K.H.; Shu, X.F.; Lin, L.Y.; Qiu, D.R. The Effects of Greenbelt Policies on Land Development: Evidence from the Deregulation of the Greenbelt in the Seoul Metropolitan Area. Sustainability 2017, 9, 1259. [Google Scholar] [CrossRef] [Green Version]
  92. Guan, X.Y.; Wang, S.L.; Gao, Z.Y.; Lv, Y.; Fu, X.J. Spatio-temporal variability of soil salinity and its relationship with the depth to groundwater in salinization irrigation district. Acta Ecol. Sin. 2012, 32, 198–206. [Google Scholar]
  93. Zhang, P.; Li, W.; Zhao, K.; Zhao, S. Spatial Pattern and Driving Mechanism of Urban–Rural Income Gap in Gansu Province of China. Land 2021, 10, 1002. [Google Scholar] [CrossRef]
  94. Ruan, B.Q.; Xu, F.R.; Jiang, R.F. Analysis on spatial and temporal variability of groundwater level based on spherical sampling model. J. Hydraul. Eng. 2008, 39, 573–579. [Google Scholar]
  95. Zhao, S.; Zhao, K.; Zhang, P. Spatial Inequality in China’s Housing Market and the Driving Mechanism. Land 2021, 10, 841. [Google Scholar] [CrossRef]
  96. Miyamoto, S.; Chacon, A.; Hossain, M.; Martinez, L. Soil salinity of urban turf areas irrigated with saline water I. Spatial variability. Landsc. Urban Plan. 2005, 71, 233–241. [Google Scholar]
  97. She, D.L.; Shao, M.A.; Yu, S.G. Spatial Variability of Soil Water Content on a Cropland-grassland Mixed Slope Land in the Loess Plateau, China. Trans. Chin. Soc. Agric. Mach. 2010, 41, 57–63. [Google Scholar]
  98. Li, L.; Zhao, K.; Wang, X.; Zhao, S.; Liu, X.; Li, W. Spatio-Temporal Evolution and Driving Mechanism of Urbanization in Small Cities: Case Study from Guangxi. Land 2022, 11, 415. [Google Scholar] [CrossRef]
  99. Organization for Economic Cooperation and Development. Indicators to Measure Decoupling of Environmental Pressure and Economic Growth; OECD: Paris, France, 2002.
  100. Tapio, P. Towards a theory of decoupling: Degrees of decoupling in the EU and the case of road traffic in Finland between 1970 and 2001. Transp. Policy 2005, 12, 137–151. [Google Scholar] [CrossRef] [Green Version]
  101. Zhang, P.; Hu, J.; Zhao, K.; Chen, H.; Zhao, S.; Li, W. Dynamics and Decoupling Analysis of Carbon Emissions from Construction Industry in China. Buildings 2022, 12, 257. [Google Scholar] [CrossRef]
  102. Song, Y.; Sun, J.J.; Zhang, M.; Su, B. Using the Tapio-Z decoupling model to evaluate the decoupling status of China’s CO2 emissions at provincial level and its dynamic trend. Struct. Change Econ. Dyn. 2020, 52, 120–129. [Google Scholar] [CrossRef]
  103. Zhao, S.; Zhao, K.; Yan, Y.; Zhu, K.; Guan, C. Spatio-Temporal Evolution Characteristics and Influencing Factors of Urban Service-Industry Land in China. Land 2022, 11, 13. [Google Scholar] [CrossRef]
  104. Longhofer, W.; Jorgenson, A. Decoupling reconsidered: Does world society integration influence the relationship between the environment and economic development? Soc. Sci. Res. 2017, 65, 17–29. [Google Scholar] [CrossRef]
  105. Wang, H.; Xia, S.; Zhang, Q.; Zhang, P. Has China’s Construction Waste Change Been Decoupled from Economic Growth? Buildings 2022, 12, 147. [Google Scholar] [CrossRef]
  106. Ouyang, D.; Zhu, X.; Liu, X.; He, R.; Wan, Q. Spatial Differentiation and Driving Factor Analysis of Urban Construction Land Change in County-Level City of Guangxi, China. Land 2021, 10, 691. [Google Scholar] [CrossRef]
  107. Carruthers, J.I.; Mulligan, G.F. Land absorption in US metropolitan areas: Estimates and projections from regional adjustment models. Geogr. Anal. 2007, 39, 78–104. [Google Scholar] [CrossRef]
  108. Han, H.L.; Li, H. Coupling Coordination Evaluation between Population and Land Urbanization in Ha-Chang Urban Agglomeration. Sustainability 2020, 12, 357. [Google Scholar] [CrossRef] [Green Version]
  109. Tomao, A.; Mattioli, W.; Fanfani, D.; Ferrara, C.; Quaranta, G.; Salvia, R.; Salvati, L. Economic Downturns and Land-Use Change: A Spatial Analysis of Urban Transformations in Rome (Italy) Using a Geographically Weighted Principal Component Analysis. Sustainability 2021, 13, 11293. [Google Scholar] [CrossRef]
  110. Du, D.N. The causal relationship between land urbanization quality and economic growth: Evidence from capital cities in China. Qual. Quant. 2017, 51, 2707–2723. [Google Scholar] [CrossRef]
  111. Cheng, J.; Zhao, J.M.; Zhu, D.L.; Zhang, H. Limits of Land Capitalization and Its Economic Effects: Evidence from China. Land 2022, 10, 1346. [Google Scholar] [CrossRef]
  112. Huang, D.X.; Chan, R.C.K. On ‘Land Finance’ in urban China: Theory and practice. Habitat Int. 2018, 75, 96–104. [Google Scholar] [CrossRef]
  113. Sperandelli, D.I.; Dupas, F.A.; Pons, N.A.D. Dynamics of Urban Sprawl, Vacant Land, and Green Spaces on the Metropolitan Fringe of Sao Paulo, Brazil. J. Urban Plan. Dev. 2013, 139, 274–279. [Google Scholar] [CrossRef]
  114. Cutsinger, J.; Galster, G.; Wolman, H.; Hanson, R.; Towns, D. Verifying the multi-dimensional nature of metropolitan land use: Advancing the understanding and measurement of sprawl. J. Urban Aff. 2005, 27, 235–259. [Google Scholar] [CrossRef]
  115. Geymen, A.; Baz, I. Monitoring urban growth and detecting land-cover changes on the Istanbul metropolitan area. Environ. Monit. Assess. 2008, 136, 449–459. [Google Scholar] [CrossRef]
  116. Asabere, S.B.; Acheampong, R.A.; Ashiagbor, G.; Beckers, S.C.; Keck, M.; Erasmi, S.; Schanze, J.; Sauer, D. Urbanization, land use transformation and spatio-environmental impacts: Analyses of trends and implications in major metropolitan regions of Ghana. Land Use Policy 2020, 96, 104707. [Google Scholar] [CrossRef]
  117. Ouyang, X.; Zhu, X.; He, Q.Y. Study of Spatio-temporal Pattern and Driving Mechanism of Urban Land Expansion in Urban Agglomeration: A Case Study of the Changsha-Zhuzhou-Xiangtan Urban Agglomeration. Resour. Environ. Yangtze Basin 2020, 29, 1298–1309. [Google Scholar] [CrossRef]
  118. Li, P.X.; Cao, H. Simulating Uneven Urban Spatial Expansion under Various Land Protection Strategies: Case Study on Southern Jiangsu Urban Agglomeration. ISPRS Int. J. Geo-Inf. 2019, 8, 521. [Google Scholar] [CrossRef] [Green Version]
  119. Li, X.W.; Liang, C.; Shi, J.B.; Li, M.D. Spatiotemporal Dynamics and Urban Land-Use Transformation in the Rapid Urbanization of the Shanghai Metropolitan Area in the 1980s–2000s. J. Environ. Inform. 2012, 20, 103–114. [Google Scholar] [CrossRef]
  120. Xue, Q.R.; Yang, X.H.; Wu, F.F. A three-stage hybrid model for the regional assessment, spatial pattern analysis and source apportionment of the land resources comprehensive supporting capacity in the Yangtze River Delta urban agglomeration. Sci. Total Environ. 2020, 711, 134428. [Google Scholar] [CrossRef]
  121. Ren, X.Y.; He, Y.F.; Wang, Z.M. Spatial-temporal characteristics of construction land expansion and occupation of cultivated land in urban agglomeration of central and southern Liaoning Province based on Remote Sensing. Remote Sens. Land Resour. 2020, 32, 98–105. [Google Scholar] [CrossRef]
  122. Zhang, Y.S.; Feng, Y.F.; Guo, G.H.; Wang, F.; Cai, S.R. The Spatio-temporal Characteristics of Construction Land Expansion in China’s Typical Urban Agglomerations in Recent 30 years: A Case Study of the Beijing-Tianjin-Hebei Urban Agglomeration and the Guangdong-Hong Kong—Macao Greater Bay Area. J. South. China Norm. Univ. (Nat. Sci. Ed.) 2022, 54, 79–90. [Google Scholar] [CrossRef]
  123. Akubia, J.E.K.; Bruns, A. Unravelling the Frontiers of Urban Growth: Spatio-Temporal Dynamics of Land-Use Change and Urban Expansion in Greater Accra Metropolitan Area, Ghana. Land 2019, 8, 131. [Google Scholar] [CrossRef] [Green Version]
  124. Tang, C.C.; Li, Y.P. Geo-information Tupu process of land use/cover change in polycentric urban agglomeration: A case study of Changsha-Zhuzhou-Xiangtan urban agglomeration. Geogr. Res. 2020, 39, 2626–2641. [Google Scholar] [CrossRef]
  125. Ma, X.; He, S.M.; Huang, T.T.; Wang, Y. Analysis of Spatial-Temporal Pattern Characteristics and Driving Factors of Urban Land Expansion: Taking Central Plains City Cluster as an Example. Ecol. Econ. 2020, 36, 105–111. [Google Scholar]
  126. Duan, L.Q.; Chen, W.X.; Wang, N.N.; Fan, C.S.; Liang, L.T. Analysis on Difference of Construction Land Expansion Pattern Based on Bayesian Spatio-temporal Model: Taking Yangtze River Delta and Central Plains Urban Agglomeration as Examples. Areal Res. Dev. 2021, 40, 168–174. [Google Scholar] [CrossRef]
  127. Liu, Y.L.; Cai, E.X.; Jing, Y.; Gong, J.; Wang, Z.Y. Analyzing the Decoupling between Rural-to-Urban Migrants and Urban Land Expansion in Hubei Province, China. Sustainability 2018, 10, 345. [Google Scholar] [CrossRef] [Green Version]
  128. Li, M.; Shi, Y.Y.; Duan, W.K.; Chen, A.Q.; Wang, N.; Hao, J.M. Spatiotemporal Decoupling of Population, Economy and Construction Land Changes in Hebei Province. Sustainability 2019, 11, 6794. [Google Scholar] [CrossRef] [Green Version]
  129. Wang, C.C.; Liu, Y.F.; Kong, X.S.; Li, J.W. Spatiotemporal Decoupling between Population and Construction Land in Urban and Rural Hubei Province. Sustainability 2017, 9, 1258. [Google Scholar] [CrossRef] [Green Version]
  130. Xiao, R.; Huang, X.; Yu, W.X.; Lin, M.; Zhang, Z.H. Interaction Relationship Between Built-Up Land Expansion and Demographic-Social-Economic Urbanization in Shanghai-Hangzhou Bay Metropolitan Region of Eastern China. Photogramm. Eng. Remote Sens. 2019, 85, 231–240. [Google Scholar] [CrossRef]
  131. Li, Y.H.; Zhang, Q. Human-environment interactions in China: Evidence of land-use change in Beijing-Tianjin-Hebei Metropolitan Region. Hum. Ecol. Rev. 2014, 20, 26–35. [Google Scholar]
  132. Hu, H.B.; Wu, L.Y.; Zhan, Y.L.; Zhang, S.H. Spatial and Temporal Pattern Analysis of Land Use in Yangtze River Delta Based on Remote Sensing and GIS in Intelligent Environment. Adv. Civil. Eng. 2021, 2021, 5561977. [Google Scholar] [CrossRef]
  133. Huang, L.J.; Yang, P.; Zhang, B.Q.; Hu, W.Y. Spatio-Temporal Coupling Characteristics and the Driving Mechanism of Population-Land-Industry Urbanization in the Yangtze River Economic Belt. Land 2021, 10, 400. [Google Scholar] [CrossRef]
  134. Wu, X.Y.; Yang, S.; Yin, S.G.; Xu, H.Z.Y. Spatial-temporal Dynamic Characteristics and Its Driving Mechanism of Urban Built-Up Area in Yangtze River Delta based on GTWR Model. Resour. Environ. Yangtze Basin 2021, 30, 2594–2606. [Google Scholar] [CrossRef]
  135. Marshall, J.D. Urban land area and population growth: A new scaling relationship for metropolitan expansion. Urban. Stud. 2007, 44, 1889–1904. [Google Scholar] [CrossRef]
  136. Zhao, C.J.; Wu, Y.M.; Ye, X.Y.; Wu, B.J.; Kudva, S. The direct and indirect drag effects of land and energy on urban economic growth in the Yangtze River Delta, China. Environ. Dev. Sustain. 2020, 21, 2945–2962. [Google Scholar] [CrossRef]
  137. Rienow, A.; Kantakumar, L.N.; Ghazaryan, G.; Droge-Rothaar, A.; Sticksel, S.; Trampnau, B.; Thonfeld, F. Modelling the spatial impact of regional planning and climate change prevention strategies on land consumption in the Rhine-Ruhr Metropolitan Area 2017–2030. Landsc. Urban. Plan. 2022, 217, 104284. [Google Scholar] [CrossRef]
  138. Gao, X.W.; Liu, T.; Cao, G.Z. On the Influencing Factors of Metropolitan and Non-Metropolitan Urban Land Expansion in Yangtze Delta Region. Hum. Geogr. 2012, 126, 88–93. [Google Scholar] [CrossRef]
  139. Zhu, C.M.; Zhang, X.L.; Wang, K.; Yuan, S.F.; Yang, L.X.; Skitmore, M. Urban-rural construction land transition and its coupling relationship with population flow in China’s urban agglomeration region. Cities 2020, 101, 102701. [Google Scholar] [CrossRef]
  140. Kinuthia, H.; Majale, C.; Letema, S. Influence of public policy planning on peri-urban land speculation in (Greater) Eastern Bypass in Nairobi Metropolitan. Land Use Policy 2021, 107, 105515. [Google Scholar] [CrossRef]
  141. Pawe, C.K.; Saikia, A. Unplanned urban growth: Land use/land cover change in the Guwahati Metropolitan Area, India. Geogr. Tidsskr.-Dan. J. Geogr. 2018, 118, 88–100. [Google Scholar] [CrossRef]
  142. Jain, M.; Pallagst, K. Land Use Beyond Control How fragmented governance created sprawl in the Delhi Metropolitan Area. DISP 2015, 51, 29–43. [Google Scholar] [CrossRef]
  143. Colavitti, A.M.; Serra, S. The Role Role of Regulation in the Land-Take Control. the Italian Case of the Metropolitan City of Cagliari. Land Use Policy 2019, 83, 270–281. [Google Scholar] [CrossRef]
  144. Pendall, R.; Wegmann, J.; Martin, J.; Wei, D.H. The Growth of Control? Changes in Local Land-Use Regulation in Major US Metropolitan Areas From 1994 to 2003. Hous. Policy Debate 2018, 28, 901–919. [Google Scholar] [CrossRef]
  145. Pendall, R.; Puentes, R. Land-use regulations as territorial governance in US metropolitan areas. Boletín de la Asociación de Geógrafos Españoles 2008, 46, 181–206. [Google Scholar]
  146. Wilson, S.A.; Wilson, C.O. Land Use/Land Cover Planning Nexus: A Space-Time Multi-Scalar Assessment of Urban Growth in the Tulsa Metropolitan Statistical Area. Hum. Ecol. 2017, 44, 731–750. [Google Scholar] [CrossRef]
  147. Ioja, C.L.; Nita, M.R.; Vanau, G.O.; Onose, D.A.; Gavrilidis, A.A. Using multi-criteria analysis for the identification of spatial land-use conflicts in the Bucharest Metropolitan Area. Ecol. Indic. 2014, 42, 112–121. [Google Scholar] [CrossRef]
  148. Badia, A.; Cebollada, A.; Vera, A.; Gisbert, M.; Mendizabal, E.; Tulla, A.F. Land occupation in a municipality of the Metropolitan Region of Barcelona: Challenges and opportunities. Boletín de la Asociación de Geógrafos Españoles 2021, 89. [Google Scholar] [CrossRef]
  149. Shu, H.; Xiong, P.P. Reallocation planning of urban industrial land for structure optimization and emission reduction: A practical analysis of urban agglomeration in China’s Yangtze River Delta. Land Use Policy 2019, 81, 604–623. [Google Scholar] [CrossRef]
  150. Abrantes, P.; Fontes, I.; Gomes, E.; Rocha, J. Compliance of land cover changes with municipal land use planning: Evidence from the Lisbon metropolitan region (1990–2007). Land Use Policy 2016, 51, 120–134. [Google Scholar] [CrossRef]
  151. Lee, J.; Jung, S. Industrial land use planning and the growth of knowledge industry: Location pattern of knowledge-intensive services and their determinants in the Seoul metropolitan area. Land Use Policy 2020, 95, 104632. [Google Scholar] [CrossRef]
  152. Li, W.; Zhang, Z.W.; Zhou, Y. Policy Strategies to Revive Rural Land in Peri-Metropolitan Towns: Resource Identification, Capitalization, and Financialization. Land 2021, 10, 132. [Google Scholar] [CrossRef]
  153. Kline, J.D.; Thiers, P.; Ozawa, C.P.; Yeakley, J.A.; Gordon, S.N. How well has land-use planning worked under different governance regimes? A case study in the Portland, OR-Vancouver, WA metropolitan area, USA. Landsc. Urban. Plan. 2014, 131, 51–63. [Google Scholar] [CrossRef] [Green Version]
  154. Jun, M.J. Forecasting urban land-use demand using a metropolitan input-output model. Environ. Plan. A 2005, 37, 1311–1328. [Google Scholar] [CrossRef]
  155. Tang, Y.; Yuan, Y.B.; Zhong, Q.Y. Evaluation of Land Comprehensive Carrying Capacity and Spatio-Temporal Analysis of the Harbin-Changchun Urban Agglomeration. Int. J. Environ. Res. Public Health 2021, 18, 521. [Google Scholar] [CrossRef] [PubMed]
  156. Xiong, Y.; Chen, Y.; Peng, F.; Li, J.Z.; Yan, X.J. Analog simulation of urban construction land supply and demand in Chang-Zhu-Tan Urban Agglomeration based on land intensive use. J. Geogr. Sci. 2019, 29, 1346–1362. [Google Scholar] [CrossRef] [Green Version]
  157. Peng, J.; Liu, Q.H.; Blaschke, T.; Zhang, Z.M.; Liu, Y.X.; Hu, Y.N.; Wang, M.; Xu, Z.H.; Wu, J.S. Integrating land development size, pattern, and density to identify urban-rural fringe in a metropolitan region. Landsc. Ecol. 2020, 35, 2045–2059. [Google Scholar] [CrossRef]
  158. Tao, Z.; Jiang, G.H.; Li, G.Y.; Zhou, D.Y.; Qu, Y.B. Neglected idle rural residential land (IRRL) in metropolitan suburbs: Spatial differentiation and influencing factors. J. Rural. Stud. 2020, 78, 163–175. [Google Scholar] [CrossRef]
Figure 1. Study area.
Sustainability 14 06204 g001
Figure 2. Research steps.
Sustainability 14 06204 g002
Figure 3. Analysis on the spatial clustering of urban construction land scale in YRDUA.
Sustainability 14 06204 g003
Figure 4. Analysis on the spatial clustering of urban construction land change in YRDUA.
Sustainability 14 06204 g004
Figure 5. Analysis on the evolution model of urban construction land in YRDUA.
Sustainability 14 06204 g005
Figure 6. Analysis on the types and changes of decoupling between construction land and resident population in YRDUA.
Sustainability 14 06204 g006
Figure 7. Analysis on the types and changes of decoupling between construction land and gross domestic product in YRDUA.
Sustainability 14 06204 g007
Figure 8. Analysis on the types and changes of decoupling between construction land and government revenue in YRDUA.
Sustainability 14 06204 g008
Figure 9. Analysis on the types and changes of final decoupling result in YRDUA.
Sustainability 14 06204 g009
Figure 10. Analysis on the differentiated policy area of YRDUA.
Sustainability 14 06204 g010
Table 1. Decoupling type and Decoupling indicator range.
Decoupling Type Δ α Δ β γ Value
DecouplingStrong≤0≥0≤0Best state, where economic growth is accompanied by reduced carbon emissions, with quantity decrease and quantity increase
Weak>0>0(0,0.8]Second best, where economic growth is greater than land use growth, with increase in both quantity and quantity
Recessive<0<0(1.2, +∞)Negative growth, where the land use deceleration is greater than economic slowdown, with quantitative decrease and optimization
CouplingExpansive>0>0(0.8,1.2]Land use and economic growth are largely synchronized, with incremental expansion
Recessive<0<0(0.8,1.2]Land use and the economy have largely declined in tandem, with contracting shrinkage
Negative DecouplingStrong>0<0<0Worst state, where the economy slows down while land use grows, with quantity increase but quality decrease
Weak<0<0(0,0.8]Second worst, where economic deceleration is greater than that of land use, with decrease in both quantity and quality
Expansive>0>0(1.2, +∞)Economic growth is less than that of land use, with incremental inefficiency
Table 2. Description and analysis of index system.
No.IndexSource
1Urban Construction LandChina Urban Construction Statistical Yearbook
2Resident PopulationChina City Statistical Yearbook, and Statistical Yearbooks of Shanghai, Jiangsu, Zhejiang, Anhui provinces
3Gross Domestic Product
4Government Revenue
Table 3. Analysis on spatial heterogeneity parameters of urban construction land in YRDUA.
Parameter2011201220132014201520162017201820192020
Max2900.492904.252915.562915.562915.561913.301910.741899.041944.961944.96
Min32.4635.3235.3636.6937.1837.1838.5539.5441.4642.35
Mean215.47220.86230.50236.60239.80221.72226.30227.18233.98242.35
CV2.082.031.961.911.881.401.371.361.361.32
GI0.570.570.560.550.550.500.490.490.490.48
Table 4. Analysis on spatial heterogeneity parameters of urban construction land in YRDUA.
Indicator2011–20152016–20202011–2020
Relative share (%)0.080.120.12
Growth rate (%)4.202.833.31
Table 5. Statistical analysis of decoupling results in different dimensions.
DecouplingCouplingNegative Decoupling
StrongWeakRecessiveExpansiveRecessiveExpansiveWeakStrong
2011–2015RP381402104
GDP432030200
GR432020300
FDR381402104
2016–2020RP482501606
GDP632020100
GR424121603
FDR372511508
Notes: RP, GDP, GR, FDR stands for Resident Population, Gross Domestic Product, Government Revenue, Final Decoupling Result.
Publisher’s Note: MDPI stays neutral with regard to jurisdictional claims in published maps and institutional affiliations.

