1. Introduction
1.1. Background Information
Microgeneration is a form of energy generation that aims to meet the energy needs of individuals and small-scale companies. If these segments are too far from the grid, energy costs increase significantly. In microgeneration systems, there is proximity to the end consumer. This situation, which increases energy efficiency, is considered the most important advantage of microgeneration systems. In addition, microgeneration systems cover both heat and electrical energy production [
1]. This issue also contributes to a more efficient energy production process. Moreover, microgeneration energy systems also help to increase the use of clean energy [
2,
3]. This issue allows a reduction in the carbon emission problem that threatens the environment significantly. Therefore, for microgeneration energy technology investments to be sustainable, their performance should be increased.
In this context, it is important to determine the main factors affecting the performance of these investments with a detailed analysis. Ease of installation is a significant factor for performance measurement. Efficiency in the process is decreased and extra costs are created when installation is not easy. Environmental compliance is another factor because each energy alternative may not be suitable for all geographies. The frequency of maintenance also plays a key role in the performance measurement of microgeneration energy investments since it creates extra costs for the investors [
3]. Cost effectiveness is also an important variable in the performance of these investments. In this context, owing to technological developments, costs of these projects can be managed more effectively.
The renewable energy alternatives preferred in microgeneration systems are also important in the performance analysis of these investments. Small-scale wind turbines can be preferred in this regard. Because they are smaller than typical wind turbines, they can be used on the roofs of buildings. This alternative is appropriate for regions that can obtain high amounts of wind. Similarly, in photovoltaic systems, small-scale solar panels can be built on roofs. However, energy generation from both small-scale wind turbines and solar panels is affected by climate conditions [
4]. Micro hydroelectric power is another alternative for this situation; however, there should be flowing water near the building. In summary, all renewable energy alternatives have both benefits and drawbacks. Thus, for the high performance of microgeneration projects, it is necessary to choose the most accurate renewable energy alternative with a comprehensive analysis.
1.2. Literature Evaluation
Researchers regard the subject of performance measurement factors in microgeneration technology investment performance as important. In this framework, cost efficiency is stated as an important indicator. For the sustainability of these projects, profitability conditions should be provided [
4]. Otherwise, despite the positive impacts on the environment, the investors will prefer not to focus on these projects [
5]. For this purpose, technological developments can contribute to cost reduction so that investors follow the recent trends in microgeneration energy technologies [
6]. Pearce and Slade [
7] focused on the effectiveness of microgeneration energy technology investments. They discussed that cost effectiveness is a key issue to increase the performance of these projects. For this situation, they identified that tax advantages should be provided for the investors to overcome this problem. Gabderakhmanova and Popel [
8] evaluated photovoltaic microgeneration systems in the Russian federation. They made a detailed competitive analysis and concluded that cost-efficiency should be provided to increase these projects. Saleme et al. [
9] examined the Brazilian energy market. They claimed that for the improvement of photovoltaic microgeneration, costs should be minimized.
The installation of microgeneration energy systems should be very easy. Microgeneration energy projects can be established with different types of energy. However, not every type of energy is easy to install. Small-scale solar panels and wind turbines can be built on the roofs of buildings. This ease of installation means microgeneration technology investment systems can be improved [
10]. However, for the establishment of micro hydropower, there should be flowing water near the property. Additionally, micro hydropower systems need a turbine and a pump [
11]. These difficulties create some barriers for the development of these systems. Karytsas [
12] examined the motivational factors behind microgeneration systems in Greece. They identified that energy systems should be easy to install. Bao et al. [
13] focused on the key factors in micro solar systems. They claimed that a difficult installation process leads to some barriers regarding the improvement of these systems.
The frequency of maintenance is another significant issue that affects the performance of microgeneration investments. With respect to the sustainability of these projects, they should be profitable [
14]. In this context, the costs of these investments should be minimized. However, frequent maintenance leads to increased costs [
15]. Therefore, because of this problem, investors will panic, and this will hinder the development of microgeneration projects. Hence, to increase the performance of microgeneration energy technology projects, an energy alternative with a low-maintenance frequency can be selected. Virupaksha et al. [
6] examined solar photovoltaic-based microgeneration systems in Ireland. They discussed that frequency of maintenance has a negative influence on the effectiveness of these systems. Su et al. [
11] evaluated renewable microgeneration technologies in Lithuania. They reached the conclusion that maintenance costs should be taken into consideration in these systems.
Technological development also plays an essential role with respect to the performance improvement of microgeneration energy investments. Microgeneration systems consider renewable energy types that contain complex processes [
16]. As a result of this issue, investors should have the necessary technological developments. Some recent developments in energy technologies can decrease costs [
17]. This situation provides important advantages for the efficiency of these projects. Aquila et al. [
18] analyzed small-scale solar microgeneration systems in Brazil. They claimed that investors should have sufficient technological improvements. Piterou and Coles [
19] evaluated decentralized renewable energy projects. They identified that technological development is a crucial performance measurement indicator in microgeneration energy investments. Zhang et al. [
20] assessed renewable microgeneration technologies and reached similar findings.
1.3. The Purpose and Novelty of This Study
Literature evaluations demonstrate that different issues have a significant influence on the performance of microgeneration technology investments. However, for the effectiveness of these projects, more important determinants should be identified. For this purpose, a new study is needed that makes a prioritization analysis regarding performance measurement indicators. Key performance indicators and appropriate renewable energy alternatives are evaluated in this manuscript which considers the effectiveness of microgeneration energy technology investments.
Key performance indicators and appropriate renewable energy alternatives are examined in microgeneration energy technology investments. In this scope, a model is generated that consists of two stages. Firstly, selected criteria are weighted using a SWARA. Additionally, technology investment alternatives are ranked using TOPSIS. In this process, q-ROFSs and the golden cut are taken to consideration. Additionally, comparative evaluations are performed with IFSs and PFSs to check the validity of the findings. Analysis results provide critical information for microgeneration technology investors. Hence, the efficiency of these projects can be increased so that carbon emission problems can be reduced with the help of clean energy consumption.
The proposed model has some advantages when compared with similar models in the literature. There are limited studies in which the degrees in the analysis process are calculated by considering the golden cut. Similarly, SWARA is extended, in this study, to M-SWARA to reach more precise findings. These issues contribute to the methodological originality of this study. Moreover, the SWARA method is used for weighting items to increase objectivity. Additionally, because q-ROFSs are the extension of both IFSs and PFSs, they become helpful to minimize uncertainty in this respect [
21,
22,
23]. The TOPSIS method also has some benefits over similar techniques. For instance, in some models, only the positive ideal solution is considered [
24,
25]. However, the TOPSIS method also uses negative ideal solutions, contributing to more accurate results [
26].
2. Materials and Methods
Microgeneration energy systems contribute to the use of clean energy so that carbon emission problems can be minimized. Within this framework, a detailed evaluation should be carried out to understand key performance indicators of these systems. This situation helps to achieve sustainability of these investments. However, all renewable energy alternatives have both benefits and drawbacks. Thus, for the high performance of microgeneration projects, it is necessary to choose the most accurate renewable energy alternative with a comprehensive analysis. Therefore, there is a need for a new study which makes a prioritization analysis regarding performance measurement indicators. In this study, a hybrid fuzzy decision-making model is created to solve these problems. This part explains q-ROFs, M-SWARA, and TOPSIS, with the golden cut.
2.1. q-ROFs with the Golden Cut
Atanassov [
27] generated IFSs by using both membership (
and non-membership (
) degrees. In this context, it aims to provide precise solutions. These sets are demonstrated in Equation (1). The required condition of these sets is stated as
.
PFSs is created as a generalization of IFSs with new degrees (
and
[
28]. Equation (2) represents these sets.
In this process, the condition in Equation (3) must be fulfilled.
q-ROFSs are created by the extension of IFSs to manage uncertainty more appropriately by using new grades (
,
). Equation (4) gives information about these sets [
29].
Equation (5) includes the required condition.
Equation (6) includes indeterminacy degree.
Computational details are shown in Equations (7)–(10).
Defuzzification is performed with Equation (11).
In this study, the degrees are defined with the golden cut to make more effective examinations [
30]. Equation (12) indicates the details where
and
represents the golden cut. Additionally, a and b demonstrate large and small quantities.
Equation (13) states the algebraic form:
The degrees obtained from the golden cut (
and
) are given in Equation (14).
Additionally, q-ROFSs are defined with the degrees obtained by the golden cut as in Equations (15) and (16).
2.2. M-SWARA with q-ROFSs
Keršuliene et al. [
31] generated a SWARA for finding the weights of the items by considering hierarchical priorities of the experts. SWARA is extended in this study by the name of multi-SWARA (M-SWARA) to obtain better results. In this process, evaluations are taken from the experts so that a decision matrix is created as in Equation (17).
Next, q-ROFSs and score functions are defined with Equations (5) and (11). Later,
,
,
, and
values are computed by Equations (18)–(20).
;
Comparative importance rate is shown as sj whereas the coefficient value is stated as . Additionally, recalculated weight is given as while indicates the criteria weights under the q-ROFNs. Additionally, stable values are identified by transposing and limiting the matrix to the power of 2t + 1.
2.3. TOPSIS with q-ROFSs
The TOPSIS ranks alternatives by importance. In this study, this technique is extended with q-ROFSs. After providing the evaluations, a decision matrix is constructed as in Equation (21) [
26].
Next, Equation (22) is used to normalize this matrix.
Weighted values are computed as in Equation (23).
Equations (24) and (25) include the computation of the positive (
) and negative (
) solutions.
Distances to the best (
) and worst (
) alternatives are identified by Equations (26) and (27).
Relative closeness (
) is defined with Equation (28).
3. Analysis
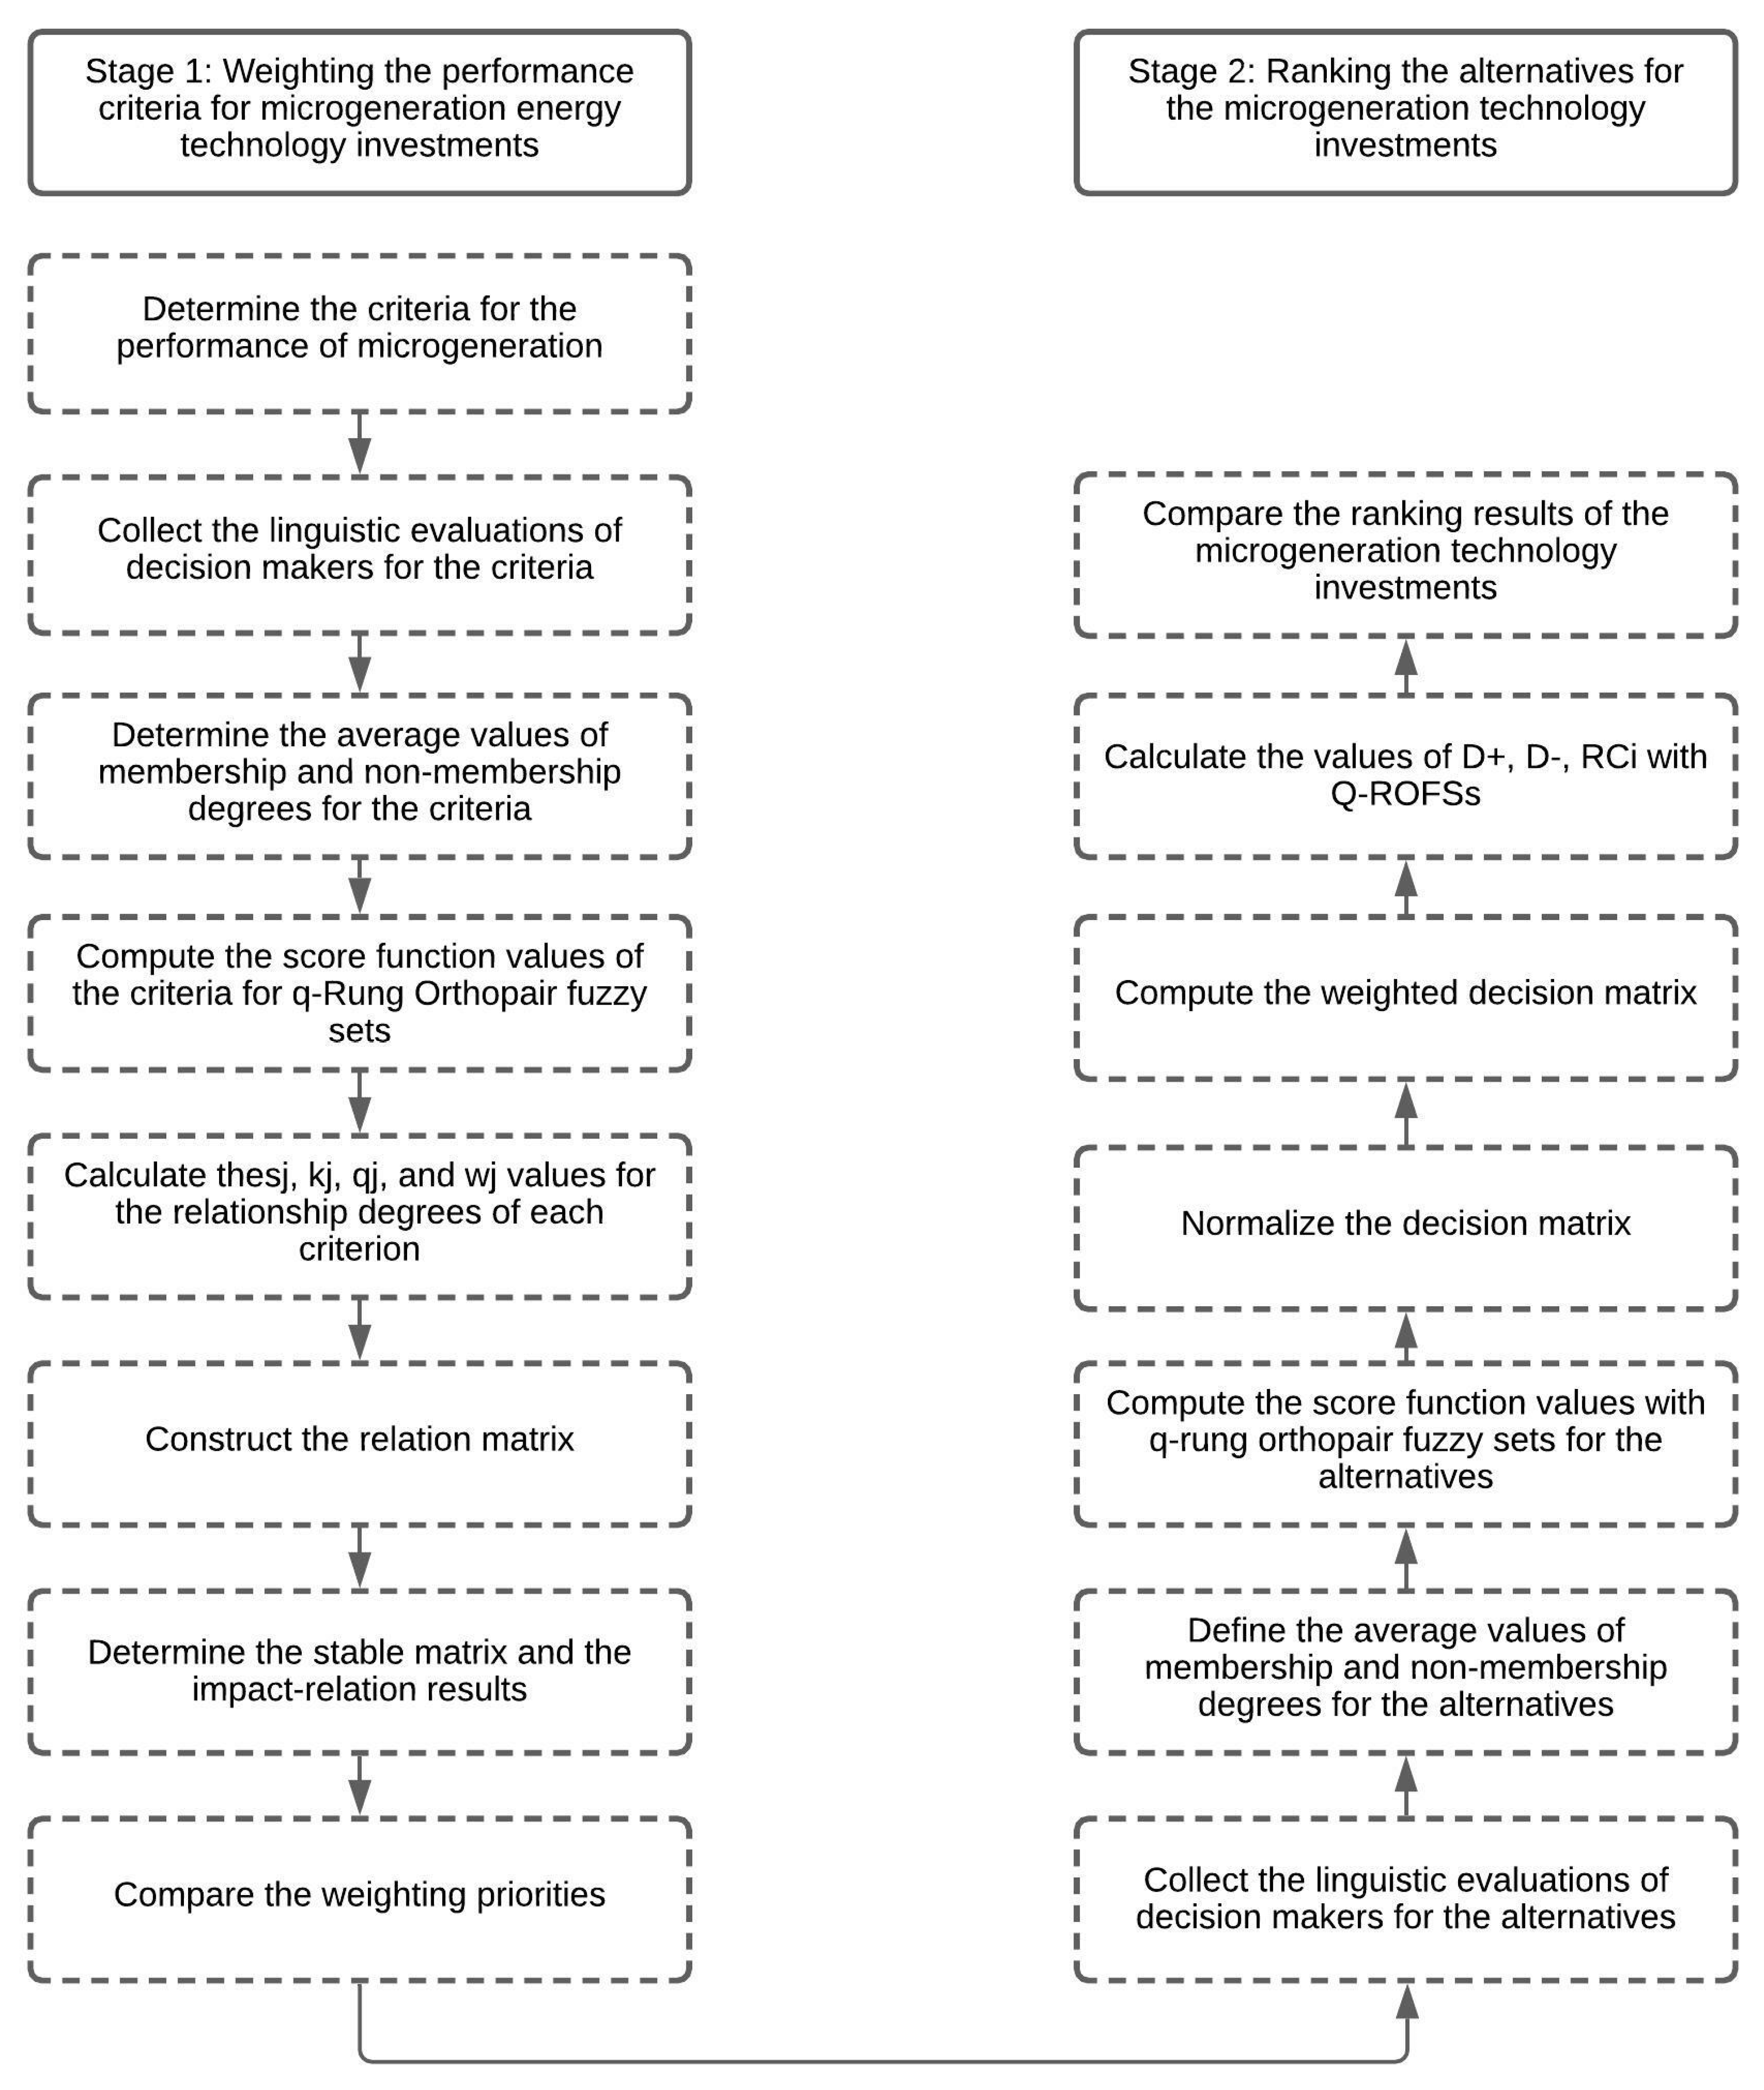
In this study, a model is constructed to understand critical performance measurement factors in microgeneration energy technology investments. The relative importance of the factors is defined with an M-SWARA, and investment alternatives are evaluated using the TOPSIS method, while considering q-ROFSs and the golden cut. All details of this model are presented in
Figure 1.
3.1. Finding Relative Importance of the Factors
Based on the evaluation of the literature, a criteria list was created as in
Table 1 regarding the performance measurement of microgeneration.
Cost effectiveness is an important variable in the performance of microgeneration energy technology investments. Technological developments are expected to reduce costs. If the technological investments to be made do not contribute positively to the reduction in costs, the efficiency of microgeneration energy investments will decrease. In this process, the ease of installation of projects is another important factor for performance measurement. Alternatives that are not easy to install will both reduce the efficiency in the process and create extra costs. Environmental compliance is another factor that can be effective in this context. All energy alternatives may not be suitable for all geographies. Therefore, it would be appropriate to choose the energy alternative that is suitable for the climatic conditions of the region where microgeneration projects will be established. Microgeneration energy investments are projects with comprehensive processes. In this context, the subject of transmission technologies is very important. On the other hand, frequent maintenance leads to increased costs.
Table 2 states the degrees and scales used in the analysis process.
In this process, an expert team is generated that consists of three people with significant experience in microgeneration technology investments. Their evaluations are shown in
Table 3.
Average values are computed as in
Table 4.
Table 5 includes score function values.
The sj, kj, qj, and wj values are calculated in
Table 6.
Table 7 includes the relation matrix.
Table 8 gives information about the stable matrix.
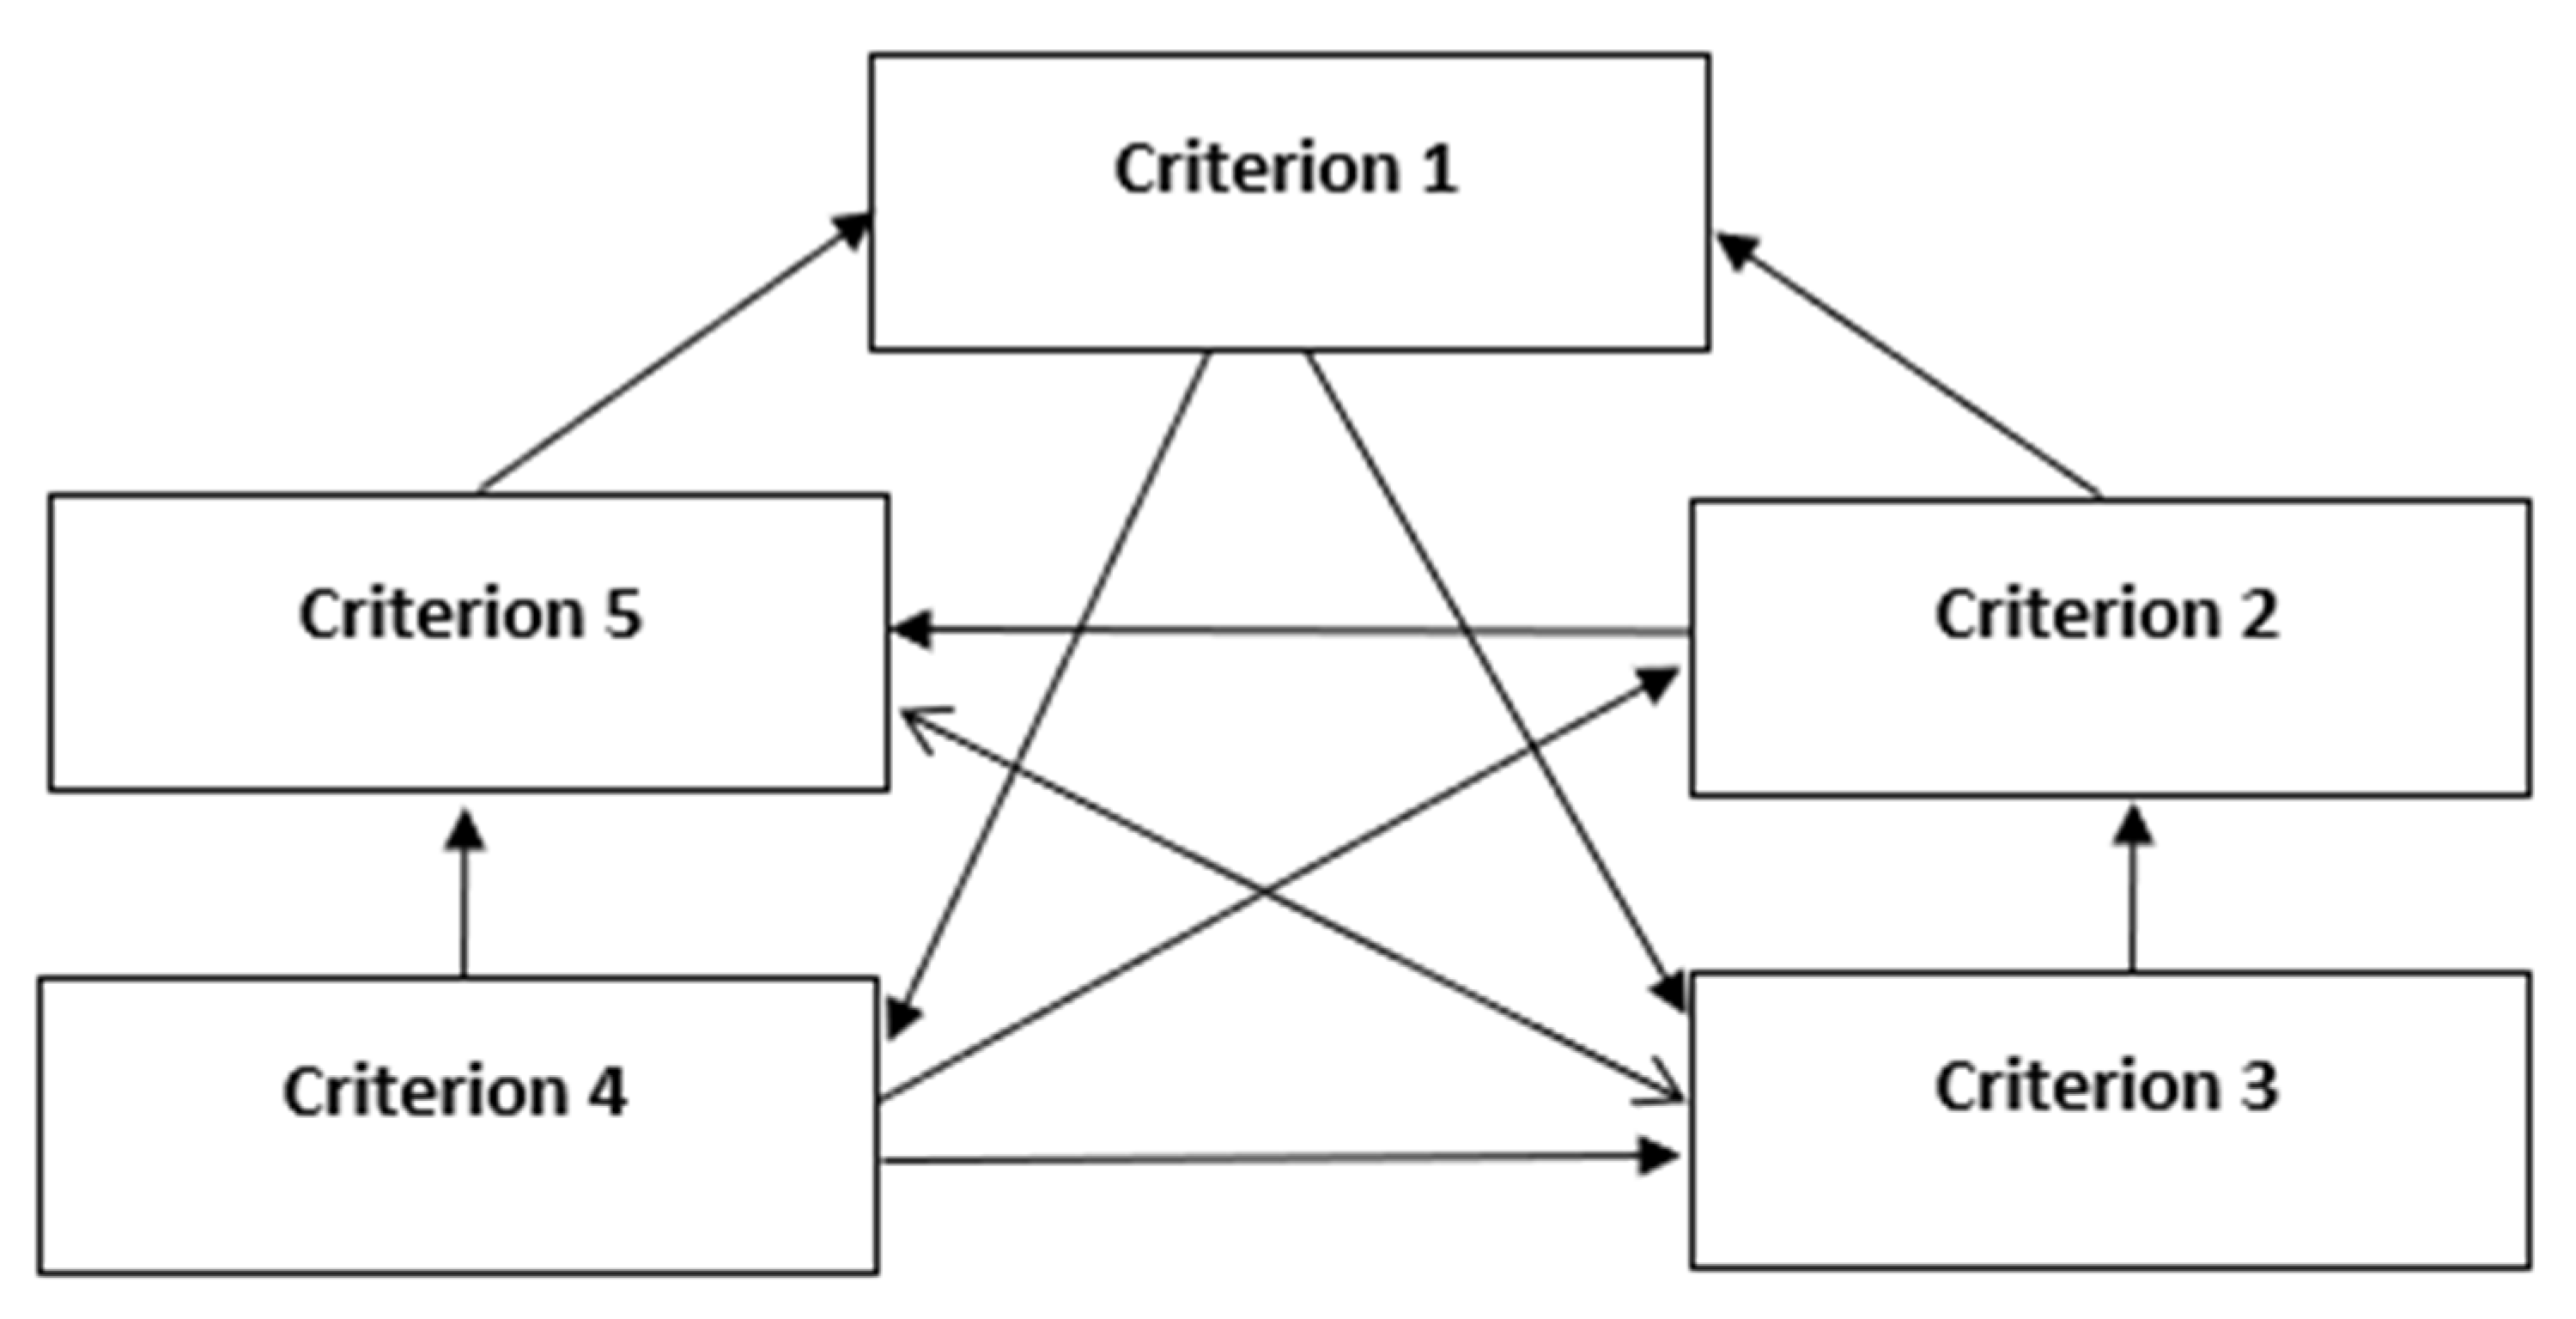
Figure 2 represents the impact-relation map.
It is identified that environmental adaptation (criterion 3) and efficiency of cost (criterion 5) are the most influenced items. Additionally, the most influential criterion is transmission technologies (criterion 4). Weighting priorities are shown in
Table 9.
The results are the same for the analyses made by IFSs, PFSs, and q-ROFSs. Efficiency of cost (criterion 5) is the most significant factor for the effectiveness of microgeneration energy technology investments. Environmental adaptation (criterion 3) has the second highest weight. Frequency of maintenance (criterion 1) is the least important item.
3.2. Ranking the Alternatives for Microgeneration Technology Investments
Based on the literature examination, six different microgeneration technology investment alternatives are selected as in
Table 10.
An expert team also evaluated these alternatives as in
Table 11.
Score function values are computed as in
Table 13.
Decision matrix is normalized as in
Table 14.
Significant values for ranking the items are computed as in
Table 16.
Ranking summaries are shown in
Table 17.
It is determined that a photovoltaic system (alternative 6) is the most critical alternative to increase the performance of microgeneration energy technology investment. Additionally, small-scale wind turbines (alternative 5) can also be considered in this framework.
4. Discussions
The most important advantage of microgeneration technology investments is that they contribute to the increase in clean energy use. Different types of renewable energy are considered in these projects. On the other hand, it is very important that the costs are reasonable to ensure the continuity of these investments. When cost efficiency cannot be achieved, investors will not prefer these projects, even though there are many benefits to the environment. Furthermore, it would be appropriate for investors to prioritize photovoltaic systems. Thanks to technological developments, there are serious decreases in the costs of these projects. Therefore, photovoltaic systems, which have a cost advantage, should be preferred in projects to develop microgeneration technology investments.
In the literature, there are different views regarding this issue. For instance, Schulte et al. [
43], Judson and Zirakbash [
3], and Du et al. [
37] identified that small-scale solar microgeneration systems should be considered for the effectiveness of these projects. Furthermore, researchers underlined the importance of other renewable energy alternatives for microgeneration projects, such as small-scale wind turbines [
44] and micro hydroelectric powers [
45]. Similarly, Dong et al. [
46] and Yüksel and Ubay [
47] also highlighted the significance of wind energy systems, with the aim of increasing the efficiency of renewable energy investments.
5. Conclusions
In this study, a model was created to identify critical performance measurement factors in microgeneration energy technology investments. Relative importance of the factors was determined with an M-SWARA, and investment alternatives were examined using the TOPSIS method, considering q-ROFSs and the golden cut. It is concluded that environmental adaptation and efficiency of cost are the most influential items. Additionally, the most influential criterion is transmission technologies. Efficiency of cost is the most significant factor for the effectiveness of microgeneration energy technology investments. Environmental adaptation has the second highest weight. Frequency of maintenance is the least important item. It is determined that a photovoltaic system is the most critical alternative to increase the performance of microgeneration energy technology investment. Additionally, small-scale wind turbines can also be considered in this framework. The results are the same for the analyses made by IFSs, PFSs, and q-ROFSs, which demonstrates the reliability of findings.
Focusing on microgeneration projects in a general manner is an important limitation of this study. Specific evaluations can be considered in future studies, such as performance measurements of small-scale wind turbines, micro hydroelectric power, or photovoltaic systems. With the help of this issue, unique strategies can be presented for each type of energy alternative. Additionally, different methodologies can be used in the following research. This situation helps to make a comparative examination. Furthermore, in this study only the analysis results of the proposed model are presented. However, the findings cannot be compared with real data. Therefore, in future studies, a case study can be conducted in which the findings can be compared with data from real microgeneration energy technology investments, located in different geographical locations.
Author Contributions
Conceptualization, H.D. and S.Y.; methodology, H.D. and S.Y.; software, H.D. and S.Y.; validation, H.D., S.Y.,T.A. and Ü.H.; formal analysis, H.D., S.Y.,T.A. and Ü.H.; investigation, T.A. and Ü.H; resources, H.D., S.Y.,T.A. and Ü.H.; data curation, H.D., S.Y.,T.A. and Ü.H.; writing—original draft preparation, H.D. and S.Y.; writing—review and editing, T.A, and Ü.H.; visualization, T.A. and Ü.H.; supervision, T.A. and Ü.H.; project administration, H.D.; funding acquisition, T.A. and Ü.H. All authors have read and agreed to the published version of the manuscript.
Funding
This research received no external funding.
Institutional Review Board Statement
Not applicable.
Conflicts of Interest
The authors declare no conflict of interest.
References
- Yimen, N.; Hamandjoda, O.; Meva’a, L.; Ndzana, B.; Nganhou, J. Analyzing of a photovoltaic/wind/biogas/pumped-hydro off-grid hybrid system for rural electrification in Sub-Saharan Africa—Case study of Djoundé in Northern Cameroon. Energies 2018, 11, 2644. [Google Scholar] [CrossRef] [Green Version]
- Yimen, N.; Tchotang, T.; Kanmogne, A.; Abdelkhalikh Idriss, I.; Musa, B.; Aliyu, A.; Okonkwo, E.; Abba, S.; Tata, D.; Meva’A, L.; et al. Optimal sizing and techno-economic analysis of hybrid renewable energy systems—A case study of a photovoltaic/wind/battery/diesel system in Fanisau, Northern Nigeria. Processes 2020, 8, 1381. [Google Scholar] [CrossRef]
- Musa, B.; Yimen, N.; Abba, S.I.; Adun, H.H.; Dagbasi, M. Multi-state load demand forecasting using hybridized support vector regression integrated with optimal design of off-grid energy Systems—A metaheuristic approach. Processes 2021, 9, 1166. [Google Scholar] [CrossRef]
- Chiaraviglio, L.; D’Andreagiovanni, F.; Idzikowski, F.; Vasilakos, A.V. Minimum cost design of 5G networks with UAVs, tree-based optical backhauling, micro-generation and batteries. In Proceedings of the 2019 21st International Conference on Transparent Optical Networks (ICTON), Angers, France, 9–13 July 2019; pp. 1–4. [Google Scholar]
- Godina, R.; Rodrigues, E.M.; Pouresmaeil, E.; Catalão, J.P. Optimal residential model predictive control energy management performance with PV microgeneration. Comput. Oper. Res. 2018, 96, 143–156. [Google Scholar] [CrossRef]
- Virupaksha, V.; Harty, M.; McDonnell, K. Microgeneration of electricity using a solar photovoltaic system in Ireland. Energies 2019, 12, 4600. [Google Scholar] [CrossRef] [Green Version]
- Pearce, P.; Slade, R. Feed-in tariffs for solar microgeneration: Policy evaluation and capacity projections using a realistic agent-based model. Energy Policy 2018, 116, 95–111. [Google Scholar] [CrossRef] [Green Version]
- Gabderakhmanova, T.S.; Popel, O.S. Competitiveness analysis results for photovoltaic microgeneration systems in the Russian federation. Dokl. Phys. 2019, 64, 245–248. [Google Scholar] [CrossRef]
- Saleme, L.; Muniz, P.R.; Fiorotti, R. Sustainability of Brazilian energy tariff model under a high penetration scenario of distributed photovoltaic microgeneration. In Proceedings of the 2018 Simposio Brasileiro de Sistemas Eletricos (SBSE), Niteroi, Brazil, 12–16 May 2018; pp. 1–6. [Google Scholar]
- Karytsas, S.; Vardopoulos, I.; Theodoropoulou, E. Factors affecting sustainable market acceptance of residential microgeneration technologies. A two time period comparative analysis. Energies 2019, 12, 3298. [Google Scholar] [CrossRef] [Green Version]
- Su, W.; Liu, M.; Zeng, S.; Štreimikienė, D.; Baležentis, T.; Ališauskaitė-Šeškienė, I. Valuating renewable microgeneration technologies in Lithuanian households: A study on willingness to pay. J. Clean. Prod. 2018, 191, 318–329. [Google Scholar] [CrossRef]
- Karytsas, S. Residential heating systems’ selection process: Empirical findings from Greece on the relations between motivation factors and socioeconomic, residence, and spatial characteristics. Int. J. Sustain. Energy 2021, 1–22. [Google Scholar] [CrossRef]
- Bao, Q.; Sinitskaya, E.; Gomez, K.J.; MacDonald, E.F.; Yang, M.C. A human-centered design approach to evaluating factors in residential solar PV adoption: A survey of homeowners in California and Massachusetts. Renew. Energy 2020, 151, 503–513. [Google Scholar] [CrossRef]
- Silva, F.P.; de Souza, S.N.M.; Kitamura, D.S.; Nogueira, C.E.C.; Otto, R.B. Energy efficiency of a micro-generation unit of electricity from biogas of swine manure. Renew. Sustain. Energy Rev. 2018, 82, 3900–3906. [Google Scholar] [CrossRef]
- Hanna, R.; Leach, M.; Torriti, J. Microgeneration: The installer perspective. Renew. Energy 2018, 116, 458–469. [Google Scholar] [CrossRef]
- Papurello, D.; Bertino, D.; Santarelli, M. CFD Performance Analysis of a Dish-Stirling System for Microgeneration. Processes 2021, 9, 1142. [Google Scholar] [CrossRef]
- Balezentis, T.; Streimikiene, D.; Mikalauskas, I.; Shen, Z. Towards carbon free economy and electricity: The puzzle of energy costs, sustainability and security based on willingness to pay. Energy 2021, 214, 119081. [Google Scholar] [CrossRef]
- Aquila, G.; Coelho, E.D.O.P.; Bonatto, B.D.; de Oliveira Pamplona, E.; Nakamura, W.T. Perspective of uncertainty and risk from the CVaR-LCOE approach: An analysis of the case of PV microgeneration in Minas Gerais, Brazil. Energy 2021, 226, 120327. [Google Scholar] [CrossRef]
- Piterou, A.; Coles, A.M. A review of business models for decentralised renewable energy projects. Bus. Strategy Environ. 2021, 30, 1468–1480. [Google Scholar] [CrossRef]
- Zhang, C.; Wang, Q.; Zeng, S.; Baležentis, T.; Štreimikienė, D.; Ališauskaitė-Šeškienė, I.; Chen, X. Probabilistic multi-criteria assessment of renewable micro-generation technologies in households. J. Clean. Prod. 2019, 212, 582–592. [Google Scholar] [CrossRef]
- Li, J.; Yüksel, S.; Dinçer, H.; Mikhaylov, A.; Barykin, S.E. Bipolar q-ROF hybrid decision making model with golden cut for analyzing the levelized cost of renewable energy alternatives. IEEE Access 2022, 10, 42507–42517. [Google Scholar] [CrossRef]
- Kostis, P.; Dinçer, H.; Yüksel, S. Knowledge-Based Energy Investments of European Economies and Policy Recommendations for Sustainable Development. J. Knowl. Econ. 2022, 1–33. [Google Scholar] [CrossRef]
- Bhuiyan, M.A.; Dinçer, H.; Yüksel, S.; Mikhaylov, A.; Danish, M.S.S.; Pinter, G.; Uyeh, D.D.; Stepanova, D. Economic indicators and bioenergy supply in developed economies: QROF-DEMATEL and random forest models. Energy Rep. 2022, 8, 561–570. [Google Scholar] [CrossRef]
- Zhao, Y.; Xu, Y.; Yüksel, S.; Dinçer, H.; Ubay, G.G. Hybrid IT2 fuzzy modelling with alpha cuts for hydrogen energy investments. Int. J. Hydrog. Energy 2021, 46, 8835–8851. [Google Scholar] [CrossRef]
- Meng, Y.; Wu, H.; Zhao, W.; Chen, W.; Dinçer, H.; Yüksel, S. A hybrid heterogeneous Pythagorean fuzzy group decision modelling for crowdfunding development process pathways of fintech-based clean energy investment projects. Financ. Innov. 2021, 7, 33. [Google Scholar] [CrossRef]
- Fang, S.; Zhou, P.; Dinçer, H.; Yüksel, S. Assessment of safety management system on energy investment risk using house of quality based on hybrid stochastic interval-valued intuitionistic fuzzy decision-making approach. Saf. Sci. 2021, 141, 105333. [Google Scholar] [CrossRef]
- Atanassov, K.T. Intuitionistic fuzzy sets VII ITKR’s Session. Sofia 1983, 1, 983. [Google Scholar]
- Yager, R.R. Pythagorean fuzzy subsets. In Proceedings of the 2013 Joint IFSA World Congress and NAFIPS Annual Meeting (IFSA/NAFIPS), Edmonton, AB, Canada, 24–28 June 2013; pp. 57–61. [Google Scholar]
- Yager, R.R. Generalized orthopair fuzzy sets. IEEE Trans. Fuzzy Syst. 2016, 25, 1222–1230. [Google Scholar] [CrossRef]
- Dunlap, R.A. The Golden Ratio and Fibonacci Numbers; World Scientific: Singapore, 1997. [Google Scholar]
- Keršuliene, V.; Zavadskas, E.K.; Turskis, Z. Selection of rational dispute resolution method by applying new step-wise weight assessment ratio analysis (SWARA). J. Bus. Econ. Manag. 2010, 11, 243–258. [Google Scholar] [CrossRef]
- Badida, P.; Selvaprakash, T.; Jayaprakash, J. Risk Analysis of hazardous activities using Fuzzy Multicriteria Decision Making Tools: A case study in a gas turbine manufacturing plant. Energy Sources Part A RecoveryUtil. Environ. Eff. 2021, 1–13. [Google Scholar] [CrossRef]
- Biswas, T.K.; Abbasi, A.; Chakrabortty, R.K. A two-stage VIKOR assisted multi-operator differential evolution approach for Influence Maximization in social networks. Expert Syst. Appl. 2021, 192, 116342. [Google Scholar] [CrossRef]
- Bourhis, M.; Pereira, M.; Ravelet, F.; Dobrev, I. Innovative design method and experimental investigation of a small-scale and very low tip-speed ratio wind turbine. Exp. Therm. Fluid Sci. 2022, 130, 110504. [Google Scholar] [CrossRef]
- Camilo, F.M.; Castro, R.; Almeida, M.E.; Pires, V.F. Energy management in unbalanced low voltage distribution networks with microgeneration and storage by using a multi-objective optimization algorithm. J. Energy Storage 2021, 33, 10210. [Google Scholar] [CrossRef]
- Denysiuk, S.; Derevianko, D. The Cost Based DSM Methods in Microgrids with DG Sources. In Proceedings of the 2021 IEEE 2nd KhPI Week on Advanced Technology (KhPIWeek), Kharkiv, Ukraine, 13–17 September 2021; pp. 544–548. [Google Scholar]
- Du, H.; Han, Q.; de Vries, B. Modelling energy-efficient renovation adoption and diffusion process for households: A review and a way forward. Sustain. Cities Soc. 2022, 77, 10356. [Google Scholar] [CrossRef]
- Gao, F.; Zhang, Z.; Shang, M. Risk Evaluation Study of Urban Rail Transit Network Based on Entropy-TOPSIS-Coupling Coordination Model. Discret. Dyn. Nat. Soc. 2021, 2021, 5124951. [Google Scholar] [CrossRef]
- Israr, A.; Yang, Q. Resilient and sustainable microgeneration power supply for 5G mobile networks. In Renewable Energy Microgeneration Systems; Academic Press: Cambridge, MA, USA, 2021; pp. 213–228. [Google Scholar]
- Liobikienė, G.; Dagiliūtė, R.; Juknys, R. The determinants of renewable energy usage intentions using theory of planned behaviour approach. Renew. Energy 2021, 170, 587–594. [Google Scholar] [CrossRef]
- Livio, M. The Golden Ratio: The Story of Phi, the World’s Most Astonishing Number; Crown: New York, NY, USA, 2008. [Google Scholar]
- Mishra, A.R.; Rani, P. A q-rung orthopair fuzzy ARAS method based on entropy and discrimination measures: An application of sustainable recycling partner selection. J. Ambient. Intell. Humaniz. Comput. 2021, 1–22. [Google Scholar] [CrossRef]
- Schulte, E.; Scheller, F.; Sloot, D.; Bruckner, T. A meta-analysis of residential PV adoption: The important role of perceived benefits, intentions and antecedents in solar energy acceptance. Energy Res. Soc. Sci. 2022, 84, 102339. [Google Scholar] [CrossRef]
- Xiong, L.; Yang, S.; He, Y.; Li, P.; Huang, S.; Wang, Z.; Wang, J. Specified time consensus control of ESSs for frequency support with DFIG wind turbines. Int. J. Electr. Power Energy Syst. 2022, 135, 10752. [Google Scholar] [CrossRef]
- Zeidan, M.; Ostfeld, A. Hydraulic Ram Pump Integration into Water Distribution Systems for Energy Recovery Application. Water 2022, 14, 21. [Google Scholar] [CrossRef]
- Dong, W.; Zhao, G.; Yüksel, S.; Dinçer, H.; Ubay, G.G. A novel hybrid decision making approach for the strategic selection of wind energy projects. Renew. Energy 2022, 185, 321–337. [Google Scholar] [CrossRef]
- Yüksel, S.; Ubay, G.G. Determination of optimal financial government incentives in wind energy investments. In Strategic Outlook in Business and Finance Innovation: Multidimensional Policies for Emerging Economies; Emerald Publishing Limited: Bingley, UK, 2021. [Google Scholar]
| Publisher’s Note: MDPI stays neutral with regard to jurisdictional claims in published maps and institutional affiliations. |
© 2022 by the authors. Licensee MDPI, Basel, Switzerland. This article is an open access article distributed under the terms and conditions of the Creative Commons Attribution (CC BY) license (https://creativecommons.org/licenses/by/4.0/).


