Article

Assessing Changes in the Landscape Pattern of Wetlands and Its Impact on the Value of Wetland Ecosystem Services in the Yellow River Basin, Inner Mongolia

1
School of Ecology and Environment, Inner Mongolia University, Hohhot 010021, China
2
Environmental Monitoring Station, Bayannaoer 015000, China
3
State Key Laboratory of Eco-Hydraulics in Northwest Arid Region of China, Xi’an University of Technology, Xi’an 710048, China
*
Authors to whom correspondence should be addressed.
Sustainability 2022, 14(10), 6328; https://0-doi-org.brum.beds.ac.uk/10.3390/su14106328
Submission received: 2 April 2022 / Revised: 27 April 2022 / Accepted: 9 May 2022 / Published: 23 May 2022
(This article belongs to the Special Issue Hydrological Response to Climate Change in Arid Land)

Abstract

:
The Yellow River Basin of Inner Mongolia has significant ecological advantages, and it is critical to research the landscape pattern of its watershed wetland ecosystem and the changes in its service value in order to protect the environment and develop the region in a high-quality manner. In this paper, we use the landscape index method, the equivalent factor method, and a field survey to investigate changes in wetland landscape patterns and the dynamics of wetland ecosystem service values in the Yellow River Basin of Inner Mongolia from 1990 to 2020, and then examine the impact of landscape pattern evolution on wetland ecosystem service values in the region. The study’s findings indicate that rivers, lakes, and herbaceous marshes are the most common types of wetland landscapes in Inner Mongolia’s Yellow River Basin. The landscape types in the research area are diverse, and landscape fragmentation is increasing. In the Yellow River Basin of Inner Mongolia, the overall value of wetland ecosystem benefits is negatively connected with Patch Density and the Shannon Diversity Index, and positively correlated with the Contagion Index.

1. Introduction

As a unique ecosystem linking water and land, wetlands have the characteristics of both water and land environments. The complex structure of the ecosystem itself allows it to perform a variety of ecological functions such as regulate climate, nourish water, maintain soil and water, degrade and enrich pollutants, maintain biodiversity, protect waterfowl migration and breeding, recreation and viewing, and religious and cultural needs [1]. When people develop and use wetlands, however, they often ignore the ecological and social benefits that cannot be reflected in the commercial market and focus only on economic benefits [2,3], which leads to excessive transformation and development of wetlands, pollution, a significant reduction in wetland area, shrinkage of wetland species diversity, and serious damage to wetland structure and function [4,5]. Therefore, how to quantify the value of wetland ecosystem service functions has become a popular topic in ecological and ecological economics research [6]. In the 1880s, American wetland researchers proposed a wetland typology [7], which assessed the biodiversity, hydrology, and other service functions of wetlands. In 1988, the first International Convention on Wetlands was held in Sri Lanka, where the classification of wetlands, the functional evaluation of wetlands, and the wetland evaluation index system were discussed in depth for the first time [8]. In 1997, Costanza et al. [9] classified ecosystem service functions into 17 categories and assessed the value of global ecosystem services at approximately USD 33 trillion per year. In 2003, Turner et al. [10] proposed a framework and methodology for eco-economic analysis of wetlands, providing a basis for assessing the economic value of wetland ecosystem services and their application in sustainable development strategies. In 2012, De Groot et al. [11] estimated the value of ecosystem services provided by 10 major ecosystems in monetary units based on case studies from around the world, and in 2014, P. Zorrilla-Miras et al. [12] studied the value of wetland ecosystem services and the factors influencing them in the wetlands of Donia, Spain, concluding that land use change was the major factor in the decline of service values. In 1997, the results of Costanza [9] and others became a milestone in the quantitative assessment of ecosystem service functions. However, the quantitative ecological service function value assessment still has shortcomings. Equivalent-based relative ecological service function assessment methods, which focus on intensity differences rather than absolute magnitude, are more conducive to guiding corresponding management and decision making, and have made greater progress in recent years [13]. Based on the work of Costanza et al. [14], Xie [15] conducted a questionnaire survey in 2002 among 200 professionals with ecological backgrounds, modified the coefficient to reflect China’s actual situation, and calculated the land ecosystem service value using China as the scale. This method is applied in the research of regional ecosystem service value evaluation in China because of its ease of use, low data demand, high comparability of results, and thorough evaluation [16,17,18,19,20].
Changes in wetland ecosystem service values are a tangible representation of dynamic changes in wetland landscape patterns at their core. People alter the kind of wetland landscapes [16], influencing the category, area, spatial distribution pattern [21] and ecosystem service functions of wetland ecosystems, resulting in changes in the value of wetland ecosystem services. Therefore, it is important to understand the impact and interaction of land use change on ecosystem service values. The concept of landscape ecology was introduced in the 1930s [22], but studies on landscape patterns only started to develop in the 1950s and were mainly focused on the description of landscape patterns, and only after the 1970s did they start to develop towards the quantification of landscape patterns. Field surveys were the major emphasis in the early days owing to restricted science and technology, but with the advent of 3S technology, numerous findings were achieved. For example, Kozak [23] studied and assessed the impact of changes in landscape patterns on the value of the ecosystem service functions of two wetlands in rural southern Illinois and urban northeastern Illinois. Brander [24] analyzed the economic value of ecosystem services provided by wetlands in agricultural landscapes in relation to changes in landscape patterns; Su [25] and others assessed the impact of land cover change to provide a scientific basis for integrated planning in the city of Podol in southwestern France.
The Yellow River basin in Inner Mongolia serves as an important natural barrier against sand in the north. The Yellow River has provided favorable water resource conditions for the Hetao Irrigation District, the Ordos Irrigation District, and other local economic development over the years, and has provided significant social, ecological, and economic benefits in irrigation, flood control, power generation, and industrial water supply. As a result, the service value of wetlands in Inner Mongolia’s Yellow River basin has a significant impact and relevance in the region’s long-term development. Previous studies on the Yellow River by Chinese scholars have mostly focused on the source area and the Yellow River delta [26,27,28], with little research on the middle section of the Yellow River, especially the Inner Mongolia section, and previous studies lacked dynamic analysis. In this paper, we develop classification rules that are consistent with the distribution characteristics of wetland types in the Inner Mongolia Yellow River Basin, extract and map the information from remote sensing images of each period, precisely explain the dynamic change process of the wetland landscape in the past 30 years, and analyze the landscape pattern and the change in wetland ecological service value over a long time span based on the accumulation of previous studies, and then reveal the effect of changes in wetland landscape pattern on the value of wetland ecosystem services. This study provides scientific basis and technical support for the optimal spatial configuration of wetland landscapes and the restoration and reconstruction of degraded wetland ecosystems in the Yellow River Basin of Inner Mongolia.

2. Materials and Methods
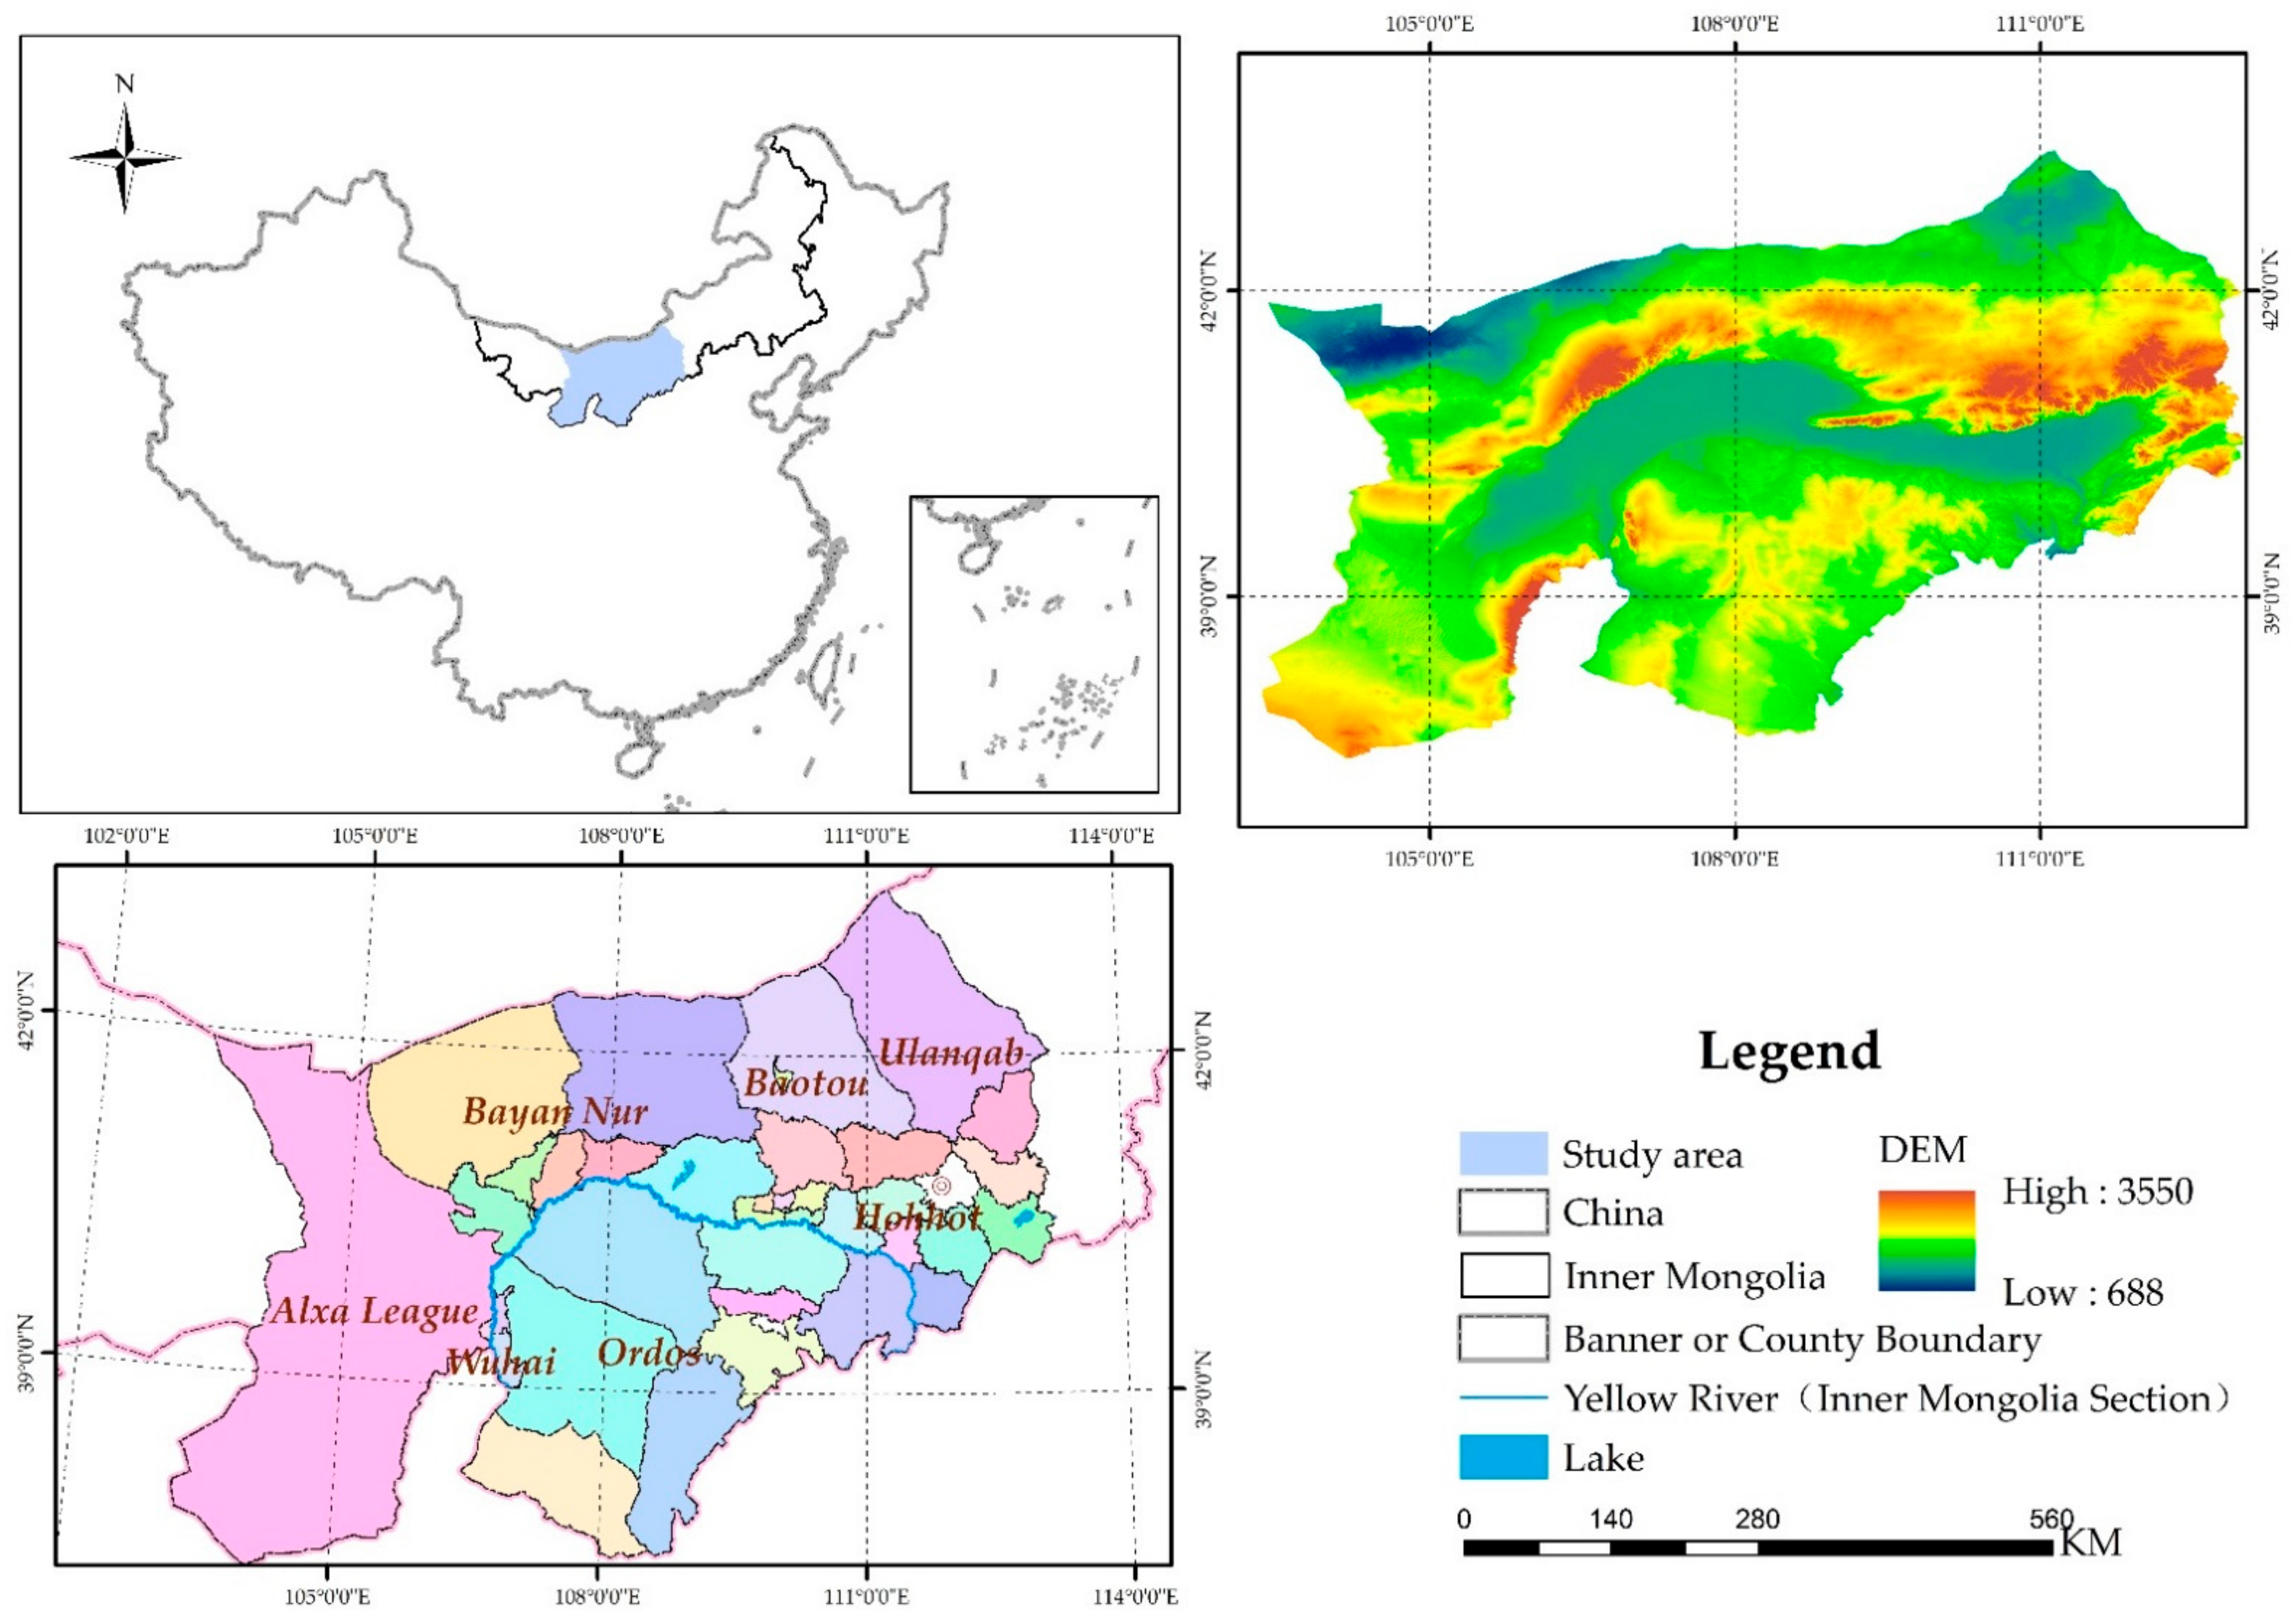
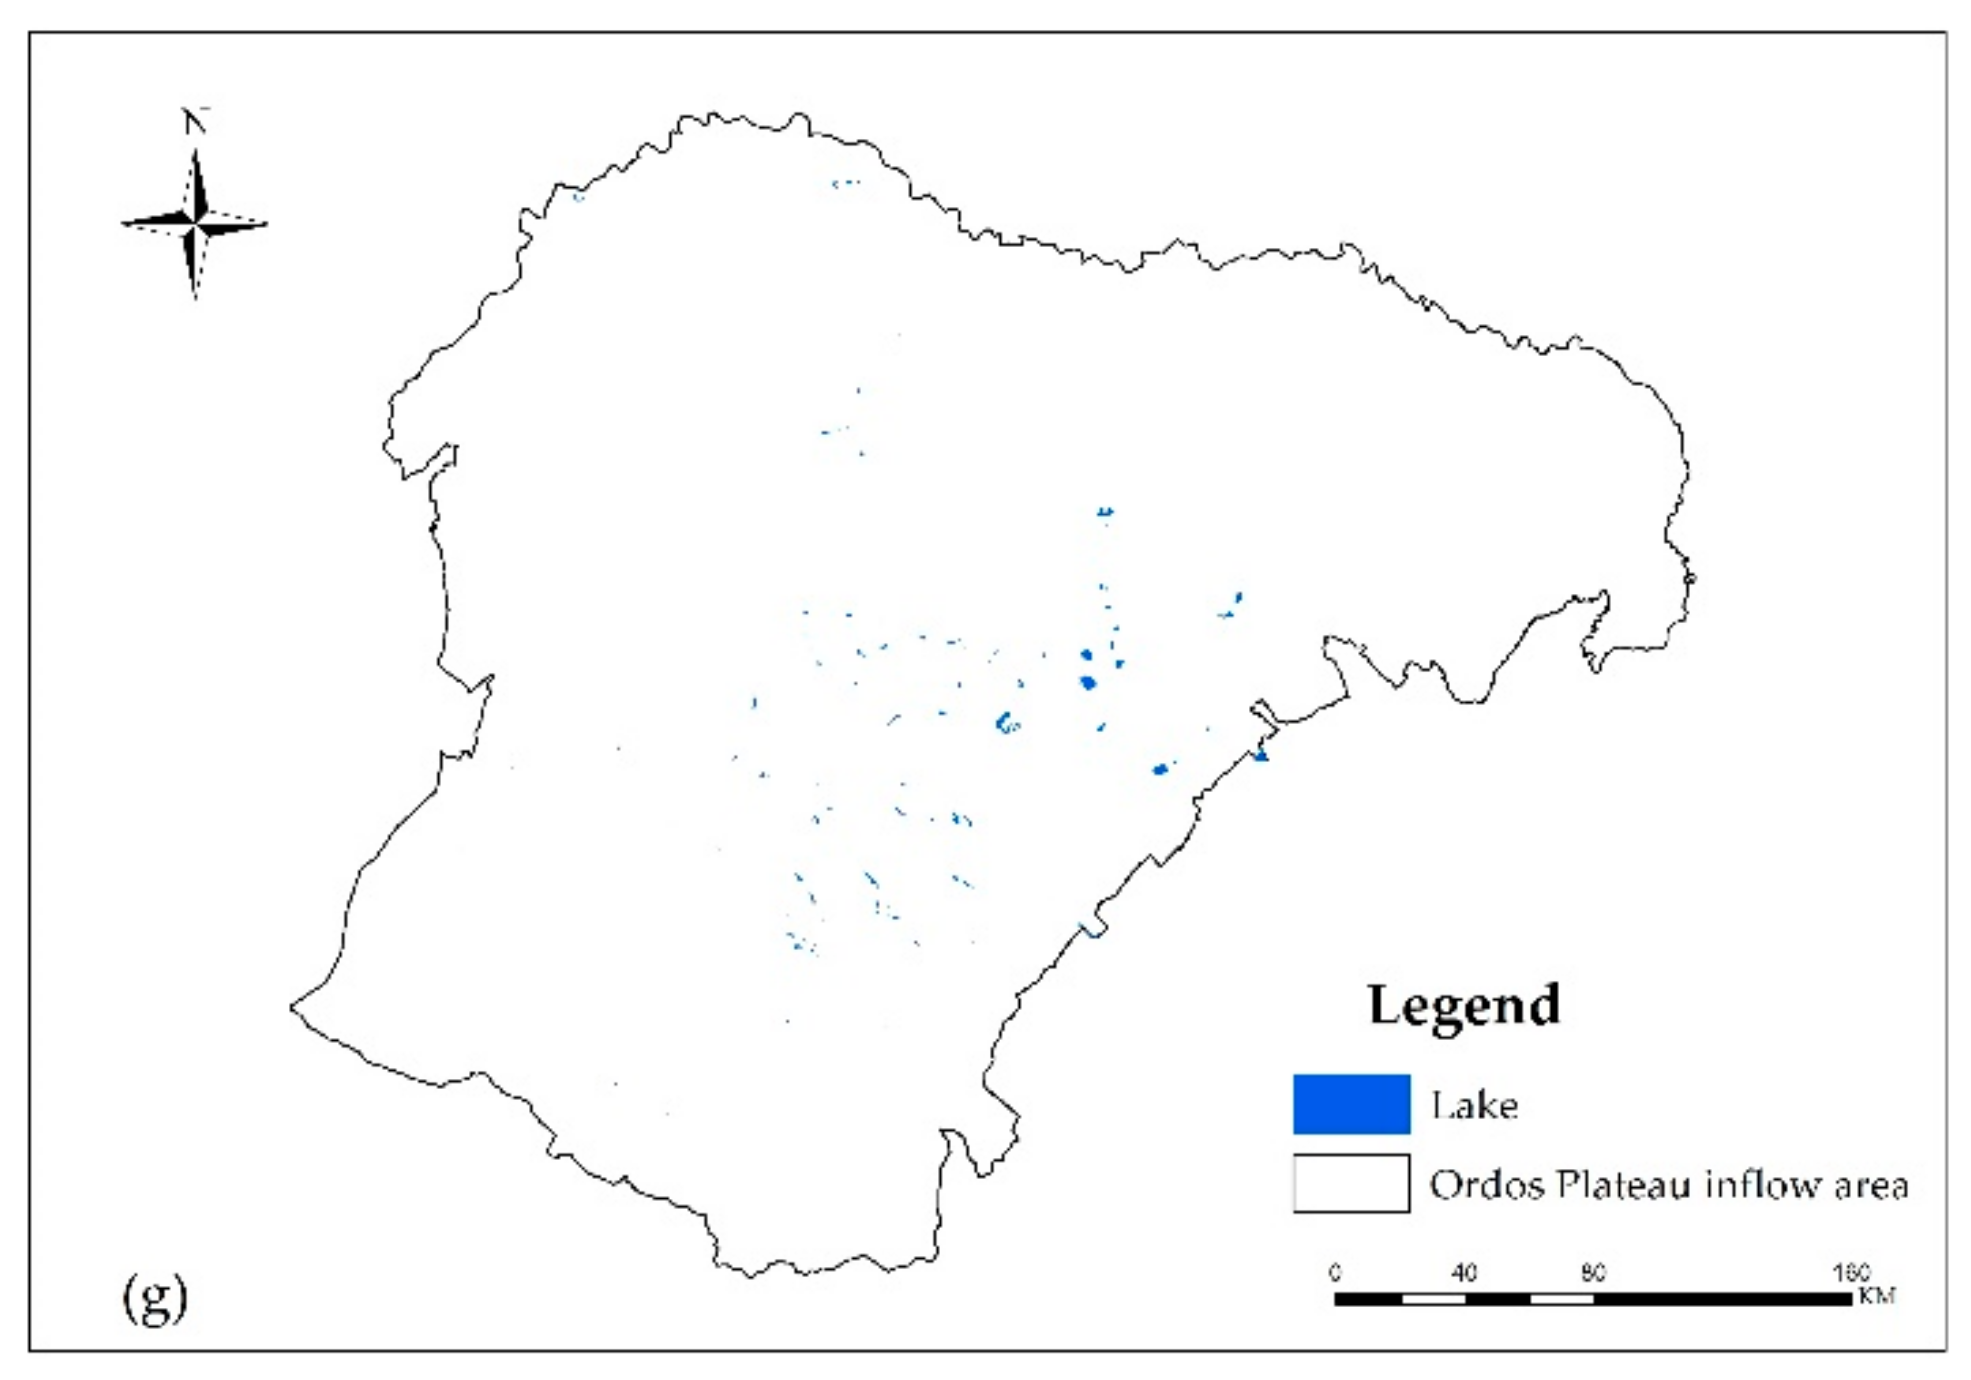
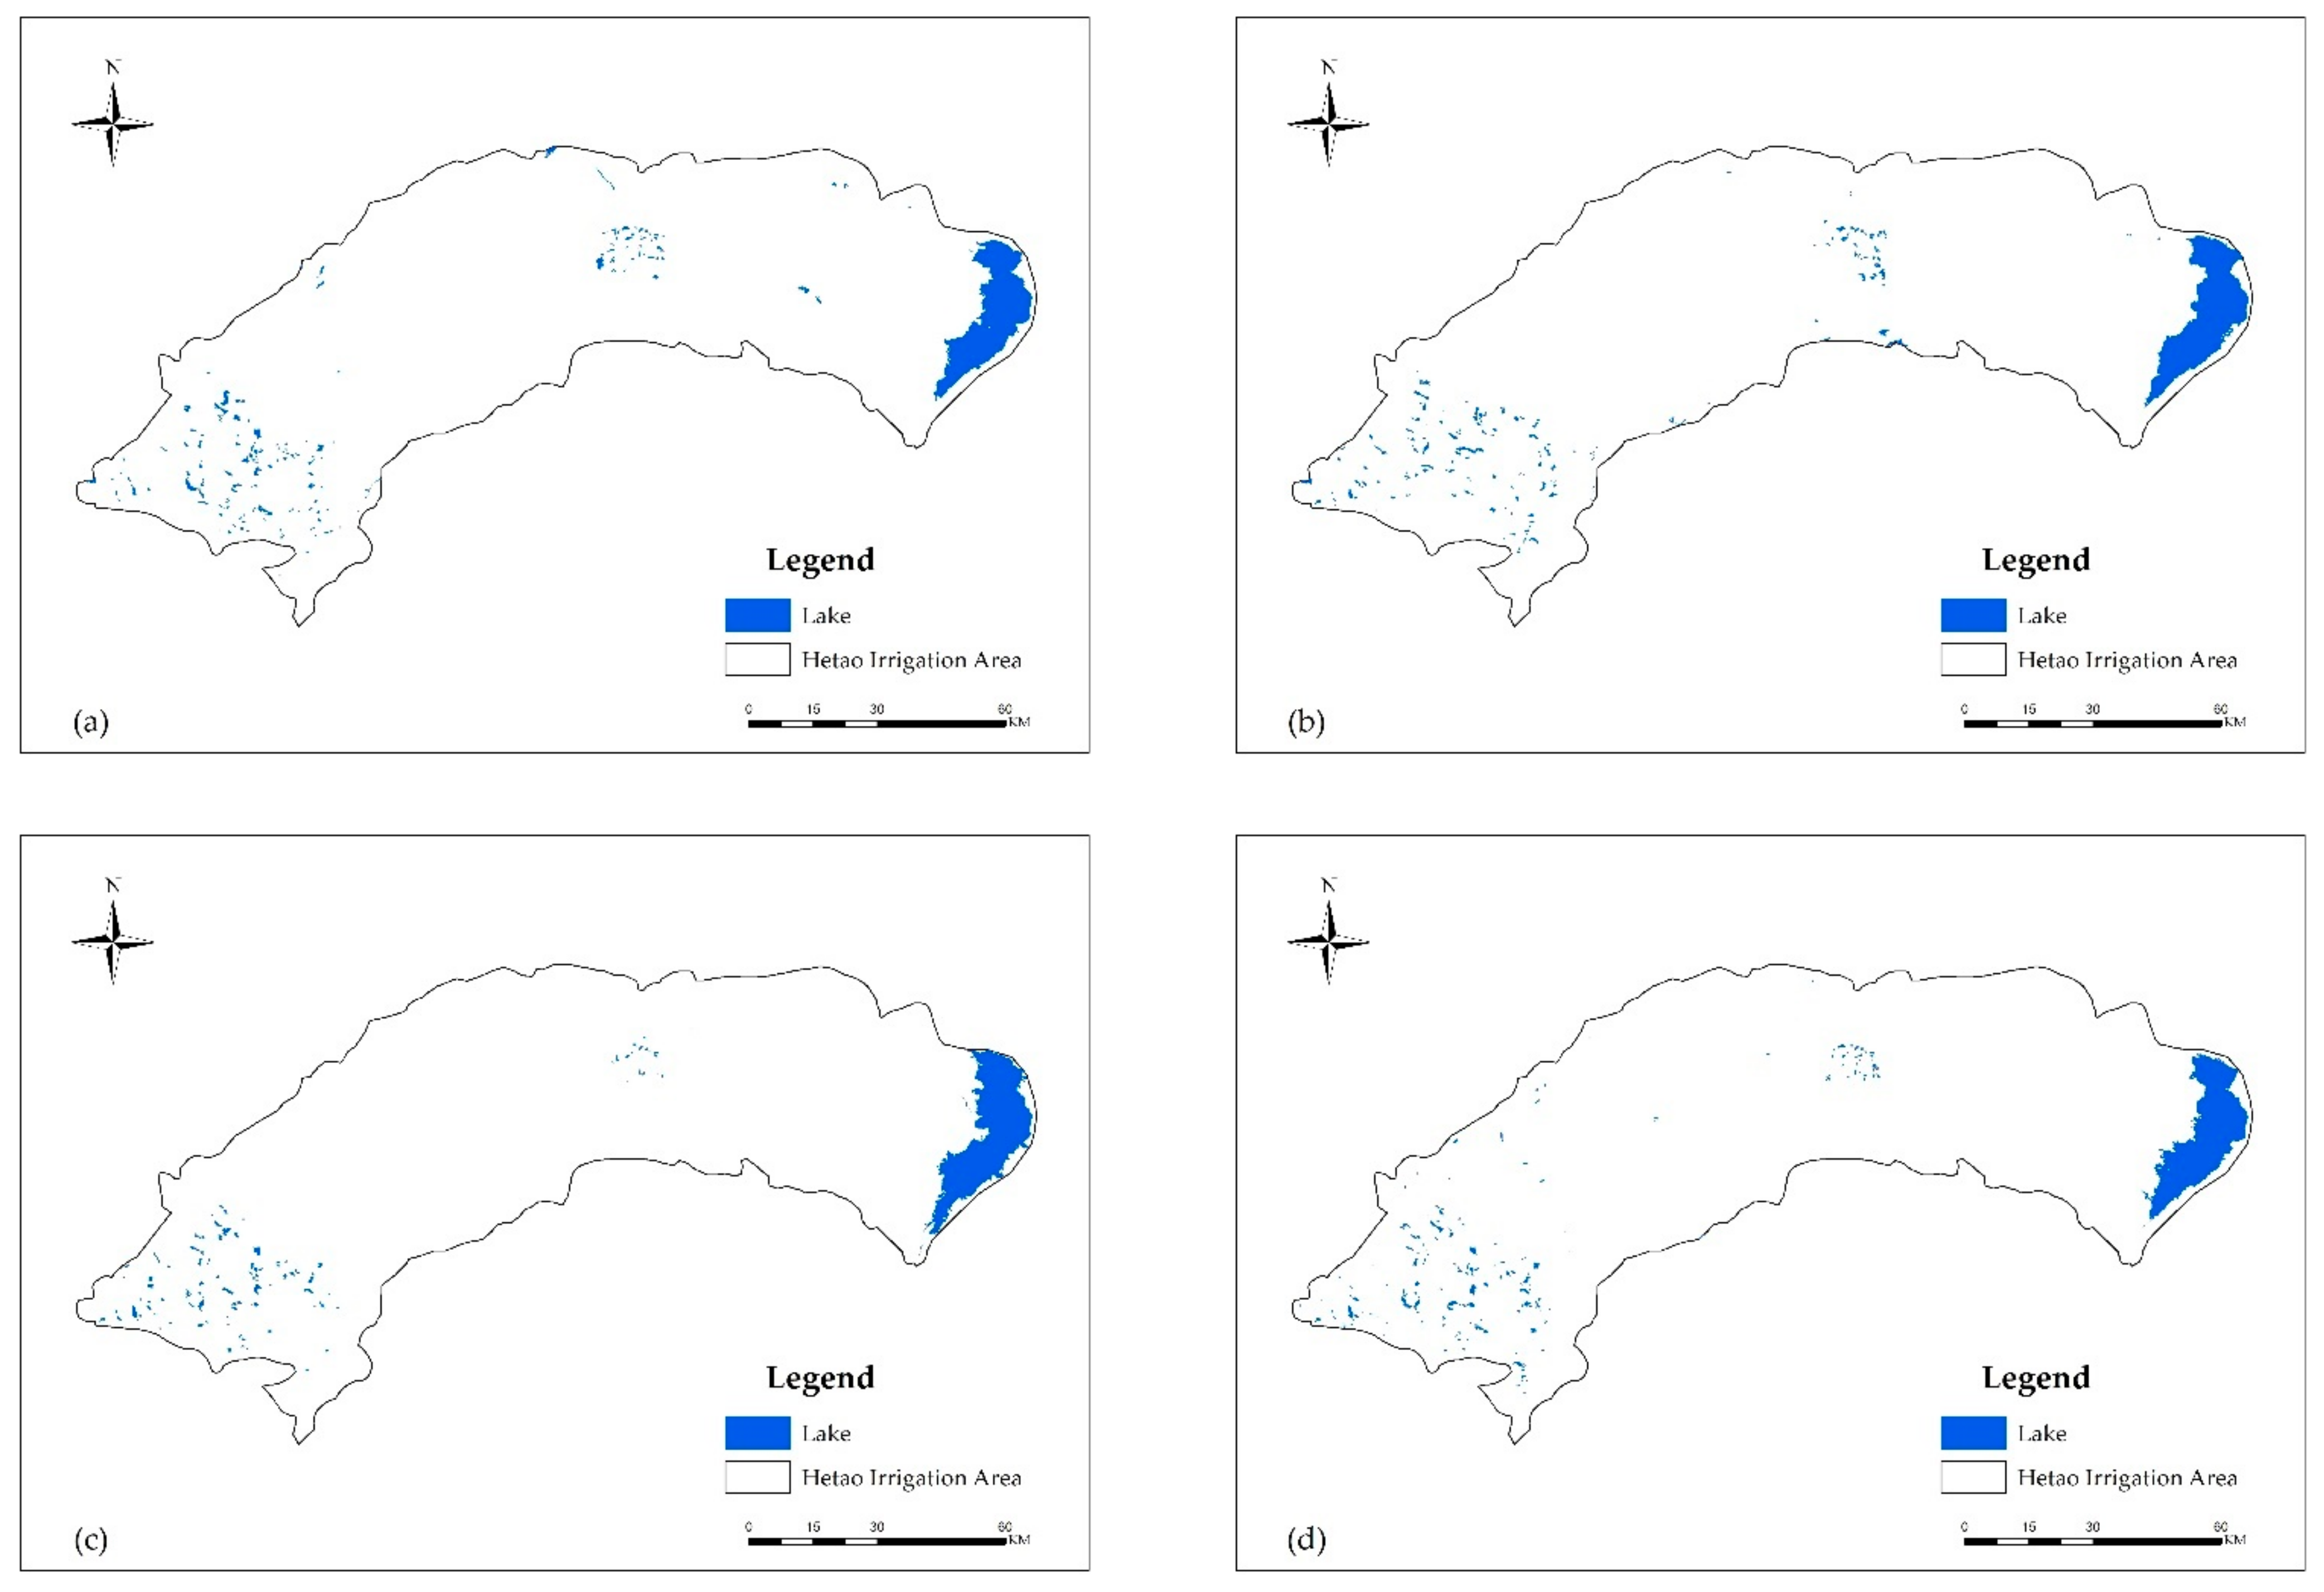
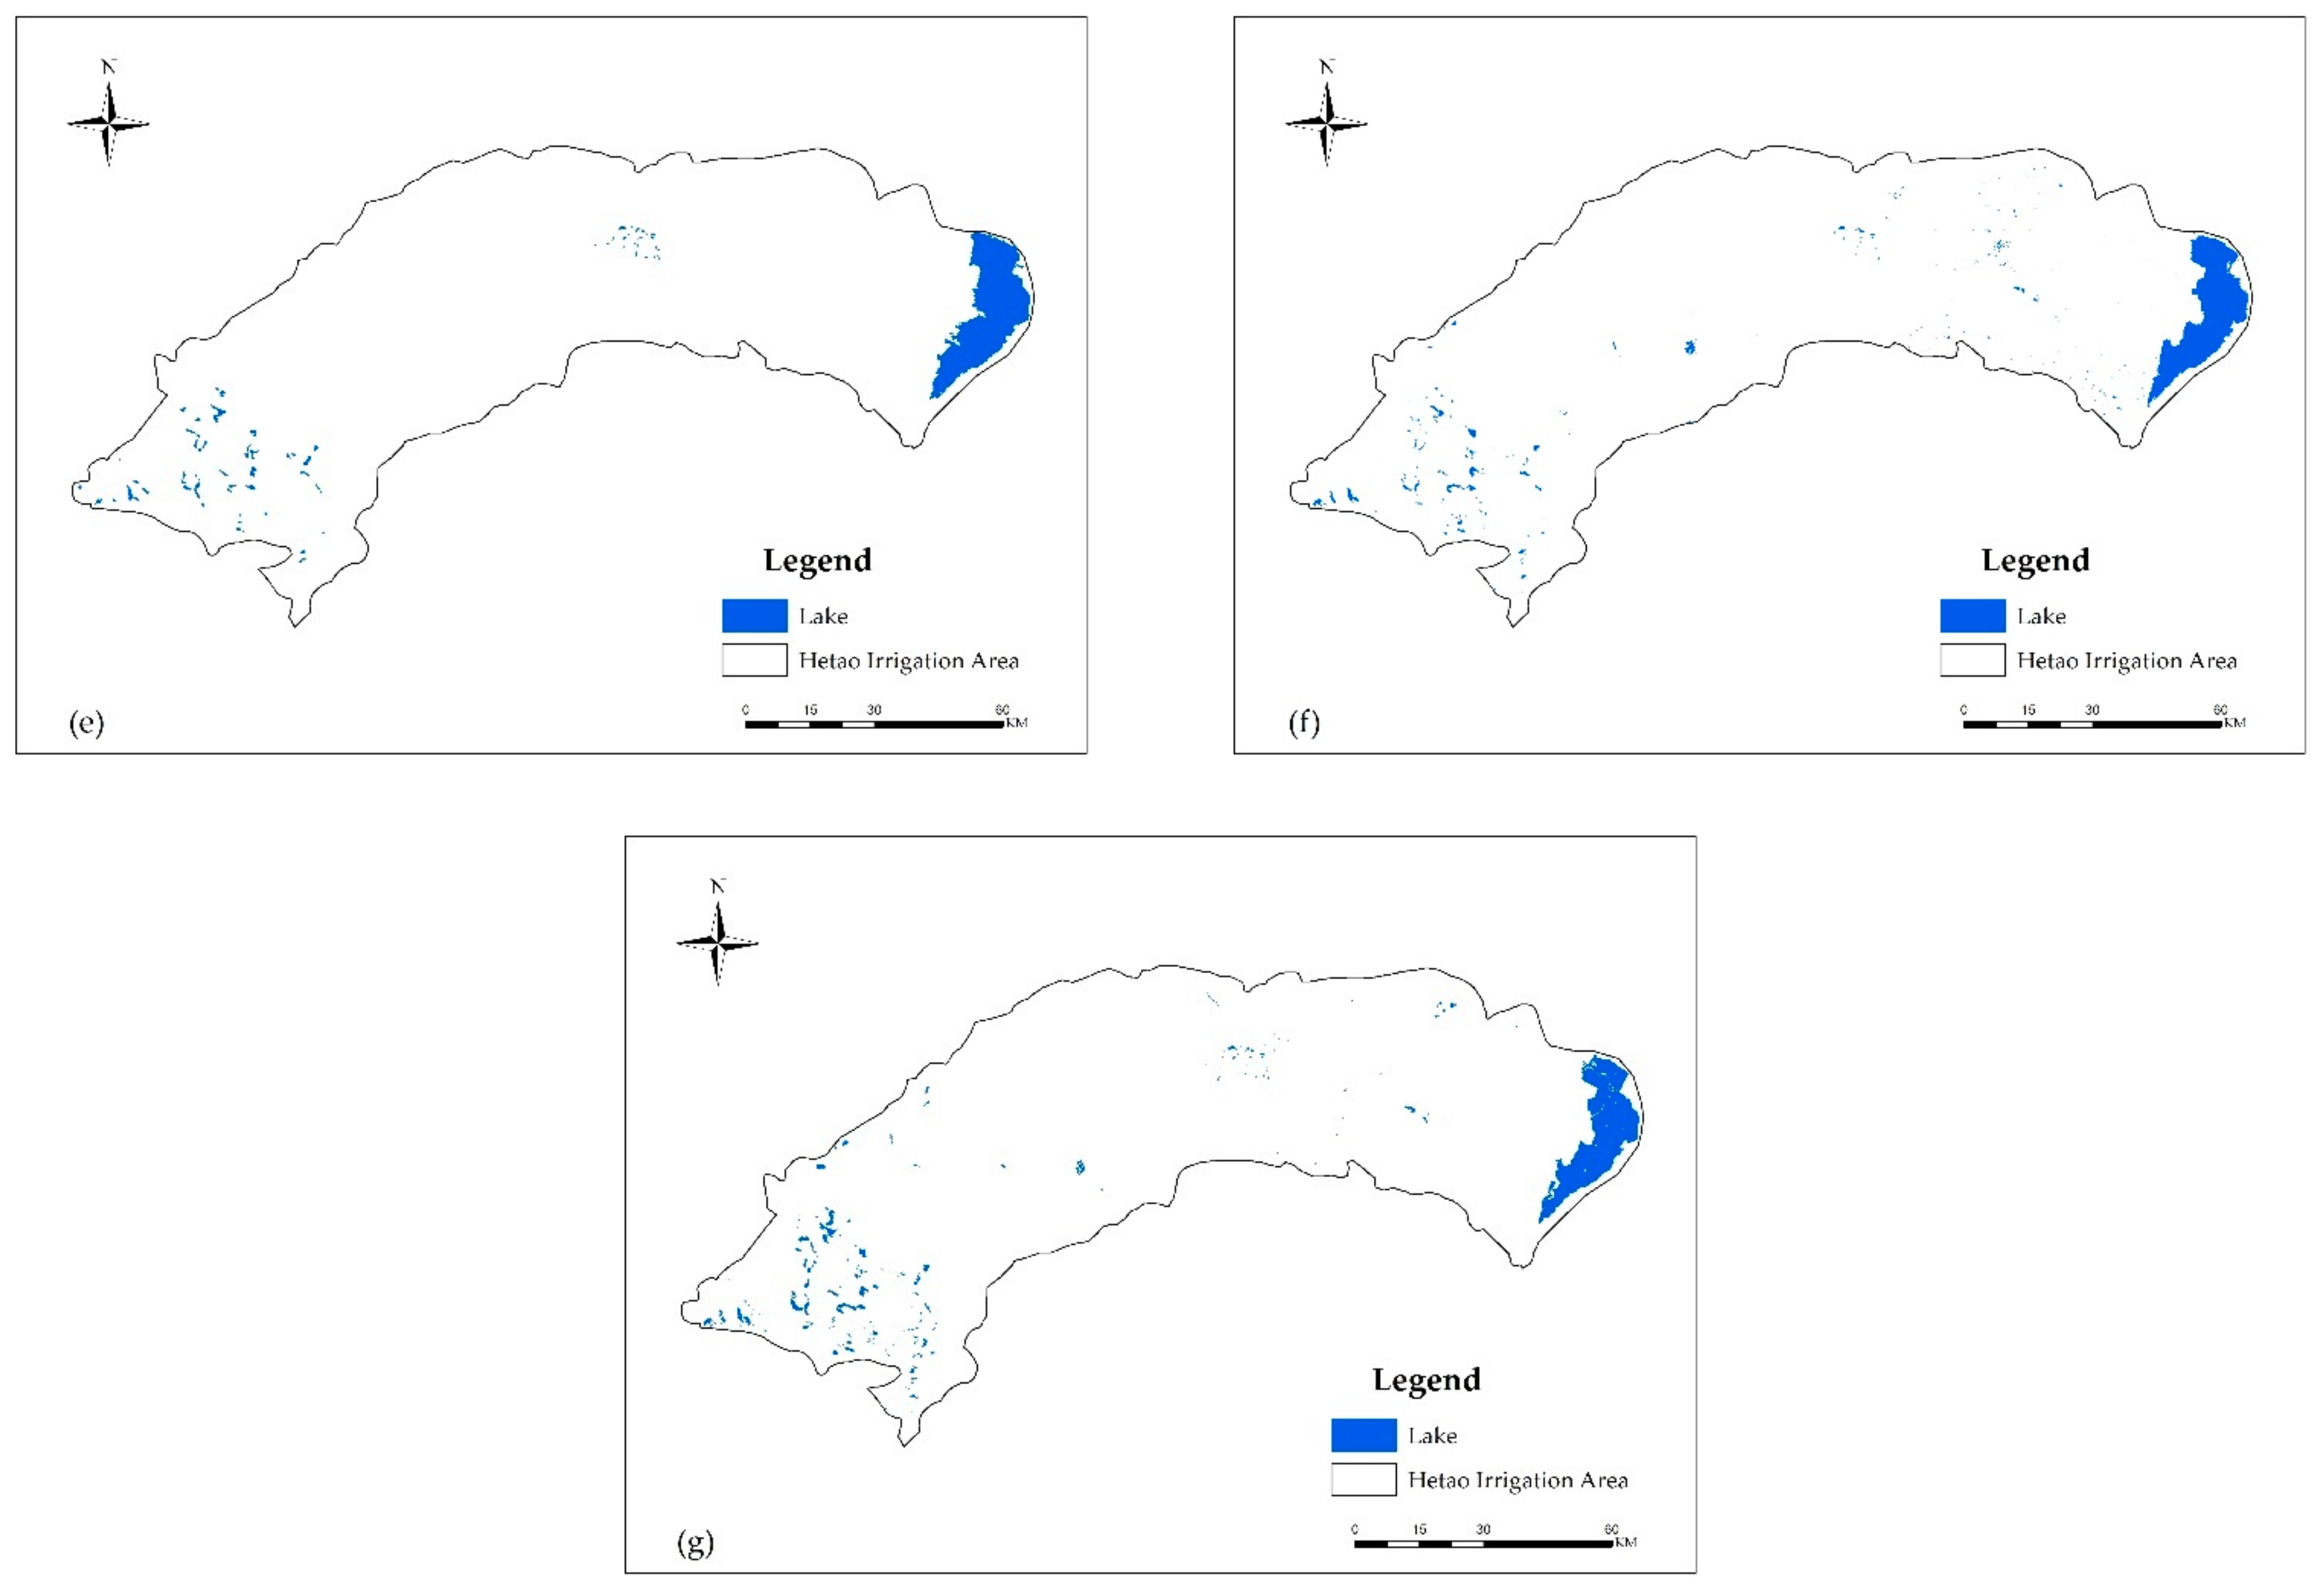
2.1. Study Area

The Yellow River basin in Inner Mongolia is located at the end of the upper reaches and the beginning of the middle reaches of the Yellow River (37°35′ N–41°50′ N, 106°10′ E–112°50′ E). The main stream flows from the estuary of the Dusitu River at the border of Ningxia and Inner Mongolia to the township of Mazha in Jungeer Banner, passing through 7 leagues and 42 banners and counties, including Alxa League, Wuhai, Bayan Nur, Ordos, Baotou, Hohhot, and Ulanqab (Figure 1). It has a total length of 843.5 km and a watershed area of 310,000 square kilometers (the watershed is divided from the “Ecological Protection and High-Quality Development Plan of the Yellow River Basin of Inner Mongolia Autonomous Region”). It serves as an important ecological security barrier in northern China.
The study area mainly consists of the Hetao Plain, the Tuamut Plain, and the Ordos Plateau. It has four distinct seasons, less precipitation, unequal interannual variation in precipitation in the basin, and uneven spatial distribution, and is characterized by high topography in the central and western part of the study area and low topography in the surrounding area. There are many different types of wetlands, the most common type being waters and marshes, as well as a diverse range of mineral resources.

2.2. Data Source and Processing

To obtain data on wetland cover types in the study area, we download Landsat TM and Landsat8 OLI remote sensing images from 1990 to 2020 as the primary data source (“China Geospatial Data Cloud” website). The acquisition of these images occurred from June to October, as wetland cover types can be easily identified during this period when plants are actively growing. The eCognition Developer 8.64 was used for wetland cover classification, adopting various remote sensing image classification methods such as the object-oriented classification method and the hierarchical classification method. Furthermore, the third national land survey data, field measurement data, and other ancillary data (DEM, photos, etc.) were used to increase classification accuracy. The socio-economic data were obtained from the Statistical Yearbook of Inner Mongolia. Referring to the research results of the Ramsar Convention and the national standard for wetland classification in China, the wetland types in the study area were classified into 3 primary categories and 10 secondary categories (Table 1). The wetland classification results were then edited by ENVI5.3 and ArcGIS10.7 software for the subsequent calculation of ecosystem service value and dynamic analysis.

2.3. Landscape Metrics Analysis

Landscape metrics are quantitative indicators that can condense and reflect the structural composition and spatial configuration properties of a landscape pattern. These metrics can reflect not just the nature and evolution of landscape patterns, but also the changes in those patterns through time and the fundamental relationships between landscape activities. With the use of FRAGSTATS4.2 software and the features of the landscape pattern in the study region, a total of six landscape pattern indices were chosen to assess the changing characteristics of the landscape pattern of wetlands in the Yellow River Basin of Inner Mongolia in this work (Table 2).

2.4. Methods to Quantify Wetland Ecosystem Service Values

Referring to the Costanza [13] classification, the MA Millennium Ecosystem Assessment classification [29], and combining the characteristics of wetland types, structures, and ecological processes in the Yellow River Basin of Inner Mongolia [30], it is divided into four primary types and nine secondary types (Table 3).
Wetland ecosystem service value equivalent factors paired with wetland ecosystem service equivalent factors can be used to assess and describe the potential contribution capability of various wetland types to wetland ecological services. Xie et al. [31] originally proposed the ecosystem services value unit area of Chinese terrestrial ecosystem based on the work by Costanza et al. Based on Xie’s equivalence factor method [18], the economic value of an ecosystem service value equivalent was calculated as the economic value of 1 hm2 of nationally average-yielding farmland’s annual natural food production, and the economic value of an ecosystem service value equivalent was determined to be 3406.5 yuan/hm2. Because Xie’s study results represent the national average of ecosystem service value, one ecosystem service value equivalent must be revised in time and location to account for the difference in grain production levels in Inner Mongolia and the national grain production level.
The equivalent benchmark was calculated from the national in time as the ratio of grain area production in Inner Mongolia Autonomous Region to the national as a revision factor by the following method.
λ   =   P P O
E i   =   λ   ×   E o i
where λ is the regional revision coefficient; P and P O are the average area yield of grain in Inner Mongolia Autonomous Region and the national average area yield of grain, respectively; E i is the ecological service function equivalent of wetland type i after the regional revision; E o i is the national average ecological service function equivalent of wetland type i; i = 1,2,…, corresponding to reservoirs, ponds, rivers, lakes, grassy meadows, saline meadows, herbaceous marshes, woody wetlands, bare ground, and saline bare ground.
The revised coefficients of the above equation were used to compute the ecological service value equivalent per unit area of each wetland type in the research region, and the ecosystem service value of wetlands in the Yellow River Basin of Inner Mongolia was estimated using the following equation.
E s v   =   i = 1 n A i   ·   V C i
E s v f   =   i = 1 n A i   ·   V C , f i
V C i   =   f = 1 k E C , f   ·   E a
where E s v is the value of ecosystem services; A i is the area (hm2) of the ith wetland type; V C i is the ecosystem service value coefficient of the ith wetland type, i.e., the value of ecosystem services per unit area (yuan/hm2 a); E s v f is the value of the fth ecosystem service; V C , f i is the value of the fth ecosystem service of the ith wetland type; E C , f is the value equivalent of the fth ecosystem service of a particular wetland type; E a is 1 standard equivalent ecosystem service value.

2.5. Landscape Metrics and Wetland Ecosystem Service Value Correlation Analysis

The correlation coefficients between landscape index and wetland ecosystem service value were calculated using SPSS software, and the impact of landscape index alterations on wetland ecosystem service value was examined.

3. Results

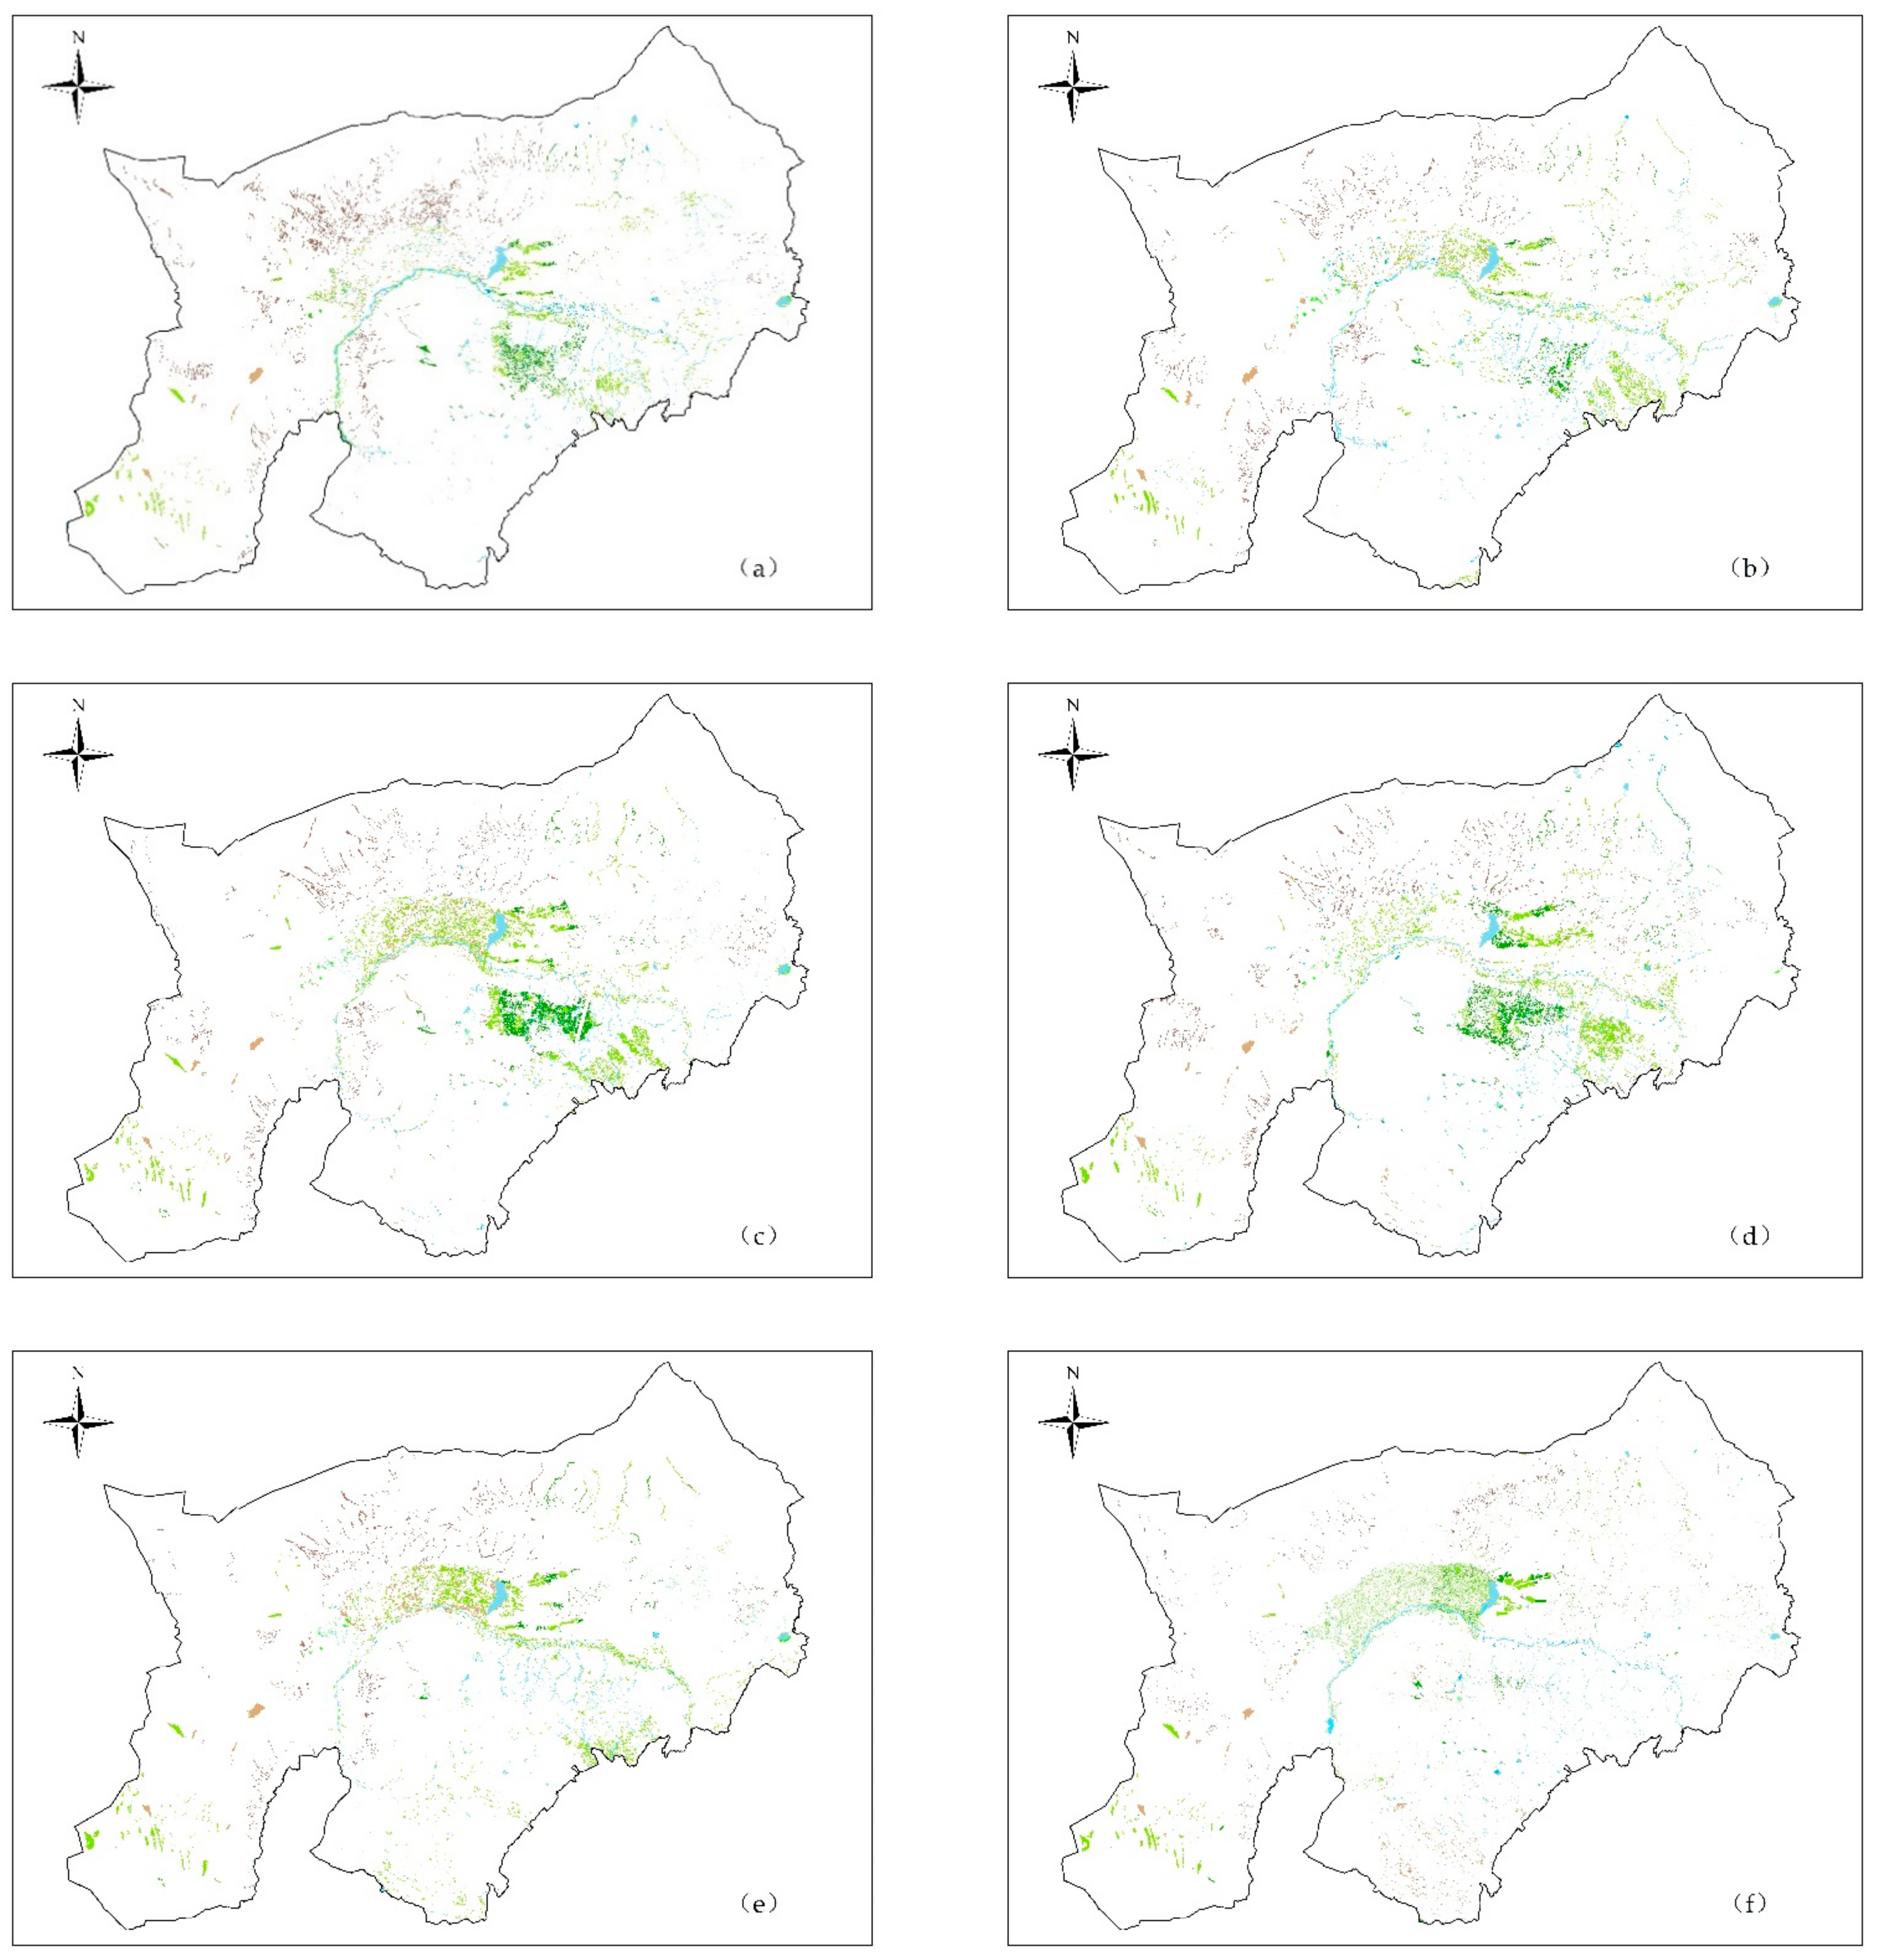
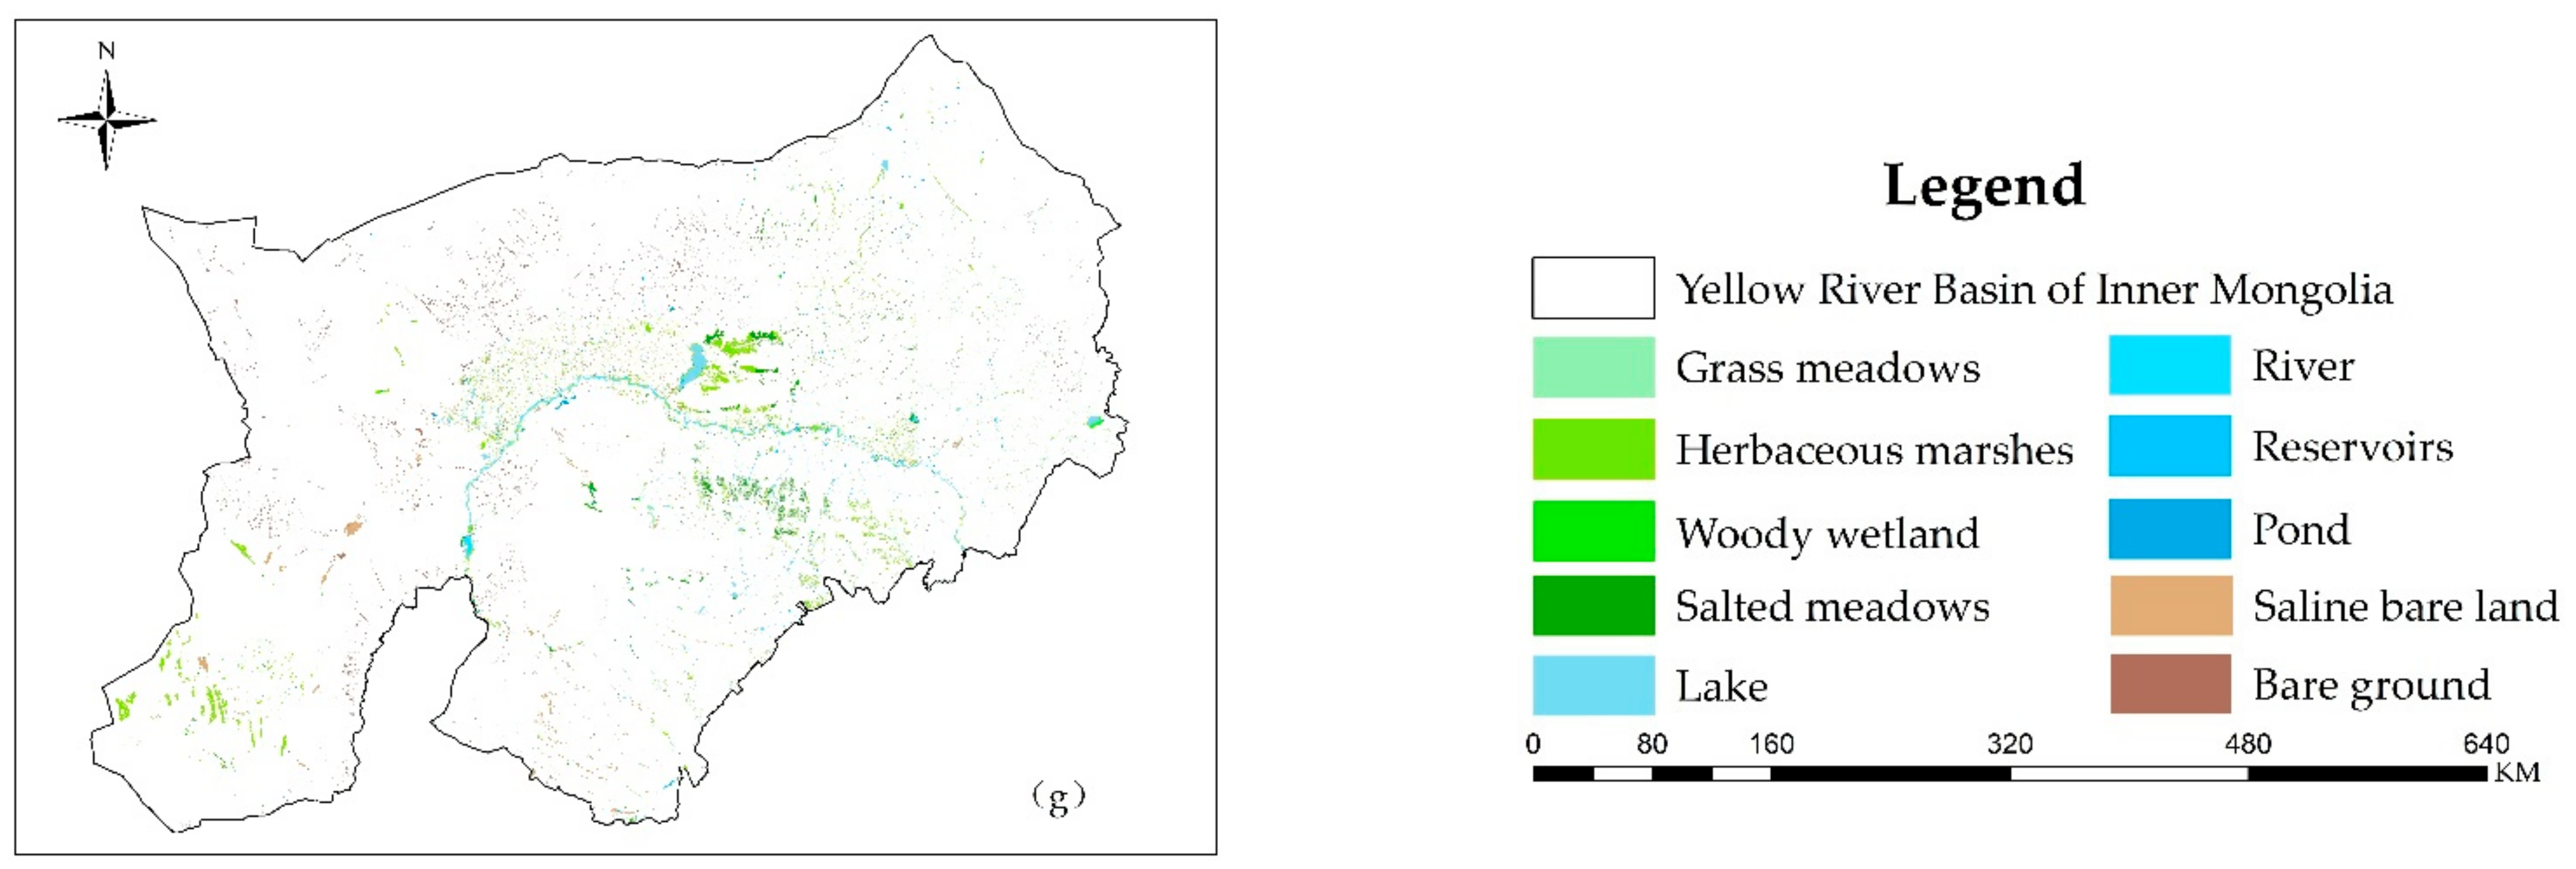
3.1. Changes in the Landscape Patterns

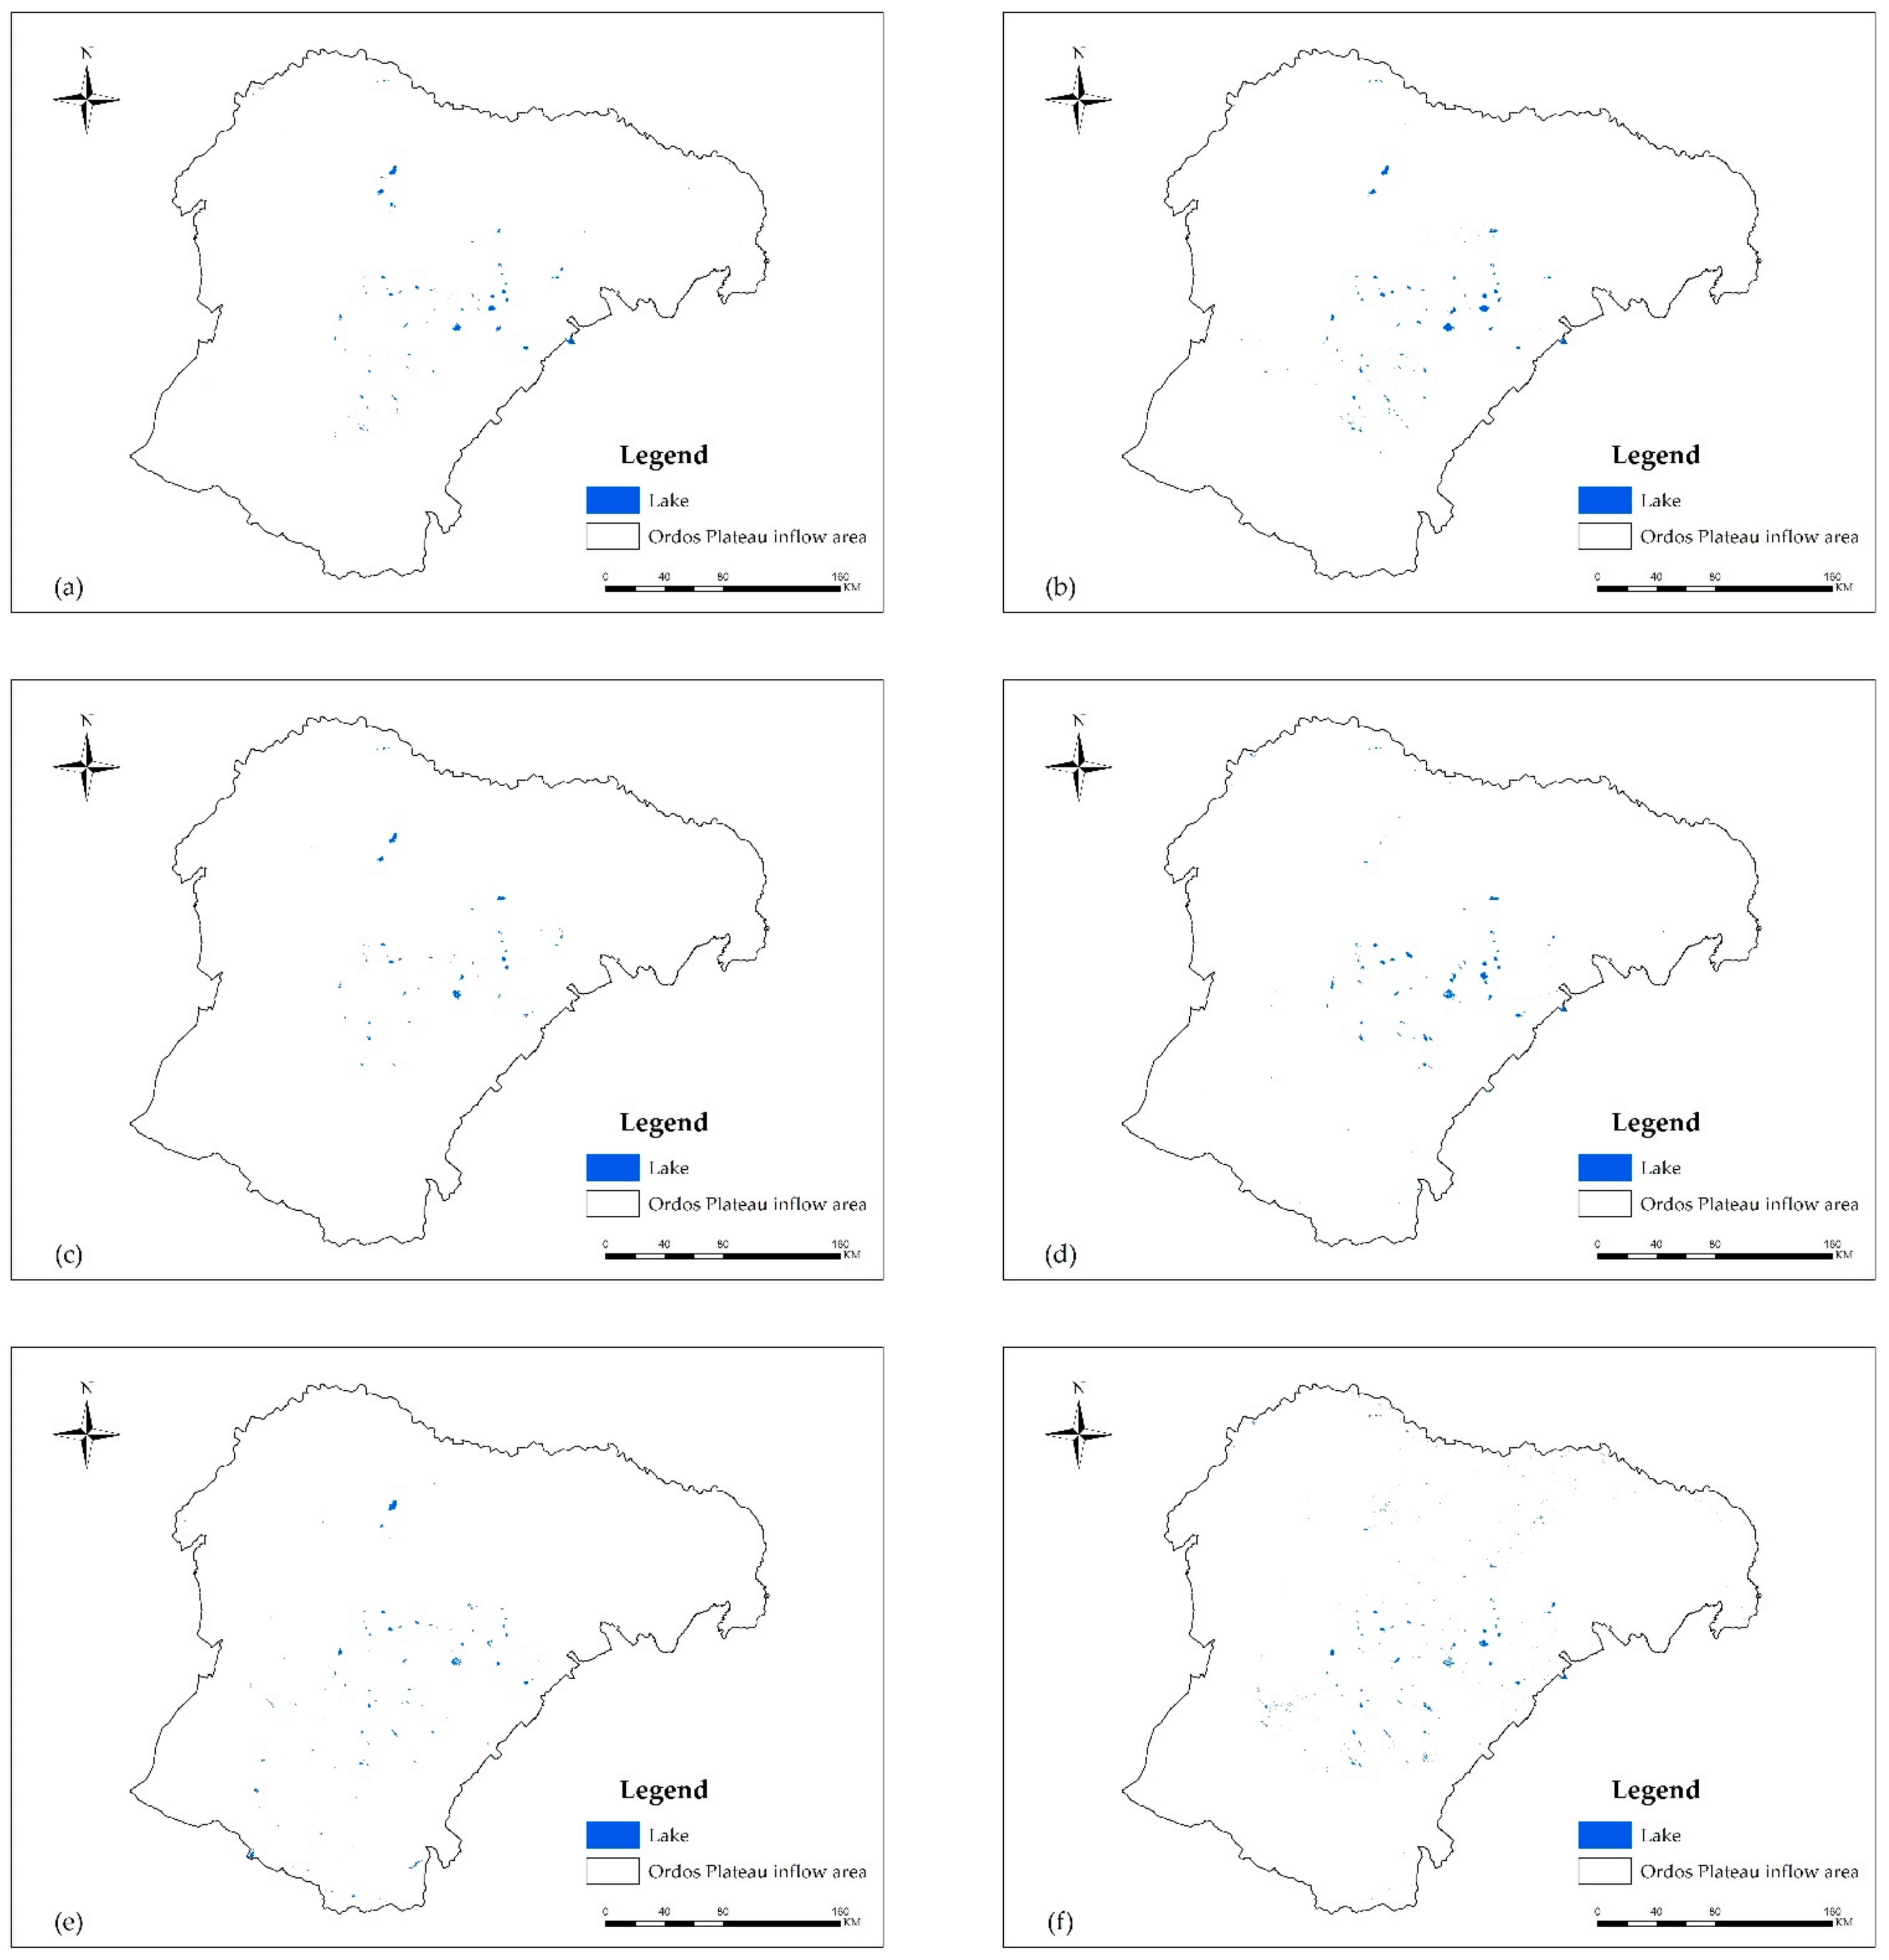
3.1.1. Area Change in Wetland Types

The extent of wetlands in the Yellow River Basin of Inner Mongolia has changed dramatically with the development of the economy and society, which is mostly represented in the alteration in the area of each wetland landscape type (Figure 2).
From 1990 to 2020, the wetlands in the Yellow River Basin of Inner Mongolia mainly consisted of beach wetlands, beach bare lands and water bodies, as illustrated in Table 4. Table 4 shows that the total area of wetlands in the Yellow River Basin of Inner Mongolia decreased from 1990 to 2020, with the area of beach wetlands accounting for nearly half of the total area of the study area, with the area of herbaceous marshes being the largest and the area of woody wetlands being the smallest. In the beach area, the area of bare land was the largest and the area of saline bare land was the smallest. Rivers and lakes accounted for the most water area, followed by ponds and reservoirs.
From 1990 to 2020, the water area of wetlands in the Yellow River Basin of Inner Mongolia decreased by 625.36 km2, with the major decline in water area resulting from the decrease in rivers and lakes. Lakes, in contrast to rivers, not only regulate runoff but are also particularly sensitive to environmental changes and are more severely impacted by natural and human influences. The Inner Mongolia Yellow River Basin wetland ecosystem’s lakes are mostly found in the Ordos Plateau’s inland flow area and the river-loop irrigation area. The lakes in the endorheic zone of Ordos Plateau decreased in size during the study period, with a total reduction of 27.26 km2 (Figure 3). This is because most of the lakes in the region are in the desert or sandy land, where water is lost due to shallow water, seepage, and high evaporation, and human interference causes the land to become sandy and the lakes to be eroded and degraded significantly. The lakes in the river-loop irrigation area follow the same trend as the lakes in the endorheic area of the Ordos Plateau, shrinking from 416.26 km2 in 1990 to 407.97 km2 in 2020 (Figure 4), owing to their location in the river-loop plain, a large amount of water diversion for irrigation, and unscientific scheduling. As a result, the lakes shrink and degrade, agricultural surface source pollution is severe, and the lakes’ water ecological environment deteriorates. In general, the lake area of the whole study region is shrinking to varying degrees, with substantial lake shrinkage and deterioration.

3.1.2. Change in Landscape Metrics

Table 5 shows that the PD in the research region is growing, from 0.08 in 1990 to 0.10 in 2020, suggesting that the number of landscape patches in the study area is increasing and the landscape type is becoming more complex, with anthropogenic disturbance playing a major role. Overall, the DIVISION in the research region has not changed much over the past 30 years, but patch density values are growing, indicating that the landscape has fragmented and the landscape type structure has become more complicated. The ED in the study area is decreasing, but the magnitude of the decrease is not obvious, and the distribution of landscape patches is becoming more and more continuous. It did not show a single increasing trend, but rather an increasing and decreasing trend, indicating that the patch shapes have become more complex and diverse. The CONTAG of the study area increased from 45.23 in 1990 to 52.31 in 2010, indicating good connectivity among landscape types, and then declined, indicating that the degree of patch fragmentation in the research region has risen, the dominant function of the original landscape was no longer obvious, and connectivity among landscape types weakened. The SHDI has decreased and then increased over the past 30 years, from 1.83 in 1990 to 1.91 in 2020, which is still an increasing trend overall; the SHEI has followed the same trend as the SHDI, with a small decrease from 1990 to 2000 and an increase from 0.69 to 0.83 in 2010. The general trend is upward, showing that the study area’s diversity of landscape types has expanded and the landscape structure has grown increasingly complex over the past 30 years. The increase in SHEI value implies that the previously dominating landscape’s position in the study area is diminishing; the area has shrunk and the patch types in the landscape tend to be more evenly distributed and perform a more balanced function. As a result, from 1990 to 2020, the changes in wetlands in Inner Mongolia’s Yellow River Basin were marked by an overall increasing trend in PD, ED, SHEI, and SHEI, an overall decreasing trend in DIVISION, and an increasing and then decreasing trend in CONTAG.

3.2. Estimation of Ecosystem Service Values

3.2.1. Changes in Ecosystem Service Values of Different Wetland Categories

The estimation of wetland ecosystem service values of the Yellow River basin in Inner Mongolia is shown in Table 6. The total wetland ecosystem service values decreased from 3089.4 billion yuan in 1990 to 1943.35 billion yuan in 2020. The total value of wetland ecosystem services did not change significantly from 1990 to 1995, rapidly increased from 1995 to 2000, and decreased from 2000 to 2020, with the lowest value of wetland ecosystem services in the Yellow River Basin of Inner Mongolia at 194.335 billion yuan in 2020. The major decline in wetland ecosystem service values resulted from the decrease in rivers, lakes, and herbaceous marshes. The value of rivers decreased the most, by 58.651 billion yuan, and the value of woody wetlands changed the least, by 527 million yuan. Grassy meadows and reservoirs increased in the study periods, by 1.04 billion yuan and 996 million yuan, respectively. The value of bare land declined from 1990 to 1995, increased from 1995 to 2000, and then began to decline year by year until 2005, with a total loss of 123 million yuan in 30 years. Slight changes were observed for the value of saline bare land between 1990 and 2020, with a decrease of only 0.07 billion yuan in 30 years.
Herbaceous marshes, rivers, and lakes are the three landscape types that contribute the most to the total value of the study area, as shown in Table 6. As a result, the service value generated by these three landscapes accounts for the majority of the overall value, and these three landscape types are also the dominant landscapes in this study area.

3.2.2. Changes in the Value of Different Ecosystem Service Functions

We also estimated the value of ecosystem services provided by individual ecosystem functions (Table 7). The value of supply services and regulation services slightly decreased from 1990 to 1995, and then increased from 1995 to 2000, after which the value continued to decrease. Product supply, water supply, gas regulation, climate regulation, and environmental purification were the secondary types of wetland ecosystem services that declined. The support services value increased from 15.262 billion yuan in 1990 to 19.447 billion yuan in 2020, with the value of soil conservation and nutrient cycling services declining. The biodiversity protection was the secondary type of wetland ecosystem services that had the highest increase in wetland ecosystem service value between 1990 and 2020, with a gap of 13.439 billion yuan, compensating for the loss in value of the other two functions, resulting in an increase in the value of primary type support services. The most significant change in value was in the aesthetic landscape function, which decreased by 11.853 billion yuan, and the least significant change was in the value of product supply, which decreased by 1.378 billion. In total, these wetland ecosystem services apparently increased between 1995 and 2000 but declined after that. This is because the area of each wetland type in the study region increased from 1995 to 2000, and then began to increase or decline after 2000, with the increase being smaller than the decrease, causing the value data to reflect a falling trend year after year.
When the value of each individual service function was compared to the total value of wetland ecosystem services in the study area from 1990 to 2020, it was discovered that the contribution of maintaining biodiversity was the highest (≈20%), followed by water supply (≈18%), which was likely due to the high capacity of wetlands and water bodies to supply water and maintain biodiversity.

3.3. Correlation Analysis of Landscape Metrics and Ecosystem Service Values

Changes in landscape patterns had a significant effect on the value of wetland ecosystem services in the study area, but different landscape indices had different degrees and trends of influence on the value of wetland ecosystem services. Correlation analysis can reveal the mechanism of influence of landscape index on the value of wetland ecosystem services. From Table 8, the total value of wetland ecosystem services in the Yellow River Basin of Inner Mongolia is negatively correlated with PD and SHDI and positively correlated with CONTAG. This indicates that the higher the landscape fragmentation of wetland types and the richer the diversity of landscape types, the lower the value of wetland ecosystem services in the study area; the value of wetland ecosystem services in the study area increases with the aggregation of landscape type patches. In terms of the amount of value of individual ecosystem service functions, product supply, water supply, gas regulation, climate regulation, environmental purification, soil conservation, nutrient cycle maintenance, maintenance of biodiversity, and landscape aesthetic functions were also negatively correlated with PD and SHDI and positively correlated with CONTAG. This demonstrates that changes in landscape pattern have the same impact on the value of a single ecosystem service function as they do on the total value of the ecosystem. The value of each service function in the study area and the landscape pattern index are influenced by many factors such as ecosystem value coefficients and spatial scales due to the method of assessing ecosystem service values, so there is some correlation among the factors, but none are significant.

4. Discussion

Landscape pattern indices related to ecological processes can reflect changes in landscape composition and function. The total area of wetlands in Inner Mongolia’s Yellow River Basin has decreased over the past 30 years. The area of water in the floodplain has shrunk by 625.36 km2, the area of wetlands in the floodplain has shrunk by 137.48 km2, and the area of bare land in the floodplain has shrunk by 1445.76 km2. The majority of the landscape types in the study area, particularly lakes, rivers, and herbaceous swamps, were reduced to varying degrees. With the continued development of the economy and society, the population grows, and so does the demand for water. Farmland is constantly reclaimed in order to maximize profits, aquaculture ponds are constructed, and urban expansion consumes water and cultivated land. As economic and social development continues, the population grows, the demand for water rises, and the impact of human activities on wetlands worsens, such as the constant reclamation of farmland, the construction of additional breeding ponds, and urban expansion to occupy water bodies and farming land in search of high profits. In recent years, the temperature has risen, precipitation has decreased, and many Yellow River tributaries have been greatly reduced, and some have even dried up, resulting in the degradation and shrinkage of large areas of wetlands, particularly the most visible lake wetlands. This has resulted in a more fragmented landscape with irregular boundaries and an increased number of patches in the study area, which in turn affects the expression of the wetland ecosystem’s service functions, such as water supply and climate regulation due to the reduction in the water area [32], and biodiversity and habitat maintenance due to the reduction in the wetland area in the beach area [33,34]. From an overall perspective, the Shannon Diversity Index and Shannon Evenness Index are increasing, indicating that the structure of landscape types in the study area is complicated, the herbaceous marsh as the dominant landscape is not obvious, the distribution of each patch type in the study area is even, and the disturbance effect of human activities on the landscape pattern has become huge and far-reaching.
The method used to estimate the value of ecosystem services in this study was proposed by Costanza et al. [13] and refined by the Chinese scholar Xie [31], deriving ecosystem service value from multiplying the area of land use category and ecosystem value coefficient. As discussed in previous studies, the estimates from this method are crude and uncertain [35], which suggests that more credible assessment techniques and accurate value coefficients are needed in ecosystem service assessment. Here, we modified the biomass factor and socio-economic factor coefficient of the ecosystem service value scale based on the natural and socio-economic conditions of the Inner Mongolia district, and obtained the ecosystem service value scale of the district. This is more suitable for the evaluation of the ecosystem service value in the region, and the results are more accurate and reliable and better reflect the dynamic changes in the ecosystem service value in the Inner Mongolia district. Over these 30 years, the Yellow River Basin in Inner Mongolia has made great progress in economic development, but the level of ecosystem services is relatively low compared to the economic level and tends to decline. From 1990 to 2020, the total value of wetland ecosystem services in the Yellow River Basin of Inner Mongolia was decreasing, with the highest value of 401.932 billion yuan in 2000 and the lowest value of 194.335 billion yuan in 2020. The value of rivers decreased the most during the 30-year period, by 58.651 billion yuan. Although different assessment methods may lead to different estimates, these results can be compared with other international cities because the methodology used in this study is internationally recognized. For example, Wang [17] found that the watershed area was reduced due to encroachment by construction land in the Shunyi District, Beijing, from 2000 to 2008, resulting in a decrease in ecosystem service values in the study area. The results of the ecosystem service values assessed by Zou et al. [18] for Xi’an, by Shifaw et al. [36] for Pingtan Island of Fujian, and by Lin et al. [16] for Xiamen Island of Fujian also showed a decreasing trend, and the dynamic change characteristics of the wetland ecosystem service values in this study were similar.
The essence of changes in ecosystem service values is a concrete expression of changes in the dynamics of landscape patterns. Based on the changes in the area of different wetland types and wetland ecosystem service values in the Inner Mongolia Yellow River Basin, it can be seen that the ecological service values of rivers, lakes, and herbaceous marshes are important manifestations of the ecological functions of wetlands in the Inner Mongolia Yellow River Basin, and the significant decrease in the area of these three landscape types is the main reason for the decrease in wetland ecosystem service values in the study area. The sustainable development of the Yellow River Basin in Inner Mongolia is crucial. To avoid conflicts between economic development and ecological protection, we suggest that during the development and utilization of wetland resources, we should optimize the spatial configuration of the landscape; develop reasonable wetland utilization planning; focus on protecting rivers, lakes, and other landscapes with high ecosystem service values; reduce landscape fragmentation; and improve the value of regional wetland ecosystem services while developing the economy.
The value of wetland ecosystem services in this study was obtained by multiplying the area of land use and the ecosystem value coefficient, so both the ecosystem value coefficient and the area of land use are influential factors that should be considered in ecosystem service assessment. In this study, we focused on changes in ecosystem services, and coefficients tend to have a smaller effect on directional changes than estimates of ecosystem values, so the effect of coefficients is negligible. When categories represent ecosystem services, the spatial scale of measurement affects the extent of ecosystem services and their valuation [37]. Remote sensing images with a resolution of 30 m were used in this study. Higher-resolution data could increase the extent of each type of wetland, significantly adding to the value of ecosystem services. As a result, in future research, we should consider the scale dependence of ecosystem service valuation, choose more accurate data for support, investigate more credible valuation methods, and calculate more accurate and representative ecosystem value indices, so that the research results are more accurate and representative.

5. Conclusions

In this paper, we integrated the landscape index method, equivalent factor method, and a field survey to assess the changes in wetland landscape patterns and wetland ecosystem service values in the Inner Mongolia Yellow River Basin from 1990 to 2020, and then analyzed the impact of landscape pattern evolution on wetland ecosystem service value in the Inner Mongolia Yellow River Basin, drawing the following main conclusions.
In the period from 1990 to 2020, the total area of wetlands in the Yellow River Basin of Inner Mongolia decreased, with the water area decreasing by 625.36 km2, the area of beach wetlands decreasing by 137.48 km2, and the area of beach bare land decreasing by 1445.76 km2. From 1990 to 2020, the landscape fragmentation of wetlands in the Yellow River Basin of Inner Mongolia increased. The proportion of each landscape type in the study region tends to be balanced, and the distribution of each patch type tends to be more even.
From 1990 to 2020, the total value of wetland ecosystem services in Inner Mongolia’s Yellow River Basin decreased, reaching a high of 401.932 billion yuan in 2000 and a low of 194.335 billion yuan in 2020. Herbaceous marshes, rivers, and lakes are the prominent landscapes in the research region, and the study area’s principal service functions are to maintain biodiversity and water supply.
The total value of wetland ecosystem services in the Yellow River Basin of Inner Mongolia is negatively correlated with PD and SHDI and positively correlated with CONTAG. This shows that the greater the wetland type’s landscape fragmentation and the more complex the patch shape, the lower the value of wetland ecosystem services in the study area, whereas the larger the dominant landscape type’s patch area and the higher the degree of aggregation, the higher the value of wetland ecosystem services in the study area.

Author Contributions

Conceptualization, L.W. (Lixin Wang), J.Y. and H.L.; methodology, J.Y. and Y.Z.; software, J.Y.; validation, L.W. (Lu Wen) and L.W. (Lixin Wang); formal analysis, J.Y. and H.L.; investigation, Z.X., X.C., L.M. and J.Y.; resources, L.W. (Lixin Wang); data curation, J.Y.; writing—original draft preparation, J.Y.; writing—review and editing, J.Y. and H.L.; visualization, J.Y.; supervision, L.W. (Lixin Wang); project administration, L.W. (Lixin Wang); funding acquisition, L.W. (Lixin Wang) and L.W. (Lu Wen). All authors have read and agreed to the published version of the manuscript.

Funding

This work is funded by National Natural Science Fund, P.R. China (No. 32160279, 3211101852 and 31960249) and the Science and Technology Major Project of Inner Mongolia (No. ZDZX2018054, 2021ZD0011).

Institutional Review Board Statement

Not applicable.

Informed Consent Statement

Not applicable.

Data Availability Statement

Not applicable.

Conflicts of Interest

The authors declare no conflict of interest.

References

  1. Arowolo, A.O.; Deng, X. Land use/land cover change and statistical modelling of cultivated land change drivers in Nigeria. Reg. Environ. Chang. 2018, 18, 247–259. [Google Scholar] [CrossRef]
  2. Ramsar, B. Climate Change and Wetlands: Impacts, Adaptation and Mitigation. Environ. Manag. 2002, 6, 18–26. [Google Scholar]
  3. Spencer, C.; Robertson, A.; Curtis, A. Development and testing of a rapid appraisal wetland condition index in south-eastern Australia. J. Environ. Manag. 1998, 54, 143–159. [Google Scholar] [CrossRef]
  4. Mooney, H.A.; Duraiappah, A.; Larigauderie, A. Evolution of natural and social science interactions in global change research programs. Proc. Natl. Acad. Sci. USA 2013, 110, 3665–3672. [Google Scholar] [CrossRef] [Green Version]
  5. Zhang, X.Y.; Lv, X.G. A review of research on the valuation of wetland ecosystem services. For. Resour. Manag. 2006, 5, 6. [Google Scholar]
  6. Tan, P. Exploring the importance of wetland conservation and wetland restoration. Resour. Conserv. Environ. Prot. 2014, 3, 142–143. [Google Scholar]
  7. Peters, C.M.; Gentry, A.H.; Mendelsohn, R.O. Valuation of an Amazonian rainforest. Nature 1989, 339, 655–656. [Google Scholar] [CrossRef]
  8. Brouwer, R.; Langford, I.H.; Bateman, I.J.; Turner, R.K. A Meta-analysis of wetland contingent valuation studies. Reg. Environ. Chang. 1999, 1, 47–57. [Google Scholar] [CrossRef]
  9. Costanza, R.; D’Arge, R.; Groot, R.D.; Farberk, S.; Grasso, M.; Hannon, B.; Limburg, K.; Naeem, S.; O’Neill, R.V.; Paruelo, J.; et al. The value of the world’s ecosystem services and natural capital. Nature 1997, 387, 253–260. [Google Scholar] [CrossRef]
  10. Turner, R.K.; Paavola, J.; Coopera, P.; Farber, S.; Jessamya, V.; Georgiou, S. Valuing nature: Lessons learned and future research directions. Ecol. Econ. 2003, 46, 493–510. [Google Scholar] [CrossRef] [Green Version]
  11. Groot, R.S.D. Functions of Nature: Evaluation of Nature in Environmental Planning, Management and Decision-Making; Wolters-Noordhoff: Groningen, The Netherlands, 1992. [Google Scholar]
  12. Zorrilla-Miras, P.; Palomo, I.; Gómez-Baggethun, E.; Martín-López, B.; Lomas, P.L.; Montes, C. Effects of land-use change on wetland ecosystem services: A case study in the doana marshes (sw spain). Landsc. Urban Plan. 2014, 122, 160–174. [Google Scholar] [CrossRef]
  13. Bergh, J.C.; Barendregt, A.; Gilbert, A.J. Ecological Economic Analysis for Wetland Management Modelling and Scenario Evaluation of Land-Use; Cambridge University Press: Cambridge, UK, 2004. [Google Scholar]
  14. Constanza, R.; Cumberland, J.; Daly, H. An Introduction to Ecological Economics; St. Lucie Press: Boca Raton, FL, USA, 1998. [Google Scholar]
  15. Xie, G.D.; Yan, L.; Lu, C.X.; Xiao, Y.; Chen, C. An expert knowledge-based approach to valorization of ecosystem services. J. Nat. Resour. 2008, 23, 9. [Google Scholar]
  16. Tao, L.; Xue, X.; Shi, L.; Gao, L. Urban spatial expansion and its impacts on island ecosystem services and landscape pattern: A case study of the island city of Xiamen, Southeast China. Ocean Coast. Manag. 2013, 81, 90–96. [Google Scholar]
  17. Wang, C.; Hu, Y.C.; Lv, S.L. Study on the value of ecosystem services in Beijing based on land use change. China Agron. Bull. 2012, 28, 229–236. [Google Scholar]
  18. Zou, Y.; Zhou, Z.X. Impacts of landscape pattern evolution on ecosystem service values in Xian. J. Appl. Ecol. 2017, 28, 2629–2639. [Google Scholar]
  19. Zhou, Z.X. Impacts of agricultural landscape changes on ecological services in the context of urbanization. A case study of Xian metropolitan area. Geogr. Arid. Reg. 2015, 38, 1004–1013. [Google Scholar]
  20. Yu, Y.; Li, M.Y.; Han, X.L. Landscape pattern evolution and ecosystem service value response in border areas: The case of Yanbian Korean Autonomous Prefecture. Soil Water Conserv. Res. 2021, 28, 315–322. [Google Scholar]
  21. Xiao, J.S.; Qiao, B.; Chen, G.Q. Land use change and evolution of ecosystem service value in Maduo County of source region of the Yellow River. Acta Ecol. Sin. 2020, 40, 510–521. [Google Scholar]
  22. Tolessa, T.; Senbeta, F.; Kidane, M. The impact of land use/land cover change on ecosystem services in the central highlands of Ethiopia. Ecosyst. Serv. 2017, 23, 47–54. [Google Scholar] [CrossRef]
  23. Kozak, J.; Lant, C.; Shaikh, S.; Wang, G. The geography of ecosystem service value: The case of the Des Plaines and Cache River wetlands, Illinois. Appl. Geogr. 2011, 31, 303–311. [Google Scholar] [CrossRef]
  24. Brander, L.; Brouwer, R.; Wagtendonk, A. Economic valuation of regulating services provided by wetlands in agricultural landscapes: A meta-analysis. Ecol. Eng. 2013, 56, 89–96. [Google Scholar] [CrossRef]
  25. Su, S.; Rui, X.; Jiang, Z. Characterizing landscape pattern and ecosystem service value changes for urbanization impacts at an eco-regional scale. Appl. Geogr. 2012, 34, 295–305. [Google Scholar] [CrossRef]
  26. Liu, Q.; Chen, S.H.; Xia, T. Changes in the landscape pattern of the Yellow River Delta wetlands and its impact on ecosystem services. Adv. Mar. Sci. 2008, 26, 464–470. [Google Scholar]
  27. Feng, H.Z. Assessment of the value of ecosystem service function in the Yellow River source area (I)–Estimation of the value of material production and teaching and research functions. Anhui Agric. 2013, 18, 7909–7911. [Google Scholar]
  28. Ding, H.; An, J.Z. Estimation of ecosystem service values in the upper Gannan section of the Yellow River. People’s Yellow River 2015, 37, 74–76. [Google Scholar]
  29. Zhao, S.D.; Zhang, Y.M.; Lai, P.F. Millennium Ecosystem Assessment Report Collection; China Environmental Science Press: Beijing, China, 2007. [Google Scholar]
  30. Woodward, R.T.; Wui, Y.S. The economic value of wetland services: A meta-analysi. Ecol. Econ. 2001, 37, 257–270. [Google Scholar] [CrossRef]
  31. Xie, G.D.; Zhang, C.X.; Zhang, L.M.; Chen, W.H.; Li, S.M. Improvement of ecosystem service valorization method based on unit area value equivalent factor. Nat. Resour. 2015, 8, 12. [Google Scholar]
  32. Long, J.A.; Nelson, T.A.; Wulder, M.A. Characterizing forest fragmentation: Distinguishing change in composition from configuration. Appl. Geogr. 2010, 30, 426–435. [Google Scholar] [CrossRef] [Green Version]
  33. Shrestha, R.P.; Schmidt-Vogt, D.; Gnanavelrajah, N. Relating plant diversity to biomass and soil erosion in a cultivated landscape of the eastern seaboard region of Thailand. Appl. Geogr. 2010, 30, 606–617. [Google Scholar] [CrossRef]
  34. Nagendra, H. Opposite trends in response for the Shannon and Simpson indices of landscape diversity. Appl. Geogr. 2002, 22, 175–186. [Google Scholar] [CrossRef]
  35. Limburg, K.E.; O’Neill, R.V.; Costanza, R.; Farber, S. Complex systems and valuation. Ecol. Econ. 2002, 41, 409–420. [Google Scholar] [CrossRef]
  36. Shifaw, E.; Sha, J.; Li, X. An insight into land-cover changes and their impacts on ecosystem services before and after the implementation of a comprehensive experimental zone plan in Pingtan island, China. Land Use Policy 2019, 82, 631–642. [Google Scholar] [CrossRef]
  37. Kreuter, U.P.; Harris, H.G.; Matlock, M.D.; Lacey, R.E. Change in ecosystem service values in the San Antonio area, Texas. Ecol. Econ. 2001, 39, 333–346. [Google Scholar] [CrossRef]
Figure 1. Geographical location of the Yellow River Basin in Inner Mongolia.
Sustainability 14 06328 g001
Figure 2. Distribution of wetland landscape pattern in the Yellow River Basin of Inner Mongolia in (a) 1990; (b) 1995; (c) 2000; (d) 2005; (e) 2010; (f) 2015; (g) 2020.
Sustainability 14 06328 g002aSustainability 14 06328 g002b
Figure 3. Distribution map of lakes in the inner flow area of the Ordos Plateau in (a) 1990; (b) 1995; (c) 2000; (d) 2005; (e) 2010; (f) 2015; (g) 2020.
Sustainability 14 06328 g003aSustainability 14 06328 g003b
Figure 4. Distribution map of lakes in the Hetao Irrigation Area in (a) 1990; (b) 1995; (c) 2000; (d) 2005; (e) 2010; (f) 2015; (g) 2020.
Sustainability 14 06328 g004aSustainability 14 06328 g004b
Table 1. Wetland landscape types in the Yellow River Basin of Inner Mongolia.
Primary TypeWaterBeach Bare LandBeach Wetlands
Secondary TypeRiverLakesReservoirsPondBare GroundSaline Bare LandHerbaceous MarshesWoody WetlandSalted MeadowsGrass Meadows
Basic featuresWater flowing frequently along narrow hollowsNatural depressions for water storageArtificial wetland built for water storage and power generationArtificial wetland constructed for irrigation farmingRiver floodplains, unvegetated land in the lakeside zoneSalinized bare land in riverine and lakeside zonesHerb-dominated swamps with ≥30% vegetation coverNatural wetlands dominated by tamariskMeadows dominated by saline vegetation, distributed on saline riverbanks or lakeshoresTransitional type of typical meadow to marsh vegetation
Table 2. Landscape level index indicators and ecological significance.
NumberIndicatorsAbbreviationsEcological Significance and InterpretationScope
1Patch DensityPDThe fragmentation of patch types can reflect the heterogeneity and fragmentation of the landscape as a whole, reflecting the heterogeneity on the landscape unit area.PD > 1
2Edge DensityEDThe total length of all patch boundaries in the landscape divided by the total area of the landscape, reflecting the complexity of the boundary shape.ED ≥ 0
3Landscape Division IndexDIVISIONMeasure of landscape separability, with higher values indicating a higher degree of landscape separation.0 < DIVISION ≤ 100
4Contagion IndexCONTAGIt describes the degree of clustering or extension trend of different patch types in the landscape, and can reflect the spatial configuration characteristics of landscape components.0 < CONTAG ≤ 100
5Shannon Diversity IndexSHDIThis indicator reflects landscape heterogeneity and is particularly sensitive to the non-equilibrium distribution status of each tessellation type in the landscape, i.e., it emphasizes the contribution of rare tessellation types to the information.SHDI > 0
6Shannon Evenness IndexSHEIReflects the degree of uniformity in the area distribution of each patch type in the landscape type.0 ≤ SHEI ≤ 1
Table 3. Indicator system for evaluating the value of ecosystem service functions of wetlands in the Yellow River Basin.
Service FunctionsEvaluation IndicatorsIndicator Description
ProvisionRaw material supplyDirect availability of products that can be used as raw materials
Water supplyIndustrial, agricultural, and domestic water supply
RegulationGas regulationCarbon sequestration and oxygen release
Climate regulationRegulating temperature
Purifying the environmentAbsorbs harmful gases, purifies water, etc.
SupportSoil conservationMaintaining soil fertility
Maintaining nutrient circulationNutrient storage, internal circulation, and access
Maintaining biodiversitySpecies of plant and animal resources that provide a habitat and breeding base
CultureTravel and leisureProvide opportunities for recreational activities
Table 4. Changes in the area of wetland landscape types in the Yellow River Basin of Inner Mongolia from 1990 to 2020.
1990199520002005201020152020
Area (km2)Percentage (%)Area (km2)Percentage (%)Area (km2)Percentage (%)Area (km2)Percentage (%)Area (km2)Percentage (%)Area (km2)Percentage (%)Area (km2)Percentage (%)
Beach wetlandsGrass meadows179.761.41243.342.14564.752.83509.522.59570.653.66531.283.49470.784.47
Herbaceous marshes3582.7928.144218.1537.015451.4627.274367.4822.164527.5329.063843.6725.223416.5132.47
Woody wetlands106.60.84134.91.1880.960.4176.80.3981.180.5273.980.4972.520.69
Salted meadows1542.4712.121128.379.92064.1110.332900.8514.721077.786.921903.0312.491314.3212.49
Beach bare landSaline bare land983.317.721056.39.273132.3715.672273.6811.541848.3711.861931.8112.681164.3911.07
Bare ground3408.7126.781944.1117.064008.6720.054784.7724.283383.121.712324.5415.251781.8716.93
WaterPond410.023.22297.552.61381.241.91726.933.69476.23.06487.843.2513.954.88
Lakes872.526.85848.017.441447.987.241571.527.971480.059.51749.3311.48723.846.88
River1598.4712.561492.8613.12816.1214.092416.9112.262064.7513.252330.9615.3981.919.33
Reservoirs45.990.3632.620.2941.860.2177.770.3970.170.4561.80.4181.940.78
Table 5. Landscape pattern index of wetland landscape levels in the Yellow River Basin of Inner Mongolia from 1990 to 2020.
YearPD (pcs/km2)EDCONTAGDIVISION (%)SHDISHEI
19900.07870.421745.23390.99661.82670.7933
19950.11090.383447.08990.99721.81180.7869
20000.0860.69848.46030.9931.70540.7406
20050.07080.275849.98050.98731.74760.759
20100.10790.491152.3070.99541.59680.6935
20150.09210.726836.82760.99611.89030.8209
20200.10040.408239.22530.99681.9110.8299
Table 6. Service value of each wetland type in the Yellow River Basin of Inner Mongolia from 1990 to 2020.
YearTypeGrass MeadowsHerbaceous MarshesSalted MeadowsRiverLakesReservoirsPondBare GroundSaline Bare LandWoody Wetlands
1990Value (billion yuan)94.5911.02999.961077.25588.0230.99276.322.010.588.70
Percentage (%)3.060.3632.3734.8719.041.008.950.070.020.26
1995Value (billion yuan)65.4614.121113.75951.78540.6520.80189.711.090.598.13
Percentage (%)2.250.4938.3032.7318.590.726.520.040.020.34
2000Value (billion yuan)104.8828.701260.671572.51808.5523.37212.881.961.534.27
Percentage (%)2.610.7131.4039.1720.140.585.300.050.040.12
2005Value (billion yuan)128.9922.66883.841181.03767.9238.00355.222.050.974.55
Percentage (%)3.810.6726.1034.8822.681.1210.490.060.030.15
2010Value (billion yuan)47.2525.02903.40994.81713.0933.81229.441.430.783.70
Percentage (%)1.600.8530.5833.6824.141.147.770.050.030.17
2015Value (billion yuan)78.5421.93721.991057.24793.4328.03221.270.920.773.14
Percentage (%)2.680.7524.6636.1127.100.967.560.030.030.14
2020Value (billion yuan)59.7721.41707.14490.74361.7640.95256.860.780.513.43
Percentage (%)3.071.1036.3825.2418.612.1113.210.040.030.21
Table 7. Value of various ecosystem services of wetlands in the Yellow River Basin of Inner Mongolia from 1990 to 2020.
YearTypeProvisionRegulationSupportCulture
Raw Material SupplyWater SupplyGas RegulationClimate RegulationPurifying the EnvironmentSoil ConservationMaintaining Nutrient CirculationMaintaining BiodiversityTravel and Leisure
1990Value (billion yuan)41.03181.7660.43135.49166.5773.3173.315.65204.43
Percentage (%)4.3619.306.4114.3817.687.787.780.6021.70
1995Value (billion yuan)39.84169.2560.33132.05160.3173.235.66213.29131.42
Percentage (%)4.0417.186.1213.4016.277.430.5721.6513.34
2000Value (billion yuan)52.59237.6976.55171.78215.3592.867.15259.90161.12
Percentage (%)4.1218.646.0013.4716.897.280.5620.3812.64
2005Value (billion yuan)43.85201.0462.73145.20178.5876.0976.095.86199.13
Percentage (%)4.4420.346.3514.6918.067.707.700.5920.14
2010Value (billion yuan)37.37176.2853.13118.87156.5364.444.96185.61115.76
Percentage (%)4.0919.315.8213.0217.157.060.5420.3312.68
2015Value (billion yuan)36.24176.1849.95115.93152.0460.594.67163.75102.51
Percentage (%)4.2020.445.8013.4517.647.030.5419.0011.89
2020Value (billion yuan)27.25112.4741.6292.58107.3550.523.91140.0485.90
Percentage (%)4.1217.006.2913.9916.237.640.5921.1712.98
Table 8. Correlation analysis of the landscape pattern index with the value of each ecosystem service function.
Wetland Ecosystem Service FunctionsPDEDCONTAGDIVISIONSHDISHEI
Raw material supply−0.4650.2430.568−0.505−0.514−0.514
Water supply−0.4870.3480.532−0.539−0.557−0.557
Gas regulation−0.4180.1670.582−0.451−0.477−0.478
Climate regulation−0.4920.1820.560−0.520−0.469−0.469
Purifying the environment−0.4530.2940.565−0.500−0.545−0.546
Soil conservation−0.4180.1670.582−0.450−0.477−0.477
Maintaining nutrient circulation−0.816 *0.5580.265−0.546−0.001−0.001
Maintaining biodiversity0.6810.6130.0030.375−0.219−0.219
Travel and leisure−0.778 *0.3460.502−0.563−0.248−0.248
ESV−0.691 **0.3260.628 **−0.462−0.684 *−0.544
** Significantly correlated at the 0.01 level (bilateral). * Significantly correlated at the 0.05 level (bilateral).
Publisher’s Note: MDPI stays neutral with regard to jurisdictional claims in published maps and institutional affiliations.

