
Implementation of Industry 4.0 Principles and Tools: Simulation and Case Study in a Manufacturing SME


Abstract
:1. Introduction
2. Literature Review
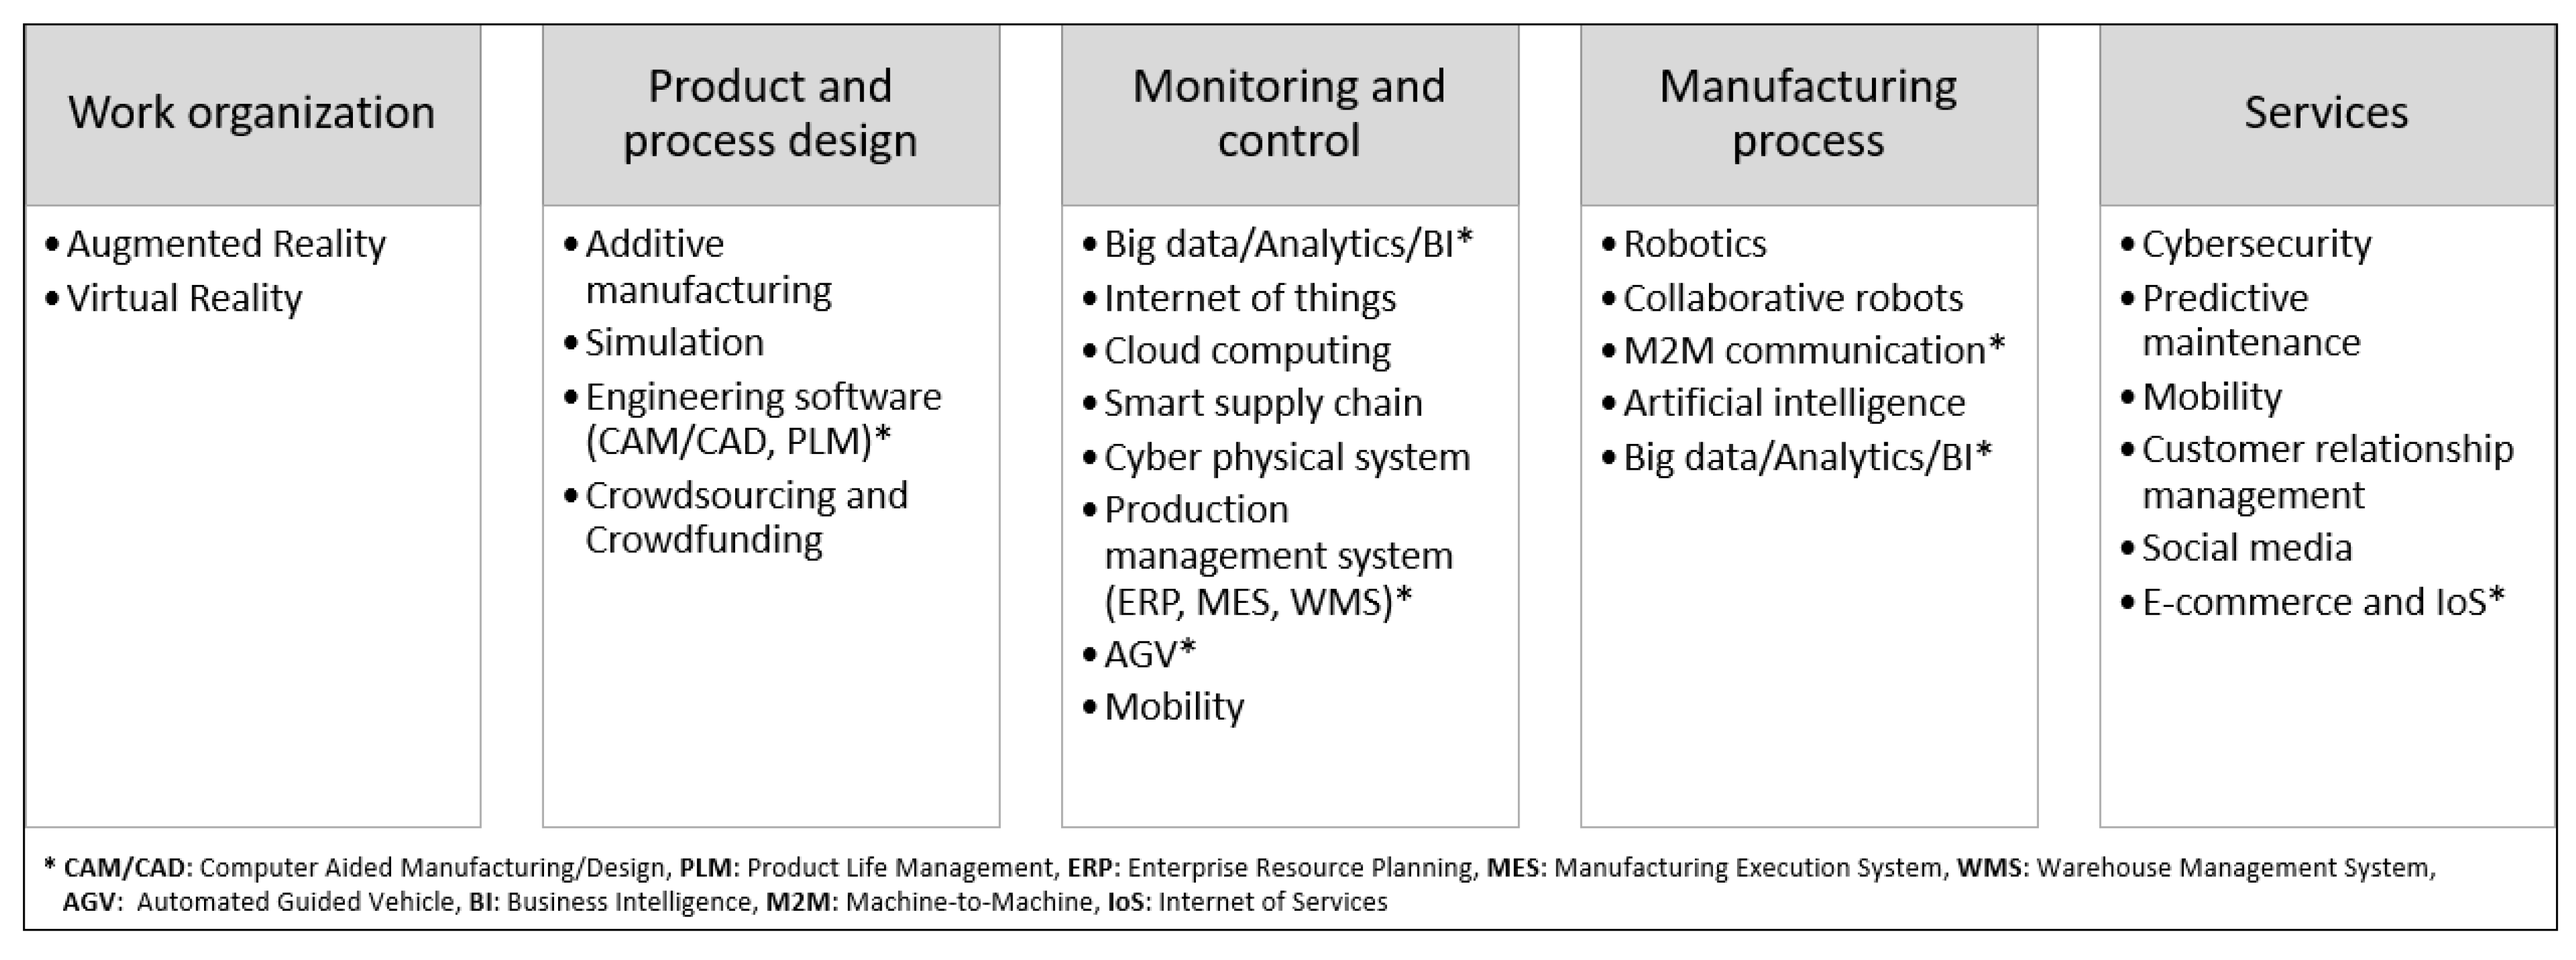
2.1. Industry 4.0
- Smart manufacturing enables digital end-to-end engineering [32];
2.2. Implementation Strategies for I4.0 Principles and Tools
3. Overview of a Manufacturing SME’s Approach
3.1. The I4.0 Implementation Strategy of MS
- Standardizing working methods;
- Developing skill matrices to ensure multidisciplinarity;
- Reducing set-up times using the SMED method;
- Implementing new gluing procedures to reduce drying time on the roof manufacturing cell (the bottleneck);
- Implementing the 5S to standardize tools, reduce research and unnecessary personnel movement, and make information available;
- Designing wheeled trucks to replace lift trucks to reduce travel between production line cells.
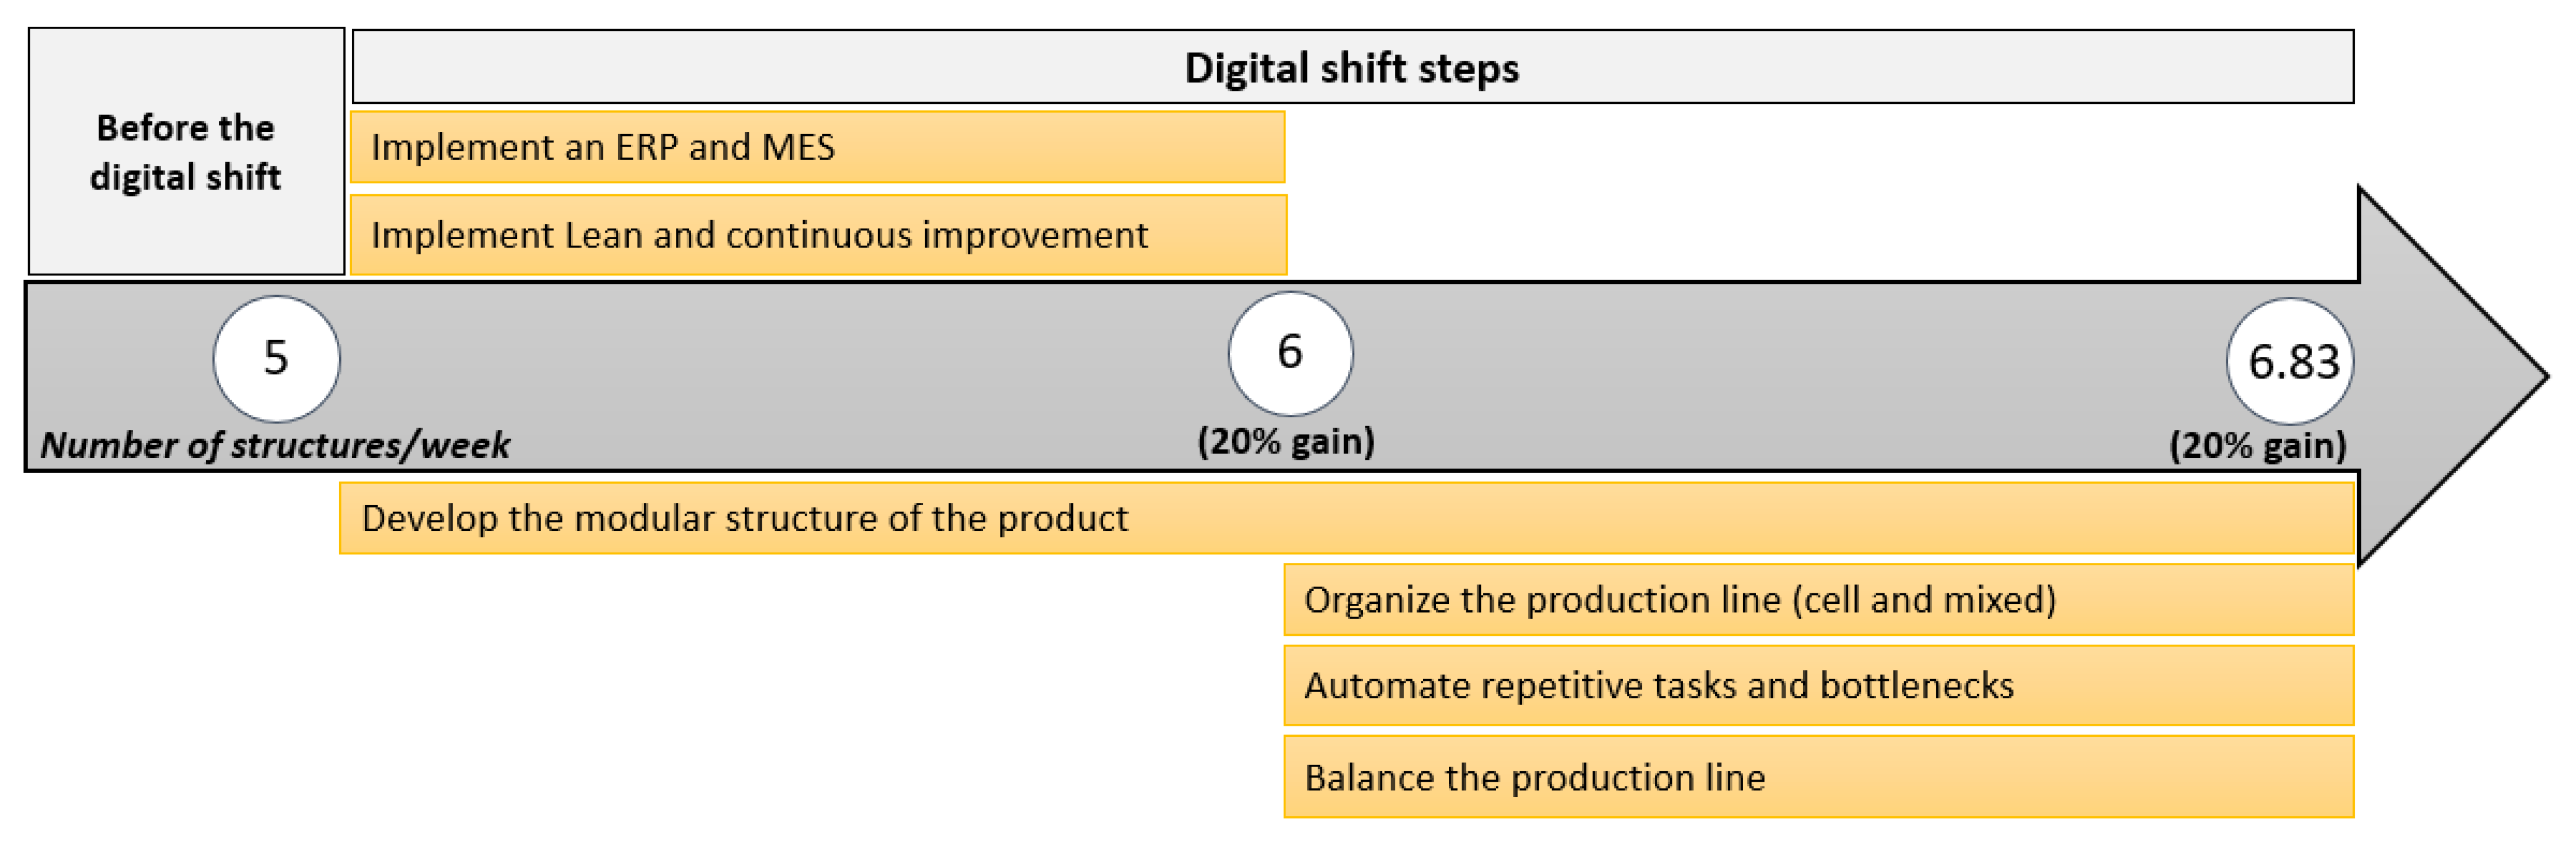
- Developing the modular structure of the product;
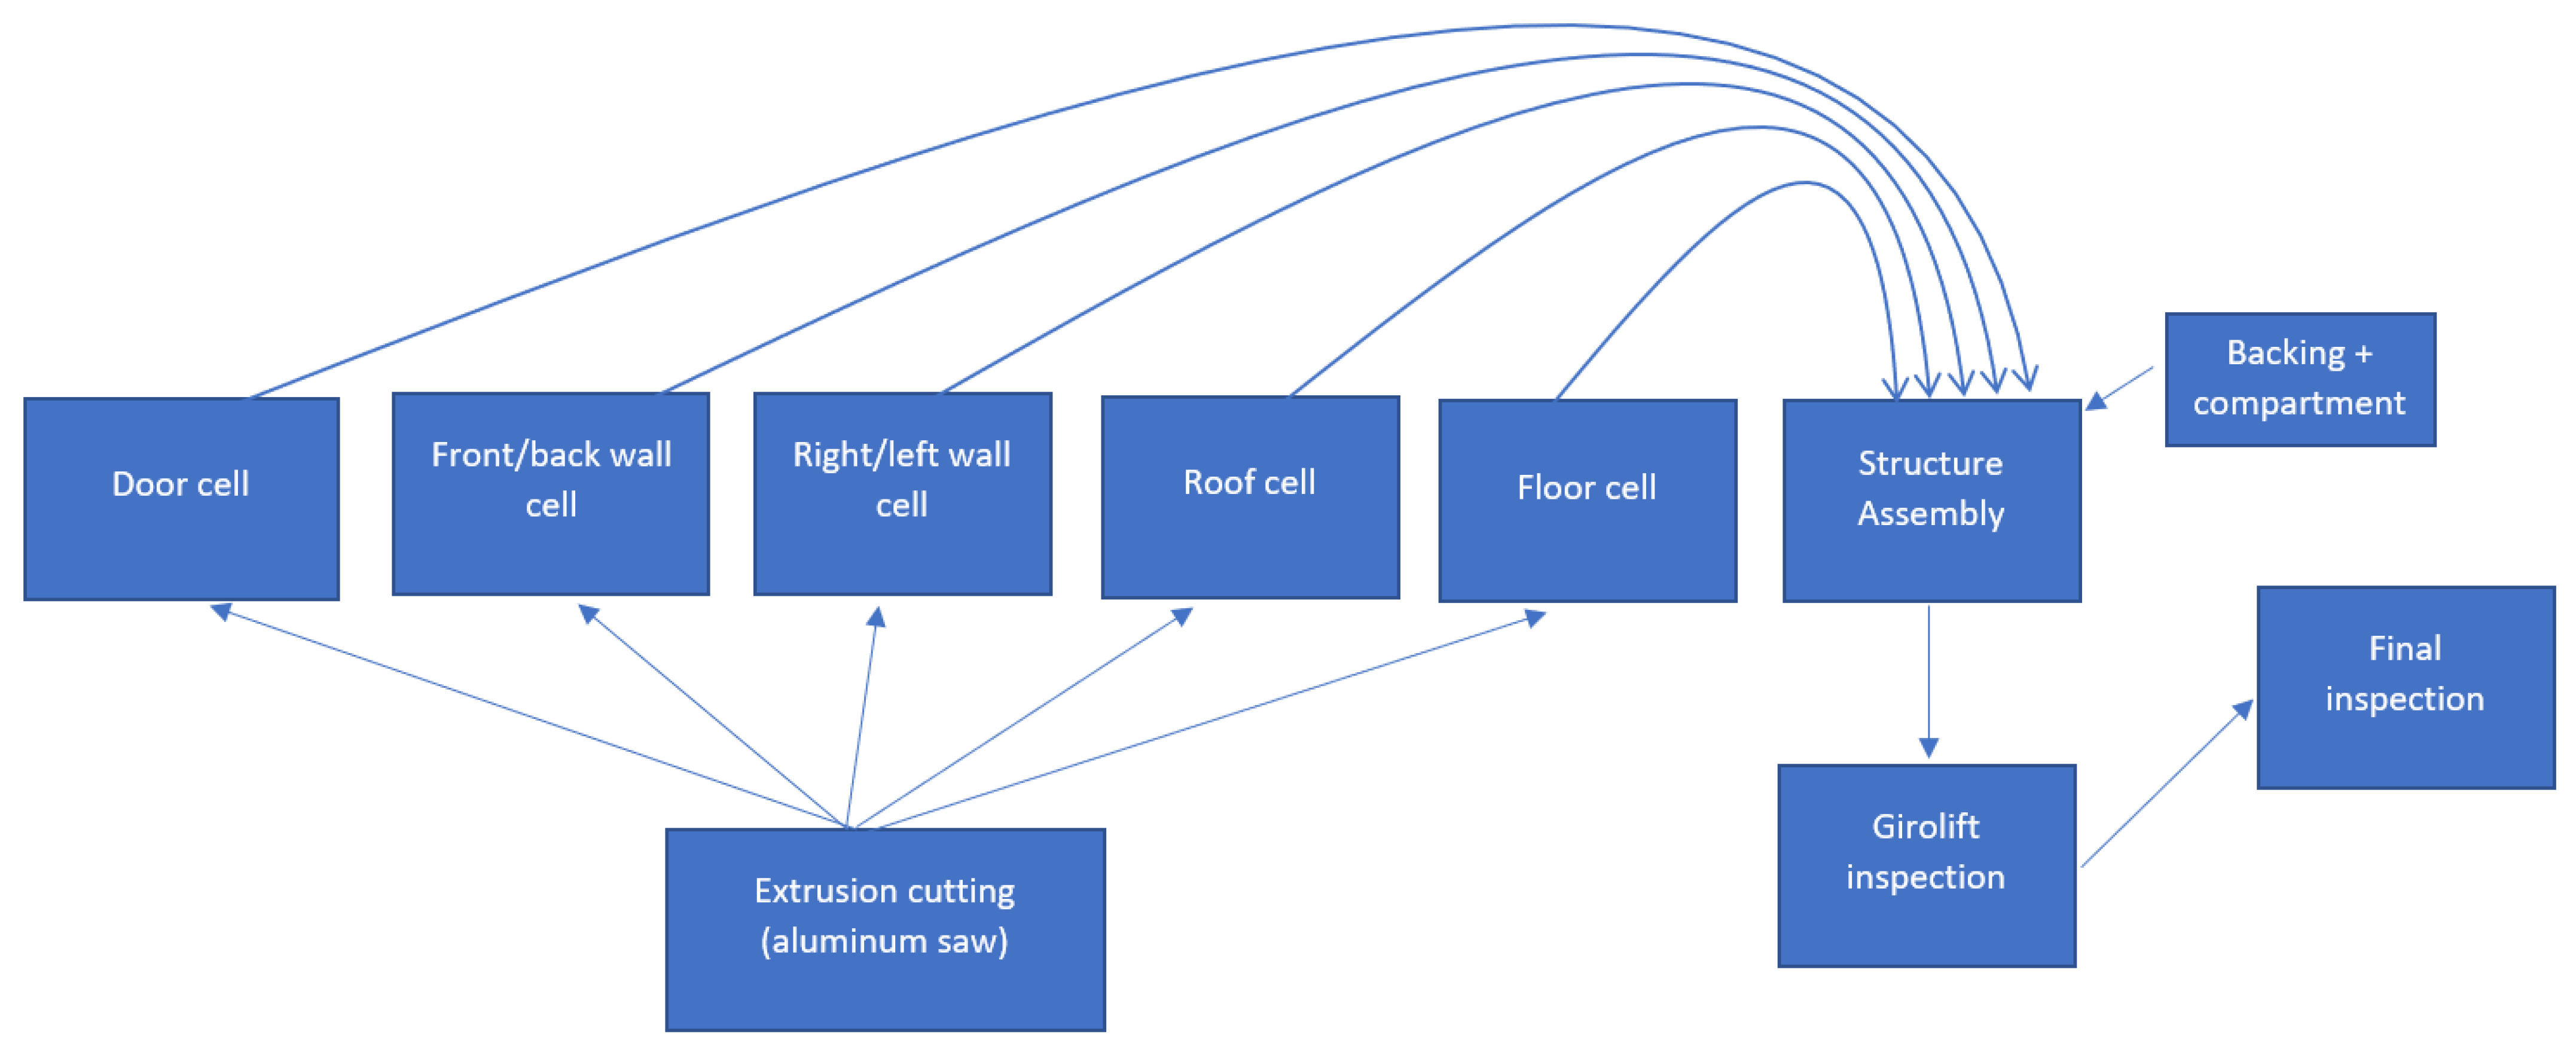
- Reorganizing the production line into dynamic cells and a mixed production line;
- Automating the production line gradually, step by step (robots, cobots, etc.).
3.2. Experimental Plan
3.2.1. The Factors and Their Levels
3.2.2. The Mathematical Model
- Yijklmn: The measured response (structure makespan).
- Ai: Level i of the “Organization” variable.
- Bj: Level j of the “Modular Design” variable.
- Ck: Level k of the “Robot” variable.
- Dl: Level l of the “Line Balancing” variable.
- Em: Level m of the “Cobot” variable.
- AB: Interaction between factors A and B.
- AC: Interaction between factors A and C.
- AD: Interaction between factors A and D.
- DE: Interaction between factors D and E.
- εo(ijklmn): The experimental error.
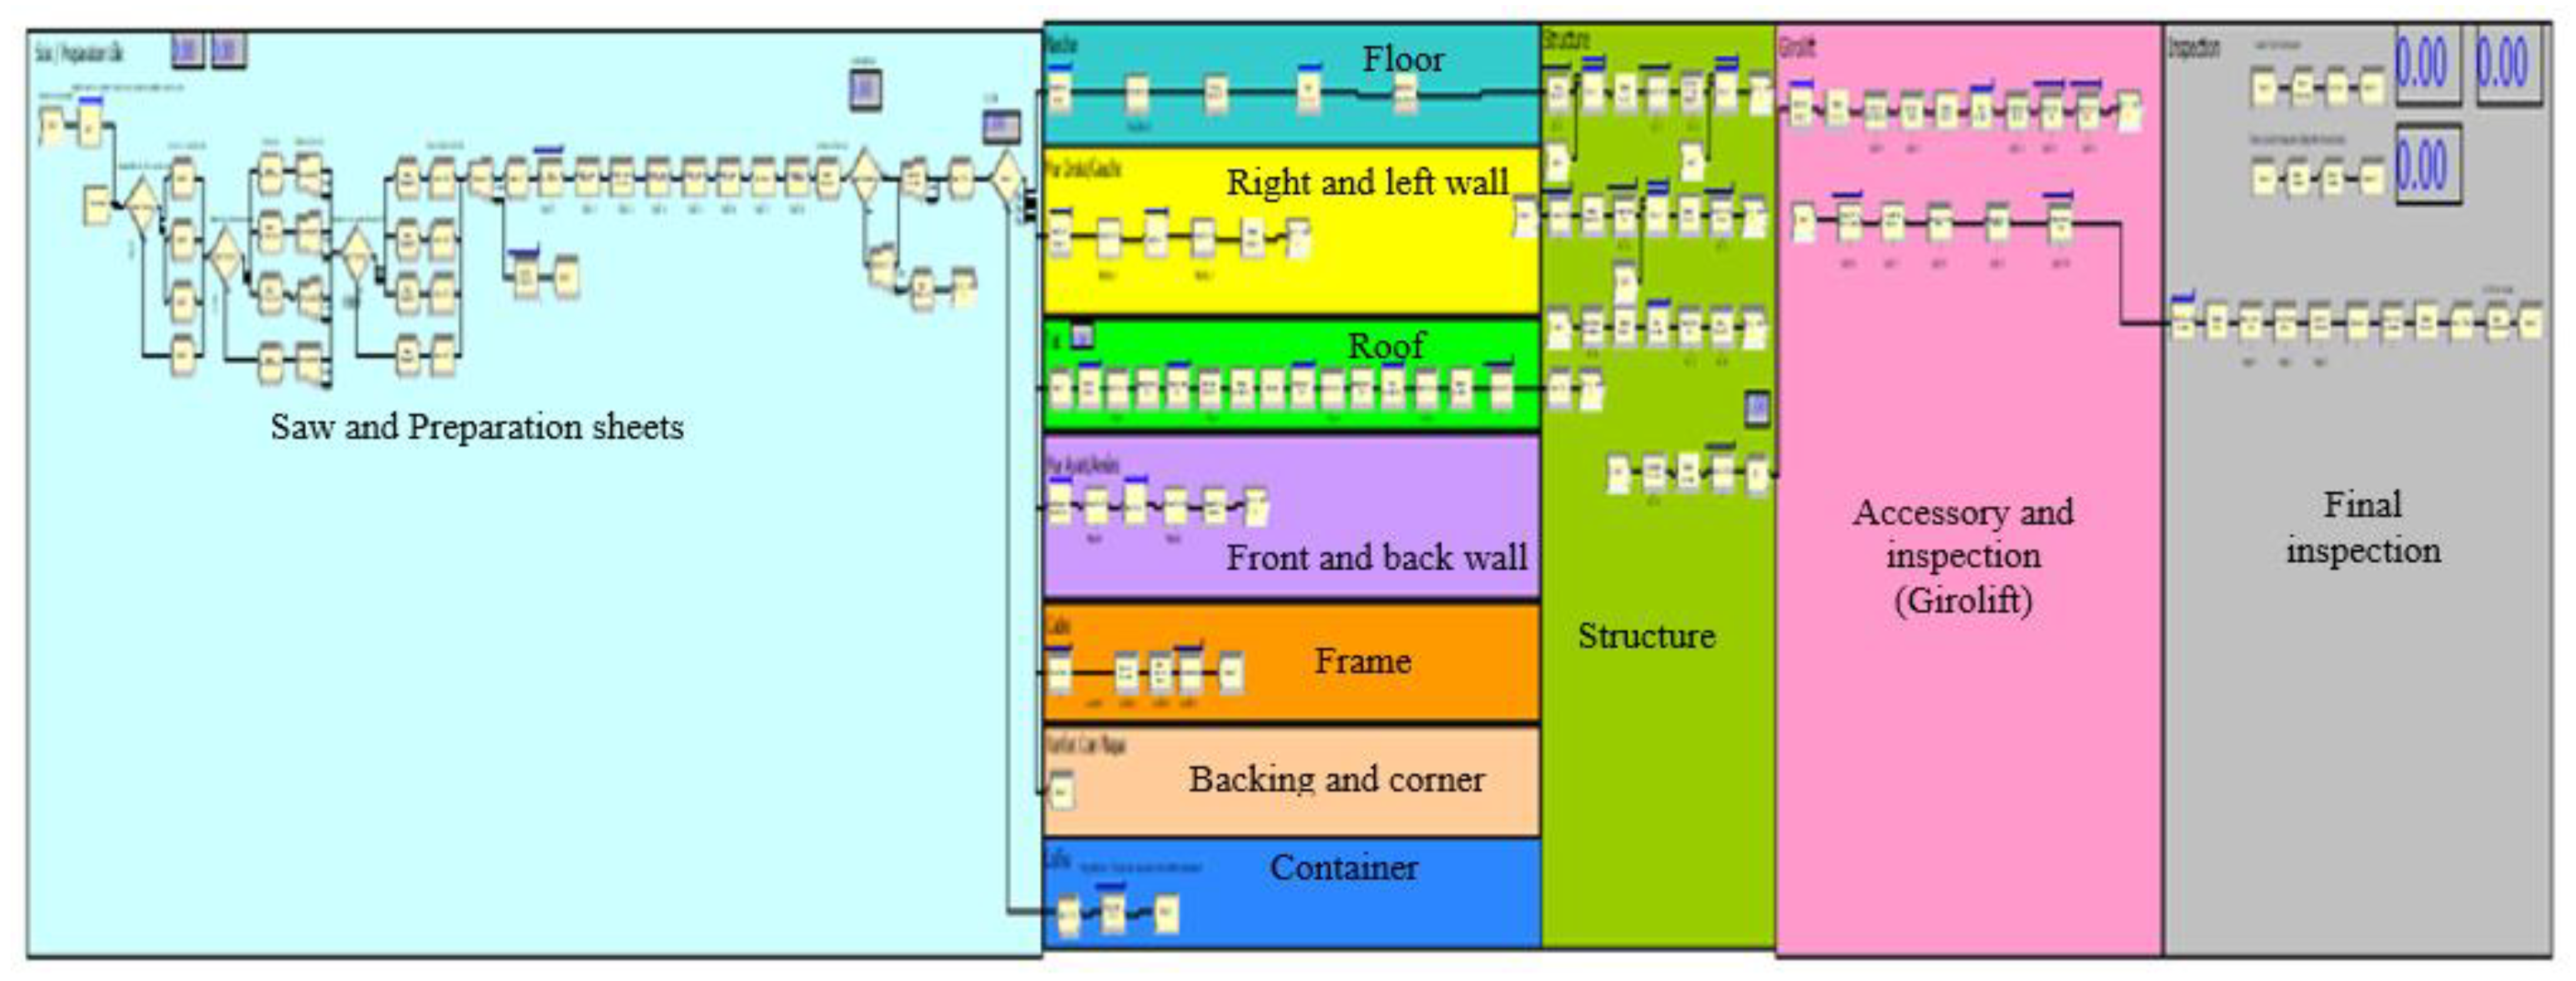
3.3. Discrete-Event Simulation Model
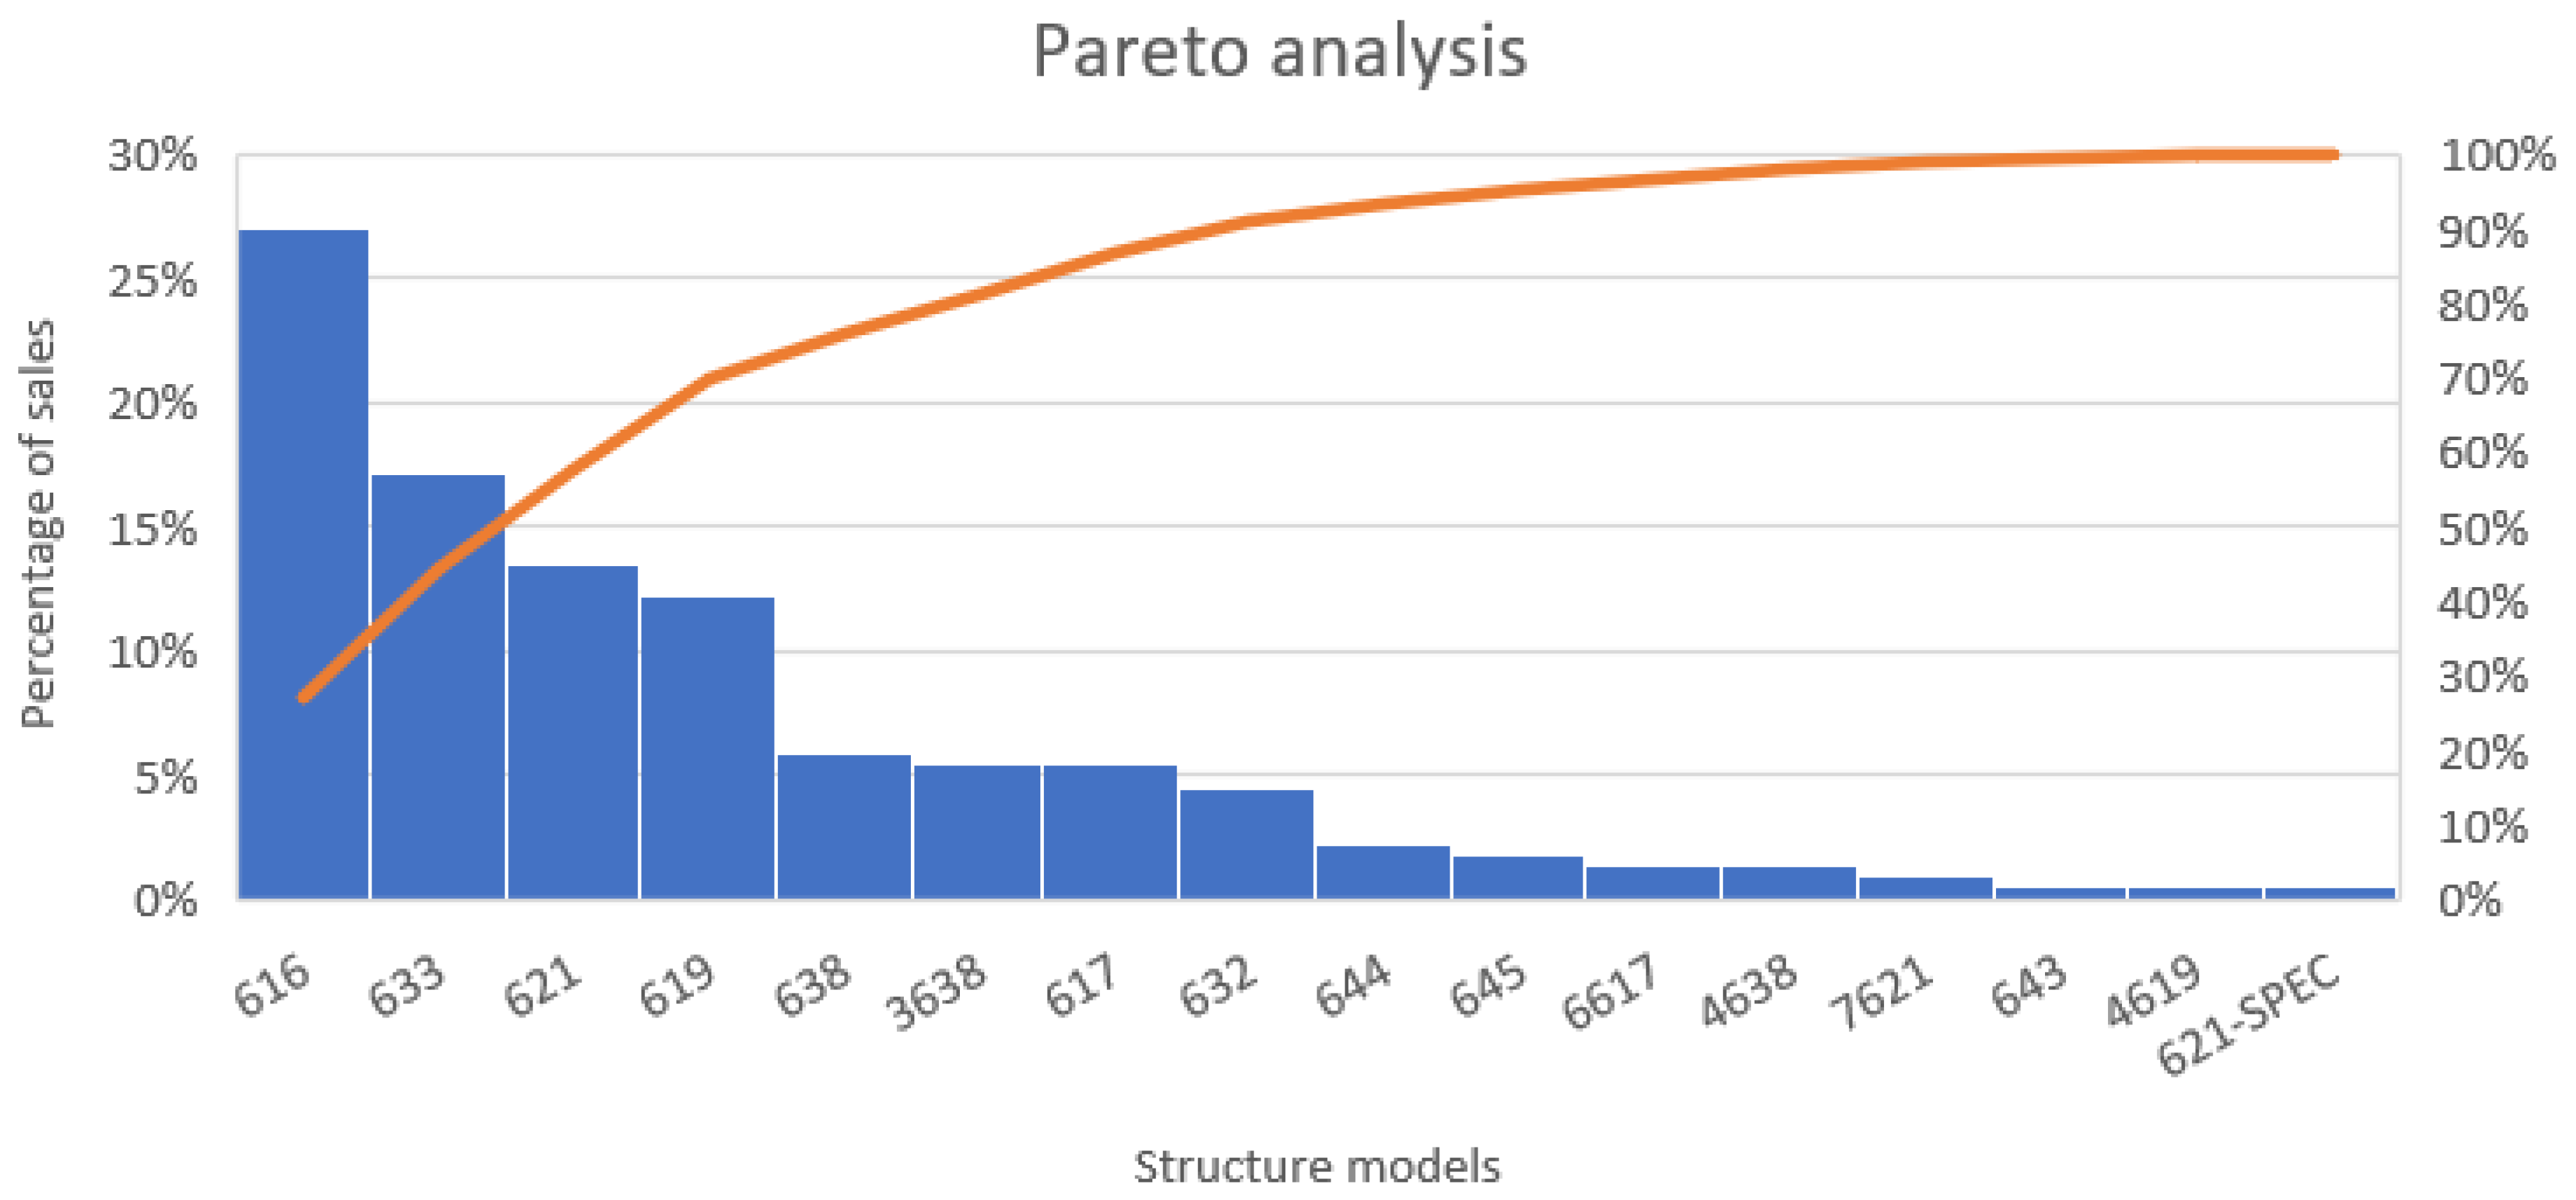
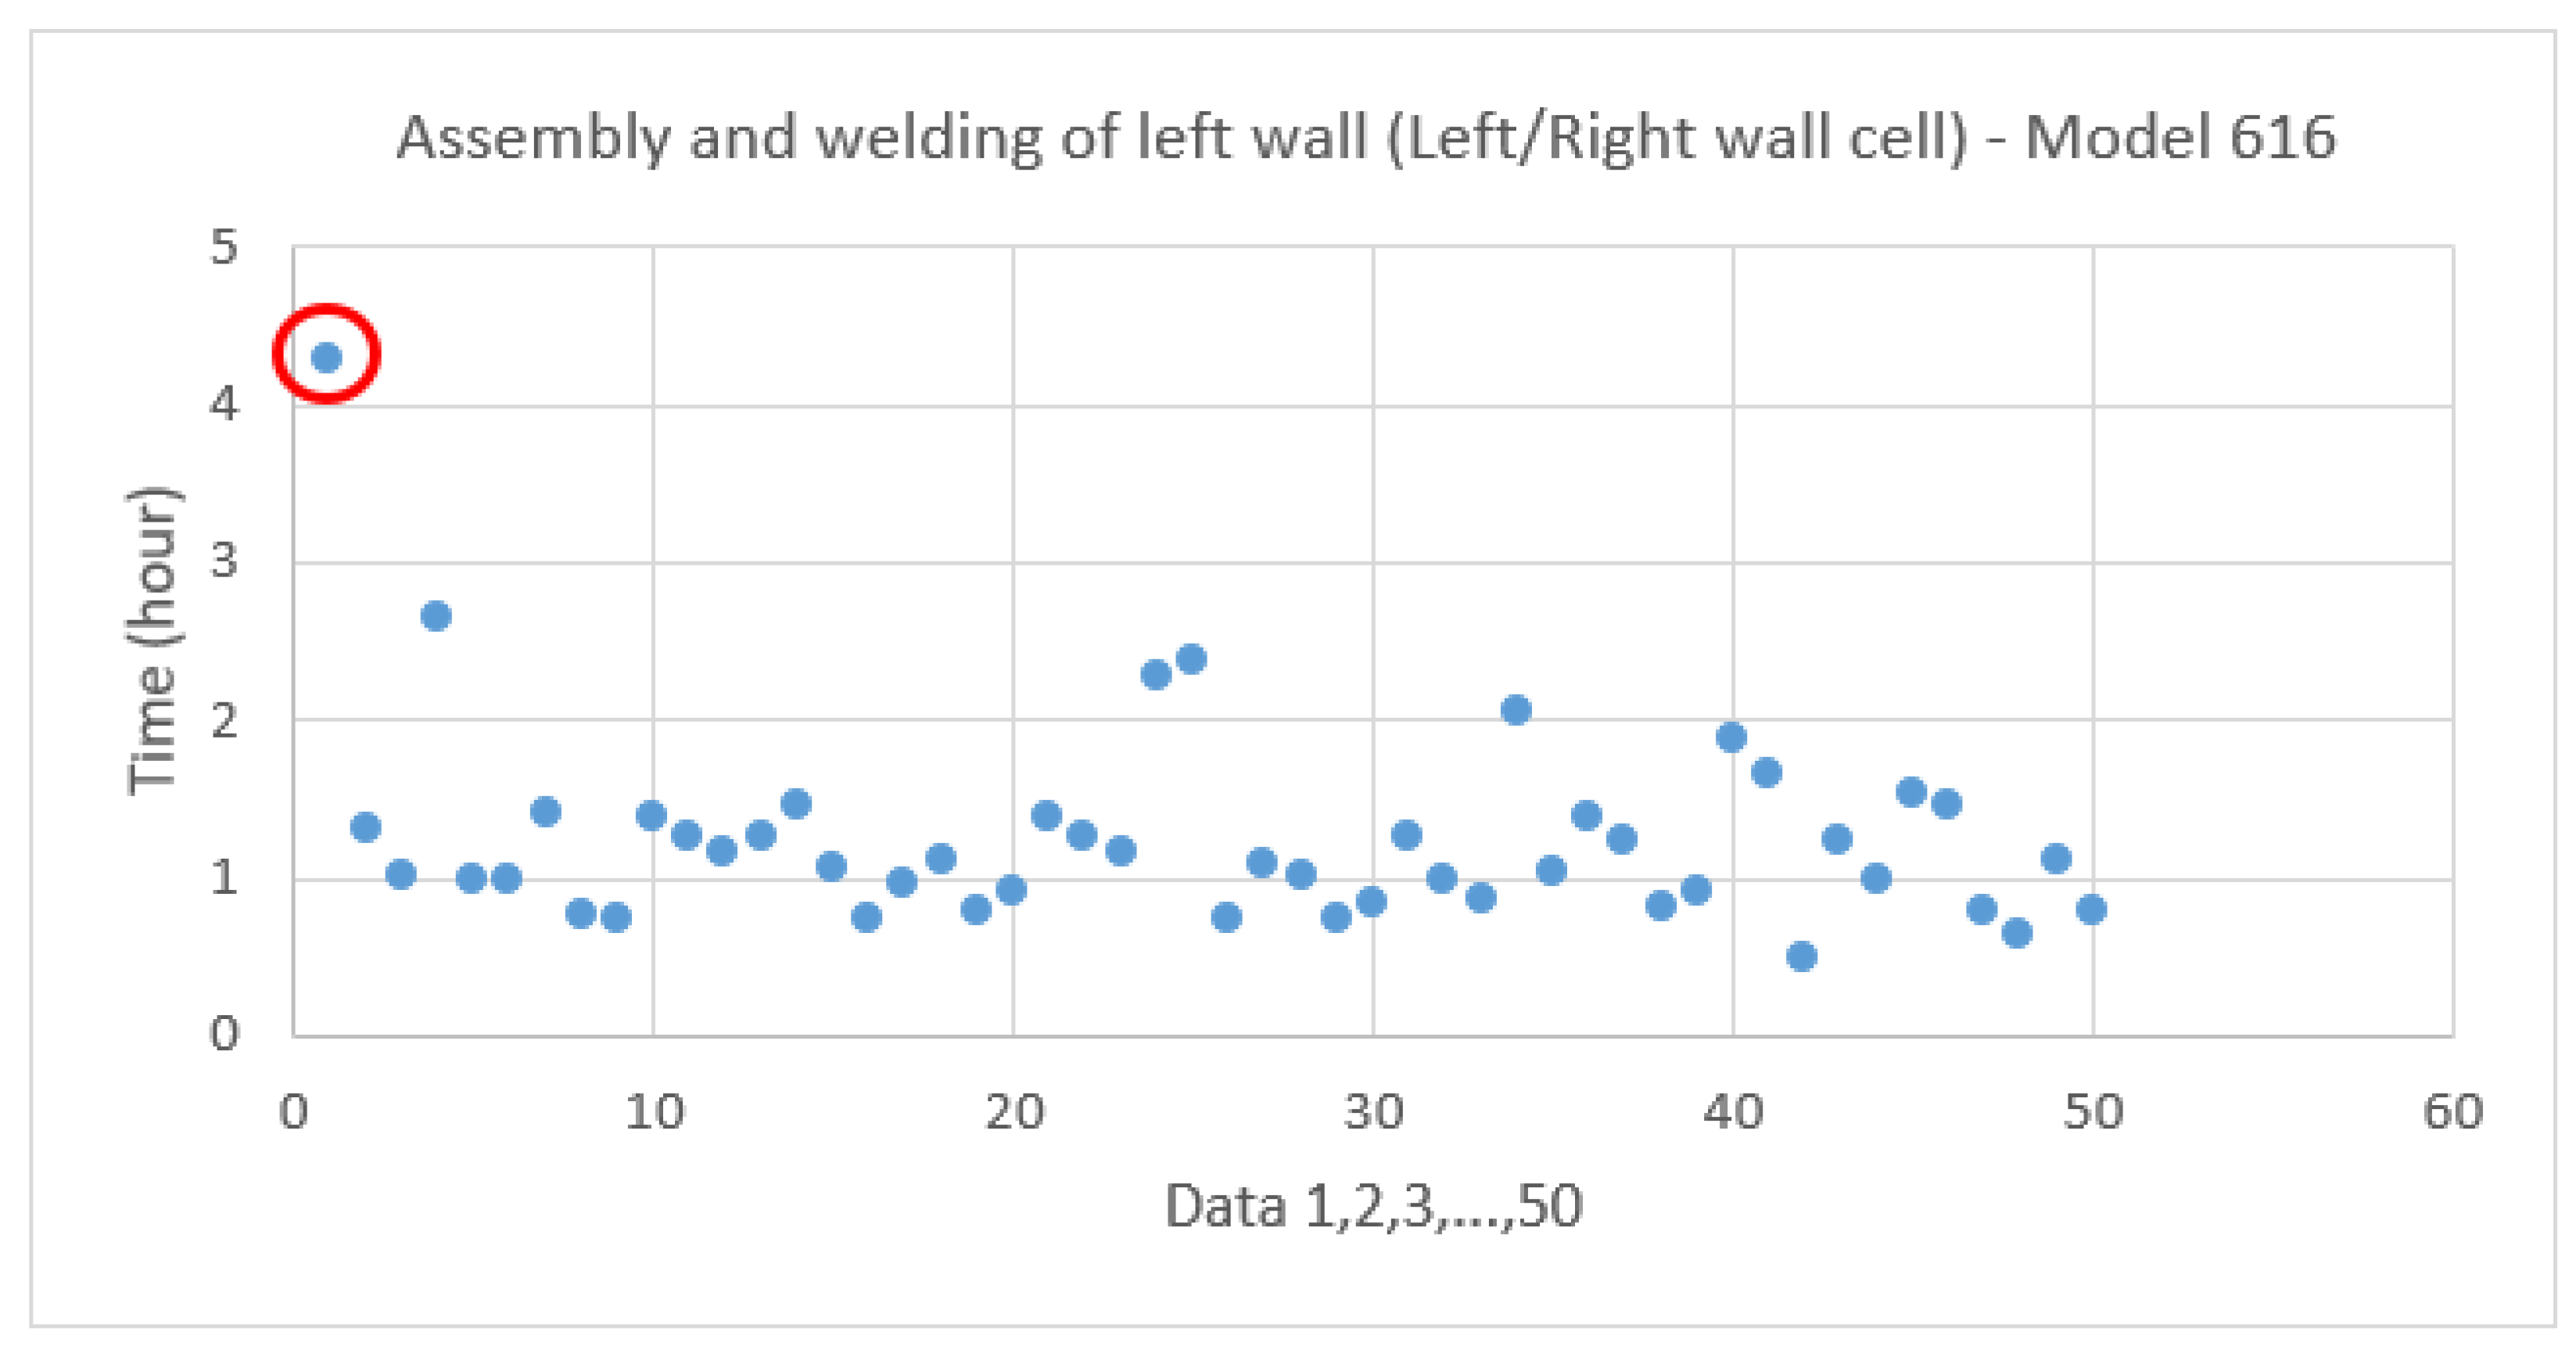
3.3.1. Simulation Data
3.3.2. Permanent Regime and Validation
3.4. Results Obtained with the Simulation Model
3.5. Next Steps for MS
4. Discussion
4.1. Lean and I4.0
4.2. Simulation in the I4.0 Implementation Strategy
4.3. Practical Implications
5. Conclusions
- ○
- Implementing Lean and developing agility, developing a modular product structure, and automating processes by step completed at the outset of a digital shift process lead to significant productivity gains.
- ○
- Simulation coupled with an experimental plan (DOE) is a relevant decision-making tool for companies. With a simulation model, companies may, for example, assess which tasks must be automated and measure the impact of technological tools on productivity and variability without upsetting daily production activities.
- ○
- The strategy proposed demonstrates that SMEs that undertake a digital shift must rethink the designs of their products (modular design) and of their processes before automating. Reconfigurability becomes the watchword.
Author Contributions
Funding
Institutional Review Board Statement
Informed Consent Statement
Data Availability Statement
Conflicts of Interest
References
- Raymond Chabot Grant Thornton. Les PME Québécoises et Leurs Différents Enjeux: Une Étude Réalisée Auprès des Dirigeants de PME Québécoises; Raymond Chabot Grant Thornton: Montreal, QC, Canada, 2019; p. 46. [Google Scholar]
- Liker, J. Le Modèle Toyota: 14 Principes Qui Feront la Réussite de Votre Entreprise; Pearson Education: Paris, France, 2009. [Google Scholar]
- Alhuraish, I.; Robledo, C.; Kobi, A. A comparative exploration of lean manufacturing and six sigma in terms of their critical success factors. J. Clean. Prod. 2017, 164, 325–337. [Google Scholar] [CrossRef]
- Caggiano, A.; Caiazzo, F.; Teti, R. Digital factory approach for flexible and efficient manufacturing systems in the aerospace industry. Procedia CIRP 2015, 37, 122–127. [Google Scholar] [CrossRef]
- Économie du Savoir Site Web. Available online: https://economiedusavoir.com/eacm/transformation-numerique/#:~:text=L’industrie%204.0%2C%20fait%20r%C3%A9f%C3%A9rence,vos%20machines%20et%20votre%20%C3%A9quipement (accessed on 19 April 2021).
- Wankhede, V.A.; Vinodh, S. State of the art review on Industry 4.0 in manufacturing with the focus on automotive sector. Int. J. Lean Six Sigma 2021, 13, 2040–4166. [Google Scholar] [CrossRef]
- Moeuf, A.; Lamouri, S.; Pellerin, R.; Tamayo-Giraldo, S.; Tobon-Valencia, E.; Eburdy, R. Identification of critical success factors, risks and opportunities of Industry 4.0 in SMEs. Int. J. Prod. Res. 2020, 58, 1384–1400. [Google Scholar] [CrossRef]
- Raj, A.; Dwivedi, G.; Sharma, A.; de Sousa Jabbour, A.B.L.; Rajak, S. Barriers to the adoption of industry 4.0 technologies in the manufacturing sector: An inter-country comparative perspective. Int. J. Prod. Econ. 2020, 224, 107546. [Google Scholar] [CrossRef]
- Wankhede, V.A.; Vinodh, S. Analysis of barriers of cyber-physical system adoption in small and medium enterprises using interpretive ranking process. Int. J. Qual. Reliab. Manag. 2021. [Google Scholar] [CrossRef]
- Wankhede, V.A.; Vinodh, S. Analysis of Industry 4.0 challenges using best worst method: A case study. Comput. Ind. Eng. 2021, 159, 107–487. [Google Scholar] [CrossRef]
- Gamache, S.; Abdul-Nour, G.; Baril, C. Evaluation of the influence parameters of Industry 4.0 and their impact on the Quebec manufacturing SMEs: The first findings. Cogent Eng. 2020, 7, 1771818. [Google Scholar] [CrossRef]
- McKinsey Digital. Industry 4.0. How to Navigate Digitization of the Manufacturing Sector; McKinsey & Company: Chicago, IL, USA, 2015. [Google Scholar]
- Sishi, M.; Telukdarie, A. Implementation of Industry 4.0 technologies in the mining industry—A case study. Int. J. Min. Miner. Eng. 2020, 11, 1–12. [Google Scholar] [CrossRef]
- Mittal, S.; Khan, M.A.; Romero, D.; Wuest, T. A critical review of smart manufacturing and industry 4.0 maturity models: Implications for small and medium-sized enterprises (SMEs). J. Manuf. Syst. 2018, 49, 194–214. [Google Scholar] [CrossRef]
- Wankhede, V.A.; Vinodh, S. Benchmarking Industry 4.0 readiness evaluation using fuzzy approaches. Benchmarking Int. J. 2022. [Google Scholar] [CrossRef]
- Amaral, A.; Peças, P. A Framework for Assessing Manufacturing SMEs Industry 4.0 Maturity. Appl. Sci. 2021, 11, 6127. [Google Scholar] [CrossRef]
- Cotrino, A.; Sebastián, M.A.; González-Gaya, C. Industry 4.0 Roadmap: Implementation for Small and Medium-Sized Enterprises. Appl. Sci. 2020, 10, 8566. [Google Scholar] [CrossRef]
- Liebrecht, C.; Kandler, M.; Lang, M.; Schaumann, S.; Stricker, N.; Wuest, T.; Lanza, G. Decision support for the implementation of Industry 4.0 methods: Toolbox, Assessment and Implementation Sequences for Industry 4.0. J. Manuf. Syst. 2021, 58, 412–430. [Google Scholar] [CrossRef]
- Nakagawa, E.Y.; Antonino, P.O.; Schnicke, F.; Capilla, R.; Kuhn, T.; Liggesmeyer, P. Industry 4.0 reference architectures: State of the art and future trends. Comput. Ind. Eng. 2021, 156, 107241. [Google Scholar] [CrossRef]
- Horváth, D.; Szabó, R.Z. Driving forces and barriers of Industry 4.0: Do multinational and small and medium-sized companies have equal opportunities? Technol. Forecast. Soc. Chang. 2019, 146, 119–132. [Google Scholar] [CrossRef]
- Gamache, S. Stratégies de Mise en Oeuvre de l’Industrie 4.0 dans les Petites et Moyennes Entreprises Manufacturières Québécoises. Ph.D. Thesis, Université du Québec à Trois-Rivières, Trois-Rivières, QC, Canada, 2019. [Google Scholar]
- Tissir, S.; Cherrafi, A.; Chiarini, A.; Elfezazi, S.; Bag, S. Lean Six Sigma and Industry 4.0 combination: Scoping review and perspectives. Total Qual. Manag. Bus. Excel. 2022, 1–30. [Google Scholar] [CrossRef]
- Ministère de l’Économie et de l’Innovation. Industrie 4.0: Origine et Définition. 2016. Available online: https://www.economie.gouv.qc.ca/fr/bibliotheques/outils/gestion-dune-entreprise/industrie-40/feuille-de-route-industrie-40/1-industrie-40-origine-et-definition/ (accessed on 10 May 2019).
- Ghobakhloo, M. The future of manufacturing industry: A strategic roadmap toward Industry 4.0. J. Manuf. Technol. Manag. 2018, 29, 910–936. [Google Scholar] [CrossRef] [Green Version]
- De Paula Ferreira, W.; Armellini, F.; De Santa-Eulalia, L. Simulation in industry 4.0: A state-of-the-art review. Comput. Ind. Eng. 2020, 149, 1–17. [Google Scholar] [CrossRef]
- Burke, T. OPC Unified Architecture Inteoperability for Industry 4.0 and the Internet of Things; OPC Foundation: Scottsdale, AZ, USA, 2017. [Google Scholar]
- Mabkhot, M.M.; Al-Ahmari, A.M.; Salah, B.; Alkhalefah, H. Requirements of the Smart Factory System: A Survey and Perspective. Machines 2018, 6, 23. [Google Scholar] [CrossRef] [Green Version]
- Efatmaneshnik, M.; Shoval, S.; Qiao, L. A Standard Description of the Terms Module and Modularity for Systems Engineering. IEEE Trans. Eng. Manag. 2018, 67, 365–375. [Google Scholar] [CrossRef]
- Hermann, M.; Pentek, T.; Otto, B. Design principles for industrie 4.0 scenarios: A Literature Review: Working Paper. 2015. Available online: https://www.researchgate.net/publication/307864150_Design_Principles_for_Industrie_40_Scenarios_A_Literature_Review (accessed on 8 March 2022).
- Tavcar, J.; Horvath, I. A Review of the Principles of Designing Smart Cyber-Physical Systems for Run-Time Adaptation: Learned Lessons and Open Issues. IEEE Trans. Syst. Man, Cybern. Syst. 2018, 49, 145–158. [Google Scholar] [CrossRef] [Green Version]
- Ustundag, A.; Cevikcan, E. Industry 4.0: Managing The Digital Transformation; Springer: Berlin/Heidelberg, Germany, 2018. [Google Scholar]
- Kagermann, H.; Wahlster, W.; Helbig, J. Recommendations for Implementing the Strategic Initiative Industrie 4.0. Securing the Future of German Manufacturing Industry; Final Report of the Industrie 4.0 Working Group; Forschungsunion: Munich, Germany, 2013. [Google Scholar]
- Hermann, M.; Pentek, T.; Otto, B. Design principles for industry 4.0 scenarios. In Proceedings of the 2016 49th Hawaii International Conference on System Sciences (HICSS), Koloa, HI, USA, 5–8 January 2016. [Google Scholar] [CrossRef] [Green Version]
- Bosman, L.; Hartman, N.; Sutherland, J. How manufacturing firm characteristics can influence decision making for investing in Industry 4.0 technologies. J. Manuf. Technol. Manag. 2019, 31, 1117–1141. [Google Scholar] [CrossRef]
- Impuls. Industry 4.0 Readiness. Online Self-Check for Business. Available online: https://www.industrie40-readiness.de/?lang=en (accessed on 11 March 2017).
- Abdul-Nour, G.; Lambert, S.; Drolet, J. Adaptation of jit phylosophy and kanban technique to a small-sized manufacturing firm; a project management approach. Comput. Ind. Eng. 1998, 35, 419–422. [Google Scholar] [CrossRef]
- Duray, R.; Ward, P.T.; Milligan, G.W.; Berry, W.L. Approaches to mass customization: Configurations and empirical validation. J. Oper. Manag. 2000, 18, 605–625. [Google Scholar] [CrossRef]
- Kampen, T.; Donk, D. Coping with product variety in the food processing industry: The effect of form postponement. Int. J. Prod. Res. 2014, 52, 353–367. [Google Scholar] [CrossRef]
- Kim, D.-Y.; Park, J.-W.; Baek, S.; Park, K.-B.; Kim, H.-R.; Kim, B.-B.; Oh, H.-Y.; Namgung, K.; Baek, W. A modular factory testbed for the rapid reconfiguration of manufacturing systems. J. Intell. Manuf. 2019, 31, 661–680. [Google Scholar] [CrossRef]
- Evans, S.; Li, H.; Yang, M. Classifying different types of modularity for technical system. Int. J. Technol. Manag. 2019, 81, 1–23. [Google Scholar] [CrossRef]
- Pahl, G.; Beitz, W. Engineering Design: A Systemic Approach; Springer: Berlin, Germany, 1996. [Google Scholar]
- Rheault, M.; Drolet, J.R.; Abdulnour, G. Physically reconfigurable virtual cells: A dynamic model for a highly dynamic environment. Comput. Ind. Eng. 1995, 29, 221–225. [Google Scholar] [CrossRef]
- Gupta, P. Modularity enablers: A tool for Industry 4.0. Life Cycle Reliab. Saf. Eng. 2018, 8, 157–163. [Google Scholar] [CrossRef]
- Gilchrist, A. Industry 4.0. The Industrial Internet of Things; Apress: New York, NY, USA, 2016; p. 250. [Google Scholar]
- Cohen, Y.; Faccio, M.; Galizia, F.G.; Mora, C.; Pilati, F. Assembly system configuration through Industry 4.0 principles: The expected change in the actual paradigms. IFAC-PapersOnLine 2017, 50, 14958–14963. [Google Scholar] [CrossRef]
- Pollard, D.; Chuo, S.; Lee, B. Strategies for mass customization. J. Bus. Econ. Res. 2008, 6, 77–86. [Google Scholar]
- Qin, Z.; Lu, Y. Self-organizing manufacturing network: A paradigm towards smart manufacturing in mass personalization. J. Manuf. Syst. 2021, 60, 35–47. [Google Scholar] [CrossRef]
- Sharp, J.; Irani, Z.; Desai, S. Working towards agile manufacturing in the UK industry. Int. J. Prod. Econ. 1999, 62, 155–169. [Google Scholar] [CrossRef]
- Moeuf, A.; Pellerin, R.; Lamouri, S.; Tamayo, S.; Barbaray, R. The industrial management of SMEs in the era of Industry 4.0. Int. J. Prod. Res. 2017, 56, 1118–1136. [Google Scholar] [CrossRef] [Green Version]
- HUB Institute. HUB Institute Forum Rapport; HUB Institute: Paris, France, 2017. [Google Scholar]
- Vinodh, S.; Antony, J.; Agrawal, R.; Douglas, J.A. Integration of continuous improvement strategies with Industry 4.0: A systematic review and agenda for further research. TQM J. 2020, 33, 441–472. [Google Scholar] [CrossRef]
- Bouchard, S. Stratégie d’Implantation de l’I4.0 et de l’Agilité dans une PME Manufacturière Québécoise. Master’s Thesis, Université du Québec à Trois-Rivières, Trois-Rivières, QC, Canada, 2021. [Google Scholar]
- Gursel, A.S.; Gen, M. Chapitre 1—Cellular manufacturing system evolution from group technology to reconfigurable system: A case study of dynamic cellular manufacturing system (DCMS) in an Electromechanical Assembly Industry. In Cellular Manufacturing Systems: Recent Developments, Analysis and Case Studies; Abdul-Nour, G., Gamache, S., Nouri, K., Eds.; Nova Science Publishers, Inc.: New York, NY, USA, 2018; ISBN 978-1-53612-879-6. [Google Scholar]


| Design Principles of Industry 4.0 | |||
|---|---|---|---|
| 1 | Vertical integration | 10 | Autonomy |
| 2 | Horizontal integration | 11 | Optimization |
| 3 | End-to-end engineering integration | 12 | Flexibility |
| 4 | Smart factory | 13 | Agility |
| 5 | Interoperability | 14 | Service orientation |
| 6 | Modularity | 15 | Smart product |
| 7 | Real-time capability | 16 | Product personalization |
| 8 | Virtualization | 17 | Corporate and social responsibility |
| 9 | Decentralization | ||
| Step 0: Identify your bottlenecks |
|
| Step 1: Develop a strategy |
|
| Step 2: Ideas and Prototypes |
|
| Step 3: Connect/Plug-in your devices |
|
| Step 4: Analyze |
|
| Step 5: Go live |
|
| Business Practices | Impact on the Digital Performance of Companies |
|---|---|
| Essential | Significant impact and potential improvement > 20% |
| Priority | Significant impact and potential improvement < 20% |
| Not priority | Insignificant impact and possible improvement > 10% |
| Specific cases | Insignificant impact and possible improvement < 10% |
| Category | Business Practices | |
|---|---|---|
| Essential | 1 | Develop a digital vision and strategy |
| 2 | Develop and clarify the digital ecosystem and architecture (with IT bridges for example) | |
| 3 | Demonstrate commitment and set an example | |
| 4 | Be proficient in digital tools | |
| 5 | Automate processes: implement ERP, MES, IoT, Robots, Cobots, AI systems | |
| 6 | Ensure data quality | |
| 7 | Benefit from e-commerce advantages (product configurator or a transactional website) | |
| Priority | 8 | Improve change management |
| 9 | Encourage Agility and Innovation | |
| 10 | Implement Lean and Continuous Improvement: define relevant performance indicators (KPI) | |
| 11 | Ensure cybersecurity | |
| 12 | Optimize data delivery (ERP, MES, and dynamic dashboard systems) | |
| 13 | Implement Mass Personalization | |
| 14 | Maximize the operational use of data (IoT, MES, dynamic dashboards) | |
| 15 | Maximize the strategic use of data | |
| Non-priority | 16 | Develop new business models |
| 17 | Deploy resources and investments | |
| 18 | Optimize skill acquisition and development (video training programs) | |
| 19 | Maximize internal communication (collaboration platform) | |
| 20 | Improve the data collection system (RFID, IoT, sensors, cloud computing) | |
| 21 | Ensure customer loyalty, service, and loyalty | |
| Specific cases | 22 | Technology monitoring |
| 23 | Openness to the outside | |
| 24 | Co-creation | |
| Preliminary Step |
|
| Audit Step |
|
| Planning Step |
|
| Implementation Step |
|
| Deployment Step |
|
| Optimization Step |
|
| Factors | Level 1 | Level 2 |
|---|---|---|
| Organization (A) | Current | Dynamic cell |
| Modular design (B) | None | Standard platform and modules |
| Robot (C) | None | Robot |
| Line balancing (D) | No balancing | Natural balancing |
| Cobot (E) | None | Cobot |
| Operations | Model 616 | Model 619 | Model 621 | Model 633 |
|---|---|---|---|---|
| Left wall weld | 0.63 + 1.36 × BETA (1.72, 3.24) | 0.27 + LOGN (0.816, 0.502) | 0.999 + WEIB (0.876, 1.28) | 0.999 + WEIB (0.876, 1.28) |
| Right wall weld | 0.71 + GAMM (0.237, 3.43) | 0.32 + LOGN (0.841, 0.539) | NORM (2.36, 1.28) | NORM (2.36, 1.28) |
| Indicators | Values Observed at MS | Simulated Values with the Model | Delta |
|---|---|---|---|
| Structure makespan | 140 h | 147 h | 5.0% |
| Number of structures produced | 6 structures/week | 5.8 structures/week | 3.3% |
| Experiments | Factors and Columns | Results | |||||||||||||
|---|---|---|---|---|---|---|---|---|---|---|---|---|---|---|---|
| B | A | E | D | C | Repetitions and Makespan (in Hours) | ||||||||||
| 1 | 2 | 4 | 8 | 15 | R1 | R2 | R3 | R4 | R5 | R6 | R7 | R8 | R9 | R10 | |
| 1 | 1 | 1 | 1 | 1 | 1 | 241.81 | 124.75 | 184.87 | 122.63 | 135.64 | 140.15 | 118.31 | 143.82 | 153.22 | 114.41 |
| 2 | 1 | 1 | 1 | 2 | 2 | 185.06 | 142.20 | 157.14 | 125.82 | 120.52 | 121.83 | 171.14 | 143.73 | 135.64 | 112.32 |
| 3 | 1 | 1 | 2 | 1 | 2 | 116.08 | 115.29 | 121.12 | 132.72 | 178.89 | 116.65 | 113.24 | 119.73 | 116.69 | 185.71 |
| 4 | 1 | 1 | 2 | 2 | 1 | 130.76 | 117.19 | 120.96 | 159.61 | 172.14 | 133.46 | 173.58 | 120.53 | 113.56 | 140.36 |
| 5 | 1 | 2 | 1 | 1 | 2 | 145.39 | 128.84 | 162.03 | 137.52 | 118.04 | 116.39 | 134.14 | 121.49 | 158.00 | 113.30 |
| 6 | 1 | 2 | 1 | 2 | 1 | 138.17 | 117.71 | 119.25 | 116.45 | 186.06 | 113.09 | 109.54 | 160.12 | 112.86 | 174.05 |
| 7 | 1 | 2 | 2 | 1 | 1 | 118.67 | 117.38 | 122.57 | 120.74 | 199.14 | 130.59 | 113.22 | 120.61 | 117.90 | 180.80 |
| 8 | 1 | 2 | 2 | 2 | 2 | 118.08 | 122.08 | 117.52 | 137.81 | 153.25 | 130.08 | 158.85 | 115.80 | 113.36 | 131.12 |
| 9 | 2 | 1 | 1 | 1 | 2 | 119.24 | 176.88 | 160.29 | 135.13 | 122.91 | 115.68 | 117.63 | 114.63 | 135.85 | 118.66 |
| 10 | 2 | 1 | 1 | 2 | 1 | 138.91 | 115.69 | 131.60 | 114.98 | 158.53 | 143.58 | 146.22 | 113.59 | 111.86 | 137.40 |
| 11 | 2 | 1 | 2 | 1 | 1 | 143.41 | 125.41 | 118.62 | 110.38 | 160.99 | 127.61 | 185.95 | 109.86 | 117.98 | 130.88 |
| 12 | 2 | 1 | 2 | 2 | 2 | 133.05 | 110.33 | 137.09 | 108.36 | 148.89 | 132.30 | 185.28 | 111.37 | 113.89 | 111.84 |
| 13 | 2 | 2 | 1 | 1 | 1 | 161.08 | 112.50 | 111.70 | 149.02 | 128.09 | 132.99 | 135.78 | 185.25 | 115.29 | 121.09 |
| 14 | 2 | 2 | 1 | 2 | 2 | 146.24 | 132.73 | 118.58 | 144.14 | 112.61 | 113.16 | 155.30 | 110.70 | 115.04 | 109.12 |
| 15 | 2 | 2 | 2 | 1 | 2 | 122.34 | 111.32 | 136.06 | 109.64 | 121.84 | 115.53 | 117.47 | 110.60 | 111.92 | 136.78 |
| 16 | 2 | 2 | 2 | 2 | 1 | 161.57 | 116.06 | 114.69 | 128.90 | 112.81 | 127.49 | 113.24 | 116.86 | 132.11 | 113.35 |
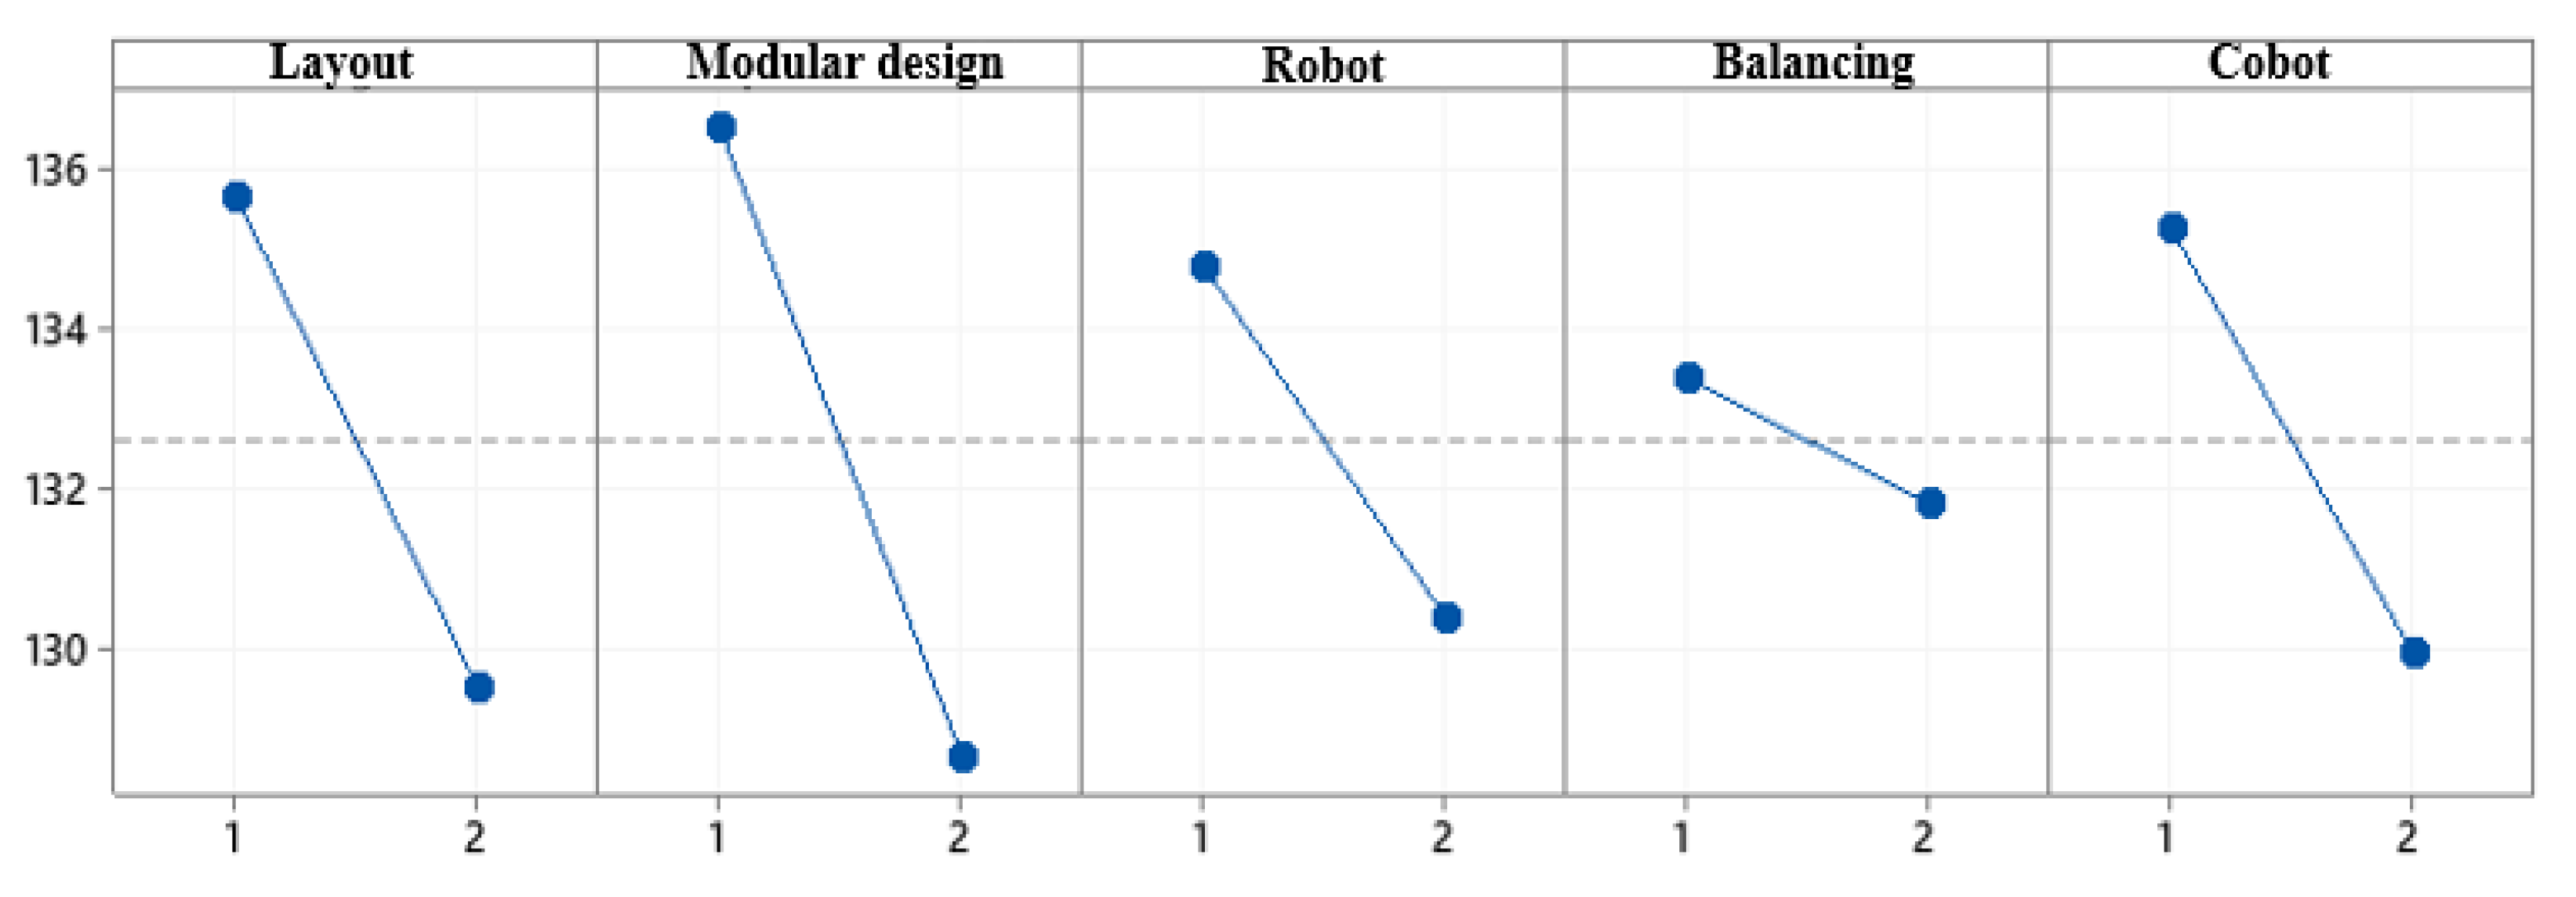
| Level | Modular Design (B) | Organization (A) | Cobot (E) | Line Balancing (D) | Robot (C) |
|---|---|---|---|---|---|
| 1 | 136.4 | 135.6 | 135.2 | 133.3 | 134.8 |
| 2 | 128.7 | 129.5 | 129.9 | 131.8 | 130.3 |
| Delta | 7.8 | 6 | 5.3 | 1.6 | 4.5 |
| Ranking | 1 | 2 | 3 | 5 | 4 |
| Source | DL | SomCar Ajust | CM Ajust | F | p-Value |
|---|---|---|---|---|---|
| Organization (A) | 1 | 1498.9 | 1498.91 | 2.77 | 0.098 |
| Modular design (B) | 1 | 2466.8 | 2466.78 | 4.57 | 0.034 |
| Robot (C) | 1 | 775.6 | 775.63 | 1.44 | 0.233 |
| Balancing the line (D) | 1 | 98.0 | 97.97 | 0.18 | 0.671 |
| Cobot (E) | 1 | 1126.4 | 1126.36 | 2.09 | 0.151 |
| Organization × Modular Design (AB) | 1 | 27.4 | 27.39 | 0.05 | 0.822 |
| Organization × Robot (AC) | 1 | 8.5 | 8.50 | 0.02 | 0.900 |
| Organization × Balancing (AD) | 1 | 10.5 | 10.51 | 0.02 | 0.889 |
| Organization × Cobot (DE) | 1 | 185.6 | 185.59 | 0.34 | 0.559 |
| Error | 150 | 81,026.6 | 540.18 | ||
| Lack-of-fit | 6 | 719.7 | 119.95 | 0.22 | 0.972 |
| Pure error | 144 | 80,306.9 | 557.69 | ||
| Total | 159 | 87,224.3 |
| Experiments | Column | Results | |||||||
|---|---|---|---|---|---|---|---|---|---|
| Modular Design (B) | Organization (A) | Cobot (E) | Line Balancing (D) | Robot (C) | Makespan (av.) | Typical Delta | Scope | av. Number Structure/Week | |
| 1 | None | Current organization | Without cobot | Without balancing | Without robot | 147.96 | 38.89 | 127.40 | 5.83 |
| 2 | None | Current organization | Without cobot | With natural balancing | With robot | 141.84 | 23.56 | 72.74 | 6.03 |
| 3 | None | Current organization | With cobot | Without balancing | With robot | 131.98 | 31.64 | 104.33 | 6.24 |
| 4 | None | Current organization | With cobot | With natural balancing | Without robot | 138.22 | 22.61 | 60.02 | 6.05 |
| 5 | None | Dynamic cell | Without cobot | Without balancing | With robot | 133.51 | 17.24 | 48.73 | 6.18 |
| 6 | None | Dynamic cell | Without cobot | With natural balancing | Without robot | 134.73 | 28.44 | 76.52 | 6.11 |
| 7 | None | Dynamic cell | With cobot | Without balancing | Without robot | 134.16 | 30.06 | 85.92 | 6.11 |
| 8 | None | Dynamic cell | With cobot | With natural balancing | With robot | 129.80 | 15.89 | 45.49 | 6.32 |
| 9 | Standard platforms and modules | Current organization | Without cobot | Without balancing | With robot | 131.69 | 21,176 | 62.25 | 6.19 |
| 10 | Standard platforms and modules | Current organization | Without cobot | With natural balancing | Without robot | 131.24 | 16,369 | 46.67 | 6.20 |
| 11 | Standard platforms and modules | Current organization | With cobot | Without balancing | Without robot | 133.11 | 24.18 | 76.09 | 6.14 |
| 12 | Standard platforms and modules | Current organization | With cobot | With natural balancing | With robot | 129.24 | 24.18 | 76.92 | 6.38 |
| 13 | Standard platforms and modules | Dynamic cell | Without cobot | Without balancing | Without robot | 135.28 | 23.76 | 73.55 | 6.09 |
| 14 | Standard platforms and modules | Dynamic cell | Without cobot | With natural balancing | With robot | 125.76 | 17.25 | 46.18 | 6.45 |
| 15 | Standard platforms and modules | Dynamic cell | With cobot | Without balancing | With robot | 119.35 | 10.03 | 27.14 | 6.83 |
| 16 | Standard platforms and modules | Dynamic cell | With cobot | With natural balancing | Without robot | 123.71 | 15.15 | 48.76 | 6.75 |
| Performance Indicators | Experiment 1 (Current) | Experiment 15 (4.0) | Delta |
|---|---|---|---|
| Makespan | 147.96 h | 119.35 h | 28.61 h (↓19.34%) |
| Typical delta | 38.89 | 10.03 | 28.86 (↓74.21%) |
| Range | 127.40 | 27.14 | 100.26 (↓78.70%) |
Publisher’s Note: MDPI stays neutral with regard to jurisdictional claims in published maps and institutional affiliations. |
© 2022 by the authors. Licensee MDPI, Basel, Switzerland. This article is an open access article distributed under the terms and conditions of the Creative Commons Attribution (CC BY) license (https://creativecommons.org/licenses/by/4.0/).
Share and Cite
Abdulnour, S.; Baril, C.; Abdulnour, G.; Gamache, S. Implementation of Industry 4.0 Principles and Tools: Simulation and Case Study in a Manufacturing SME. Sustainability 2022, 14, 6336. https://0-doi-org.brum.beds.ac.uk/10.3390/su14106336
Abdulnour S, Baril C, Abdulnour G, Gamache S. Implementation of Industry 4.0 Principles and Tools: Simulation and Case Study in a Manufacturing SME. Sustainability. 2022; 14(10):6336. https://0-doi-org.brum.beds.ac.uk/10.3390/su14106336
Chicago/Turabian StyleAbdulnour, Samir, Chantal Baril, Georges Abdulnour, and Sébastien Gamache. 2022. "Implementation of Industry 4.0 Principles and Tools: Simulation and Case Study in a Manufacturing SME" Sustainability 14, no. 10: 6336. https://0-doi-org.brum.beds.ac.uk/10.3390/su14106336