1. Introduction
Solid waste represents any substance that may result from various human activities and has no value to people who possess it and thus it is discarded as useless [
1]. Solid waste can be categorized into three main categories: municipal, agricultural, and industrial [
2]. Our particular interest is the municipal solid waste (MSW), which consists of everyday items that people use and then throw away such as food residues, cardboard, grass clippings, furniture, clothing, bottles, appliances, paint, batteries, and many others [
3]. The sources of MSW include homes, schools, hospitals, and businesses. The amounts of MSW that municipalities have to deal with are growing considerably due to global economic development, the increase in per capita income, the growth of population, rapid urbanization, and the increase in living standards [
4]. The per capita share of waste generation ranges from 0.11 kg per day to 4.5 kg per day and it is expected to increase at a rate of 19% by 2050 in high-income countries, and 40% in low-income and middle-income countries [
5]. Therefore, most countries are facing a considerable challenge to build effective solid waste management systems that are capable to treat and dispose of the total amount of daily generated municipal solid waste [
6].
There are a multitude of methods and technologies for the treatment and final disposal of MSW, such as open dump, landfills, recycling, incineration, composting, energy generation, and others [
7]. Inadequate disposal of solid waste has several effects on health and the environment [
8,
9,
10]. The problem of improper and inefficient disposal of solid waste materializes in developing countries due to the lack of effective solid waste management systems in those countries [
4,
11,
12]. In developing countries, only 10% of municipal solid waste is disposed of in a safe manner, while the remaining 90% is disposed of through open landfills and uncontrolled burning of waste [
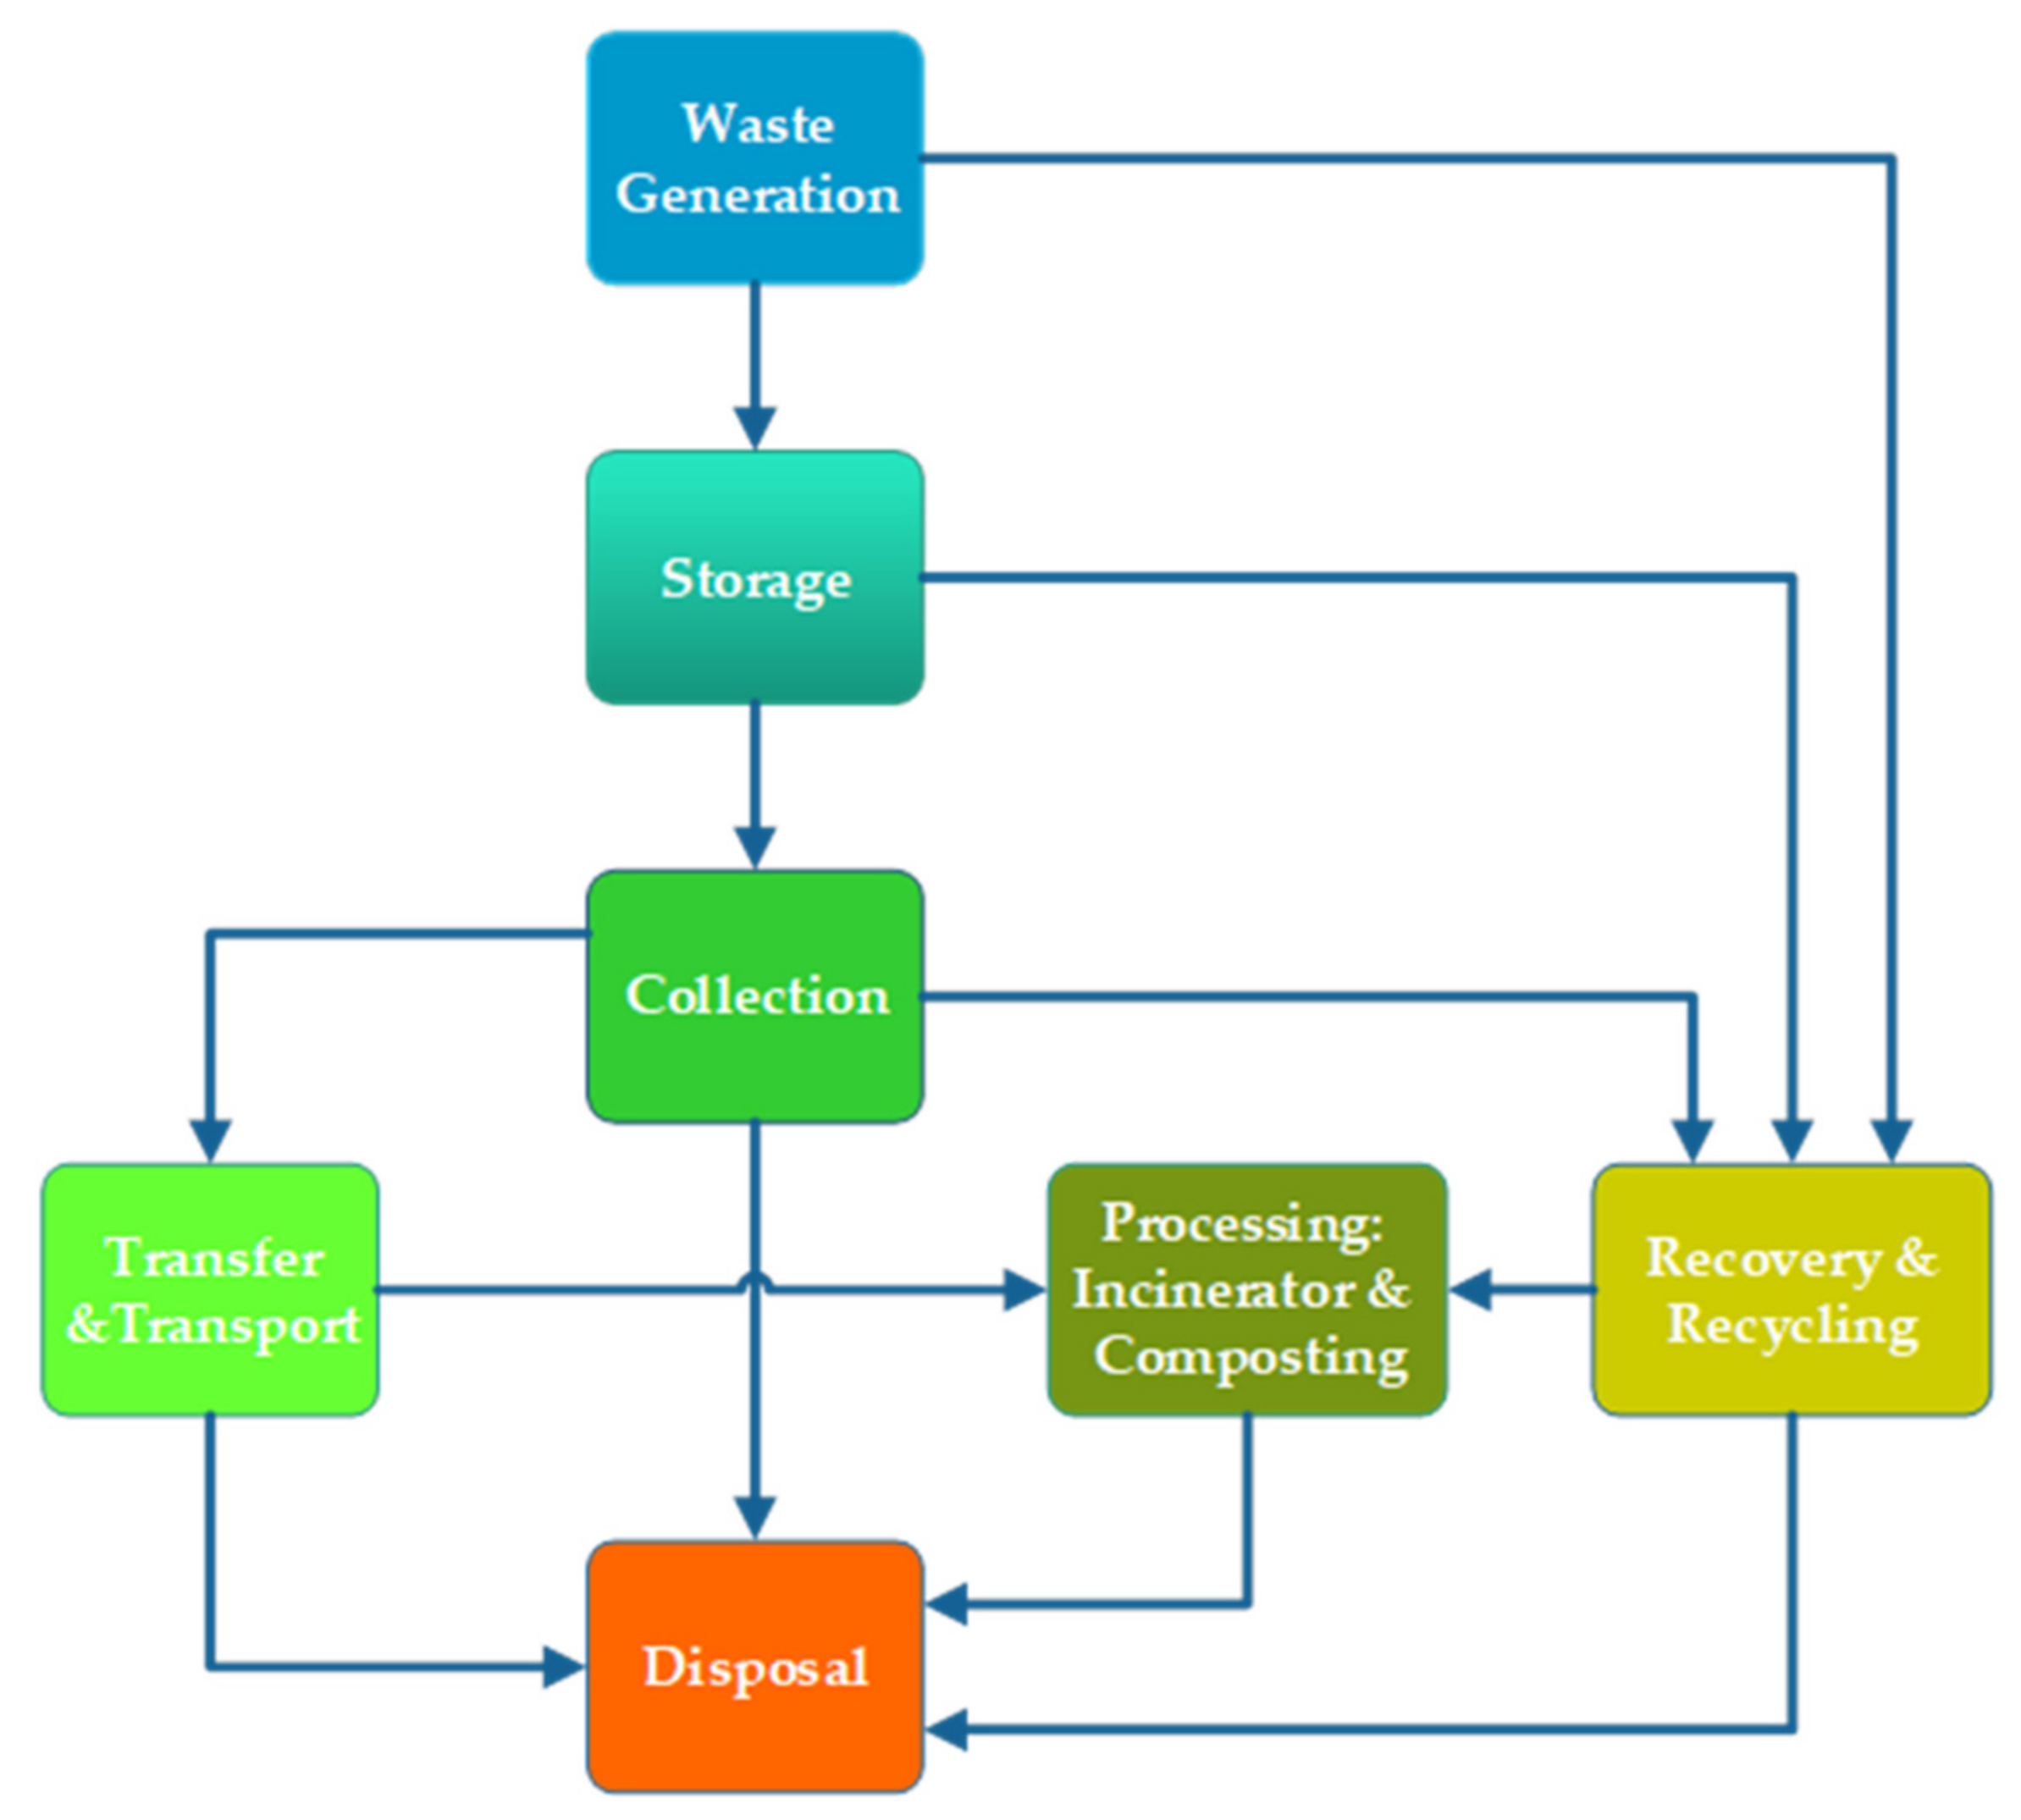
13]. Therefore, developing countries are striving to address this problem through establishing effective, economical, and sustainable solid waste management systems. A solid waste management system (SWMS) refers to a combination of various functional elements associated with solid waste management (see
Figure 1) [
14]. A SWMS should facilitate the collection, treatment, and disposal of solid waste in the community at minimal cost while safeguarding public health and ensuring little or no impact on the environment and ecosystem. The elements that make up the system start with waste generation sources, then the generated waste is sometimes stored in plastic bins, conventional landfills, waste oil drums, large storage bins, etc. The waste is then collected and transported through collection vehicles to collection/transfer stations. Waste sorting, which is the process of separating municipal solid waste into different types, may be performed at collection/transfer stations [
4]. In general, it can occur before or after the waste is collected, where this process can be integrated with the operations of processing/treatment plants (recycling plants, composting, etc.). Processing is required to change the physical and chemical properties of the waste for energy and resource recovery and recycling. Recovery involves separating valuable resources from mixed solid waste that is delivered to transfer stations or processing plants. Certain recovered materials such as glass, plastics, paper, and others can be recycled because they have economic value. Disposal is the ultimate destination of all solid waste.
Several SWMS configurations have been proposed, modeled, and investigated in the literature [
15,
16]. Those configurations vary in the type of facilities and technologies integrated within the SWMS, depending on the economic situation and strategies of the countries [
6,
7]. It has been observed that the proposed SWMS configurations for the developing countries that usually rely upon simple SWMS are different from the ones proposed for the developed countries that adopt more effective and sustainable SWMS [
3]. In addition, it has been noticed that the related research to the investigation of suitable SWMS configurations for developing countries is limited. SWMS configurations in lower-middle income countries (LMIC) often consist of waste sources, collection stations, composting or recycling plants, and landfills [
1,
2,
17]. In upper-middle-income countries (UMIC), the configurations are similar to LMIC, in addition to some different components such as incineration facilities and anaerobic digestion facilities to convert heat and methane to energy [
10,
18]. Conventional gasification, pyrolysis gasification, pyrolysis arc gasification, chemical recycling, and heat recycling are different station components of SWMS configuration in UMIC [
19,
20]. There is no standard configuration for SWM that suits all cities and countries, and therefore the selected configuration for a certain country should be related to the economic situation of the country and the strategies adopted in the country. Moreover, the existing solid waste management systems can be adapted to cope with the new changes in the countries’ conditions and strategies. However, the adopted SWMS configuration must be designed, planned, and operated optimally.
A major problem that faces developing countries is to design and establish effective, economic, and sustainable solid waste management systems for their cities [
4]. This problem can be considered a multi-echelon supply chain network design optimization problem [
19,
21]. This problem entails the determination of the optimal configuration of the solid waste management system that can handle the daily generated municipal solid waste at minimum cost (maximum profit), considering the different system constraints. The main costs incurred in solid waste management systems include fixed and variable costs of facilities, and transportation costs. The possible sources of revenues in such systems are the recovered products, recycled materials, generated thermal and electrical energy, and composting products. The decisions related to the design of the supply chain network of such systems include the determination of the types, numbers, locations, and capacities of the different facilities that should be installed in the SWMS. The decisions also include the selection of the suitable technologies for the different SWMS facilities. Moreover, the optimal flow of waste throughout the SWMS should be determined. The aforementioned design decisions must be determined in light of specific optimization criteria such as cost minimization [
22], profit maximization [
23,
24], and/or environmental impact minimization [
25]. Most of the existing research considers the cost minimization models for determining the optimal designs of SWMS configurations, especially in developing countries that have limited budgets to allocate for solid waste management [
2,
14].
Significant attention has been devoted to the optimization of municipal solid waste management systems [
16,
18,
26,
27]. In this regard, several mathematical optimization models have been presented in the literature to support the supply chain network design of SWMS [
21,
28] Most of the existing models are mathematically formulated as MILP models and have single objective functions and possess specific assumptions that limit their applications to specific cities and countries [
15,
22,
29]. Others have formulated mathematical models that can consider multiple objectives [
19,
30,
31]. Nevertheless, limited research has been directed to develop optimization models that can be easily employed or adopted to optimally design solid waste management systems in developing countries [
2]. With respect to Egypt, limited optimization models have been developed for the potential SWMS configurations that can be deployed in Egypt. Badran and El-Haggar [
2] developed an MILP model for a proposed SWMS configuration for Port-Said Governorate (Egypt) that consists of waste generation sources, collection stations, composting plants, and landfills. The model is formulated to determine the optimal number and location of collection stations and the optimal flow of waste that minimizes the total daily cost. The model assumes that the locations, numbers, and capacities of other facilities (composting and landfills) are known. Anwar et al. [
24] adapted the proposed MILP model by Badran and El-Haggar [
2] and applied it to determine the optimal SWMS configuration for Desoq District, Kafr El Sheikh Governorate, Egypt.
This research aims to propose a suitable SWMS configuration for developing countries, considering the proposed configurations in the related literature [
2,
24]. The proposed SWMS configuration assumes the presence of waste generation sources, collection/transfer stations, incinerators, recycling plants, and landfills. A generic MILP model has been formulated for this proposed SWMS configuration. The model is formulated to determine the optimal number and location of each type of facility, and the optimal number of trucks, and the optimal flow of waste in the system that minimizes the net daily cost incurred in the system. The applicability of the model has been demonstrated through a case study in an Egyptian governorate (Fayoum Governorate). A number of proposed scenarios for the design of the SWMS of Fayoum governorate have been investigated through the proposed optimization model. The optimization results indicate the governorate can achieve a considerable daily profit from its SWMS if it expands the capacities of the collection stations and recycling plants. Moreover, the reliance on landfills will be limited in the optimally designed SWMS.
The main contribution of this research includes the development of a generic MILP model that can be applied to optimally design solid waste management systems in developing countries. In particular, the model assumptions most suit the SWMS that can be deployed in Egyptian cities. However, the model can be readily adapted to apply to other countries. In addition, the optimal designs related to some proposed scenarios for the design of the SWMS of Fayoum Governorate (Egypt) have been provided.
This paper is organized as follows.
Section 2 presents the proposed SWMS configuration for developing countries and outlines the problem statement. In
Section 3, a new MILP model for the optimal design of the proposed SWMS configuration is described.
Section 4 outlines the application of the proposed MILP model to optimally design the SWMS of an Egyptian governorate. The results and discussions are reported in
Section 5. The conclusions and future research are summarized in
Section 6.
2. System Description
Waste management systems in the developing countries are limited to collection, transportation, and disposal, with no capabilities of recycling and reuse [
11]. Therefore, most of the developing countries are striving to adapt their solid waste management systems to cope with the growing challenges of the solid waste management problem and to build sustainable and effective systems. There is no standard SWMS configuration that suits all cities and countries [
29]. Ayvaz-Cavdaroglu et al. [
8] investigated the optimal mix of municipal solid waste management technologies (landfilling, composting, recycling, incineration, and anaerobic digestion) that should be adopted for the SWMS of Istanbul (Turkey). They formulated a multi-objective optimization model that can be employed to determine the optimal mix of technologies for a given waste composition and applied the model for the case of Istanbul. Badran and El-Haggar [
2] proposed the integration of collection stations with the existing SWMS configuration of Port-Said Governorate (Egypt) that relies upon composting plants and landfills. They developed a related MILP model to optimally integrate collection stations with the existing SWMS in that governorate. The literature includes several other attempts that have been made to propose, model, and optimize the suitable SWMS configurations for certain cities and countries [
15,
18,
24,
31].
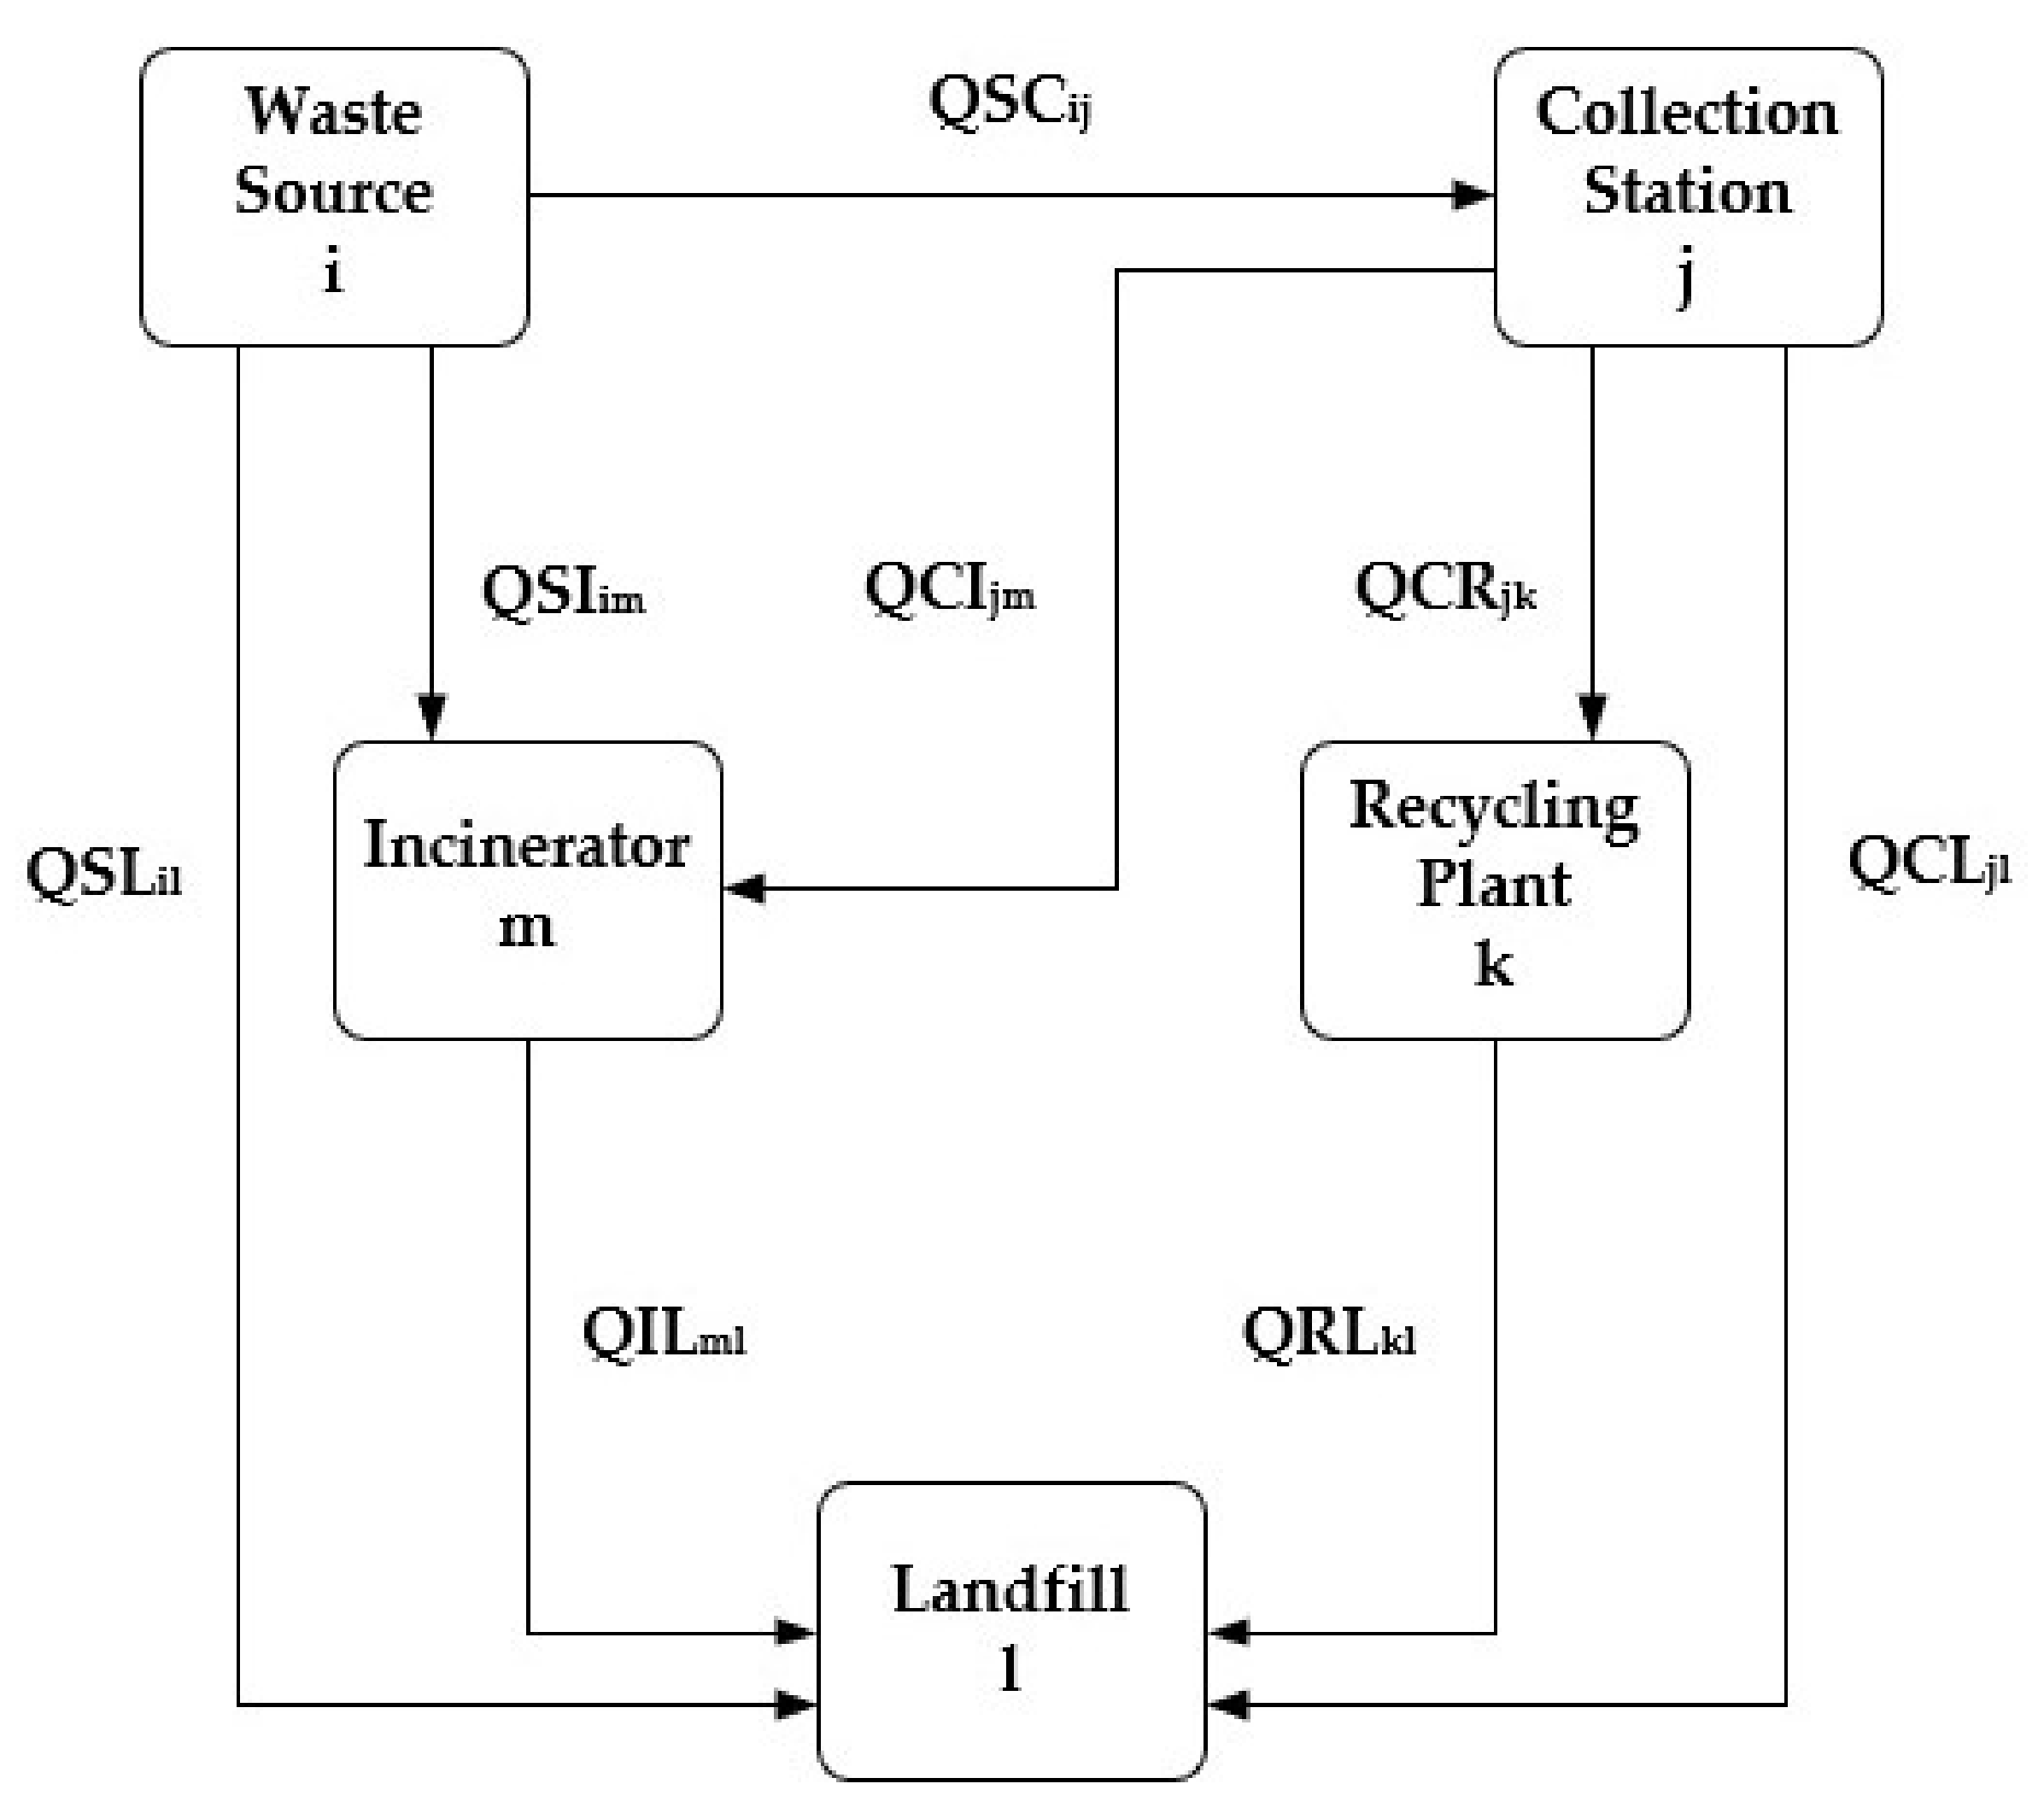
In this research, a SWMS configuration is proposed for the deployment in developing countries where it depends on the adoption of commonly used solid waste management technologies worldwide. The proposed SWMS configuration is assumed to include the following functional elements and facilities: waste generation sources, collection/transfer stations, incinerators, recycling plants, and landfills (see
Figure 2). A schematic diagram of the proposed SWMS configuration, indicating the waste flow through the different components and facilities of the system and the related decision variables, is shown in
Figure 2. The sources dispose of their generated waste to the nearest bins. The collection vehicles collect the waste (e.g., QSC
ij, QSI
im, QSL
il) from those bins and transfer to the assigned collection stations for this district. The total daily waste quantity received at the collection stations is distributed to the incinerators (QCI
jm), recycling plants (QCR
jk), and landfills (QCL
jl), according to a predetermined distribution plan. The collection stations have to be equipped with the sufficient number of trucks and other relevant resources needed for achieving the distribution plan. The incinerators are used to burn the received waste in a controlled manner and the remaining ash and residues (QIL
ml) are transferred to the landfills. The recycling plants attempt to recover most of the valuable materials in the received waste, while the remaining residues (QRL
kl) that can no longer be recovered are sent for final disposal at landfills.
The solid waste management system should be designed with the sufficient capacities that can handle the total quantity of daily generated waste. This requires making strategic decision related to the design of the supply chain network of the solid waste management system. The strategic decisions related to the supply chain network design of SWMS include the determination of the number, location, and capacities for the different facilities (collection stations, incinerators, recycling plants, and landfills). Other important strategic decisions include the determination of suitable technology for the different facilities, and the required resources to operate the system, such as the number and type of trucks to allocate for different facilities within the system. The planning decisions related to the optimal flow and distribution of the waste throughout the supply network can also be made during the strategic design phase (see
Figure 2). All those decisions have to be made such that the system can handle the total quantity of the daily generated waste at minimum cost. The total costs incurred in a SWMS can be divided into capital/fixed costs and variable costs. The fixed costs are the costs needed to establish the facilities that constitute the SWMS’s supply chain network. The variable costs include the operating and maintenance costs required to operate the different system’s facilities and the transportations costs. The recycling plants and incinerators can provide a source of revenue, which can then be deducted from the total system cost.
3. Mathematical Model Formulation
A new mixed integer linear programming (MILP) model for the proposed SWMS configuration described above has been formulated. The MILP model is formulated to determine the optimal design of the proposed SWMS configuration that minimizes the net daily cost incurred in the system. Moreover, the model determines the optimal flow of the solid waste in the system. Some assumptions have been made to facilitate the model formulation, considering the adopted assumptions in the relevant models presented in the literature [
2]. It is assumed that the collection efficiency at each source i is 100% and the total amount of daily generated waste at each source S
i is collected at a single point in the center of that source. It is also assumed that the fixed cost of the different facilities in the system can be calculated on daily basis.
The indices, parameters, and decision variables of the formulated MILP for the proposed SWMS configuration are defined as follows:
Indices:
| i | Waste source, where i = 1, …, I. |
| j | Potential location of collection station, where j = 1, …, J. |
| k | Potential location of recycling plant, where k = 1, …, K. |
| m | Potential location of incinerator, where m = 1, …, M. |
| l | Potential location of landfill, l = 1, …, L. |
Model parameters:
| Si | Amount of daily waste generated at source i (ton/day). |
| Cj | Daily capacity of collection station j (ton/day). |
| Rk | Daily capacity of recycling plant k (ton/day). |
| LCl | Daily capacity of landfill l (ton/day). |
| ICm | Daily capacity of incinerator m (ton/day). |
| TCSCij | Transportation cost from waste source i to collection station j ($/ton). |
| TCSIim | Transportation cost from waste source i to incinerator m ($/ton). |
| TCSLil | Transportation cost from waste source i to landfill l ($/ton). |
| TCCIjm | Transportation cost from collection station j to incinerator m ($/ton). |
| TCCRjk | Transportation cost from collection station j to recycling plant k ($/ton). |
| TCCLjl | Transportation cost from collection station j to landfill l ($/ton). |
| TCRLkl | Transportation cost from recycling plant k to landfill l ($/ton). |
| TCILml | Transportation cost from incinerator m to landfill l ($/ton). |
| VCCj | Variable cost (O&M) incurred in collection station j ($/ton). |
| VCRk | Variable cost (O&M) incurred in recycling plant k ($/ton). |
| VCLl | Variable cost (O&M) incurred in landfill l ($/ton). |
| VCMm | Variable cost (O&M) incurred in incinerator m ($/ton). |
| CTCj | Daily fixed cost of γ-ton truck allocated to collection station j ($/day). |
| CTIm | Daily fixed cost of γ-ton truck allocated to incinerator m ($/day). |
| CTRk | Daily fixed cost of γ-ton truck allocated to recycling plant k ($/day). |
| FCCj | Daily fixed cost of collection station j ($/day). |
| FCRk | Daily fixed cost of recycling plant k ($/day). |
| FCLl | Daily fixed cost of landfill l ($/day). |
| FCIm | Daily fixed cost of incinerator m ($/day). |
| ∂ | Number of truck daily trips (trips/day). |
| γ | Truck capacity (ton). |
| RIm | Revenue per unit for incinerator m ($/unit). |
| RRk | Revenue per unit for recycling plant k ($/ton). |
| Z | Very large number. |
| pk | Conversion ratio of recycling plant k (%). |
| nm | Conversion ratio of incinerator m (%). |
Decision variables:
| QSCij | The amount of daily municipal solid waste transported from waste source i to collection station j (ton/day). |
| QSIim | The amount of daily municipal solid waste transported from waste source i to incinerator m (ton/day). |
| QSLil | The amount of daily municipal solid waste transported from waste source i to landfill l (ton/day). |
| QCIjm | The amount of daily municipal solid waste transported from collection station j to incinerator m (ton/day). |
| QCRjk | The amount of daily municipal solid waste transported from collection station j to recycling plant k (ton/day). |
| QCLjl | The amount of daily municipal solid waste transported from collection station j to landfill l (ton/day). |
| QRLkl | The amount of daily unrecovered municipal solid waste transported from recycling plant k to landfill l (ton/day). |
| QILml | The amount of daily incineration byproducts transported from incinerator m to landfill l (ton/day). |
| XCj | Total number of γ-ton trucks allocated to collection station j. |
| XRk | Total number of γ-ton trucks allocated to recycling plant k. |
| XIm | Total number of γ-ton trucks allocated to incinerator m. |
| PCj | A binary decision variable where PCj = 1, if a collection station is installed at potential location j, and PCj = 0, otherwise, where j = 1, …, J. |
| PRk | A binary decision variable where PRk = 1, if a recycling plant is installed at potential location k, and PRk = 0, otherwise, where k = 1, …, K. |
| PIm | A binary decision variable where PIm = 1, if an incinerator is installed at potential location m, and PIm = 0, otherwise, where m = 1, …, M. |
| PLl | A binary decision variable where PLl = 1, if a landfill is established at potential location l, and PLl = 0, otherwise, where l = 1, …, L. |
| Y | A binary decision variable where Y = 1, if the total amount of daily generated waste at all sources exceeds the total capacity of all potential collection stations and potential incinerators, and Y = 0, otherwise. |
The complete MILP model is formulated as follows:
The objective Function (1) minimizes the net daily cost incurred in the entire solid waste management system. The net daily cost (NDC) includes five components where the first component represents the daily fixed costs of collection stations, recycling plants, incinerator, and landfills. The second component represents the variable costs (O&M) incurred at the different facilities in the system (collection stations, recycling plants, incinerator, and landfills). The third component represents the transportation cost that results from transferring the amount of waste from any station to another one. The fourth component represents the daily fixed costs of the trucks allocated to the collection stations, recycling plants, and incinerators. The last component in the objective function represents the revenue from both the recycling plants and incinerators, respectively.
Constraints (2) ensure that the amount of daily generated waste at each source must be equal to the total amount of waste transferred to collection stations, incinerators, and landfills. Constraints (3) ensure that the daily amount of waste transferred to each collection station j cannot exceed the daily capacity of that station. Constraints (4) indicate that the daily amount of waste transferred to each landfill l cannot exceed the daily capacity of that landfill. Constraints (5) ensure that the daily amount of waste transferred to each recycling plant k cannot exceed the daily capacity of that recycling plant. Constraints (6) indicate that the daily amount of waste transferred to each incinerator m cannot exceed the capacity of that incinerator. Constraints (7) relate the number of trucks needed at each collection station j to the total daily amount of waste to be transferred from that station to the other facilities (recycling plants, incinerators, and landfills). In other words, this constraint ensures that each collection station j is equipped with a sufficient number of trucks. The constraints (8) to (9) also ensure that each of the recycling plants and the incinerators have sufficient number of trucks as well. Constraints (10) ensure that the daily amount of waste received at each collection station j is equal to the daily amount of waste distributed from that collection station to the other facilities. Constraints (11) balance the total daily amount of waste received at each recycling plant k and the daily quantity of rejects and unrecycled waste that are transferred to landfills for final disposal. Likewise, constraints (12) balance the amount of waste in and out the incinerators. Constraints (13) to (15) prioritize the waste flow in the system to both the collection stations and incinerators rather than the landfills. However, if the total amount of daily generated waste at all sources exceeds the total capacity of all potential collection stations and potential incinerators, the deficit waste amount will be transferred directly from sources to landfills. The remaining constraints (16) to (30) define the boundaries of the different decision variables.
4. Applying the Model to Egypt
Egypt is one of the developing countries and one of the most populous countries in the Middle East and North Africa with a population that amounted to 102 million people in 2020 and increases with a growth rate of about 1.9% [
32]. Egypt generates about 10 million tons/year of dry agricultural residues [
33], and about 26 million tons of municipal solid waste annually [
4]. The per capita share of municipal solid waste for the Egyptian governorates varies between 0.3 and 2.0 kg/capita/day [
4]. The composition of this waste includes about 56% organics, 13% plastics, 10% paper and cardboard, 4% glass, 2% metals, and 15% other material [
4]. The current solid waste management practices in Egypt involve the open dumping which accounts for 81% of generated waste while recycling and landfilling represent 12% and 7%, respectively. The country has ambitious plans to adapt its SWMS and thus the Egyptian governorates are faced with the strategic problems related the optimal supply chain network design of their solid waste management systems.
4.1. Background on Fayoum
Fayoum is one of the Egyptian Governorates that is located about 100 km to the southwest of Cairo. It has a population of about 3,848,708 in 2020 and a total area of 6068.70 Km2, representing 0.6% of the total area of Egypt. Fayoum governorate consists of six administrative districts: Fayoum, Sinnuris, Ibsheway, Itsa, Tamiyyah, and Youssef Al Seddik. The annual quantity of waste generated in Fayoum from the various waste sources (municipal, agricultural, industrial and others) is around 1.5 million tons as per the statistics of the year 2018. The amount of municipal solid waste generated daily amounts to 1950 tons, which consists of 552 tons from urban areas and 1398 tons from rural areas. The waste generation per capita ranges between 0.33 kg/day in rural areas and 0.63 kg/day in urban areas. The governorate collects about 1209 tons per day (62%), and about 3% of the daily generated waste is collected by scavengers, while the remaining amount is left in the streets or thrown to uncontrolled areas.
4.2. Data Collection
The application of the proposed MILP model to optimally design an integrated SWMS for Fayoum Governorate requires the collection of several data which are required by the model for the different components of the SWMS. The required data to collect includes the location of waste sources, the quantity of waste generated at each source, the location of current facilities (collection stations, recycling plants, and landfills) and their capacities, and the potential locations for the installation of new facilities. Other important data such as cost data for the different components of the system are also needed to apply the proposed MILP model.
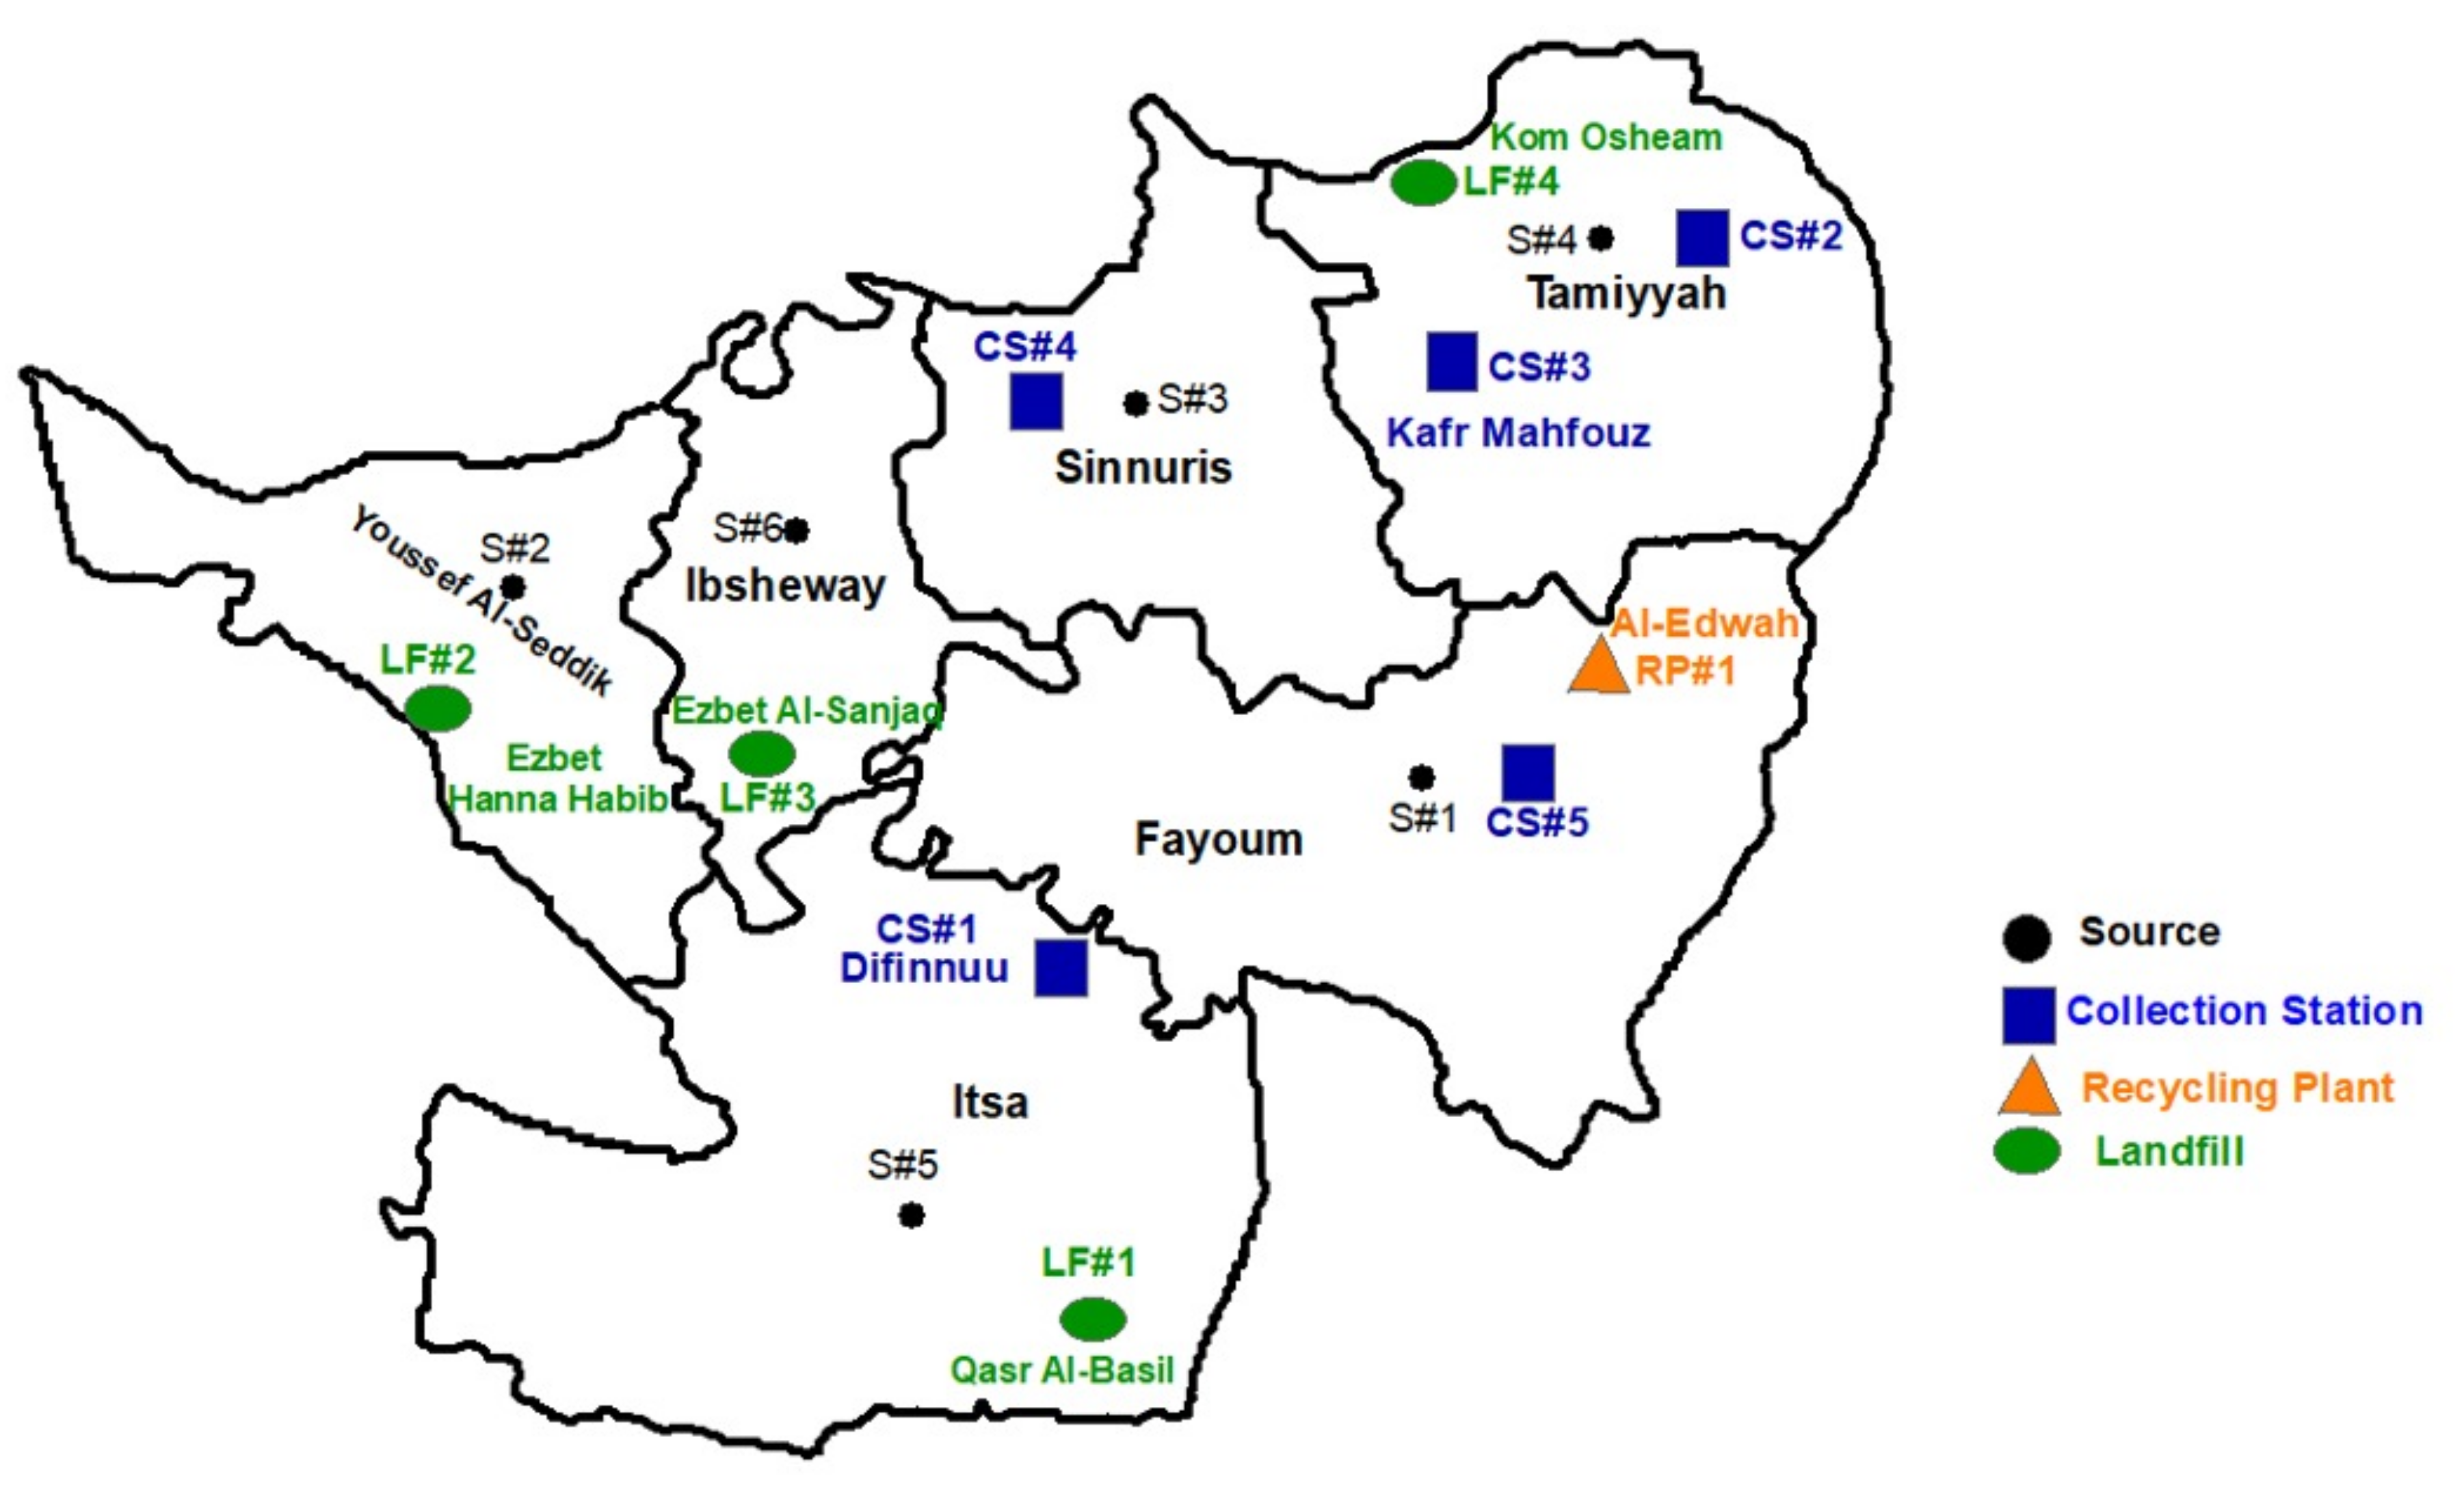
The current SWMS of Fayoum Governorate consists of six waste sources, five collection/transfer stations, one recycling plant, and four landfills. First, it is required to collect the waste generation data at the different waste sources in Fayoum. The amounts of the generated municipal solid waste in Fayoum are available at a district level, where Fayoum is divided into six districts as follows: Fayoum (S#1), Youssef Al-Seddik (S#2), Sinnuris (S#3), Tamiyyah (S#4), Itsa (S#5), and Ibsheway (S#6). Therefore, Fayoum is considered to include six sources of waste generation and the total amount of daily generated waste at each source (district) is assumed to be collected at the centroid of the respective district. The amounts of daily generated waste at the six waste sources are reported in
Table 1 [
34], and the locations of those sources are indicted on Fayoum Governorate map shown in
Figure 3.
There are five collection/transfer stations that are distributed throughout the governorate at the following locations: Itsa/Difinnu (CS#1), Tamiyyah (CS#2), Tamiyyah/Kafr-Mahfouz (CS#3), Sinnuris (CS#4), and Kom-Oshim (CS#4) [
34]. The approximate locations of these collection stations are marked on the map in
Figure 3. The related data to collection stations, including the fixed and variable costs and capacities, are reported in
Table 2. The current capacities of the collection stations are limited and not sufficient to handle the daily waste generation rate. Therefore, it is assumed that the capacities of the current collection station can be expanded to the capacity levels indicated in
Table 2 that are proportional to the amounts of generated waste in the respective districts. The related fixed and variable costs have been estimated with respect to the cost data available in a relevant report on the SWMS of Fayoum Governorate [
34]. It is assumed that the daily fixed costs per capacity unit (
$/day/ton) and the variable costs (
$/ton) are the same at all the collection stations.
Fayoum Governorate has four landfills that are located at Itsa/Qasr Al-Basil (LF#1), Youssef Al-Seddik/Ezbet Hanna Habib (LF#2), Ibsheway/Ezbet Al-Sanjaq (LF#3), and Kom Osheam (LF#4) [
34]. The first three landfills can be considered open dump landfills while the last one is a well-established landfill. The approximate locations of these landfills are marked on the map in
Figure 3. The required data for the landfills include the capacities and the fixed and variable costs. It has been assumed that the current landfills can be adapted into modern landfills with a capacity of 500,000 ton/year each. This capacity level is suggested in the “Master Plan for Integrated Municipal Waste Management” report prepared for Fayoum Governorate [
34]. The fixed and variable costs of the landfills have been estimated based on this official report and other published cost data in the literature [
24,
34].
The data required for recycling plants include potential locations for installing recycling plants, capacities, fixed and variable costs. Fayoum Governorate currently operates a recycling plant with a capacity of 130 ton/day, where this amount is sorted and treated into compost. The governorate plans to extend the capacity of the current plant and its facilities to be able to conduct sorting operations, produce compost and refuse-derived fuel (RDF) [
34]. Therefore, it is assumed the capacity of the existing recycling plant can be extended to 300 ton/day. The respective fixed and variable costs, revenue from recycled materials, compost and RDF, and conversion ratio have been adapted from the literature and official reports related to the SWMS in Fayoum Governorate [
24,
34].
The data related to the distances between the different facilities in the SWMS of Fayoum Governorate have been collected to estimate the unit transportation cost between the different facilities (L.E./ton). The unit transportation cost is a function of fuel consumption per Kilometer, fuel cost per liter, and travelled distance [
35]. In addition, the fixed costs of the trucks that need to be allocated to the different facilities have been estimated based on the pricing of 10-ton trucks [
24].
5. Results and Discussions
This section provides the optimization results for two proposed scenarios for the design of the SWMS of Fayoum Governorate. The proposed scenarios have been investigated using the proposed MILP model, considering the above-described data. The first scenario adopts the existing SWMS configuration in Fayoum Governorate where the MILP model is employed to determine the optimal number and location of collection stations and the optimal number and location of landfills. The model also determines the state of the current recycling plant at Fayoum. Moreover, the model determines the optimal flow of the waste throughout the system. Thus, the model is applied to determine the optimal design of the current SWMS configuration in Fayoum and the optimal flow of the waste in the system. The second scenario considers the complete configuration of the SWMS presented in
Figure 2. Accordingly, it is assumed that there are potential locations not only for installing collection stations and landfills (as in Scenario #1) but also for installing recycling plants and incinerators. Thus, the model decides about the number and locations of collection stations, recycling plants, and landfills. The incinerators are excluded from the analysis due to the lack of adequate data about those facilities.
The MILP model is implemented and solved using LINGO 18 on a laptop with Intel(R) Core (TM) i7-6500U CPU @ 2.50 GHz–2.60 GHz processor, and 8.00 GB RAM. The optimal solution of the model for both scenarios has been obtained in a few seconds. The optimization results for the first scenario indicates that the optimal design of the SWMS in Fayoum Governorate would incur a net daily cost of 143,394.9 L.E./day. The optimal solution suggests four collection stations, and a recycling plant and a landfill where their approximate locations are indicated on the map shown in
Figure 4. The detailed optimization results are provided in
Table 3 and
Table 4.
The optimization results of the first scenario indicate that four collection stations (CS#1, CS#2, CS#4, and CS#5) out of the five potential collection stations should be installed with a total capacity of 2400 ton/day. The optimal allocation of the generated waste at the different sources to these collection stations and the landfill is detailed in
Table 3. The results indicate that the generated waste at each source is collected and transported to the nearest collection station to that source (see
Figure 4). Most of the collection stations are assigned to a single source area except CS#4, which serves four sources and receives a total amount of daily generated waste of 960 ton/day. The results also indicate that no waste amounts will be transferred to the landfill.
The optimal distribution and allocation plan of the received waste at the collection stations to the recycling plant and the landfill is given in
Table 4. The recycling plant is allocated a total amount of 300 ton/day, which is equal to the maximum capacity of the plant. The recycling plant (RP#1) receives 60 ton/day and 240 ton/day from CS#1 and CS#5, respectively. The remaining amounts of the waste at the different collection stations are transferred to the landfill. Although the model is formulated to allow the direct transfer of waste from sources to landfills, the optimal solution favors to transfer all the generated waste to the collection stations first. This can be attributed to the high transportation cost per unit for the direct transportation of waste from sources to landfills. The economies of scale can be achieved through transferring the waste from sources to the collection stations, then to the landfills. Finally, the number of trucks that should be allocated to the collection stations and the recycling plant is found to be 18 trucks of 10-ton capacity.
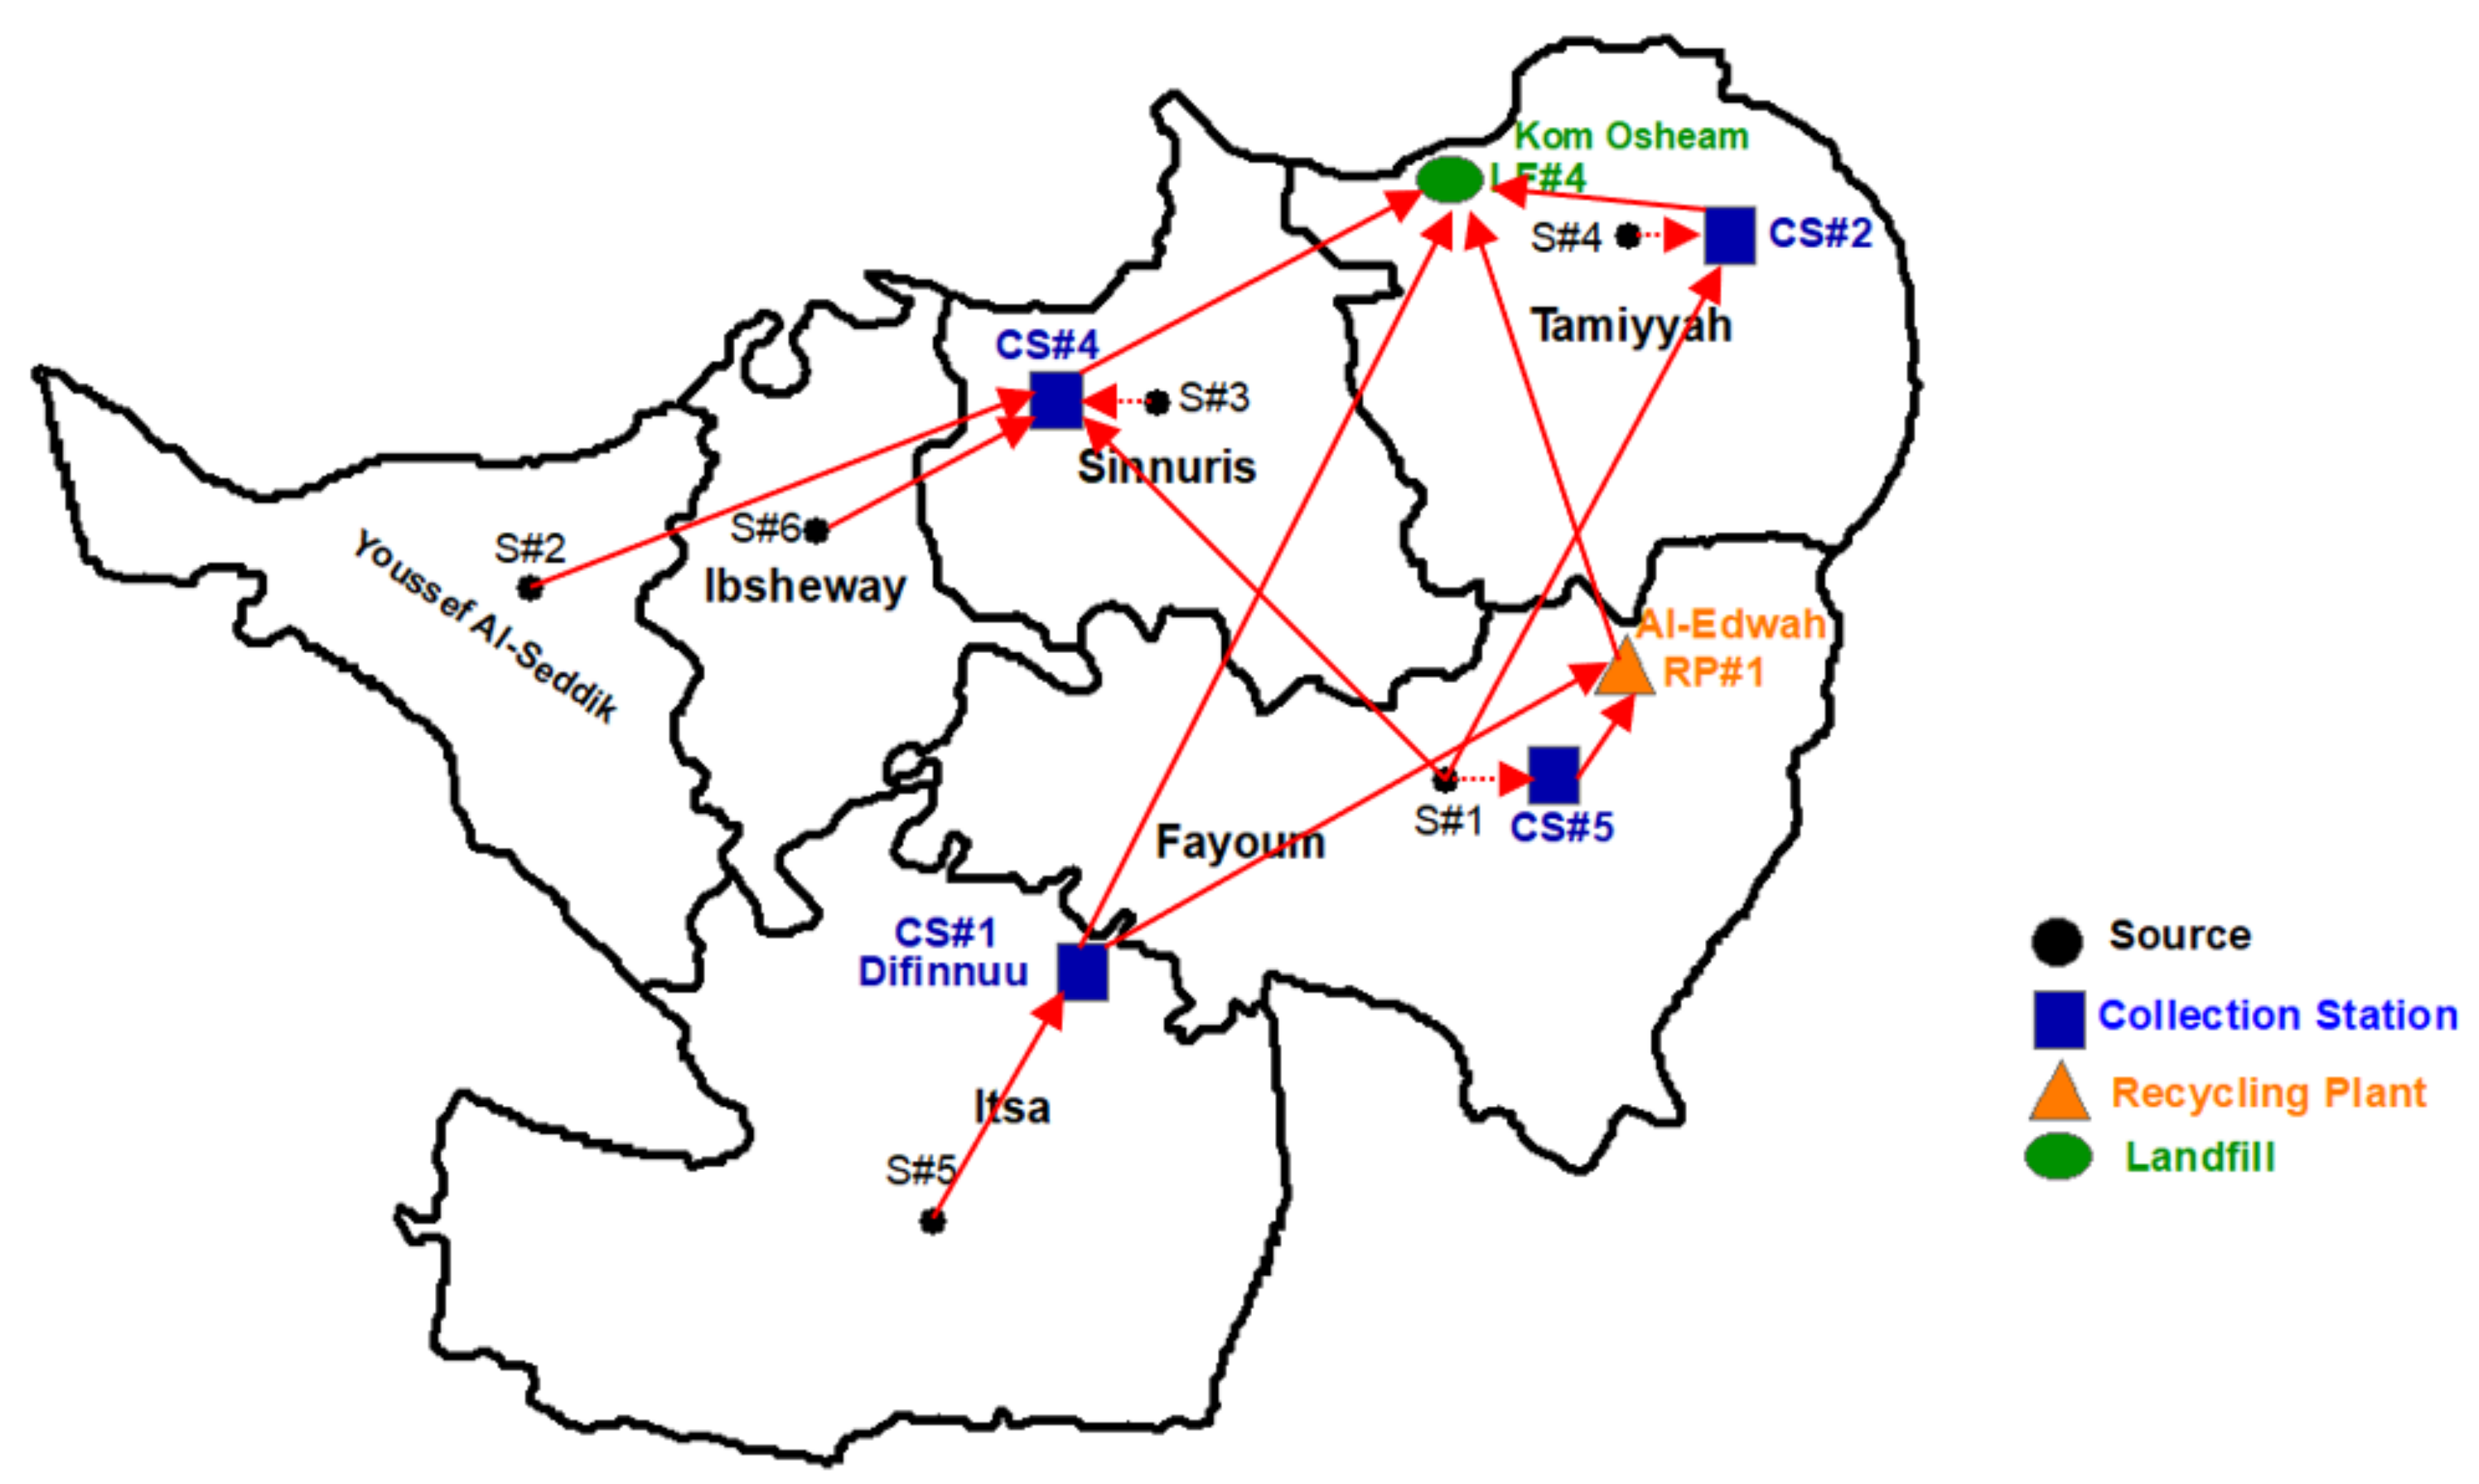
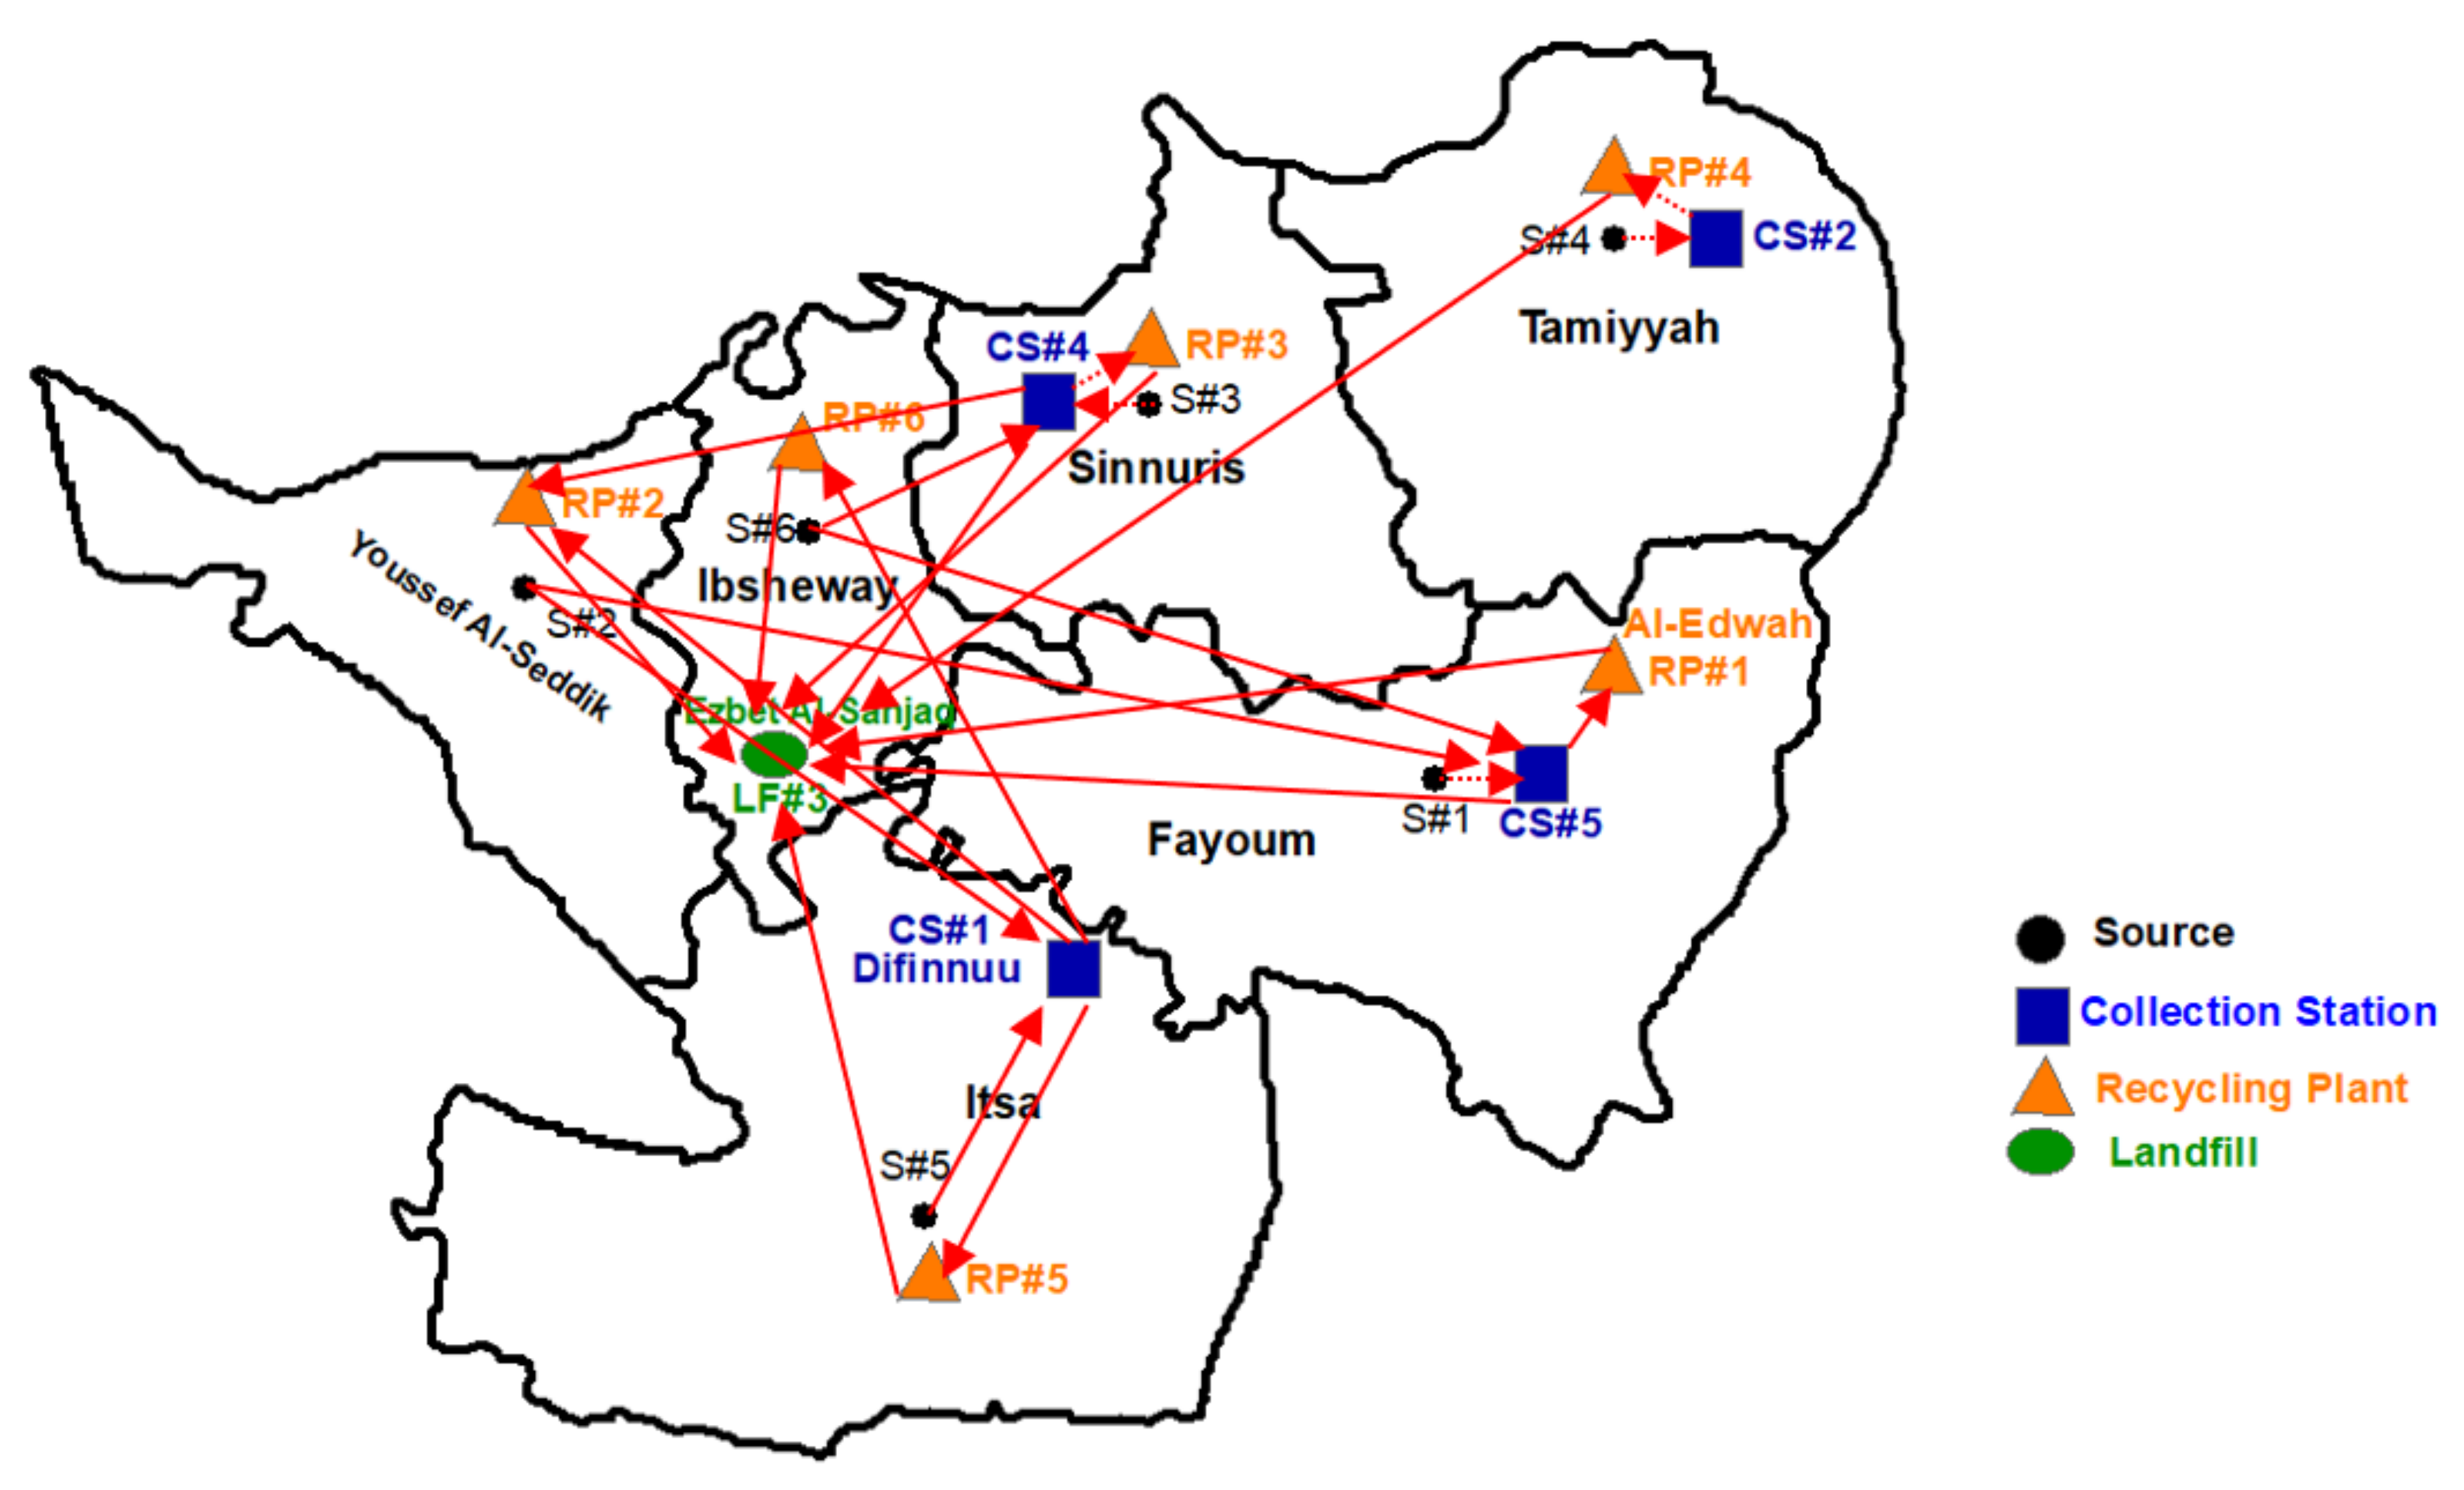
The optimization results for the second scenario indicates that the optimal design of the SMWS of Fayoum Governorate should integrate four collection stations, six recycling plants with a capacity of 300 ton/day each, and a landfill with a capacity of 500,000 ton/year. The locations of these facilities are marked on the map in
Figure 5. The obtained optimal design for Scenario #2 can achieve a daily profit of 232,554.9 L.E./day.
The detailed optimization results for the second scenario are provided in
Table 5 and
Table 6. The optimal distribution and allocation plan of the generated waste at the different sources to the collection stations and landfill is provided in
Table 5. All the daily generated waste is transferred to the collection stations and no waste is transferred directly from the sources to the landfills as in Scenario #1. The first collection station (CS#1) is fully utilized as it receives a total amount of 700 ton/day (247 ton/day from S#2 and 453 ton/day from S#5). The same applies to CS#2 which is fully utilized as it receives a total amount of 300 ton/day from the sources S#3 and S#4. The collection stations CS#4 and CS#5 have an unused capacity of 400 ton/day and 50 ton/day, respectively.
The optimal solution of the second scenario proposes to install a recycling plant with a capacity of 300 ton/day in each of the six potential locations for installing recycling plants. This indicates that a recycling plant is to be installed close to each waste generation source (district). The optimal distribution and allocation plan of the received waste at the collection stations to the recycling plants and landfills is detailed in
Table 6. All the recycling plants are fully utilized, and each recycling plant is allocated the waste from the nearest collection stations to it. The remaining amounts of the waste at the different collection stations and the residues/rejects at the recycling plants are transferred to the landfill. The required number of trucks that are needed for the collection stations and the recycling plants is estimated as 23 trucks of 10-ton capacity.
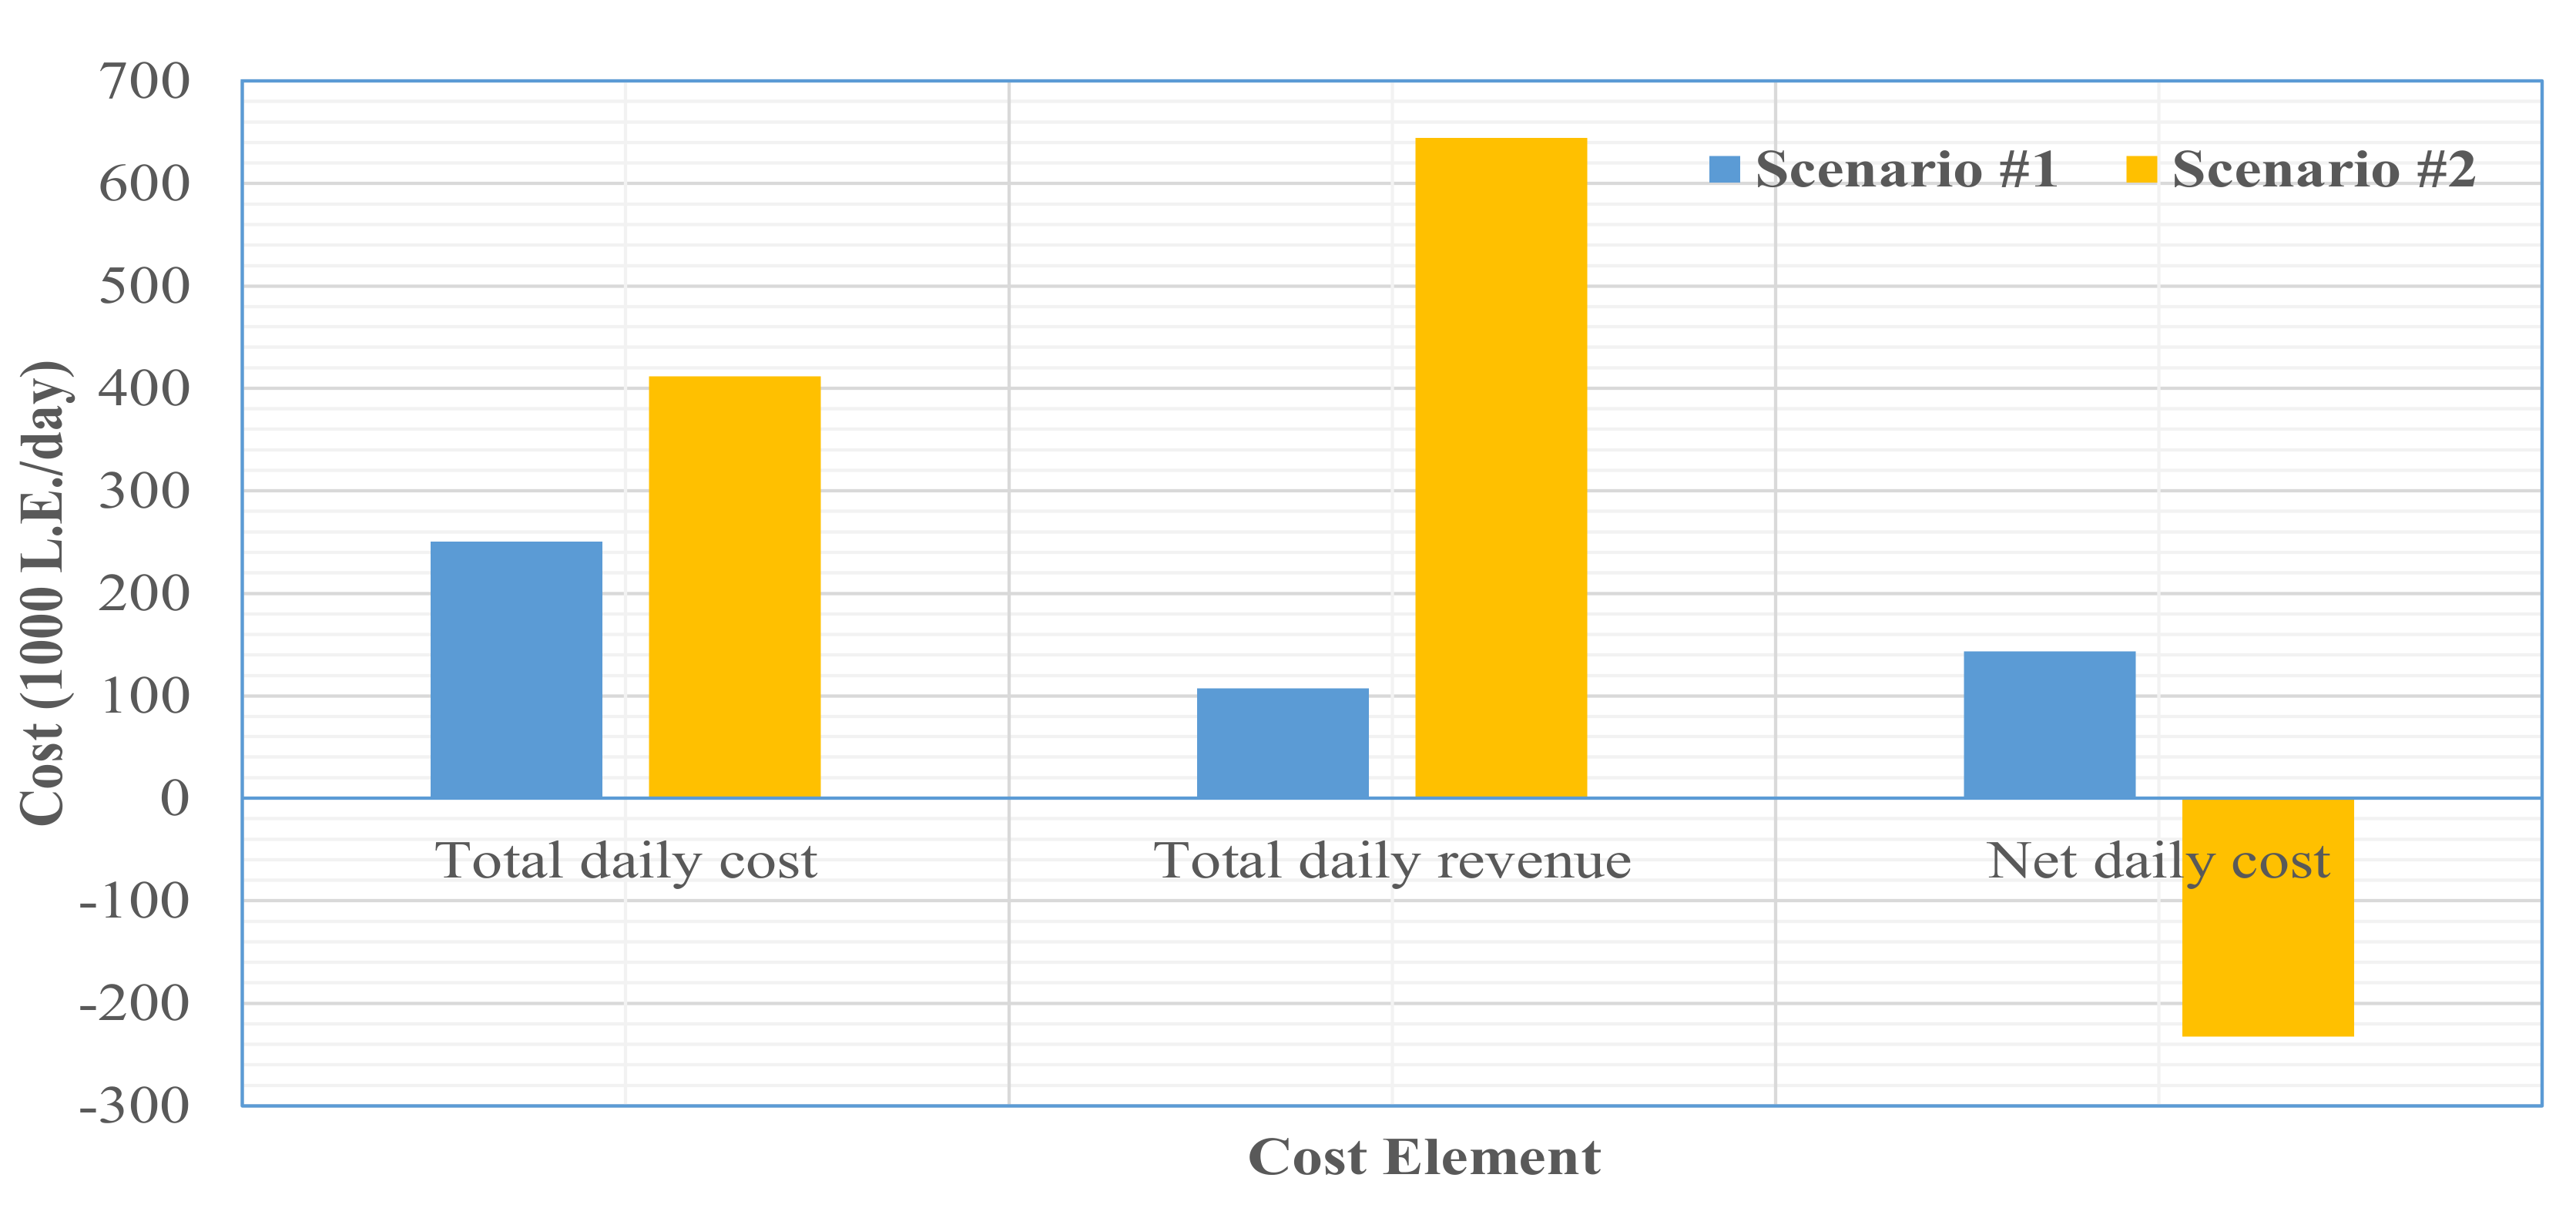
A comparison between the two scenarios, based on total daily cost, total daily revenue, and net daily cost, is provided in
Figure 6. The results indicate that although the total daily costs increase in the second scenario due to the increase in the number of recycling plants, this increase will be coupled with a considerable increase in the daily revenue obtained from those plants. This implies that the Egyptian governorates should expand the number and capacities of the recycling plants within their solid waste management systems. However, the decisions related to the location and number of those plants should be determine optimally considering their interactions with the existing system. In this regard, the proposed MILP model can support the decision makers to test and compare different scenarios for the design of SWMS in the Egyptian governorates and in developing countries as well.
The MILP model has been used to investigate the impact of recycling plant capacity on the optimal design of the SWMS of Fayoum Governorate for both scenarios. The impact of the recycling plant capacity on the net daily cost in both scenarios is presented in
Table 7 and
Table 8. The reported results in
Table 7 and
Table 8 also include the number of recycling plants, and the total capacity of the recycling plants related to the investigated capacity levels. The optimal solutions for all the tested cases in both scenarios include four collection stations and one landfill. In Scenario #1, the results indicate that there is a linear decrease in the net daily cost as the recycling plant increases (see
Table 7). This linear relationship exists since the model has no flexibility in Scenario #1 to change either the locations or the number of recycling plants in the solution. The model can only provide the optimal flow of the waste from the different collection station to the recycling plant, for a given capacity level. It is expected that the system will achieve a daily profit (negative net daily cost) if the recycling plant capacity exceeds 800 ton/day.
In Scenario #2, there are several potential locations for installing the recycling plants. Thus, the model has the flexibility to change the number and locations of the recycling plants for a given capacity level, to obtain better solutions. Different levels of the recycling plant capacity have been investigated for Scenario #2 and the respective optimal solution have been obtained as reported in
Table 8. The results confirm that increasing the total capacity of the recycling plants will lead to a profitable system and that further improvements can be obtained when a large number of potential locations for installing recycling plants is available.
6. Conclusions
This research has presented a decision-making tool that can support the design of supply chain networks for solid waste management systems. First, a proposed solid waste management system (SWMS) configuration that suits the conditions of developing countries (particularly Egypt) has been proposed. The proposed SWMS configuration integrates waste generation sources, collection/transfer stations, recycling plants, incinerators, and landfills. A new mixed integer linear programming (MILP) model that can be applied to determine the optimal design of the proposed SWMS configuration, and that minimizes the net daily cost incurred in the system, has been formulated. The proposed MILP model is formulated to determine the optimal number and locations of the different facilities integrated in the system (collection stations, recycling plants, landfills, and incinerators), and to determine the optimal flow of the waste through the system.
The applicability of the proposed MILP model has been demonstrated through a case study based on Fayoum Governorate, Egypt. The optimal designs for two proposed scenarios for the design of a suitable SWMS for Fayoum Governorate have been obtained. The first scenario considers the current SWMS configuration in Fayoum while the second scenario considers the possibility to extend the existing SWMS, considering the proposed SWMS configuration for developing countries. The optimal network design of the SWMS configuration in Scenario #1 includes four collection stations, one recycling plant, and one landfill, and this provides a minimum net daily cost of 143,394.9 L.E./day. The optimization results for Scenario #2 favors increasing the number of recycling plants into six recycling plants while keeping four collection stations and one landfill. The optimal design obtained for Scenario #2 is expected to achieve a daily profit of 232,554.9 L.E./day, which provides a sustainable and effective SWMS for the governorate. Accordingly, the MILP model has helped the investigation of the optimality of existing system and helped test the suitability of different system configurations. Although the proposed MILP model has been tested on an Egyptian case, it can also be applied to optimally design the SWMS configurations of developing countries whose conditions suit the model assumptions.
The MILP model has been employed to investigate the impact of the recycling plant capacity on the optimal design and net daily cost for both scenarios. The results indicate that the Egyptian governates should expand the number and capacities of the existing recycling plants. Furthermore, the decisions related to the number, capacity and locations of those plants should be determined optimally. The success to optimally design SWMS configurations would help the Egyptian governorates to have sustainable, effective, and economic solid waste management systems.
Future research should extend the proposed MILP model to consider other decision aspects related to the design of solid waste management system. The inclusion of other solid waste technologies such as energy generation may be considered. The model can be adapted to consider the capacity decisions for the different facilities, the impact of facility capacity on its operations efficiency and variable costs, the impact of location on fixed and variable costs, and the stochastic nature of solid waste generation at the sources.


 ,
, 


