Article

Distribution Differentiation and Influencing Factors of the High-Quality Development of the Hotel Industry from the Perspective of Customer Satisfaction: A Case Study of Sanya

1
School of Tourism, Hainan University, Haikou 570228, China
2
Tourism Development and Management Research Center, Key Research Institute of Humanities & Social Sciences of Hubei Provincial Department of Education, Wuhan 430062, China
3
Tourism Development Institute, Hubei University, Wuhan 430062, China
4
Hainan Provincial Tourism Research Base, Haikou 570228, China
*
Authors to whom correspondence should be addressed.
Sustainability 2022, 14(11), 6476; https://0-doi-org.brum.beds.ac.uk/10.3390/su14116476
Submission received: 19 April 2022 / Revised: 21 May 2022 / Accepted: 24 May 2022 / Published: 25 May 2022

Abstract

:
Achieving customer satisfaction is an important goal of the high-quality development (HQD) of the hotel industry. The purpose of this study is to summarize the spatial distribution characteristics and influencing factors of the HQD of the hotel industry to better help improve hotel customer satisfaction and realize the HQD of the hotel industry. Taking Sanya as an example, this study applied kernel density analysis, grid analysis and a geographically weighted regression (GWR) model to reveal the distribution characteristics and influencing factors of the HQD of the hotel industry. The research results show that (1) from 2010 to 2020, both budget hotels and luxury hotels showed an increasing trend year by year and the degree of spatial agglomeration was continuously strengthened. (2) The overall HQD of the hotel industry in Sanya is at a medium to high level, but the development between different regions is unbalanced. The HQD level of the hotel industry in the eastern part of the city is better than that in the western region. (3) There are significant differences in the HQD level and its spatial distribution characteristics of budget hotels and luxury hotels. (4) Hardware facilities, price levels, market popularity and traffic conditions have a positive impact on the HQD level of the hotel industry, while hotel scale and business prosperity have a negative impact on the HQD level of the hotel industry. The public service level does not pass the significance test. The conclusions of this study can provide theoretical reference for the decision-making of HQD of urban tourism.

1. Introduction

The Fifth Plenary session of the 19th CPC Central Committee pointed out that China’s economy has shifted from a high-speed growth stage to a high-quality development (HQD) stage and is in a critical period of transforming the mode of development, optimizing the economic structure and transforming the driving force of growth [1]. For the service industry, achieving customer satisfaction is the fundamental requirement for its HQD [2,3]. In 2019, the Chinese government issued the Guidelines on HQD of the Service Industry in the New Era, stressing the need to constantly meet the needs of industrial transformation and upgrading and the needs of the people for a better life to provide support for high-quality economic development. The hotel industry is one of the three pillar industries of tourism and an important part of the modern service industry [4,5]. However, due to the low entry threshold of the industry, the number of various types of hotels has risen rapidly, which has led to practical problems, such as serious hotel homogeneity and poor customer experience [6,7,8,9,10]. At the same time, within the context of COVID-19, promoting the HQD of the hotel industry has become the key to its recovery and revitalization.
As an important aspect of enterprise competitive strategy, service quality is the source for enterprises to achieve high economic benefits [11]. The academic research on hotel service quality originated in the late 1970s and was borrowed from the overall quality management in the manufacturing industry [12]. In the early stage of the research, scholars mainly conducted a series of studies on the concept and dimensions of hotel service quality [13,14,15]. Since then, the five-dimensional model of service quality and the service quality (SERVQUAL) measurement scale proposed by Parasuraman, Zeiharrd and Berry have received extensive attention from academia and industry [16]. Many scholars consider it a method to evaluate the service quality of the hotel industry. For example, Getty and Thompson designed a service quality evaluation model for the hotel industry based on the service quality scale [17]. Wilkins, Merrilees and Herington addressed the antecedents and structure of service quality within the context of the luxury and first-class hotel sectors [18]. Subsequently, the research topic of quantitative evaluation of hotel service quality has developed rapidly around the world. In China, Dang Zhongcheng and Zhou Zhili established a model that measured the service quality in China’s hotel industry and utilized the model to measure the service quality of Xinyue Hotel [19]. Jou and Day integrated three-factor theory and importance–performance analysis (IPA) into a three-dimensional importance–performance analysis (3-D IPA) approach to identify the critical service quality attributes for hotel online booking [20]. With the development of internet technology, the evaluation methods and data sources of hotel service quality are scientific and diverse. Many scholars use customer comment data on tourism websites to establish a hotel service quality evaluation model [21,22,23]. In recent years, based on evaluations of hotel service quality, scholars have focused more attention on research topics such as hotel service quality management, influencing factors of hotel service quality and hotel service recovery [24,25,26,27]. Meanwhile, an increasing number of scholars have begun to investigate the relationship between customer satisfaction and hotel service quality. Customer satisfaction is a measure of the discrepancy between customers’ expectations before purchasing a service/product and their evaluation of this service/product after consumption [28,29]. Hotel customer satisfaction is not only consumers’ satisfaction with hotel products, service quality and price but also the consistency between the products or services provided by the hotel and consumers’ expectations [30,31]. Achieving customer satisfaction is crucial to the enhancement of a hotel’s image and its sustainable development [22,32]. Improving hotel service quality is a key step to achieve hotel customer satisfaction. Rnabc et al. verified that service quality had an important impact on hotel customer satisfaction through a structural equation model. The higher the level of the hotel is, the greater the impact [33]. Lyu et al. found that service quality has a significant effect on customer satisfaction, which could influence customer behavior [34]. Therefore, from the perspective of customer satisfaction, there is strong theoretical support for improving the quality of hotel services and then promoting the HQD of the hotel industry.
The analysis above suggests that the research results in this field are gradually enriched, and the research methods are also more diverse than ever. However, from the perspective of analysis, scholars mainly studied hotel service quality from the perspectives of management and psychology [35,36]. Few studies have focused on the spatial distribution characteristics and influencing factors of the HQD of the hotel industry from a spatial perspective. Second, from the perspective of data sources, previous studies mostly used questionnaire surveys and interviews to obtain data for analyzing hotel service quality and customer satisfaction [21,33,37]. In recent years, some scholars have tried to use online reviews to analyze hotel service quality, which has improved the scientificity of the data [21,22,23]. Third, from the perspective of case innovation, the existing research mainly focused attention on economically developed cities but lacked research on tourism-dependent small- and medium-sized cities.
Accordingly, it is of great theoretical and practical significance to comprehensively explore the spatial pattern and influencing factors of the HQD of the hotel industry in Sanya by using spatial analysis methods. This research aims to provide scientific evidence for improving hotel customer satisfaction and achieving the HQD of the hotel industry. We collected online review data of the hotel industry and POI data to investigate the spatial distribution characteristics and influencing factors of the HQD of the hotel industry in Sanya. Specifically, we (1) present the spatial distribution characteristics and laws of the HQD of the hotel industry, (2) identify the influencing factors and spatial heterogeneity of the HQD of the hotel industry and (3) give specific suggestions for promoting the HQD of the hotel industry.
The main innovations of this research can be described as follows. First, the ArcGIS technologies of spatial kernel density and grid analysis are used to systematically show the spatial distribution characteristics and rules of the HQD of the hotel industry in Sanya. Second, previous studies have mainly focused on cities with better economic development levels, but few studies have focused on a specific city. Therefore, it is typical and representative to take Sanya, a typical tourism-dependent city, as a case to study the spatial distribution characteristics and influencing factors of the HQD of the hotel industry. Third, this study applies the geographically weighted regression (GWR) model to explore the spatial heterogeneity of influencing factors of the HQD of the hotel industry and refines the explanation of the causes of the HQD of the hotel industry.
The rest of this article is organized as follows. In Section 2, we mainly describe the data sources and research methodology. In Section 3, we analyze the spatial distribution characteristics and influencing factors of the HQD of the hotel industry in Sanya. Section 4 is the discussion section. Section 5 presents our conclusions.

2. Materials and Methods

2.1. Study Area Overview

Sanya is located in the southernmost part of Hainan Island, with a total land area of 1919.58 square kilometers, including Yazhou District, Tianya District, Jiyang District and Haitang District. Sanya is the location of Gloria Resort Sanya, the first five-star resort hotel in China. The hotel industry has a long history and rapid development (Figure 1). By the end of 2019, the city had received 23.9633 million overnight tourists, with a total tourism revenue of 63.319 billion yuan. The main reasons for choosing Sanya as the research area are as follows. First, Sanya has a large number of hotels of various types, including high-star hotels, budget hotels and homestays, with abundant research samples. Second, the construction of the Hainan Free Trade Port and International Tourism and Consumption Center provides opportunities and broad market prospects for the HQD of the hotel industry in Sanya. Therefore, taking Sanya as a case study area has typical representativeness and practical significance. The study area is shown in Figure 2.

2.2. Data Sources

The hotel list and related attribute data (including opening year, room price, number of rooms, tourist network score, total number of online reviews) were obtained from the Qunar webpage (https://www.qunar.com/ (accessed on 20 December 2020)) using Python 3.6 software. After a series of filtering, deleting duplicate values, correcting error values and other operations, a total of 1630 hotels with complete data were finally obtained. Among them, there are 918 budget hotels and 712 luxury hotels. The time of data acquisition was from 20 December 2020 to 20 January 2021. The longitude and latitude coordinates of each hotel were queried using Baidu map, and then the data were verified to be reliable through field research and random telephone interviews. Using ArcMap10.8 software, https://developers.arcgis.com (accessed on 25 January 2021), the vector map of Sanya City was imported as the base map and the spatial coordinate points of the hotels were located to obtain the point distribution map. Through remote sensing image registration, this study digitally acquired the main traffic road network and water area of Sanya City. The POI data in this article came from the Gaode map open platform, and the acquisition time was January 2021. The data included five major categories: (1) public transport stops, (2) shopping places, (3) restaurants, (4) leisure places, (5) scenic spots and (6) scientific, educational and cultural venues.

2.3. Research Methodology

The kernel density analysis method, grid analysis method and geographically weighted regression model were selected in this study to analyze the research data and to solve the problems raised above. Kernel density analysis was used to explore the spatial and temporal evolution characteristics of the hotel industry in Sanya. Grid analysis was used to display the spatial distribution characteristics of the HQD of the hotel industry in Sanya. A GWR model was used to explore the influencing factors of the HQD of the hotel industry in Sanya and the spatial heterogeneity of influencing factors. Through the above methods, we were able to reveal the spatial distribution and influencing factors of the HQD of the hotel industry in Sanya.

2.3.1. Kernel Density Analysis

Kernel density analysis is used to calculate the unit density of the measured values of point and line elements in the specified neighborhood. It is widely used in the spatial clustering analysis of point data and can intuitively reflect the distribution of discrete measured values in continuous areas. This study mainly used kernel density analysis to explore the spatial distribution characteristics of the hotel industry in Sanya City. The calculation formula [38] is as follows:
f ( x ) = 1 n h i = 1 n k ( x x i n )
where k(·) is the kernel function, ( x x i ) is the distance from the estimated point x to the xi of the sample point, h is the broadband and f ( x ) represents the value of f at x estimated by the sample point.

2.3.2. Grid Analysis

Creating fishnet maps aims to generate a regular grid within the study area and render it to cover the whole study area. Due to the large difference in the area of districts and streets in Sanya, if directly analyzed, the spatial distribution characteristics of high-quality development of the hotel industry cannot be well revealed. Therefore, smaller spatial statistical units need to be delineated by creating fishnet maps. After debugging several times, the study area is divided into 982 research units with a size of 1.5 km × 1.5 km and then the results are visualized and observed.

2.3.3. Geographically Weighted Regression Model

The GWR method is a technique for exploring the spatial variation of the statistical associations between a dependent variable and a set of explanatory variables. Traditional regression methods, such as the ordinary least squares (OLS) regression method, are global statistics, which assume that the relationships under study are constant over space. In contrast to a global model, GWR permits the relationships between the dependent variable and independent variables to vary spatially [39]. At present, this method has been widely used in spatial data analysis in geography, the environment, meteorology and other fields. The calculation formula [40] is as follows:
y i = β 0 ( u i , v i ) + i n β k ( u i , v i ) x i k + ε i
where u i and v i are the spatial positions of location i, β 0 ( u i , v i ) acts as an intercept and β k ( u i , v i ) is the local estimated coefficient for the independent variable.
The weight matrix can be described using a Gaussian function as follows [40]:
w i j = exp ( d i j 2 h 2 )
where w i j is the weight for observation j within the neighborhood of observation i; d i j represents the distance between observations i and j; h denotes the kernel bandwidth.
To determine the best bandwidth value, we adopted the corrected Akaike information criterion (AICc) to search for the best value [40]:
A I C c = 2 n l n ( σ ) + n l n ( 2 π ) + n n + t r ( S ) n 2 t r ( S )
where σ is the maximum likelihood estimate of the variance of the random error term, t r ( S ) is the trace of the S-matrix and n is the number of sample cities.

2.3.4. Selection of Influencing Factors

Previous scholars have used questionnaire survey method, interview method and network text analysis method to study the influencing factors of the HQD of the hotel industry and found that the hotel scale, traffic conditions, hardware facilities and equipment, commercial prosperity and the distance to the scenic spot have an impact on the HQD of the hotel industry [41,42,43,44,45,46,47]. Based on the existing research results and considering the availability of data, we finally selected hardware facilities and equipment, price level, hotel scale, market popularity, traffic conditions, commercial prosperity and public service level as the influencing factors of the HQD of the hotel industry. Details of each variable influencing the HQD of the hotel industry are given in Table 1.
The specific description of the selection of influencing factors is as follows.
(1) Hardware facilities and equipment are represented by the year of opening or decoration of the hotel. Having good hardware facilities and equipment is one of the keys to the success of hotel operations. In addition, some studies have confirmed that hotel infrastructure has a positive role in promoting the HQD of the hotel industry [41].
(2) Price level is expressed by the average room price of the hotel. The hotel room price is determined by managers after comprehensive consideration of various factors. It can reflect the type of room, hotel grade and even service level and is closely related to the HQD of the hotel industry [42].
(3) The hotel scale is expressed by the total number of hotel rooms. Previous studies have shown that only when the hotel scale matches the customer demand and the market environment can it achieve high profitability and sustainable development [43] and then realize the HQD of the hotel industry.
(4) Market popularity is represented by the total number of online reviews. The key to the success of the development of the hotel industry is whether the product is welcomed by the market. To understand the relationship between market popularity and the HQD of the hotel industry, we refer to previous research and use the total number of online reviews to represent the hotel’s market popularity [44].
(5) Traffic conditions are expressed as the number of public transport stops within 1000 m of the hotel. On the one hand, as a prerequisite for industrial development, transportation has a significant impact on the location of the hotel industry [45]; on the other hand, tourists tend to choose hotels with good transportation infrastructure and high accessibility [46].
(6) The degree of commercial prosperity is expressed by the number of restaurants, shopping malls and entertainment venues within 500 m of the hotel. Business activities are diverse, including catering, shopping, leisure and entertainment. Commercial activities will bring prosperity to tourism, but excessive commercialization will destroy the original landscape of tourism destinations. The complex business environment will also affect the accommodation experience of tourists [47,48].
(7) The public service level is expressed by the number of universities, scientific research institutes within 1000 m of the hotel and A-level tourist attractions within 5000 m. Previous studies have confirmed that, the higher the level of public service, the higher the degree of hotel aggregation. At the same time, convenient public service is also an important factor for tourists to consider when choosing hotels [49].
Therefore, we propose the following research hypotheses.
(1) Hardware facilities and equipment have a positive role in promoting the HQD of the hotel industry.
(2) Price level has a positive impact on the HQD of the hotel industry.
(3) We are not sure whether the hotel scale will affect the HQD of the hotel industry.
(4) Market popularity has a positive effect on the HQD of the hotel industry.
(5) Traffic conditions can promote the HQD of the hotel industry.
(6) Commercial prosperity has a negative effect on the HQD of the hotel industry.
(7) The public service level has a positive impact on the HQD of the hotel industry.

3. Results

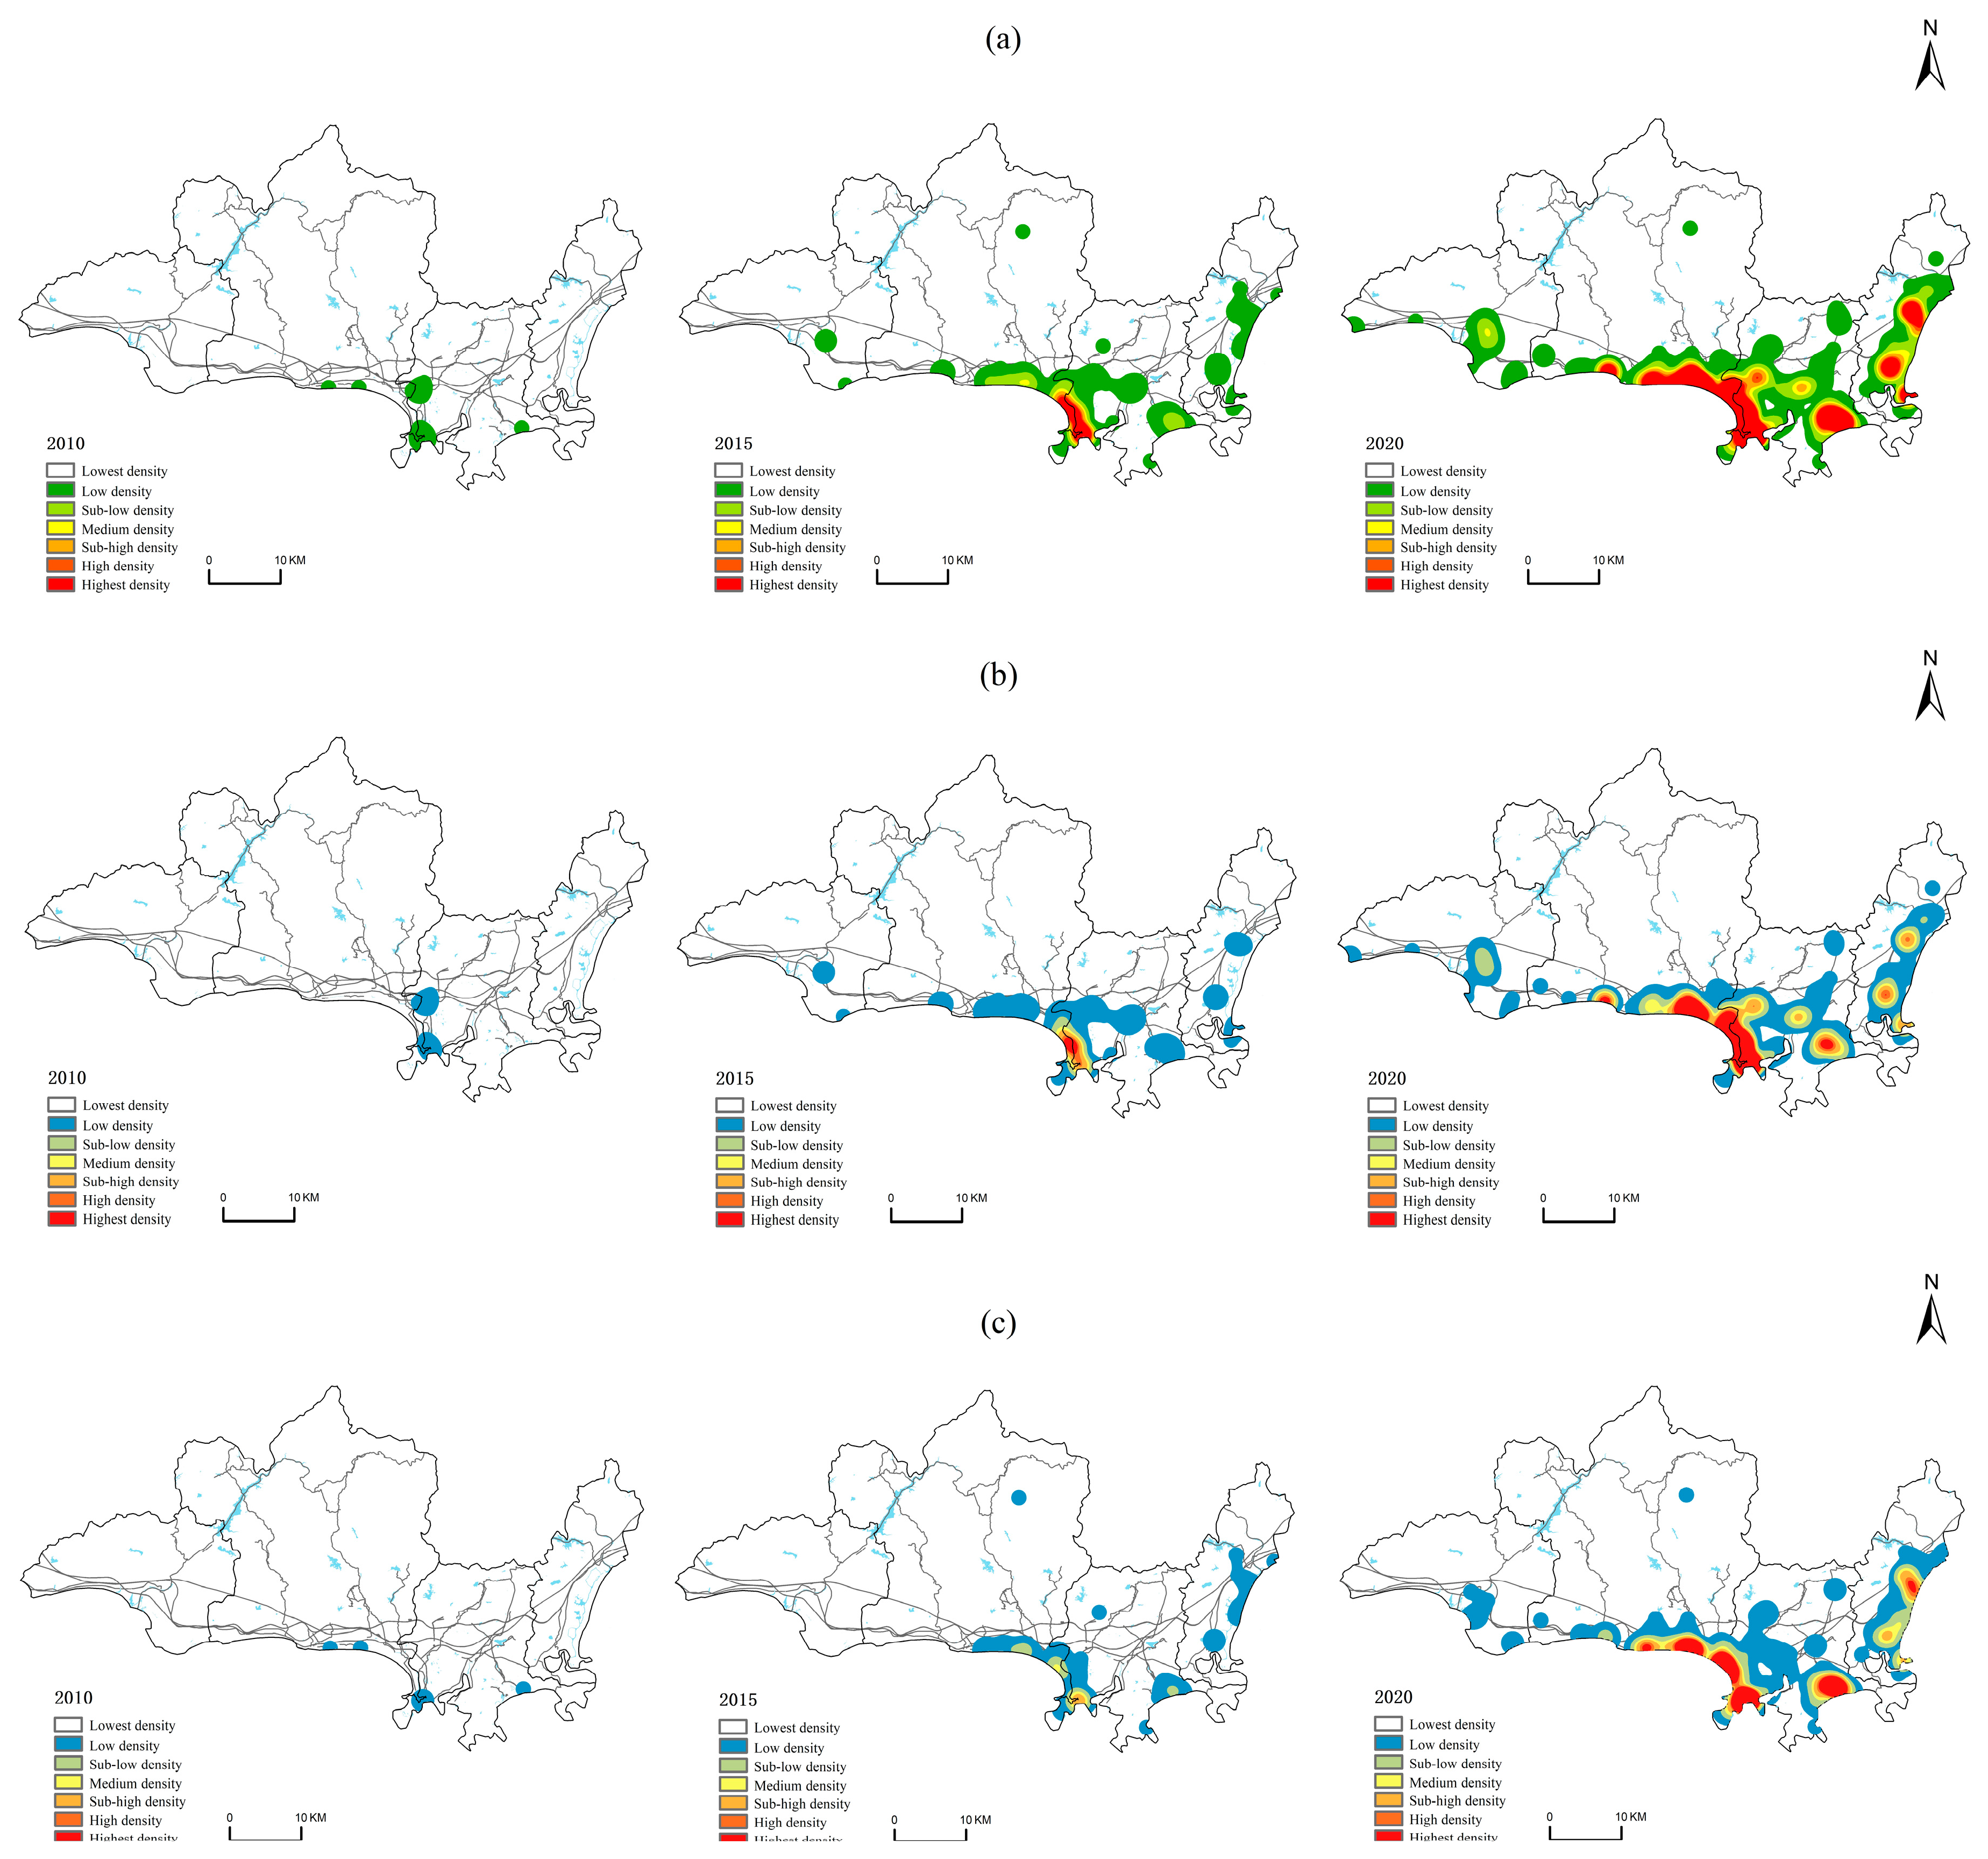
3.1. Spatiotemporal Evolution Distribution of the Hotel Industry

Before analyzing the spatial distribution characteristics of the HQD of the hotel industry in Sanya, we first analyzed the spatial distribution characteristics. In this step, we used kernel density analysis in the ArcGIS 10.8 spatial analysis tool, set the search radius to 2500 m and kept the default values for the rest. Then, we selected 2010, 2015 and 2020 as the time points for analysis.

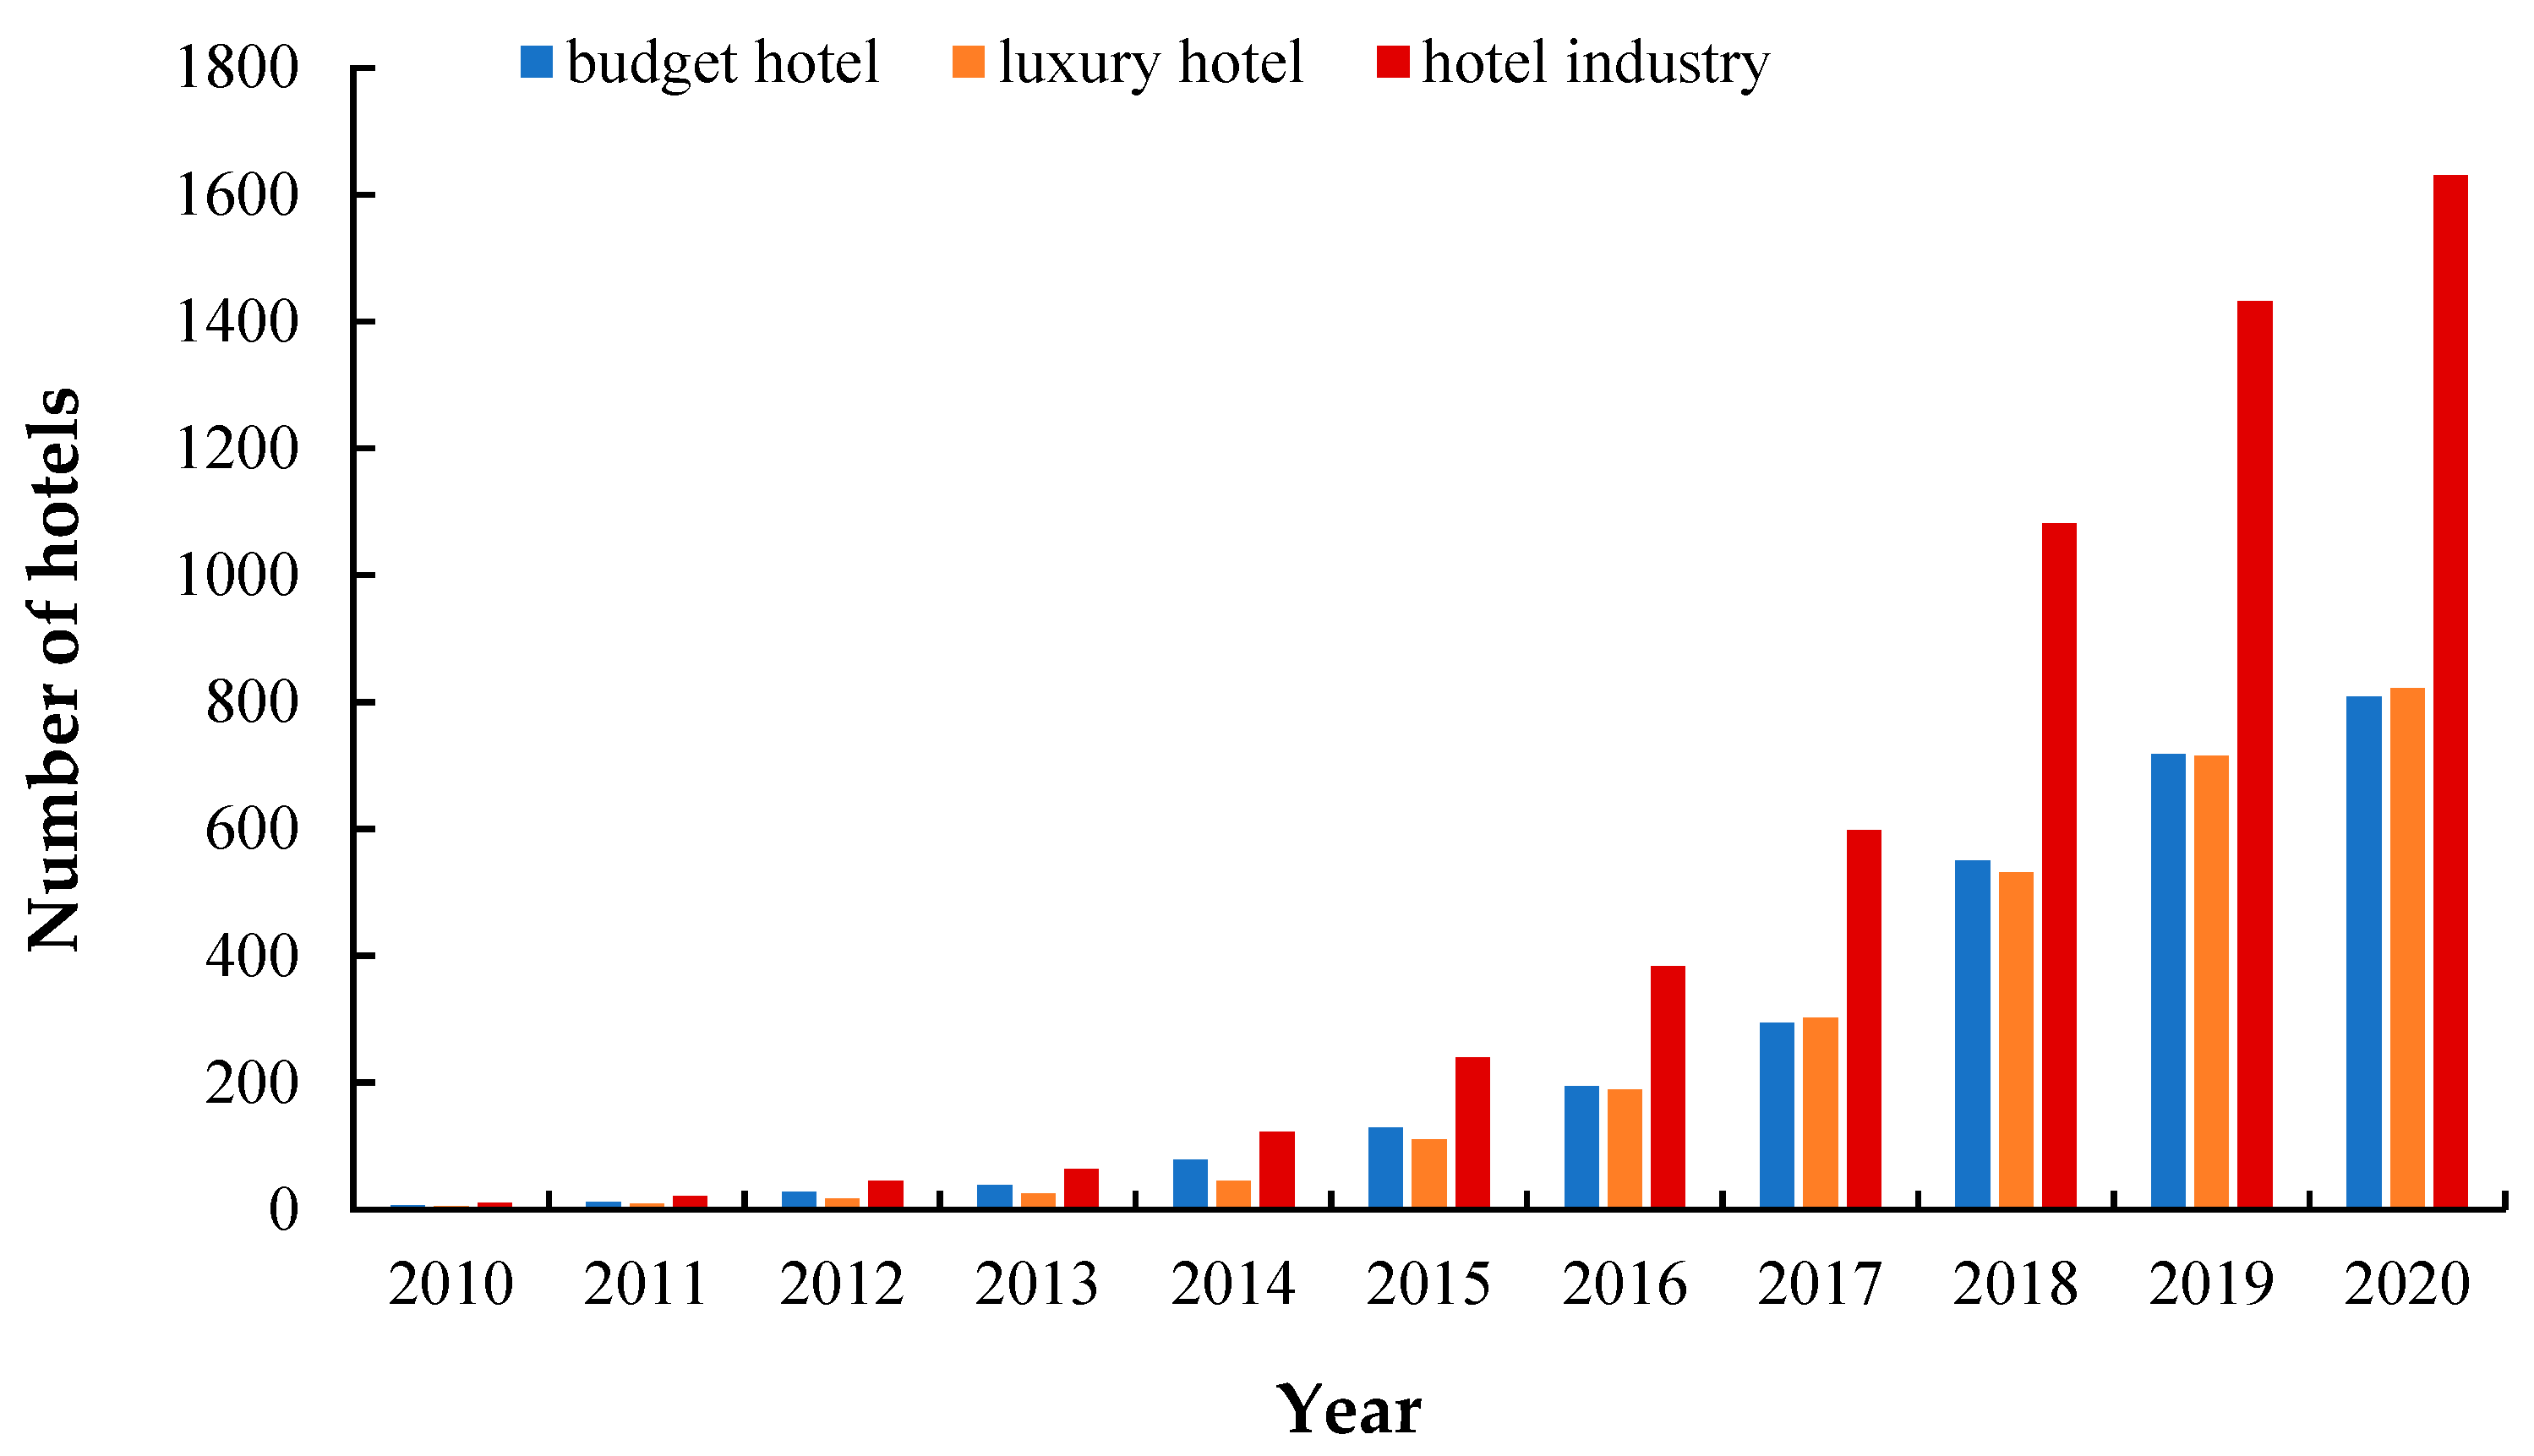
3.1.1. Hotel Industry in General

As shown in Figure 3a, the overall spatial distribution pattern of the hotel industry in Sanya has changed considerably. (1) At the end of 2010, the hotel industry in Sanya showed a point-like distribution, with relatively low density and no high-density agglomeration areas. The hotels were mainly distributed at the junction of Tianya District and Jiyang District. The reason was that, before 2010, the attractiveness of the tourism resources in Sanya was limited and most hotels chose to open in places with higher economic levels and earlier development of tourism resources. (2) From 2010 to 2015, after five years of international tourism island construction, the number of hotels in Sanya increased. The spatial pattern forms the distribution characteristics of “one main point, two subordinate points and multiple points.” The hotel gradually expanded from Dadonghai to Yalong Bay, Sanya Bay, Haitang Bay and the urban area and formed a high-density agglomeration area at the junction of Tianya District and Jiyang District and a medium-density agglomeration area in the southern part of Tianya District. (3) From 2015 to 2020, Sanya actively participated in the construction of an international tourism consumption center and hosted various large sports activities. Therefore, the number of hotels grew rapidly. The agglomeration range of hotels was expanding and the spatial distribution characteristics of “small scattered, multiaggregated” were becoming more obvious. Tianya District, Jiyang District and Haitang District all had high-density agglomeration areas and hotels were mainly distributed along the bay.

3.1.2. Budget Hotels

Budget hotels have the advantage of affordable prices and undertake the important functions of urban accommodation and reception. As shown in Figure 3b, most of the earliest budget hotels opened in Sanya were located in areas with better economic development, such as Dadonghai and Sanya Bay. (1) In 2015, budget hotels presented a spatial pattern of “one pole and multiple points.” The main gathering points were distributed in Sanya Bay, while the density of hotels in other places was more scattered. As shown in the kernel density map, the distribution difference of budget hotels is obvious. (2) From 2015 to 2020, the number of budget hotels increased, mainly located around urban traffic arteries. At this time, a number of high-density agglomeration areas appeared, which benefited from the construction of the tourism transportation network in the integrated tourism economic circle of “Big Sanya.”

3.1.3. Luxury Hotels

As shown in Figure 3c, the spatiotemporal evolution of luxury hotels showed two distinct stages and types. (1) From 2010 to 2015, the main form of luxury hotels was mass diffusion. In 2010, the distribution of luxury hotels was sparse, appearing in the south of Jiyang District and Tianya District in a scattered form, with a small number of hotels and low density. By 2015, the number of luxury hotels increased significantly, forming a medium- and high-density cluster area. At this stage, many hotels were concentrated around the Coconut Dream Corridor and Sanya International Duty-free City. (2) From 2015 to 2020, luxury hotels showed a spreading expansion trend, mainly distributed in the Coconut Dream Corridor, Luhuitou Scenic Area, Tropical Paradise Forest Park and Sanya International Duty-free City. In addition, the luxury hotels in Sanya include not only Hilton, Shanglida, Tang La Show, Westin, Intercontinental and other high-end group hotels but also some high-end homestays. The reason for the rapid growth in luxury hotels may be the strategy of “limiting general hotels, controlling high-end hotels and competing with top hotels” outlined in the “Thirteenth Five-Year Plan for Tourism Development in Hainan Province” released in 2016.

3.2. Spatial Distribution Characteristics of HQD of the Hotel Industry

3.2.1. Distribution Characteristics of HQD of the Hotel Industry Based on Tourist Scores

The grid map divides the study area into spatial statistical units in grid format, which can directly reflect the spatial distribution characteristics of the HQD of the hotel industry. We used the natural discontinuity method in ArcGIS to classify the overall HQD level of the hotel industry into five levels from high to low: A+ (4.7–5 points), A (4.5–4.7 points), B (4.3–4.5 points), C (3.8–4.3 points) and C− (3.5–3.8 points). To make the degree of HQD of different types of hotels comparable, the scores of budget hotels and luxury hotels are divided in the same way.
(1) Hotel industry in general (Figure 4a). On the whole, the distribution of the type A grids is extremely concentrated, while type B and type C grids are distributed around the type A grids, showing the spatial characteristics that the HQD level of the hotel industry in the eastern part of the city is better than that in the western part. In terms of quantity, the type A grids have the most, followed by type B grids, while type C grids have the least amount. The number of type A grids is much greater than that of type C grids. This shows that the HQD of the hotel industry is generally above the medium level. Specifically, there are differences in the HQD level of the hotel industry in the four regions of Sanya, but there is no obvious extreme change. Among them, the internal development of Haitang Bay is relatively balanced. There are many type A grids, mainly distributed along the coastal tourism development axis, while there are fewer type C grids, distributed around the water system ecological corridors in the southeast and north of the region. This demonstrates that the HQD level of the hotel industry in Haitang District is better. The HQD levels of the hotel industry in Tianya District and Jiyang District are similar. The HQD level of hotels in the key tourism development areas and the coastal tourism development axis is relatively good, but the HQD of the hotel industry in the border areas of the two regions needs to be improved. Although the number of hotels in Tianya District is small, the quality of hotel development is good and the number of type A and type B grids is relatively high.
(2) Budget hotels (Figure 4c). On the whole, the HQD level of budget hotels is relatively low and the number of type A grids is slightly greater than that of type C grids, indicating that this type of hotel fails to fully achieve customer satisfaction and ignores the HQD of hotels. From the perspective of spatial distribution characteristics, the HQD level of budget hotels is unbalanced. The type A grid presents a block-shaped aggregation distribution in space and the type B and C grids are distributed around the type A grids. This shows that, with the development of hotels of better quality, the radiation effect is not strong and cannot drive the HQD of surrounding hotels well. Specifically, the type A grids account for approximately 47% of the research units and are mainly concentrated in the central and southwestern parts of Jiyang District, the middle of the coastal tourism development axis in Tianya District, the administrative center of Yazhou District and the central part of Haitang District. The type B and C grids account for approximately 53% of the research units and are mainly distributed in the Nanshan Cultural Tourism Area, around the junction of Tianya District and Jiyang District and Haitang District. This shows that the HQD level of the budget hotels in Sanya needs to be further improved. In short, with the construction of international tourism consumption centers in the future, tourism development will bring an increasing number of tourists and diversified consumer demands. Therefore, the HQD of budget hotels will face challenges.
(3) Luxury hotels (Figure 4e). According to the grid distribution map, the overall HQD level of luxury hotels is relatively good. The number of type A grids is much higher than that of type B and type C grids and type A grids account for approximately 64% of the research units, which is significantly better than that of budget hotels. Specifically, the type A grid is distributed along the coastal tourism development axis of Sanya City, covering three major tourism economic bays: Yazhou Bay, Sanya Bay and Haitang Bay. The type B and type C grids are mainly distributed around urban and rural development belts. However, it is worth noting that the HQD level of luxury hotels in Yazhou District is low. The reason may be that there are many protected lands in this area and the construction scale and development intensity are strictly controlled in the ecological red line area. Therefore, the development land for luxury hotels is limited and ecological environment protection is restrictive for tourist activities and hotel operations. As a result, the number of luxury hotels in this area is small and the quality is low. Compared with budget hotels, the HQD level of luxury hotels is significantly higher, and it also preliminarily shows that price factors affect the HQD development level of the hotel industry.

3.2.2. Distribution Characteristics of HQD of Hotel Industry Based on a Bad Review Rate

The bad review rating is an inverse indicator. The higher the value is, the lower the HQD level of the hotel. In contrast, the lower the value is, the fewer negative reviews and the higher the HQD level of the hotel industry. Similarly, we use the natural discontinuity method in ArcGIS to classify the overall HQD level of the hotel industry into five levels from high to low: A+ (bad review rate: 0–0.63%), A (bad review rate: 0.63–2.097%), B (bad review rate: 2.097–4.348%), C (bad review rate: 4.348–11.267%) and C− (bad review rate: 11.267–20%). The bad review rates of budget hotels and luxury hotels are divided in the same way.
(1) Hotel industry in general (Figure 4b). The bad review rate grid map once again shows that the HQD level of the hotel industry in Sanya is relatively good. In terms of spatial distribution, the type A grids show the characteristics of a sheet-like agglomeration distribution, the type B grids show the distribution characteristics of clumping and scattered points and the type C grids show the distribution characteristics of a single scattered point. In addition, the bad review rate of the grids near the sea is obviously lower than that of the grids in the inner city and the bad review rate of the grids in the east and west of the city is lower than that of the grid in the middle of the city. The numbers from high to low are type A grids, type B grids, type C grids and type A grids, which account for approximately 60% of the research units. Comparing the scoring grid, it is found that the distribution area of the type A bad rating grid is basically the same as that of the type A scoring grid and the distribution area of the type C bad rating grid is basically consistent with the distribution area of the type C scoring grid, without obvious extreme changes. The analysis conclusion of the bad rating grid map proves and supplements the conclusion of the scoring grid map.
(2) Budget hotels (Figure 4d). The overall bad rating rate of budget hotels is high. There are a large number of type B and type C grids, which are mainly distributed around the traffic trunk lines. Specifically, there are significant differences in the HQD level of budget hotels in the four regions. Among them, the HQD level of the hotel industry in Yazhou District and Haitang District is better and the number of type A grids is greater. The HQD level of the hotel industry in Jiyang District and Tianya District is low, which needs to be improved in the future.
(3) Luxury hotels (Figure 4f). As shown in the grid distribution diagram of the poor rating rate of luxury hotels, there are a large number of type A and type B grids, indicating that the bad rating rate of luxury hotels is low and its HQD level is excellent. Specifically, type A grids account for approximately 75% of the study units and are mainly distributed near the sea, such as Haitang Bay, Dadonghai, Sanya Bay and Yalong Bay. Type B grids account for approximately 17% of the study units and are mainly distributed in the southeastern part of Tianya District and the eastern part of Jiyang District. The number of type C grids is very small, accounting for approximately 8% of the research units, and there is no obvious pattern in the spatial distribution.

3.3. Influencing Factors of HQD of the Hotel Industry

3.3.1. Collinearity Test of Driving Factors

To avoid the deviation of the estimated results caused by the mutual influence of various indicators, we used SPSS 26.0 to perform multicollinearity tests on the above indicators before applying the GWR model. The results are shown in Table 2. In the multicollinearity test results, the variance inflation factor of each index was less than 10 and the condition index was less than 30, indicating that the index selected in this paper did not have multicollinearity.

3.3.2. OLS Regression Results

According to the results of variable selection, we took the network score as the dependent variable and seven influencing factors as independent variables and conducted OLS regression analysis to preliminarily test the effect degree and significance level of the explanatory variables on the explained variables. The specific results are shown in Table 3.
The OLS regression results showed that (1) among the explanatory variables, only the public service level failed the significance test, while the other variables passed the significance test in a statistical sense. Among them, hardware facilities and equipment, price level, market popularity and traffic conditions had a positive impact on the HQD of the hotel industry. Hotel scale and commercial prosperity had a negative influence on the HQD of the hotel industry. The public service level had no significant impact on the HQD of the hotel industry. (2) The variance inflation factor test showed that the VIF value of each influencing factor was less than 7.5, which again showed that the model variables were set reasonably and there was no variable redundancy or multicollinearity. (3) The Jarque–Bera test results were significant, which indicated that the residuals did not obey the normal distribution and the model fitting was one-sided. To improve the fitting degree, the GWR model needed to be introduced.

3.3.3. Spatial Heterogeneity of Influencing Factors Based on GWR Model

To better utilize the GWR model, some related processing work should be noted. The applicability of the GWR model needed to be determined by comparing the output results of OLS and GWR. The default space of the OLS model was homogeneous and only considered the global characteristics of the regression coefficients, which could not reflect regional heterogeneity. Therefore, we further introduced the GWR model to analyze the influence of various influencing factors on the spatial heterogeneity of the dependent variables. Before running the GWR model, we first set the parameters, took the latitude and longitude of each hotel as the geographic coordinates, selected the fixed Gaussian function for the kernel type, used the golden section search to select the bandwidth and considered AICc as the bandwidth selection criterion. In this research, the R-squared value of the OLS model was 0.165 and the AICc value was −2956.84, while the R-square value obtained by the GWR model was 0.328 and the value of AICc was −3018.51. According to Fotheringham et al. [50], if the AICc value of the GWR model was smaller than that of the OLS model, the GWR model was appropriate. This implied that the GWR model in this study was more suitable than the OLS model for the regression fitting of explanatory variables.
The data analysis results of the GWR model are shown in Table 4. The regression coefficients of price level, market popularity and commercial prosperity varied greatly, and the maximum value was high, indicating that these three factors had a great impact on the HQD of the hotel industry. The regression coefficients of hardware facilities and equipment, price level, hotel scale, market popularity, traffic conditions and degree of commercial prosperity were positive and negative, indicating that the six factors had a positive impact on the HQD of the hotel industry in some regions and a negative impact on the HQD of the hotel industry in some regions.
The spatial heterogeneity of the factors influencing the HQD of the hotel industry is exhibited in Figure 5. As shown in Figure 5a, hardware facilities and equipment were basically positively correlated with the HQD of the hotel industry. The regression coefficient of the influencing factor showed a decreasing trend from east to west. The high-value areas of the coefficient were mainly distributed in the central part of Haitang District and the key tourism development area of Yazhou Bay, indicating that the renewal of facilities and equipment played an important role in improving the HQD level of the hotel industry in this area. The low-value areas of the coefficient were distributed in the administrative center of Yazhou District, Luhuitou Scenic Area and Yalong Bay National Tourism Resort. The reason might be that the tourism development in this area was good, the occupancy rate of hotel rooms was relatively high and it was difficult for tourists to book hotels in the peak tourism season. Therefore, facilities and equipment were not the key factor in tourists’ attention.
Figure 5b shows that the price level mainly had a positive impact on the HQD of the hotel industry. The regression coefficient of the influencing factor showed a decreasing trend from the central city of Sanya to both sides. The regions with higher regression coefficients were mainly distributed in the central and southern parts of Yazhou District, the southwest of Tianya District, the central urban area of Sanya and the urban–rural development belt of Jiyang District. These areas located in the coastal tourism development axis and urban–rural development belt would have great potential for the development of coastal tourism and rural tourism in the future. The price increase was conducive to promoting the transformation, upgrading and HQD of the hotel industry. The regions with low regression coefficients were distributed in the middle of Sanya Bay along the coast of Yalong Bay and Haitang Bay. The reason was that these areas were typical coastal tourist resorts. The prices of hotels were relatively high and generally would not increase. Therefore, the price level had little correlation with the HQD of the hotel industry.
As shown in Figure 5c, the hotel scale mainly played a negative role in its HQD. From the spatial distribution of the absolute value of the regression coefficient, the maximum value appeared in the middle of Jiyang District and Tianya District, which indicated that the hotel scale in this region had a significant constraint on the HQD of the hotel industry. The government was supposed to consider controlling the number of large-scale hotels in regional tourism planning. The minimum value appeared in the Tianya Haijiao tourist area and the coast of Haitang Bay. The reason might be that there were many boutique hotels and homestays in the Tianya Haijiao tourist area, and the scale of the hotels was relatively small. Although there were many large-scale hotels along the coast of Haitang Bay, many were luxury hotels of international brands with good software and hardware levels, so the hotel scale had little impact on its HQD. Thus, the HQD of the hotel industry was not determined by one certain factor.
Figure 5d shows that market popularity has a significant positive impact on the HQD of the hotel industry. The regression coefficient varied from −2.676 to 14.910 and the impact effect varied significantly in space. The regression coefficient of the influencing factor showed a decreasing distribution trend from the center of Jiyang District to both sides. The high-value areas of the coefficient are mainly distributed in the administrative center and north of Jiyang District. The reason was that this area was not a major leisure resort area and the hotel had limited attractiveness, so the market popularity had a more significant impact on the HQD of the hotel industry. The areas with low coefficients were especifically distributed in Haitang Bay, Yalong Bay, Dadonghai, Sanya Bay and the Nanshan Cultural Tourism Area. These places were popular for tourists. Therefore, market popularity had little impact on the HQD of the hotel industry.
Figure 5e shows that traffic conditions had both positive and negative effects on the HQD of the hotel industry. In most of the central and western parts of Sanya, such as the central Yazhou District, Sanya Bay and the southwestern Jiyang District, the traffic conditions in these areas had a positive impact on the HQD of the hotel industry. The reason was that the number of public transportation stations in these areas was small, which did not meet the demand, so the number of public transportation stations had a strong impact on the HQD of the hotel industry. In the future, the government could consider building public transportation stations in this area. In the central part of Jiyang District and Haitang District, the traffic conditions had a negative impact on the HQD of the hotel industry. However, the impact was relatively weak.
As shown in Figure 5f, the degree of commercial prosperity was mainly negatively correlated with the HQD of the hotel industry, while it was positively correlated in very few areas. The negative impact areas were distributed in the administrative center of Yazhou District, the middle of Sanya Bay, Dadonghai, Yalong Bay and Haitang Bay. These areas were typical tourist resorts. Excessive commercial activities not only damage the tourist accommodation environment but also cause traffic congestion. Therefore, the government ought to manage the commercial environment here and avoid the negative impacts of excessive commercial activities. The positively affected areas were distributed in the eastern part of Tianya District and the northeastern part of Jiyang District. There were few commercial activities in these areas. Appropriately increasing commercial points would promote the HQD of the hotel industry.

4. Discussion

With the background of the gradual decline of hotel service quality, serious hotel homogenization and the impact of COVID-19, it is of great significance to discuss the topic of the HQD of the hotel industry [7,8,51]. Promoting its HQD level is the inevitable choice facing the transformation of economic structure and industrial upgrading at this stage. Furthermore, it is the key to solving the practical difficulties faced by the hotel industry and realizing sustainable development [10].
However, the current academic community mainly studies the HQD of the tourism industry [52,53], while there are few studies on the HQD of the hotel industry. Only a few studies theoretically explain the background of the HQD of the hotel industry and the strategies to promote the HQD of the hotel industry. Yang pointed out that providing customer-satisfied products and services is an important way to realize the high-quality development of the hotel industry [54]. Zhang et al. argued that updating hotel facilities and equipment in a timely manner and providing warm services have a positive effect on improving customer satisfaction and promoting the high-quality development of the hotel industry [55]. These strategies have a certain guiding role in promoting the HQD of the hotel industry. Nevertheless, due to the reality of the development of the hotel industry in different regions, their specific HQD strategies should also be different.
This article selects Sanya, a tourism-dependent city, as a case study to explore the spatial distribution characteristics and influencing factors of the HQD of its hotel industry, which provides a reference for the same type of cities to study this problem. The theoretical and practical significance of this study are as follows.
First, this article uses the spatial analysis method to explore the spatial distribution characteristics and influencing factors of the HQD of the hotel industry in Sanya, which can enrich the relevant research on the spatial distribution theory of the hotel industry. To the best of our knowledge, most of the previous studies were to explore the spatial layout, location law and influencing factors of the hotel industry [56,57,58,59]. However, few studies have explored the spatial distribution characteristics and laws of the HQD of the hotel industry. To fill this gap, this study applied kernel density analysis, grid analysis and a GWR model to analyze the distribution characteristics and influencing factors of the HQD of the hotel industry. As noted above, the HQD level of the hotel industry in Sanya is unbalanced. There are differences in different regions and different types of hotels.
In addition, this article takes Sanya, a tourism-dependent city, as a case study to analyze the distribution characteristics and influencing factors of the HQD of the hotel industry, which can supplement relevant empirical research. Previous studies focused more on the hotel industry in economically developed large cities, such as London, Jerusalem and Wuhan, but lacked research on the hotel industry in small- and medium-sized cities [14,49,60]. Sanya is an internationally renowned small- and medium-sized tourist city with rich types and a large number of hotels. Taking Sanya as a case study not only enriches the relevant research cases but also provides a theoretical reference for the HQD of the hotel industry in the same type of cities.
Third, this article establishes a GWR Mode to explore the influencing factors and spatial heterogeneity of the HQD of the hotel industry in Sanya. The results show that hardware facilities and equipment, price level, market popularity and traffic conditions have a positive impact on the HQD of the hotel industry and commercial prosperity has a negative influence on the HQD of the hotel industry, which is consistent with the research conclusions of Albayrak, Furtado, Ye and Mao [41,44,46,47], as well as the expected assumptions. The impact of public service level on the HQD of the hotel industry is not significant, which is inconsistent with the views of Tong Yun [49] and also inconsistent with the expected assumptions of this article. The reason might be that there were many indicators explaining the level of public service. Due to the availability of data, however, this research used the number of universities and A-level scenic spots to represent the level of public service, which might not be comprehensive enough in quantity. This would have an impact on the analysis results to a certain degree. On the one hand, the research conclusions of this paper can provide theoretical references for hotel managers in formulating management strategies. On the other hand, it can also provide practical enlightenment for government departments in carrying out tourism planning.
Based on the research results of this article, we believe that, if we want to further improve the HQD level of the Sanya hotel industry and narrow the gap in regional development, we need to adhere to the principles of adaptation to local conditions and classified governance, as well as formulate detailed and effective strategies. Specifically, for regions with a low level of HQD of the hotel industry, such as the western and central regions of Sanya, on the one hand, hotel managers need to timely update hotel facilities and equipment, strengthen market promotion and reasonably adjust house prices. On the other hand, the government should give more policy support to infrastructure construction and the business environment. For areas with a good level of HQD of the hotel industry, such as the eastern and southern coastal areas of Sanya City, hotels in these areas can use their own advantages to drive the development of hotels in surrounding areas. For example, establish a platform for tourism cooperation between regions and encourage hotel companies to carry out cooperation in experience exchange and product innovation to form a regional hotel industry development pattern of healthy competition, coordinated development and win–win cooperation.
However, some limitations in this study should be noted. Firstly, COVID-19 has a certain impact on the data collection of this study. Since the COVID-19 pandemic, the number of tourists in Sanya has decreased rapidly, hotel prices have also declined and even some hotels have closed down. This may have a certain impact on the online review data in 2020. However, this impact on long-term accumulated review results is limited. In order to make the research conclusion more scientific, we will conduct supplementary analysis by collecting data published by the government and industry in the future. Then, customer satisfaction is only a research perspective of the HQD of the hotel industry. In future research, we will explore the spatial distribution pattern of the HQD of the hotel industry from other perspectives to supplement relevant theoretical research on the HQD of the hotel industry. Moreover, this study only summarizes the spatial distribution characteristics and influencing factors of the HQD of the hotel industry in Sanya, a tourism-dependent city. In future research, we will explore the spatial characteristics and influencing factors of the HQD of the hotel industry in other types of cities and conduct a comparative analysis. Finally, due to the limited POI data and web crawling data, only some internal and external factors affecting the HQD of the hotel industry are collected. Thus, there may be other factors affecting the HQD of the hotel industry that have not been analyzed. In future research, we will combine management, anthropology and other interdisciplinary research methods to improve the research on the factors affecting the HQD of the hotel industry.

5. Conclusions

In this study, combining kernel density analysis, grid analysis, the OLS model and the GWR model, we explored the spatial distribution characteristics and influencing factors of the HQD of the hotel industry in Sanya. The results show that, on the whole, the HQD of the hotel industry in Sanya is at a medium or above level, but the imbalance of regional development is obvious. The HQD level of the hotel industry in the southern coastal area is better than that in the interior of the city, and the HQD level of the hotel industry in the eastern region is better than that in the west. In addition, we found that the HQD of the luxury hotels is significantly better than that of the budget hotels. Finally, the regression analysis results show that the HQD of the hotel industry in Sanya is affected by multiple factors. Among them, hardware facilities and equipment, price level, market popularity and traffic conditions have a positive impact on the HQD of the hotel industry, while hotel scale and business prosperity have a negative impact on the HQD of the hotel industry. This research provides theoretical support and a scientific basis for the HQD of the hotel industry and tourism industry planning.

Author Contributions

Y.M.: conceptualization, methodology, article structure design, supervision, project administration, resources and funding acquisition; H.L.: software, data curation, data analysis, validation, visualization, writing—original draft; Y.T.: supervision, conceived and designed the experiments, writing—review and editing. All authors have read and agreed to the published version of the manuscript.

Funding

This research was supported by the National Social Science Foundation of China (19BJL036; 21BJY194); Natural Science Foundation of Hainan Province (721QN219); Hainan graduate innovation research project (Qhys2021-1).

Data Availability Statement

Data connected to this research are available from the corresponding author under request.

Acknowledgments

We appreciate the technical assistance provided by Shenzhen Vision Information Technology Co., Ltd. (http://www.skieer.com (accessed on 20 December 2020)), as well as thank the National Earth System Science Data Center for providing geographic information data (http://www.geodata.cn (accessed on 20 December 2020)).

Conflicts of Interest

The authors declare no conflict of interest.

References

  1. Yan, B.R.; Dong, Q.L.; Li, Q.; Amin, F.U.; Wu, J.-N. A Study on the Coupling and Coordination between Logistics Industry and Economy in the Background of High-Quality Development. Sustainability 2021, 13, 10360. [Google Scholar] [CrossRef]
  2. Yadegaridehkordi, E.; Nilashi, M.; Nasir, M.H.N.B.M.; Ibrahim, O. Predicting determinants of hotel success and development using Structural Equation Modelling (SEM)-ANFIS method. Tour. Manag. 2018, 66, 364–386. [Google Scholar] [CrossRef]
  3. Zhao, Y.; Xu, X.; Wang, M. Predicting overall customer satisfaction: Big data evidence from hotel online textual reviews. J. Hosp. Tour. Manag. 2019, 76, 111–121. [Google Scholar] [CrossRef]
  4. Pizam, A. What is the hospitality industry and how does it differ from the tourism and travel industries? J. Hosp. Tour. Manag. 2009, 28, 183–184. [Google Scholar] [CrossRef]
  5. Tsang, N.K.F.; Lee, L.Y.-S.; Qu, H. Service quality research on China’s hospitality and tourism industry. Int. J. Contemp. Hosp. Manag. 2015, 27, 473–497. [Google Scholar] [CrossRef]
  6. Benítez, J.M.; Martín, J.C.; Román, C. Using fuzzy number for measuring quality of service in the hotel industry. Tour. Manag. 2007, 28, 544–555. [Google Scholar] [CrossRef]
  7. Gao, F. Internet Thinking Boosts Hotel Management Upgrade Path Analysis. J. Phys. Conf. Ser. 2020, 1533, 418–421. [Google Scholar] [CrossRef]
  8. Mohsin, A.; Rodrigues, H.; Brochado, A. Shine bright like a star: Hotel performance and guests’ expectations based on star ratings. J. Hosp. Tour. Manag. 2019, 83, 103–114. [Google Scholar] [CrossRef]
  9. Ren, L.; Qiu, H.; Wang, P.; Lin, P.M.C. Exploring customer experience with budget hotels: Dimensionality and satisfaction. J. Hosp. Tour. Manag. 2016, 52, 13–23. [Google Scholar] [CrossRef]
  10. Tarí, J.J.; Claver-Cortés, E.; Pereira-Moliner, J.; Molina-Azorín, J.F. Levels of quality and environmental management in the hotel industry: Their joint influence on firm performance. J. Hosp. Tour. Manag. 2010, 29, 500–510. [Google Scholar] [CrossRef]
  11. Chen, T.H. Performance measurement of an enterprise and business units with an application to a Taiwanese hotel chain. J. Hosp. Tour. Manag. 2009, 28, 415–422. [Google Scholar] [CrossRef]
  12. Williams, C.; Buswell, J. Service Quality in Leisure and Tourism; CABI Publishing Series: Wallingford, CT, USA, 2004; pp. 86–104. [Google Scholar]
  13. Lyons, H. Hotel and food service marketing: A managerial approach: Francis Buttle, Holt Hotel & Catering, 1986, £9.95. J. Hosp. Tour. Manag. 1986, 5, 217–218. [Google Scholar]
  14. Clarke, A.; Chen, W. International Hospitality Management; Routedge: London, UK, 2007; pp. 6–19. [Google Scholar]
  15. Min, H.; Min, H.; Chung, K. Dynamic benchmarking of hotel service quality. J. Serv. Mark. 2002, 16, 302–321. [Google Scholar] [CrossRef]
  16. Parasuraman, A.; Zeithaml, V.A.; Berry, L.L. SERVQUAL: A Multiple-Item Scale for Measuring Consumer Perceptions of Service Quality. J. Retail. 1988, 64, 12–40. [Google Scholar]
  17. Getty, J.M.; Getty, R.L. Lodging quality index (LQI): Assessing customers’ perceptions of quality delivery. Int. J. Contemp. Hosp. Manag. 2003, 15, 94–104. [Google Scholar] [CrossRef]
  18. Wilkins, H.; Merrilees, B.; Herington, C. Towards an understanding of total service quality in hotels. Int. J. Hosp. Manag. 2007, 26, 840–853. [Google Scholar] [CrossRef]
  19. Dang, Z.C.; Zhou, Z.L. On The Measurement and Improvement of Hotel Service Quality. Tour. Trib. 2002, 17, 22–25. [Google Scholar]
  20. Jou, R.C.; Day, Y.J. Application of Revised Importance–Performance Analysis to Investigate Critical Service Quality of Hotel Online Booking. Sustainability 2021, 13, 2043. [Google Scholar] [CrossRef]
  21. Boon, E.; Bonera, M.; Bigi, A. Measuring Hotel Service Quality from Online Consumer Reviews: A Proposed Method. In Information and Communication Technologies in Tourism 2014; Xiang, Z., Tussyadiah, I., Eds.; Springer International Publishing: Cham, Switzerland, 2013; pp. 367–379. [Google Scholar]
  22. Wei, X.; Luo, X.; Li, Q.; Zhang, J.; Xu, Z. Online Comment-Based Hotel Quality Automatic Assessment Using Improved Fuzzy Comprehensive Evaluation and Fuzzy Cognitive Map. IEEE Trans. Fuzzy Syst. 2015, 23, 72–84. [Google Scholar] [CrossRef]
  23. Moro, S.; Lopes, R.J.; Esmerado, J.; Botelho, M. Service quality in airport hotel chains through the lens of online reviewers. J. Retail. Consum. Serv. 2020, 56, 102193. [Google Scholar] [CrossRef]
  24. Lahap, J.; O’Mahony, B.; Dalrymple, J. The Importance of Communication in Improving Service Delivery and Service Quality in the Malaysian Hotel Industry. Proc. Soc. Behav. Sci. 2016, 224, 213–220. [Google Scholar] [CrossRef] [Green Version]
  25. Torres, E.N.; Adler, H.; Behnke, C.; Miao, L.; Lehto, X. The Use of Consumer-Generated Feedback in the Hotel Industry: Current Practices and Their Effects on Quality. Int. J. Hosp. Tour. Admin. Manag. 2015, 16, 224–250. [Google Scholar] [CrossRef]
  26. Jaiswal, D.; Dhar, R.L. Impact of perceived organizational support, psychological empowerment and leader member exchange on commitment and its subsequent impact on service quality. Int. J. Prod. Perform. Manag. 2016, 65, 58–79. [Google Scholar] [CrossRef]
  27. Gil, S.M.; Hudson, S.; Quintana, T.A. The Influence of Service Recovery and Loyalty on Perceived Service Quality: A Study of Hotel Customers in Spain. J. Hosp. Leis. Mark. 2006, 14, 47–68. [Google Scholar] [CrossRef]
  28. Oliver, R.L. A cognitive model of the antecedents and consequences of satisfaction decisions. J. Mark. Res. 1980, 17, 460–469. [Google Scholar] [CrossRef]
  29. Deng, W.J.; Yeh, M.L.; Sung, M.L. A customer satisfaction index model for international tourist accommodations: Integrating consumption emotions into the American Customer Satisfaction Index. Int. J. Hosp. Manag. 2013, 35, 133–140. [Google Scholar] [CrossRef]
  30. Mathe, K.; Scott-Halsell, S.; Roseman, M. Measuring Service Quality and Customer Satisfaction of the Hotels in Malaysia: Malaysian, Asian and Non-Asian Hotel Guests. J. Hosp. Tour. Res. 2016, 40, 198–209. [Google Scholar] [CrossRef]
  31. Radojevic, T.; Stanisic, N.; Stanic, N.; Davidson, R. The effects of traveling for business on customer satisfaction with hotel services. Tour. Manag. 2018, 67, 326–341. [Google Scholar] [CrossRef]
  32. Kandampully, J.A.; Suhartanto, D. Customer loyalty in the hotel industry: The role of customer satisfaction and image. Int. J. Contemp. Hosp. Manag. 2000, 12, 346–351. [Google Scholar] [CrossRef]
  33. Nunkoo, R.; Teeroovengadum, V.; Ringle, C.M.; Sunnassee, V. Service quality and customer satisfaction: The moderating effects of hotel star rating. Int. J. Hosp. Manag. 2020, 91, 102414. [Google Scholar] [CrossRef]
  34. Lyu, S.; Zheng, Z.; Li, M.; Zhang, J.; Guo, B. Service Quality of Hotel Front Desk: An Exploratory Study. Tour. Trib. 2014, 29, 69–76. [Google Scholar]
  35. Briggs, S.; Sutherland, J.; Drummond, S. Are hotels serving quality? An exploratory study of service quality in the Scottish hotel sector. Tour. Manag. 2007, 28, 1006–1019. [Google Scholar] [CrossRef]
  36. Al-Gasawneh, J.A.; AlZubi, K.N.; Anuar, M.M.; Padlee, S.F.; ul-Haque, A.; Saputra, J. Marketing Performance Sustainability in the Jordanian Hospitality Industry: The Roles of Customer Relationship Management and Service Quality. Sustainability 2022, 14, 803. [Google Scholar] [CrossRef]
  37. Lin, M.; Ling, Q.; Liu, Y.; Hu, R. The effects of service climate and internal service quality on frontline hotel employees’ service-oriented behaviors. Int. J. Hosp. Manag. 2021, 97, 102995. [Google Scholar] [CrossRef]
  38. Gao, S.; Li, C.; Rong, Y.; Yan, Q.; Liu, W.; Ma, Z. The Places-People Exercise: Understanding Spatial Patterns and the Formation Mechanism for Urban Commercial Fitness Space in Changchun City, China. Sustainability 2022, 14, 1358. [Google Scholar] [CrossRef]
  39. Liu, J.; Yue, M.; Liu, Y.; Wen, D.; Tong, Y. The Impact of Tourism on Ecosystem Services Value: A Spatio-Temporal Analysis Based on BRT and GWR Modeling. Sustainability 2022, 14, 2587. [Google Scholar] [CrossRef]
  40. Peng, Z.; Cao, S.; Du, M.; Yang, M.; Lu, L.; Cai, Y.; Mo, Y.; Zhao, W. Spatiotemporal Patterns and Dominant Factors of Urban Particulate Matter Islands: New Evidence from 240 Cities in China. Sustainability 2022, 14, 6117. [Google Scholar] [CrossRef]
  41. Albayrak, T.; Caber, M. Prioritisation of the hotel attributes according to their influence on satisfaction: A comparison of two techniques. Tour. Manag. 2015, 46, 43–50. [Google Scholar] [CrossRef]
  42. Zhang, Z.; Ye, Q.; Law, R. Determinants of hotel room price. Int. J. Contemp. Hosp. Manag. 2011, 23, 972–981. [Google Scholar] [CrossRef]
  43. Perrigot, R.; Cliquet, G.; Piot-Lepetit, I. Plural form chain and efficiency: Insights from the French hotel chains and the DEA methodology. Eur. Manag. J. 2009, 27, 268–280. [Google Scholar] [CrossRef]
  44. Ye, Q.; Law, R.; Gu, B. The impact of online user reviews on hotel room sales. Int. J. Hosp. Manag. 2009, 28, 180–182. [Google Scholar] [CrossRef]
  45. Fang, L.; Li, H.; Li, M. Does hotel location tell a true story? Evidence from geographically weighted regression analysis of hotels in Hong Kong. Tour. Manag. 2019, 72, 78–91. [Google Scholar] [CrossRef]
  46. Furtado, A.; Ramos, R.F.; Maia, B.; Costa, J.M. Predictors of Hotel Clients’ Satisfaction in the Cape Verde Islands. Sustainability 2022, 14, 2677. [Google Scholar] [CrossRef]
  47. Mao, Z.; Yang, Y.; Wang, M. Sleepless nights in hotels? Understanding factors that influence hotel sleep quality. Int. J. Hosp. Manag. 2018, 74, 189–201. [Google Scholar] [CrossRef]
  48. Brunner-Sperdin, A.; Peters, M. What influences guests’ emotions? The case of high-quality hotels. Int. J. Tour. Res. 2009, 11, 171–183. [Google Scholar] [CrossRef]
  49. Tong, Y.; Ma, Y. Evolution and Prediction of the Spatial Pattern of Hotel Industry Supported by Big Data: A Case Study of Wuhan. Tour. Trib. 2018, 33, 76–87. [Google Scholar]
  50. Fotheringham, A.S.; Kelly, M.H.; Charlton, M. The demographic impacts of the Irish famine: Towards a greater geographical understanding. Trans. Inst. Br. Geogr. 2013, 38, 221–237. [Google Scholar] [CrossRef]
  51. Aha, D.; Mbbd, E.; Nsc, D.; Jtc, D.; Fjvbd, E. Does hotel management matter to overcoming the COVID-19 crisis? The Spanish case. Tour. Manag. 2022, 88, 104395. [Google Scholar]
  52. Vinerean, S.; Opreana, A.; Tileagă, C.; Popșa, R.E. The Impact of COVID-19 Pandemic on Residents’ Support for Sustainable Tourism Development. Sustainability 2021, 13, 12541. [Google Scholar] [CrossRef]
  53. Ryu, C.; Kwon, Y. Elements that affect foreign tourists’ satisfaction: A case study in Seoul, Korea. Urban Des. Int. 2021, 26, 197–207. [Google Scholar] [CrossRef]
  54. Yang, H. High-quality development of the accommodation industry under the dual-cycle pattern. Tour. Trib. 2021, 36, 9–11. [Google Scholar]
  55. Zhang, X.; Kim, H.-S. Customer Experience and Satisfaction of Disneyland Hotel through Big Data Analysis of Online Customer Reviews. Sustainability 2021, 13, 12699. [Google Scholar] [CrossRef]
  56. Chou, T.Y.; Hsu, C.L.; Chen, M.C. A fuzzy multi-criteria decision model for international tourist hotels location selection. Int. J. Hosp. Manag. 2008, 27, 293–301. [Google Scholar] [CrossRef]
  57. Shoval, N.; McKercher, B.; Ng, E.; Birenboim, A. Hotel location and tourist activity in cities. Ann. Tour. Res. 2011, 38, 1594–1612. [Google Scholar] [CrossRef]
  58. Yang, Y.; Luo, H.; Law, R. Theoretical, empirical, and operational models in hotel location research. Int. J. Hosp. Manag. 2014, 36, 209–220. [Google Scholar] [CrossRef]
  59. Budović, A.; Ratkaj, I.; Antić, M. Evolution of urban hotel geography-a case study of Belgrade. Curr. Issues. Tour. 2020, 23, 707–722. [Google Scholar] [CrossRef]
  60. Shoval, N. The Geography of Hotels in Cities: An Empirical Validation of a Forgotten Model. Tour Geogr. 2006, 8, 56–75. [Google Scholar] [CrossRef]
Figure 1. Number of hotels in Sanya since the construction of international tourism islands.
Sustainability 14 06476 g001
Figure 2. The spatial diagram of basic elements in the study area.
Sustainability 14 06476 g002
Figure 3. KDE of the hotel industry: (a) hotel industry overall expansion kernel density map; (b) budget hotel expansion kernel density map; (c) luxury hotel expansion kernel density map.
Sustainability 14 06476 g003
Figure 4. Spatial differentiation characteristics of HQD of the hotel industry: (a) hotel industry overall scoring fishnet map; (b) hotel industry overall bad review rate fishnet map; (c) budget hotel scoring fishnet map; (d) budget hotel bad review rate fishnet map; (e) luxury hotel scoring fishnet map; and (f) luxury hotel bad review rate fishnet map.
Sustainability 14 06476 g004
Figure 5. Spatial distribution of regression coefficients of various correlated variables in the geographically weighted regression (GWR) model: (a) regression coefficient for hardware facilities and equipment; (b) regression coefficient for price level; (c) regression coefficient for hotel scale; (d) regression coefficient for market popularity; (e) regression coefficient for traffic condition; and (f) regression coefficient for commercial prosperity.
Sustainability 14 06476 g005
Table 1. Driving factors of HQD in the hotel industry.
Variable NameProxy VariableData SourcesSymbolExpected DirectionLiterature Source
Hardware facilities and equipmentYear of opening or decorationhttps://www.qunar.com/ (accessed on 20 December 2020)X1Positive influenceAlbayrak and Caber [41]
Price levelAverage room ratehttps://www.qunar.com/ (accessed on 20 December 2020)X2Positive influenceZhang and Qiang [42]
Hotel scaleTotal number of roomshttps://www.qunar.com/ (accessed on 20 December 2020)X3UncertaintyPerrigot and Cliquet [43]
Market popularityTotal number of online reviewshttps://www.qunar.com/ (accessed on 20 December 2020)X4Positive influenceYe and Law [44]
Traffic conditionNumber of public transport stops within 1000 m of the hotelPOI dataX5Positive influenceFurtado and Ramos [46]
Commercial prosperityNumber of restaurants within 500 m of the hotelPOI dataX6Negative influenceMao and Yang [47]
Number of entertainment venues within 500 m of the hotelPOI data
Public service levelNumber of universities and research institutes within 1000 m of the hotelPOI dataX7Positive influenceTong and Ma [48]
Number of A-level scenic spots within 5000 m of the hotelhttp://lwt.hainan.gov.cn/ (accessed on 25 December 2020)
Table 2. Collinearity test of driving factors.
Explanatory VariablesVariance Inflation FactorToleranceCondition Index
X11.0560.9471.000
X21.1060.9041.787
X32.2400.4462.493
X42.2490.4453.392
X52.8260.3544.841
X62.8440.3526.989
X72.2950.4367.675
Table 3. OLS model test results.
VariablesCoefficientStandard DeviationT Valuep ValueVIF
Intercept0.59050.024823.83340.0000 ***——
X10.30460.026511.49400.0000 ***1.0563
X20.18820.03774.99080.0000 ***1.1085
X3−0.27950.0429−6.51490.0000 ***2.2404
X40.33500.04447.54830.0000 ***2.2496
X50.04560.01562.87000.0042 **2.7719
X6−0.08930.0166−5.38400.0000 ***2.8233
X7−0.02560.0158−1.62140.10512.1546
OLS diagnosisJoint F valueJarque–Bera testK(BP)testJoint chi-square
0.0000 ***11,090.794737.8947245.5369, 0.0000 ***
Note: *** and ** indicated significance at the levels of 0.01 and 0.05, respectively.
Table 4. Statistics of the geographical weighted regression model’s results.
VariablesMinimumLower QuartileMedianUpper QuartileMaximumMean
Intercept−0.53720.55040.60450.69281.89790.5936
X1−1.03870.20440.31180.34651.57300.3110
X2−1.35890.14690.39840.883413.66980.5173
X3−3.0069−0.3850−0.3378−0.27741.2287−0.3368
X4−2.67700.36340.41220.575814.91060.6347
X5−2.8642−0.1188−0.04430.08252.7333−0.0127
X6−3.4978−0.3346−0.1194−0.02955.7928−0.1854
Publisher’s Note: MDPI stays neutral with regard to jurisdictional claims in published maps and institutional affiliations.

