
A Smart Post-Processing System for Forecasting the Climate Precipitation Based on Machine Learning Computations

 , and
, and
Abstract
:1. Introduction
1.1. Relevant and Recent Literatures
1.2. Contributions
- The case study’s prediction of rainfall in arid and semi-arid areas for controlling flood and famine.
- Implementation of climate change adaptation action based on forecasting values in the short, middle, and long term.
- Allocation of water resources in limited regions to different applications, specifically, irrigation usages.
- Improving cities’ resiliency based on passive defense programs against flash-flood and famine.
2. Material and Methods
2.1. Material
2.1.1. CFSV2 Model
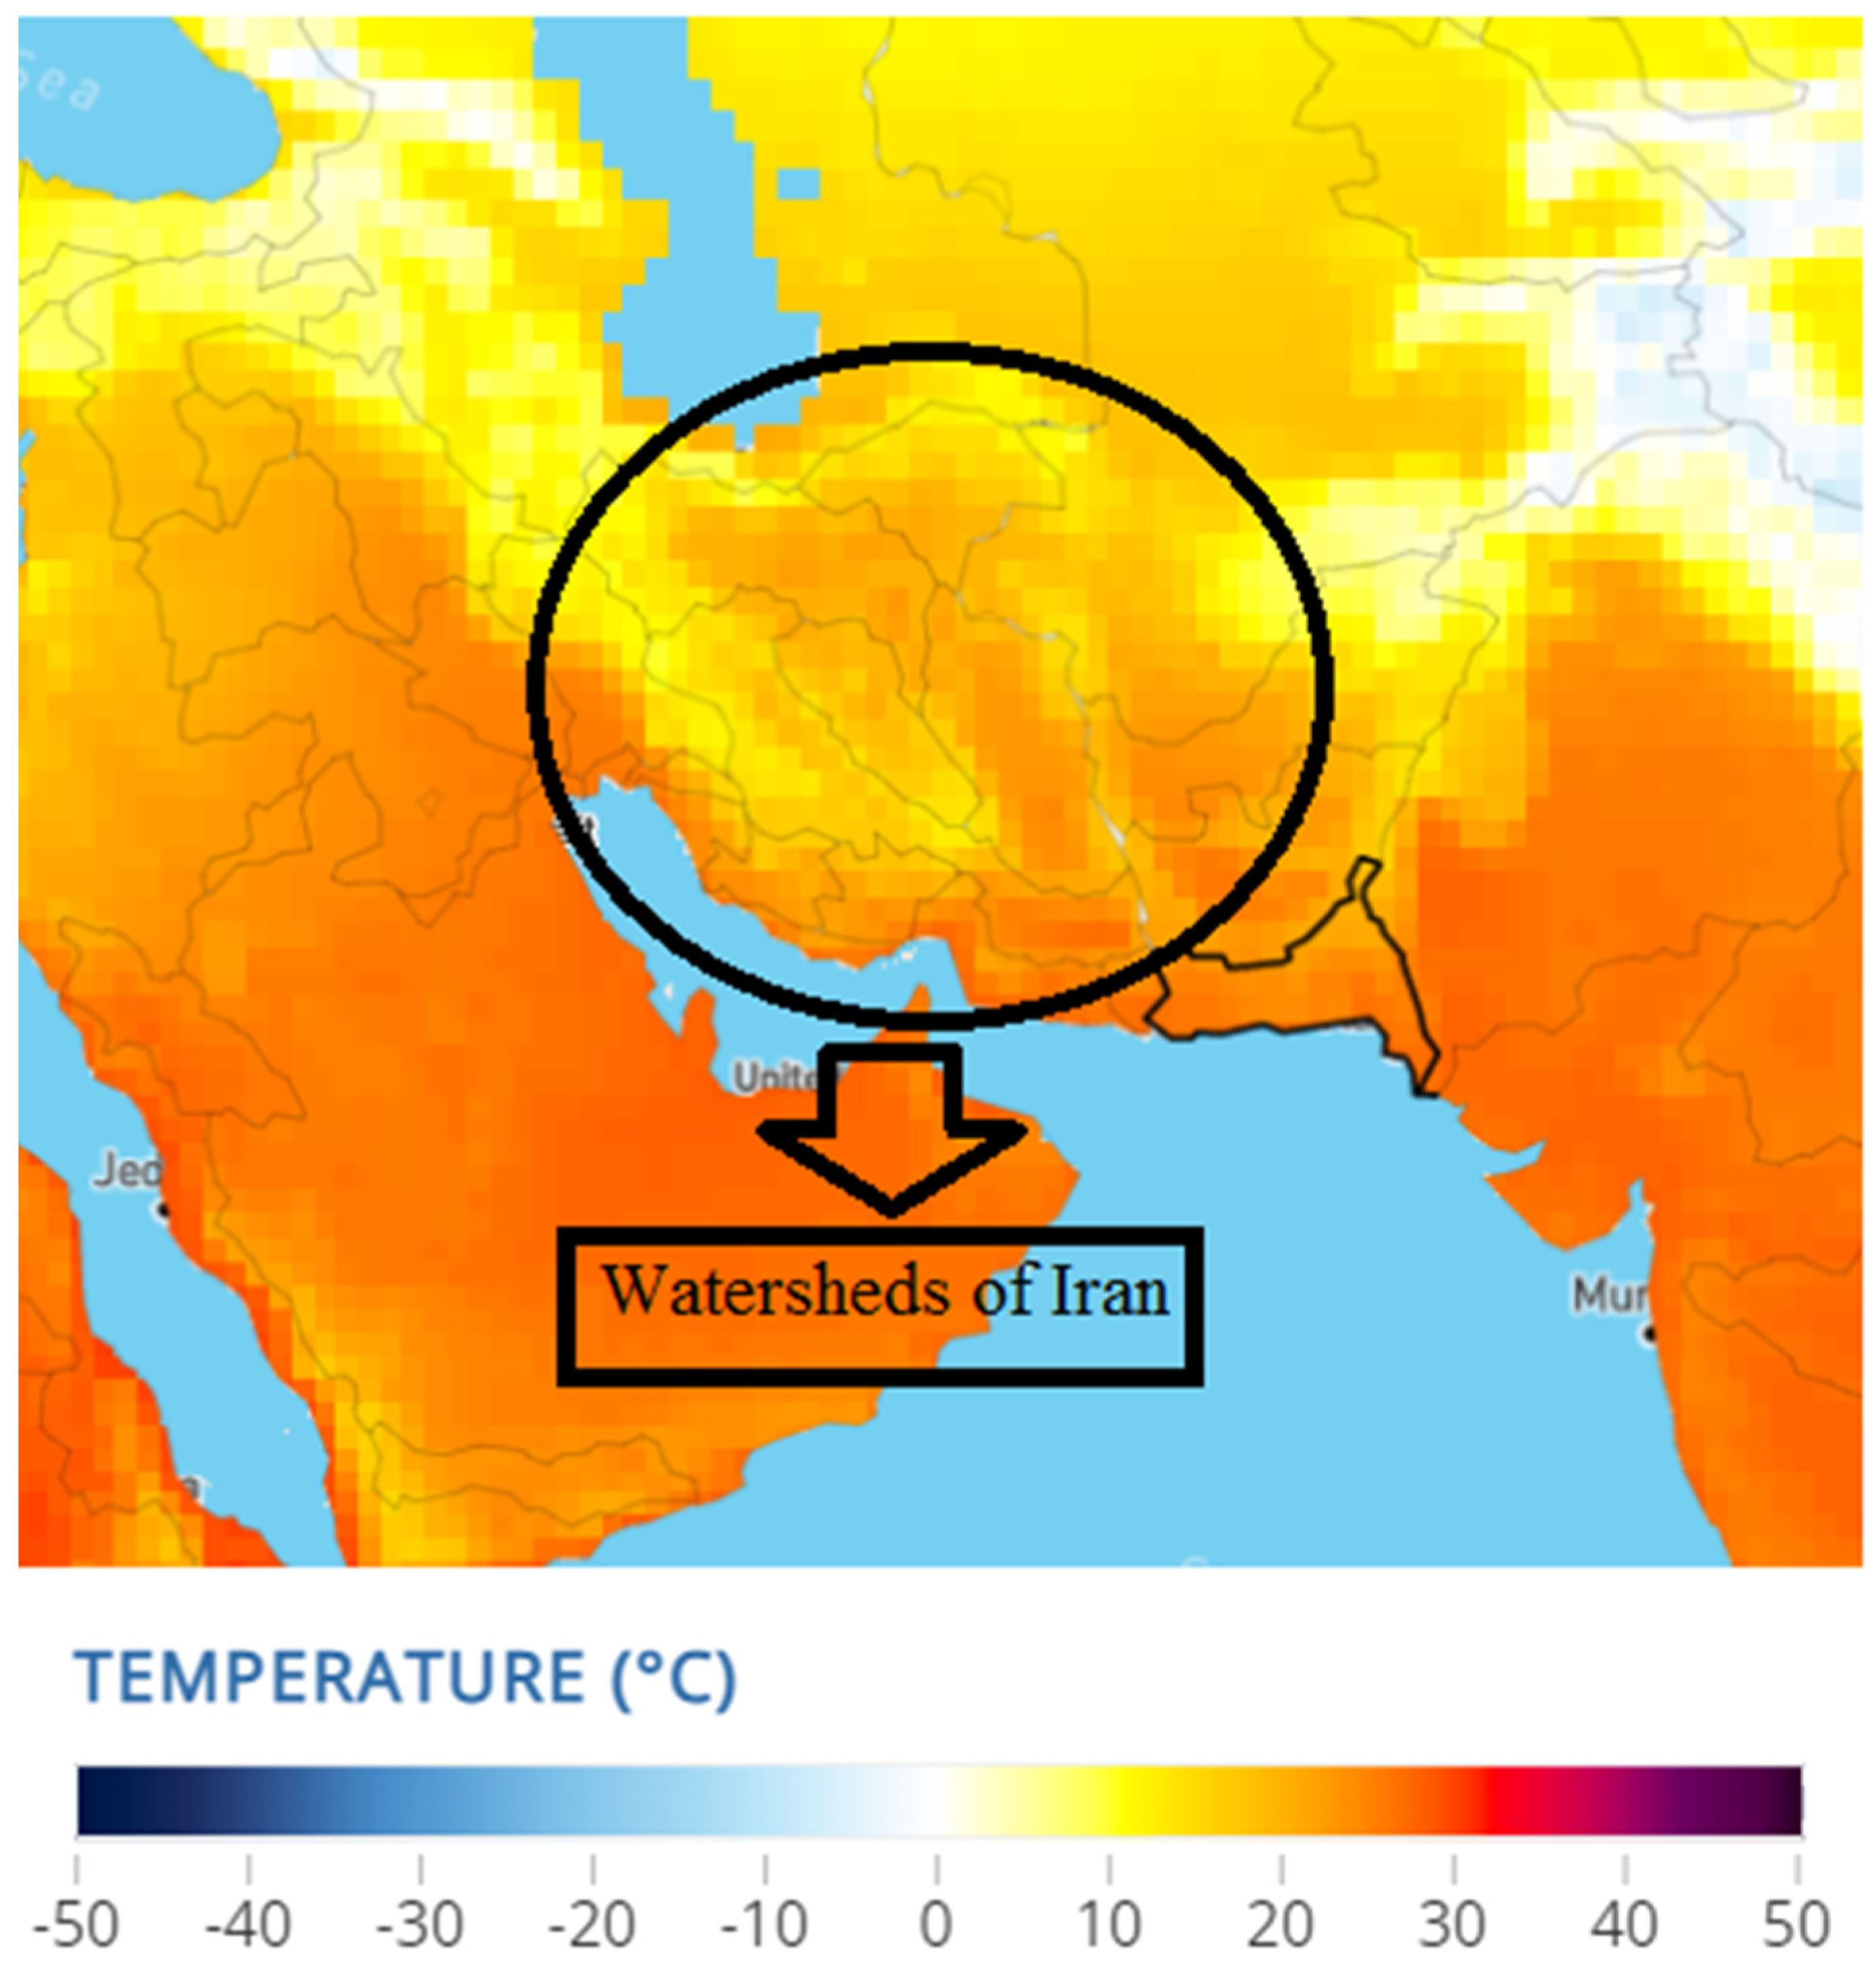
2.1.2. Case Study
2.2. Methods
2.2.1. Problem
2.2.2. Machine Learning Post-Processing
2.2.3. Machine Learning Pre-Processing Methods
Imbalanced Data
Missed Values
Feature Selection
2.2.4. Regression Methods
General Regression Neural Network (GRNN)
Extreme Learning Machine (ELM)
Neural Network (NN)
Binary Regression Tree (BRT)
Random Forest (RF)
Lasso Boosting (LB)
3. Results and Discussion
3.1. Metrics
3.2. Results
3.2.1. RMSE and Correlation Metric
3.2.2. ROC Curve
3.2.3. Q-Q Plot
3.3. Sensitivity Analysis
3.3.1. ROC Plot
3.3.2. Q-Q Plot
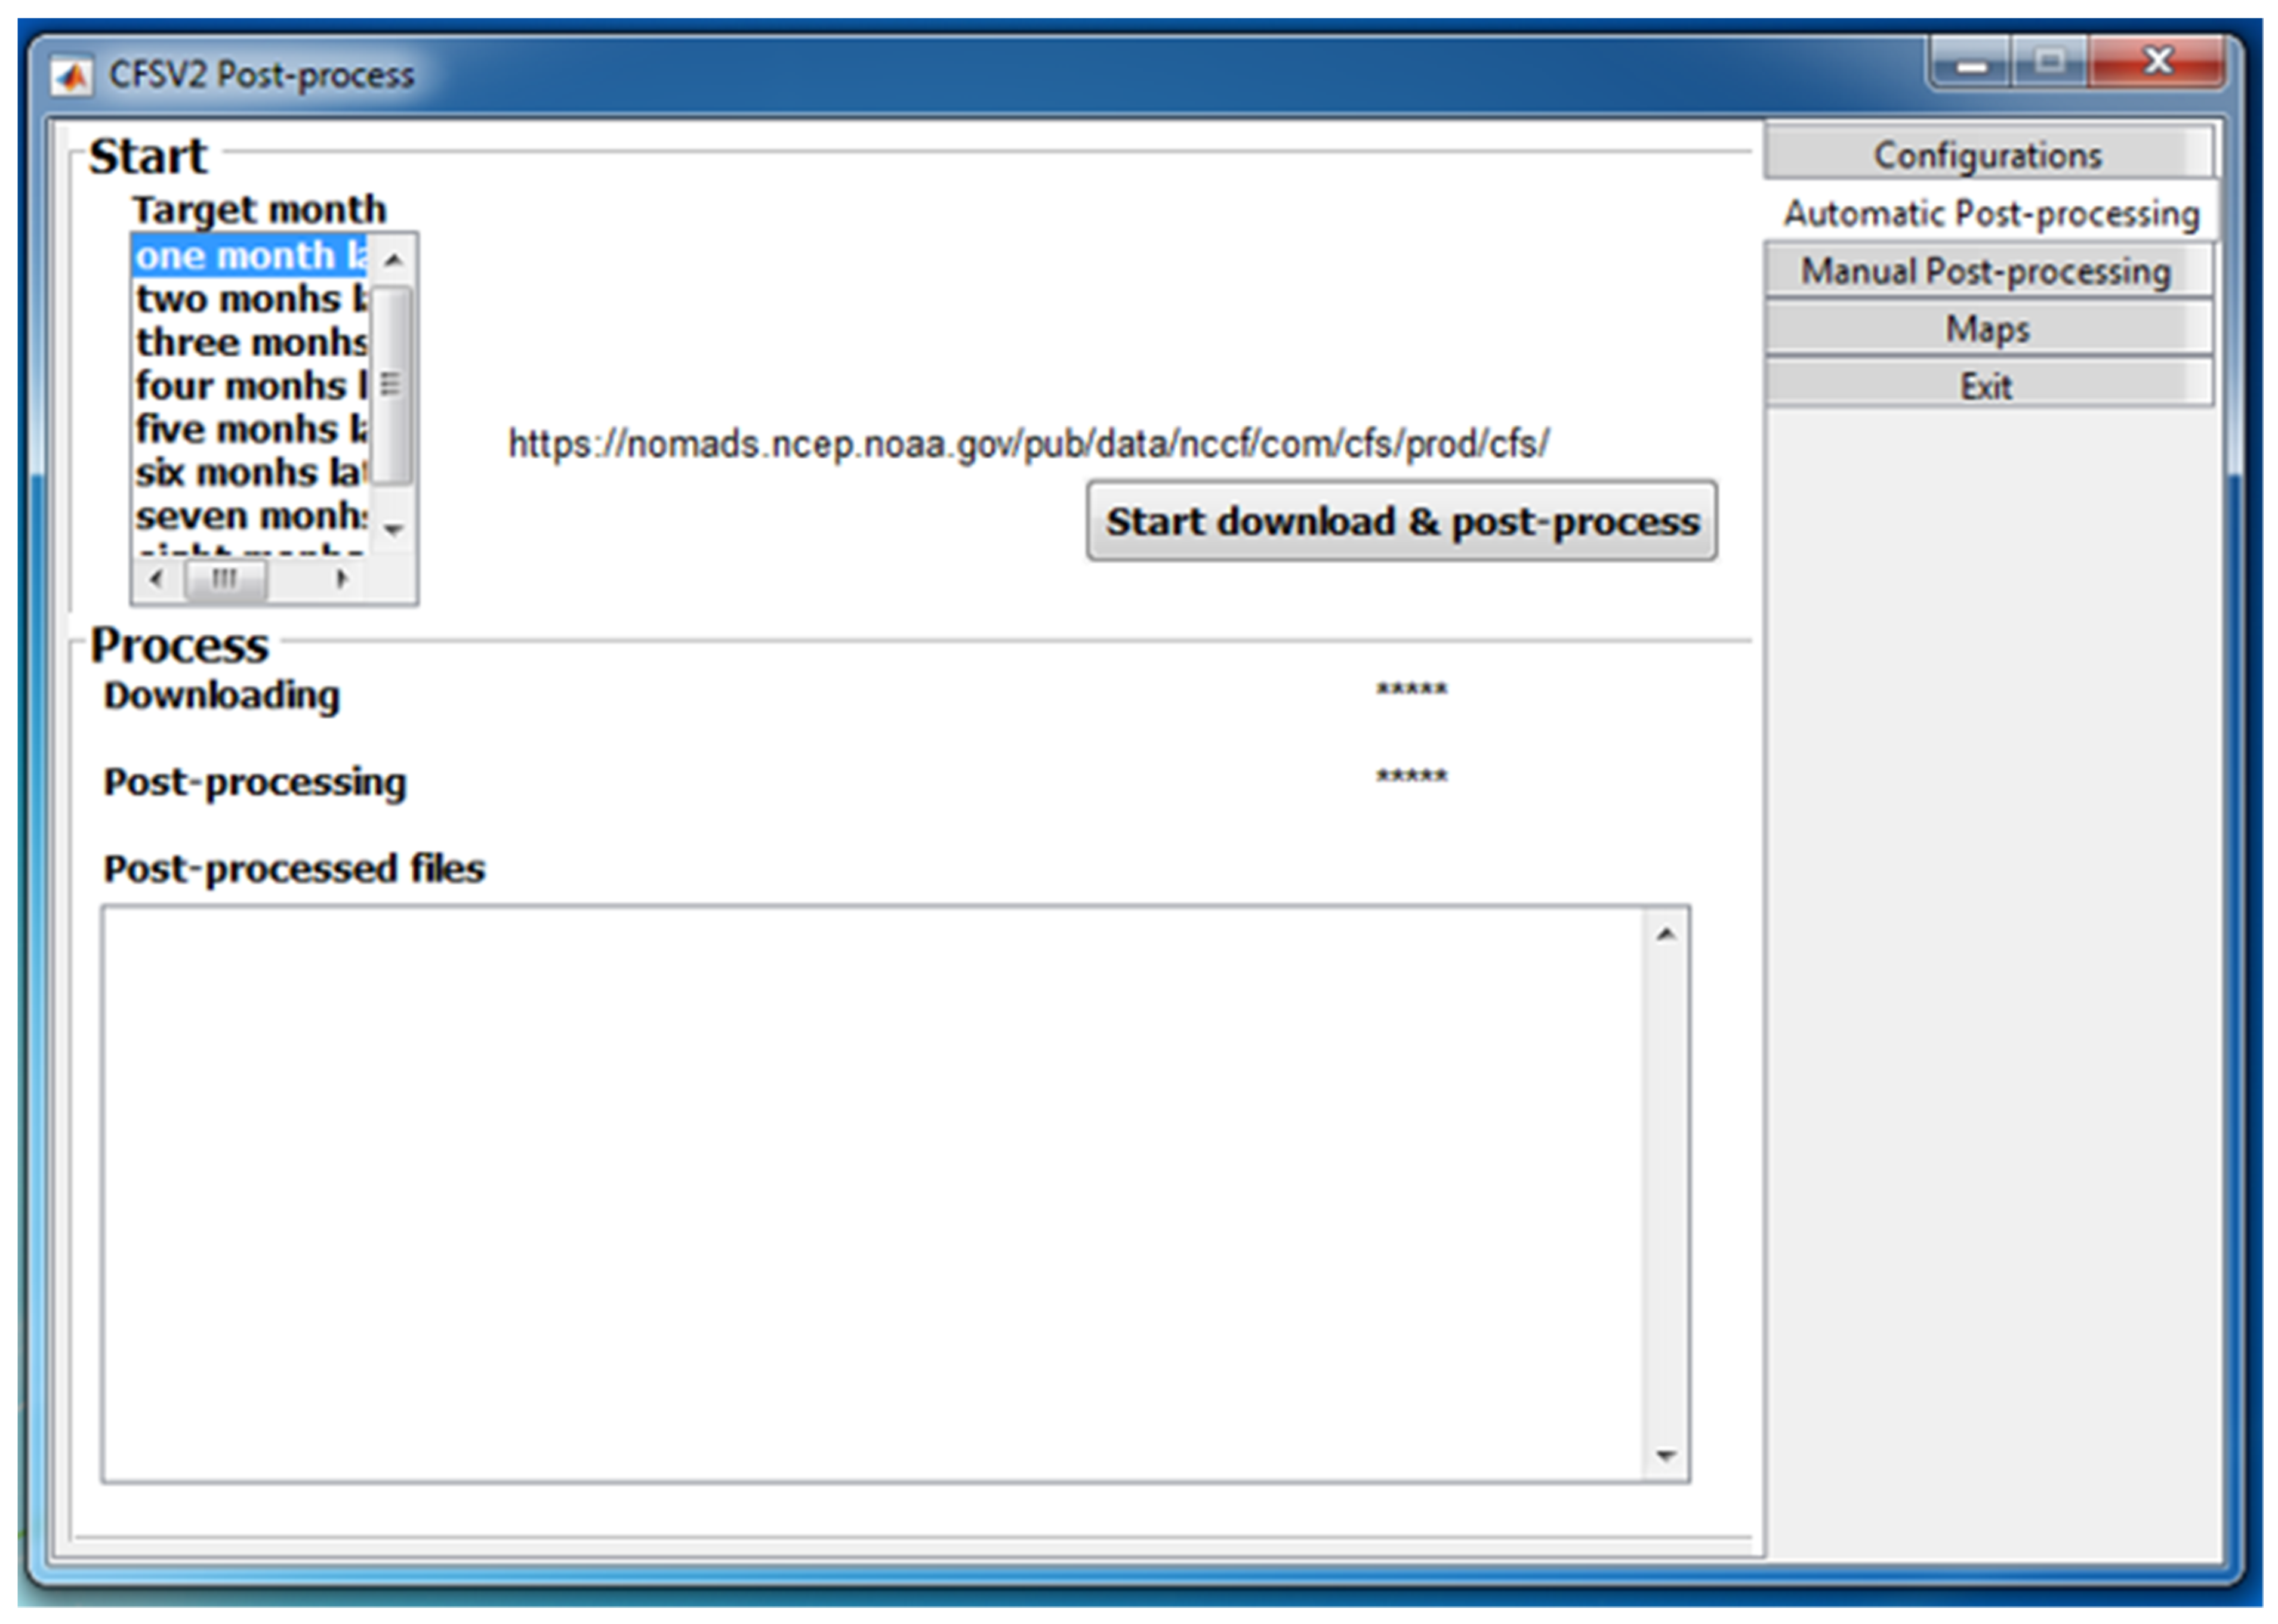
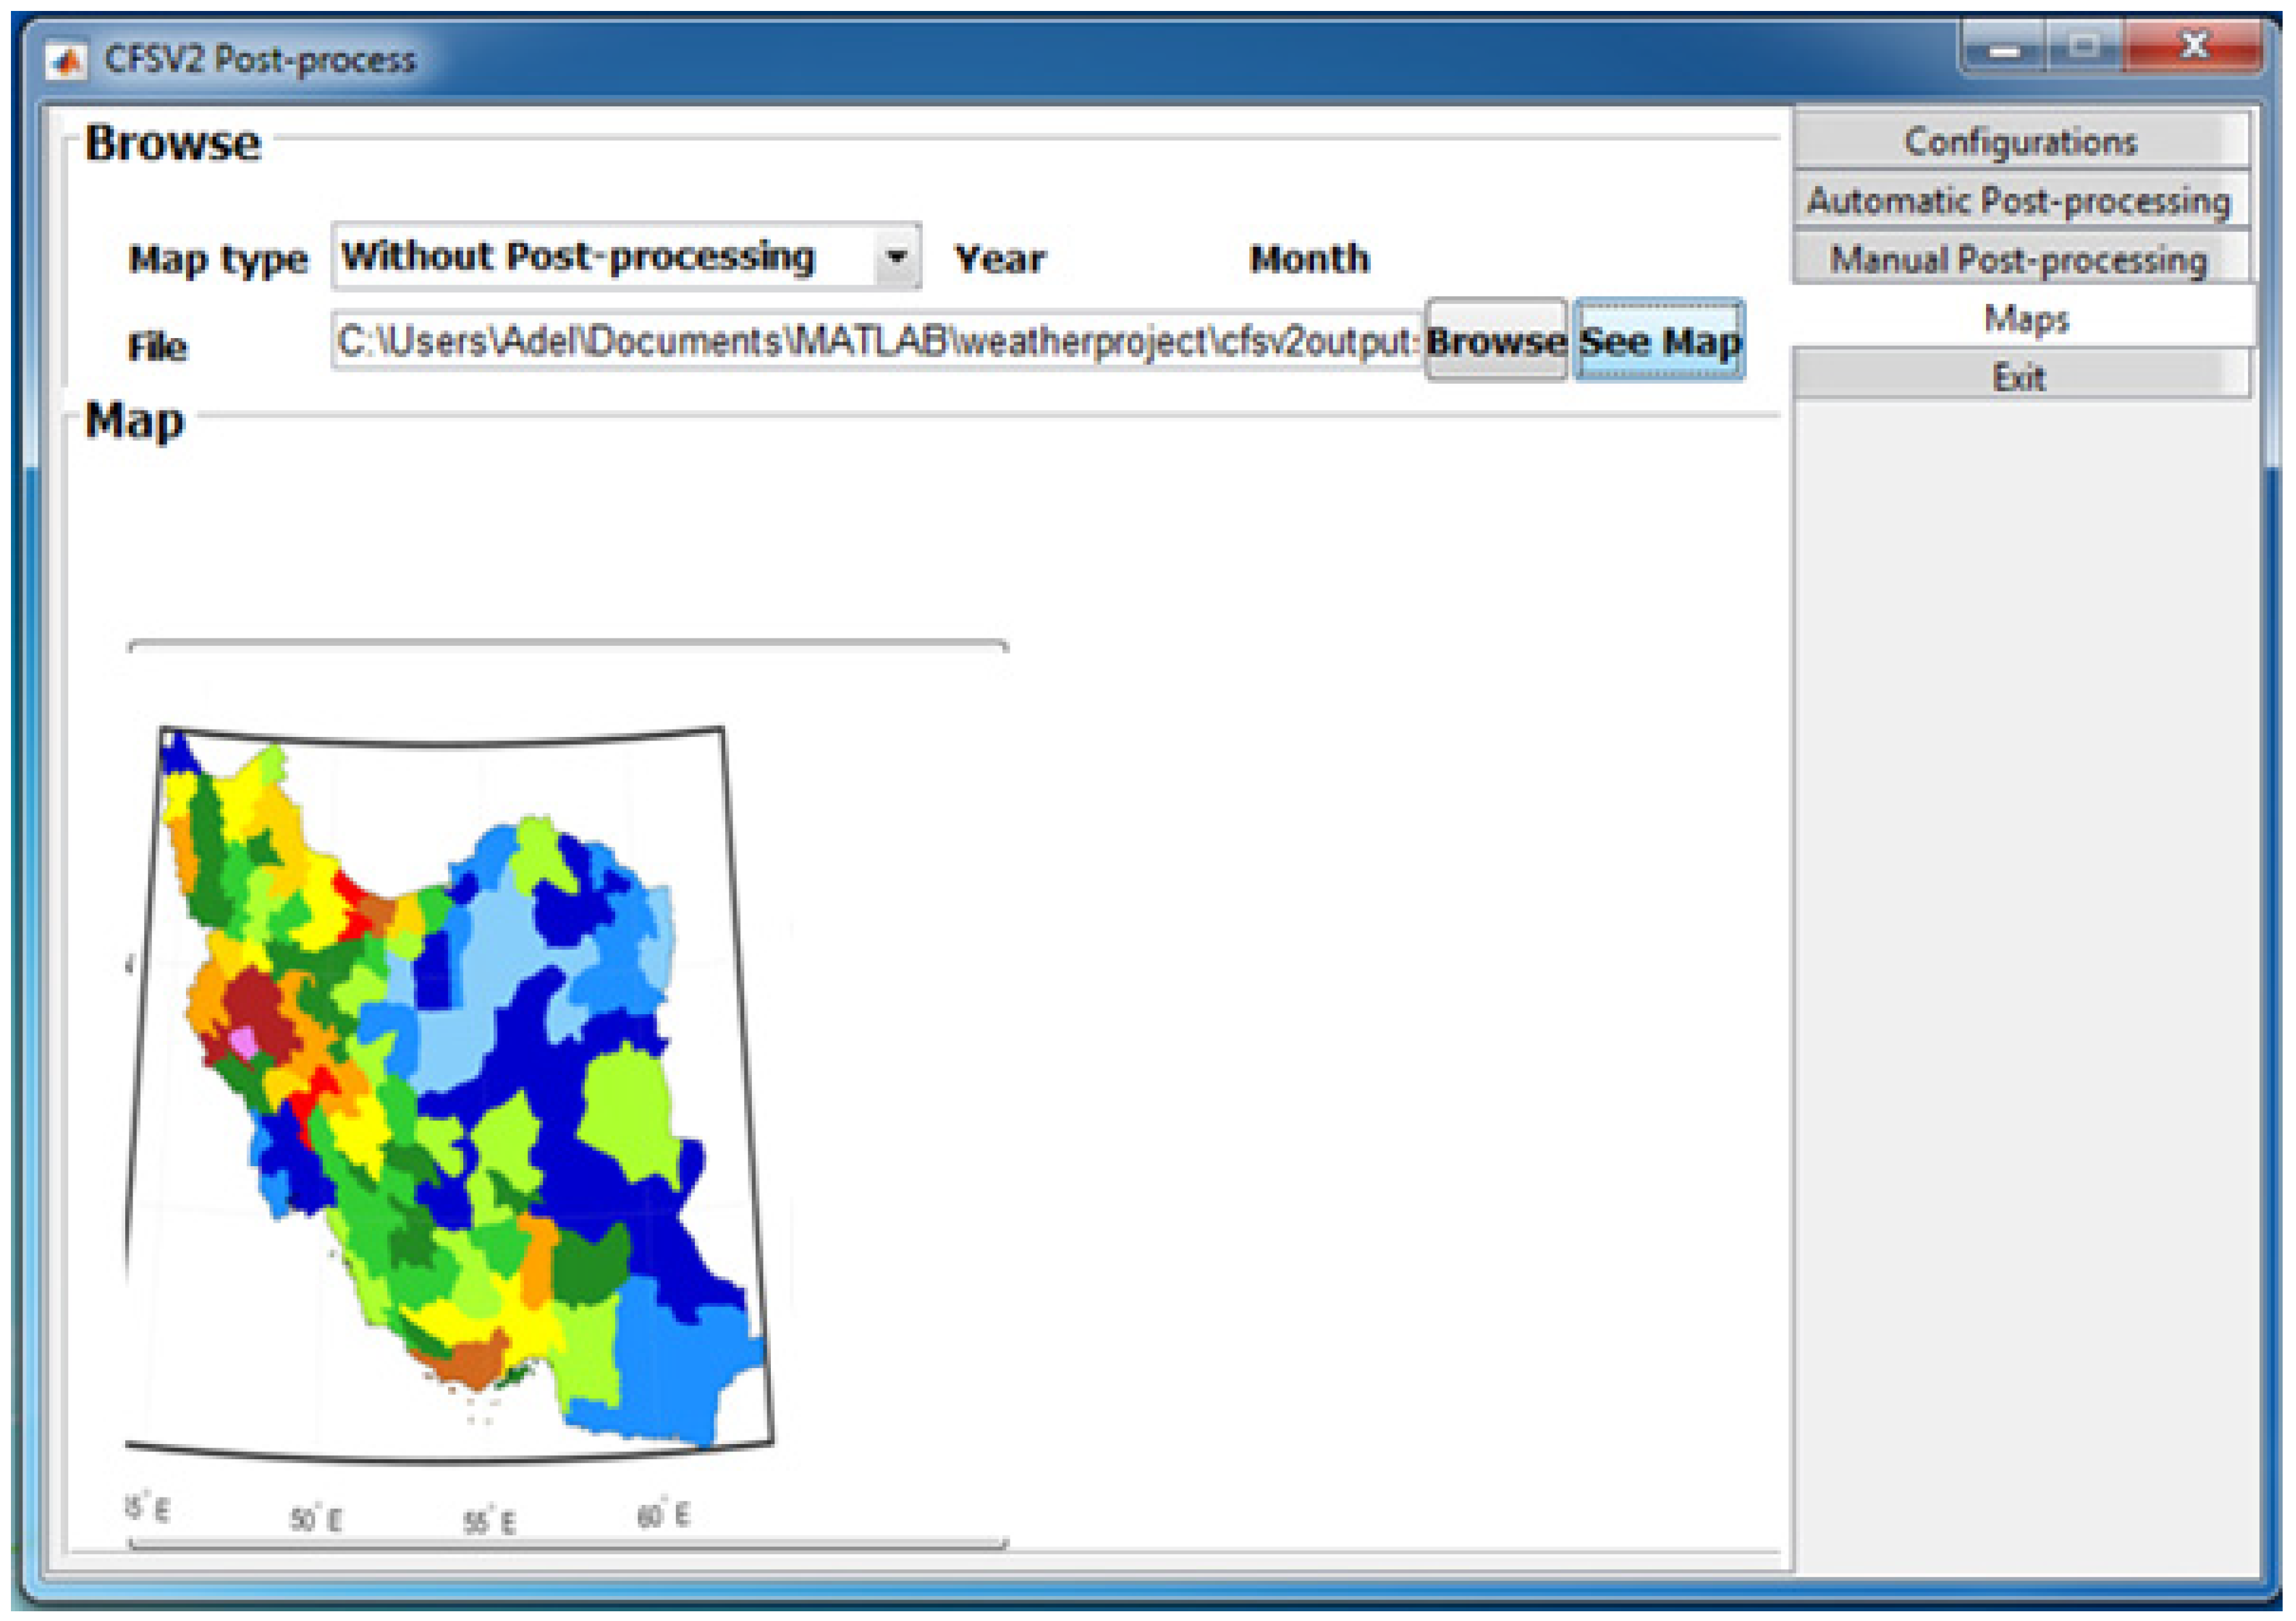
4. Implemented Software
- Data validation and removing false inputs which are obtained from climatology instruments by soft-filtration [51].
- Model tuning based on random false data monthly [51].
- Determination of thresholds for early warning management of famine and flood in case studies [15].
- Execution of re-simulation system after decision-making by managers due to implementation of machine-human-machine decision chain [56].
5. A Discussion on Sustainability Issues
5.1. Sustainability
5.2. DSS Concept
5.3. Importance of Viewpoints
6. Conclusions
Author Contributions
Funding
Informed Consent Statement
Data Availability Statement
Conflicts of Interest
References
- Rincon, A.; Jorba, O.; Baldasano, J.M. Development of a short-term irradiance prediction system using post-processing tools on WRF-ARW meteorological forecasts in Spain. In European Conference on Applied Meteorology; European Meteorological Society: Zurich, Switzerland, 2017; Volume 7. [Google Scholar]
- Abbass, K.; Qasim, M.Z.; Song, H.; Murshed, M.; Mahmood, H.; Younis, I. A review of the global climate change impacts, adaptation, and sustainable mitigation measures. Environ. Sci. Pollut. Res. 2022, 29, 42539–42559. [Google Scholar] [CrossRef] [PubMed]
- Abdollahi, M.; Farjad, B.; Gupta, A.; Hassan, Q.K. CMIP6-D&A: An R-based software with GUI for processing climate data available in network common data format. SoftwareX 2022, 18, 101044. [Google Scholar]
- Akbarian, H.; Gheibi, M.; Hajiaghaei-Keshteli, M.; Rahmani, M. A hybrid novel framework for flood disaster risk control in developing countries based on smart prediction systems and prioritized scenarios. J. Environ. Manag. 2022, 312, 114939. [Google Scholar] [CrossRef] [PubMed]
- Akhila, P.; Anjana, R.L.S.; Kavitha, M. Climate Forecasting: Long short Term Memory Model using Global Temperature Data. In Proceedings of the 2022 6th International Conference on Computing Methodologies and Communication (ICCMC), Erode, India, 29–31 March 2022; pp. 469–473. [Google Scholar]
- Alpaydın, E. Introduction to Machine Learning, 2nd ed.; The MIT Press: Cambridge, MA, USA, 2010. [Google Scholar]
- Amini, M.H.; Arab, M.; Faramarz, M.G.; Ghazikhani, A.; Gheibi, M. Presenting a soft sensor for monitoring and controlling well health and pump performance using machine learning, statistical analysis, and Petri net modeling. Environ. Sci. Pollut. Res. Int. 2021, 34, 1345–1357. [Google Scholar] [CrossRef] [PubMed]
- Amiri, S.A.H.S.; Zahedi, A.; Kazemi, M.; Soroor, J.; Hajiaghaei-Keshteli, M. Determination of the optimal sales level of perishable goods in a two-echelon supply chain network. Comput. Ind. Eng. 2020, 139, 106156. [Google Scholar] [CrossRef]
- An-Vo, D.A.; Radanielson, A.M.; Mushtaq, S.; Reardon-Smith, K.; Hewitt, C. A framework for assessing the value of seasonal climate forecasting in key agricultural decisions. Clim. Serv. 2021, 22, 100234. [Google Scholar] [CrossRef]
- Barry, D.; Hoyne, S. Sustainable measurement indicators to assess impacts of climate change: Implications for the New Green Deal Era. Curr. Opin. Environ. Sci. Health 2021, 22, 100259. [Google Scholar] [CrossRef]
- Bentzien, S.; Friederichs, P. Ensemble postprocessing for probabilistic quantitative precipitation forecasts. In AGU Fall Meeting Abstracts, Proceedings of the 45th Annual Fall Meeting, San Francisco, CA, USA, 3–7 December 2012; AGU: Washington, DC, USA, 2012; Volume 2012. [Google Scholar]
- Bodri, L.; Čermák, V. Prediction of extreme precipitation using a neural network: Application to summer flood occurrence in Moravia. Adv. Eng. Softw. 2000, 31, 311–321. [Google Scholar] [CrossRef]
- Torgo, L.; Ribeiro, R.P.; Pfahringer, B.; Branco, P. Smote for regression. In Portuguese Conference on Artificial Intelligence; Springer: Berlin/Heidelberg, Germany, 2013; pp. 378–389. [Google Scholar]
- Breiman, L. Random Forests. Mach. Learn. 2001, 45, 27. [Google Scholar]
- Carter, J.; Leeson, A.; Orr, A.; Kittel, C.; van Wessem, J.M. Variability in Antarctic Surface Climatology Across Regional Climate Models and Reanalysis Datasets. EGUsphere 2022. preprint. [Google Scholar]
- Chawla, N.V.; Bowyer, K.W.; Hall, L.O.; Kegelmeyer, W.P. SMOTE: Synthetic minority over-sampling technique. J. Artif. Intell. Res. 2002, 16, 321–357. [Google Scholar] [CrossRef]
- Chen, J.; Brissette, F.P.; Li, Z. Postprocessing of Ensemble Weather Forecasts Using a Stochastic Weather Generator. Mon. Weather Rev. 2014, 142, 1106–1124. [Google Scholar] [CrossRef]
- Cheraghalipour, A.; Paydar, M.M.; Hajiaghaei-Keshteli, M. Applying a hybrid BWM-VIKOR approach to supplier selection: A case study in the Iranian agricultural implements industry. Int. J. Appl. Decis. Sci. 2018, 11, 274–301. [Google Scholar] [CrossRef]
- Cohen, B.; Cowie, A.; Babiker, M.; Leip, A.; Smith, P. Co-benefits and trade-offs of climate change mitigation actions and the Sustainable Development Goals. Sustain. Prod. Consum. 2021, 26, 805–813. [Google Scholar] [CrossRef]
- Robertson, D.E.; Shrestha, D.L.; Wang, Q.J. Post-processing rainfall forecasts from numerical weather prediction models for short-term streamflow forecasting. Hydrol. Earth Syst. Sci. 2013, 17, 17. [Google Scholar] [CrossRef] [Green Version]
- Dabernig, M.; Mayr, G.J.; Messner, J.W.; Zeileis, A. Spatial ensemble post-processing with standardized anomalies. Q. J. R. Meteorol. Soc. 2017, 143, 909–916. [Google Scholar] [CrossRef] [Green Version]
- Delle Monache, L.; Nipen, T.; Liu, Y.; Roux, G.; Stull, R. Kalman Filter and Analog Schemes to Postprocess Numerical Weather Predictions. Mon. Weather Rev. 2011, 139, 3554–3570. [Google Scholar] [CrossRef] [Green Version]
- Ekberzade, B.; Yetemen, O.; Sen, O.L. Looking into a fuzzy future: Coupled effect of pyrogeography and a changing climate on an already fragile terrestrial ecosystem (No. EGU22-239). In Proceedings of the Copernicus Meetings, Vienna, Austria, 23–27 May 2022. [Google Scholar]
- Erickson, M.J.; Colle, B.A.; Charney, J.J. Evaluation and Postprocessing of Ensemble Fire Weather Predictions over the Northeast United States. J. Appl. Meteorol. Climatol. 2018, 57, 1135–1153. [Google Scholar] [CrossRef]
- Fathollahi-Fard, A.M.; Hajiaghaei-Keshteli, M.; Tavakkoli-Moghaddam, R. The Social Engineering Optimizer (SEO). Eng. Appl. Artif. Intell. 2018, 72, 267–293. [Google Scholar] [CrossRef]
- Fathollahi-Fard, A.M.; Hajiaghaei-Keshteli, M.; Tavakkoli-Moghaddam, R. Red deer algorithm (RDA): A new nature-inspired meta-heuristic. Soft Comput. 2020, 24, 14637–14665. [Google Scholar] [CrossRef]
- Fathollahi-Fard, A.M.; Hajiaghaei-Keshteli, M.; Tian, G.; Li, Z. An adaptive Lagrangian relaxation-based algorithm for a coordinated water supply and wastewater collection network design problem. Inf. Sci. 2020, 512, 1335–1359. [Google Scholar] [CrossRef]
- Fathollahi-Fard, A.M.; Ahmadi, A.; Al-e-Hashem, S.M. Sustainable closed-loop supply chain network for an integrated water supply and wastewater collection system under uncertainty. J. Environ. Manag. 2020, 275, 111277. [Google Scholar] [CrossRef] [PubMed]
- Fathollahi-Fard, A.M.; Ahmadi, A.; Karimi, B. Multi-Objective Optimization of Home Healthcare with Working-Time Balancing and Care Continuity. Sustainability 2021, 13, 12431. [Google Scholar] [CrossRef]
- Fieldview, T. Climate Fieldview®; The Climate Corporation: San Francisco, CA, USA, 2019. [Google Scholar]
- Gama, F.F.; Wiederkehr, N.C.; da Conceição Bispo, P. Removal of Ionospheric Effects from Sigma Naught Images of the ALOS/PALSAR-2 Satellite. Remote Sens. 2022, 14, 962. [Google Scholar] [CrossRef]
- Gandini, A.; Quesada, L.; Prieto, I.; Garmendia, L. Climate change risk assessment: A holistic multi-stakeholder methodology for the sustainable development of cities. Sustain. Cities Soc. 2021, 65, 102641. [Google Scholar] [CrossRef]
- Ghadami, N.; Gheibi, M.; Kian, Z.; Faramarz, M.G.; Naghedi, R.; Eftekhari, M.; Fathollahi-Fard, A.M.; Dulebenets, M.A.; Tian, G. Implementation of solar energy in smart cities using an integration of artificial neural network, photovoltaic system and classical Delphi methods. Sustain. Cities Soc. 2021, 74, 103149. [Google Scholar] [CrossRef]
- Golmohamadi, S.; Tavakkoli-Moghaddam, R.; Hajiaghaei-Keshteli, M. Solving a fuzzy fixed charge solid transportation problem using batch transferring by new approaches in meta-heuristic. Electron. Notes Discret. Math. 2017, 58, 143–150. [Google Scholar] [CrossRef]
- Hajiaghaei-Keshteli, M.; Sajadifar, S.M. Deriving the cost function for a class of three-echelon inventory system with N-retailers and one-for-one ordering policy. Int. J. Adv. Manuf. Technol. 2010, 50, 343–351. [Google Scholar] [CrossRef]
- Hajiaghaei-Keshteli, M.; Sajadifar, S.M.; Haji, R. Determination of the economical policy of a three-echelon inventory system with (R, Q) ordering policy and information sharing. Int. J. Adv. Manuf. Technol. 2011, 55, 831–841. [Google Scholar] [CrossRef]
- He, H.; Garcia, E.A. Learning from Imbalanced Data. IEEE Trans. Knowl. Data Eng. 2009, 21, 1263–1284. [Google Scholar]
- Hidalgo, M.; Bartolino, V.; Coll, M.; Hunsicker, M.E.; Travers-Trolet, M.; Browman, H.I. ‘Adaptation science’ is needed to inform the sustainable management of the world’s oceans in the face of climate change. ICES J. Mar. Sci. 2022, 79, 457–462. [Google Scholar] [CrossRef]
- Huang, G.-B.; Zhu, Q.-Y.; Siew, C.-K. Extreme learning machine: Theory and applications. Neurocomputing 2006, 70, 489–501. [Google Scholar] [CrossRef]
- Bogner, K.; Liechti, K.; Zappa, M. Post-Processing of Stream Flows in Switzerland with an Emphasis on Low Flows and Floods. Water 2016, 8, 115. [Google Scholar] [CrossRef] [Green Version]
- Kang, H.; Sridhar, V. A near—term drought assessment using hydrological and climate forecasting in the Mekong River Basin. Int. J. Climatol. 2021, 41, E2497–E2516. [Google Scholar] [CrossRef]
- Kozlov, D.; Ghebrehiwot, A. Physically-Based Streamflow Predictions in Ungauged Basin with Semi-Arid Climate. In Proceedings of FORM 2021; Springer: Cham, Switzerland, 2022; pp. 549–565. [Google Scholar]
- Kuncheva, L.I. Combining Pattern Classifiers Methods and Algorithms; John Wiley & Sons: Hoboken, NJ, USA, 2004. [Google Scholar]
- Breiman, L.; Friedman, J.; Olshen, R.; Stone, C. Classification and Regression Trees; CRC Press: Boca Raton, FL, USA, 1984. [Google Scholar]
- Lawrence, T.; Hosein, P. Stochastic dynamic programming heuristics for influence maximization–revenue optimization. Int. J. Data Sci. Anal. 2019, 8, 1–14. [Google Scholar] [CrossRef] [Green Version]
- Li, X.-Y.; Chau, K.W.; Cheng, C.-T.; Li, Y.S. A Web-based flood forecasting system for Shuangpai region. Adv. Eng. Softw. 2006, 37, 146–158. [Google Scholar] [CrossRef] [Green Version]
- Liao, Y.; Kaviyani-Charati, M.; Hajiaghaei-Keshteli, M.; Diabat, A. Designing a closed-loop supply chain network for citrus fruits crates considering environmental and economic issues. J. Manuf. Syst. 2020, 55, 199–220. [Google Scholar] [CrossRef]
- Lin, H.; Brunet, G.; Derome, J. Seasonal Forecasts of Canadian Winter Precipitation by Postprocessing GCM Integrations. Mon. Weather Rev. 2008, 136, 769–783. [Google Scholar] [CrossRef]
- Lin, W.-C.; Tsai, C.-F. Missing value imputation: A review and analysis of the literature (2006–2017). Artif. Intell. Rev. 2020, 53, 1487–1509. [Google Scholar] [CrossRef]
- Madadgar, S.; Moradkhani, H.; Garen, D. Towards improved post-processing of hydrologic forecast ensembles. Hydrol. Process. 2014, 28, 104–122. [Google Scholar] [CrossRef]
- Marszalek, M.; Körner, M.; Schmidhalter, U. Prediction of multi-year winter wheat yields at the field level with satellite and climatological data. Comput. Electron. Agric. 2022, 194, 106777. [Google Scholar] [CrossRef]
- El Ayari, M.; Hemri, S.; Baran, S. Statistical post-processing of hydrological forecasts using Bayesian model averaging. Geophys. Res. Abstr. 2019, 21, 1342–1353. [Google Scholar]
- Mohammadi, M.; Gheibi, M.; Fathollahi-Fard, A.M.; Eftekhari, M.; Kian, Z.; Tian, G. A hybrid computational intelligence approach for bioremediation of amoxicillin based on fungus activities from soil resources and aflatoxin B1 controls. J. Environ. Manag. 2021, 299, 113594. [Google Scholar] [CrossRef]
- Mol, W.; Heusinkveld, B.; Knap, W.; van Heerwaarden, C. Climatology and Spatial Patterns of Cloud Shadows and Irradiance Peaks (No. EGU22-2164). In Proceedings of the Copernicus Meetings, Vienna, Austria, 23–27 May 2022. [Google Scholar]
- Mordvin, E.Y.; Lagutin, A.A.; Volkov, N.V. Total methane content in the atmosphere of Western Siberia in 2000–2020 according to the data of chemical transport model MOZART-4. InCEUR Workshop Proc. 2021, 3006, 314–322. [Google Scholar]
- Ohba, M.; Kanno, Y.; Nohara, D. Climatology of dark doldrums in Japan. Renew. Sustain. Energy Rev. 2022, 155, 111927. [Google Scholar] [CrossRef]
- Rasp, S.; Lerch, S. Neural Networks for Postprocessing Ensemble Weather Forecasts. Mon. Weather Rev. 2018, 146, 3885–3900. [Google Scholar] [CrossRef] [Green Version]
- Roulin, E.; Vannitsem, S. Postprocessing of Ensemble Precipitation Predictions with Extended Logistic Regression Based on Hindcasts. Mon. Weather Rev. 2012, 140, 874–888. [Google Scholar] [CrossRef]
- Rudenko, R.; Pires, I.M.; Liberato, M.; Barroso, J.; Reis, A. A Brief Review on 4D Weather Visualization. Sustainability 2022, 14, 5248. [Google Scholar] [CrossRef]
- Vashani, S.; Azadi, M.; Hajjam, S. Comparative Evaluation of Different Post Processing Methods for Numerical Weather Prediction of Temperature Forecasts over Iran. Res. J. Environ. Sci. 2010, 4, 305–316. [Google Scholar]
- Sadeghi-Moghaddam, S.; Hajiaghaei-Keshteli, M.; Mahmoodjanloo, M. New approaches in metaheuristics to solve the fixed charge transportation problem in a fuzzy environment. Neural Comput. Appl. 2019, 31, 477–497. [Google Scholar] [CrossRef]
- Saha, S.; Moorthi, S.; Wu, X.; Wang, J.; Nadiga, S.; Tripp, P.; Behringer, D.; Hou, Y.-T.; Chuang, H.-Y.; Iredell, M.; et al. The NCEP Climate Forecast System Version 2. J. Clim. 2014, 27, 2185–2208. [Google Scholar] [CrossRef]
- Salvador García Julián Luengo Herrera, F. Data Preprocessing in Data Mining; Springer: Berlin/Heidelberg, Germany, 2015. [Google Scholar]
- Scheuerer, M.; Büermann, L. Spatially adaptive post-processing of ensemble forecasts for temperature. J. R. Stat. Soc. Ser. C Appl. Stat. 2014, 63, 405–422. [Google Scholar] [CrossRef] [Green Version]
- Scheuerer, M.; Hamill, T.M. Statistical Postprocessing of Ensemble Precipitation Forecasts by Fitting Censored, Shifted Gamma Distributions. Mon. Weather Rev. 2015, 143, 4578–4596. [Google Scholar] [CrossRef]
- Shahsavar, M.M.; Akrami, M.; Gheibi, M.; Kavianpour, B.; Fathollahi-Fard, A.M.; Behzadian, K. Constructing a smart framework for supplying the biogas energy in green buildings using an integration of response surface methodology, artificial intelligence and petri net modelling. Energy Convers. Manag. 2021, 248, 114794. [Google Scholar] [CrossRef]
- Sheela, M.S.; Banu, S.S.; Rajendran, T.; Raj, S.S.; Sreeja, B.P. Weather and Climate Forecasting System for Cultivation using Naive’s Algorithm. In Proceedings of the 2022 2nd International Conference on Computing and Information Technology (ICCIT), Tabuk, Saudi Arabia, 25–27 January 2022; pp. 428–431. [Google Scholar]
- Shrestha, D.L.; Robertson, D.E.; Bennett, J.C.; Wang, Q.J. Improving Precipitation Forecasts by Generating Ensembles through Postprocessing. Mon. Weather Rev. 2015, 143, 3642–3663. [Google Scholar] [CrossRef]
- Sparrow, S.; Bowery, A.; Carver, G.D.; Köhler, M.O.; Ollinaho, P.; Pappenberger, F.; Wallom, D.; Weisheimer, A. OpenIFS@ home version 1: A citizen science project for ensemble weather and climate forecasting. Geosci. Model Dev. 2021, 14, 3473–3486. [Google Scholar] [CrossRef]
- Specht, D.F. A general regression neural network. IEEE Trans. Neural Netw. 1991, 2, 568–576. [Google Scholar] [CrossRef] [Green Version]
- Stauffer, R.; Umlauf, N.; Messner, J.W.; Mayr, G.J.; Zeileis, A. Ensemble Postprocessing of Daily Precipitation Sums over Complex Terrain Using Censored High-Resolution Standardized Anomalies. Mon. Weather Rev. 2017, 145, 955–969. [Google Scholar] [CrossRef]
- Stojanovic, B.; Milivojevic, M.; Ivanovic, M.; Milivojevic, N.; Divac, D. Adaptive system for dam behavior modeling based on linear regression and genetic algorithms. Adv. Eng. Softw. 2013, 65, 182–190. [Google Scholar] [CrossRef]
- Sweeney, C.P.; Lynch, P.; Nolan, P. Reducing errors of wind speed forecasts by an optimal combination of post-processing methods. Meteorol. Appl. 2013, 20, 32–40. [Google Scholar] [CrossRef] [Green Version]
- Taillardat, M.; Fougères, A.-L.; Naveau, P.; Mestre, O. Forest-Based and Semiparametric Methods for the Postprocessing of Rainfall Ensemble Forecasting. Weather Forecast. 2019, 34, 617–634. [Google Scholar] [CrossRef]
- Teske, S.; Guerrero, J. One Earth Climate Model—Integrated Energy Assessment Model to Develop Industry-Specific 1.5 °C Pathways with High Technical Resolution for the Finance Sector. Energies 2022, 15, 3289. [Google Scholar] [CrossRef]
- Asghari, M.; Fathollahi-Fard, A.M.; Mirzapour Al-e-hashem, S.M.J.; Dulebenets, M.A. Transformation and Linearization Techniques in Optimization: A State-of-the-Art Survey. Mathematics 2022, 10, 283. [Google Scholar] [CrossRef]
- van Buuren, S.; Groothuis-Oudshoorn, K. Mice: Multivariate Imputation by Chained Equations in R. J. Stat. Softw. 2011, 45, 67. [Google Scholar] [CrossRef] [Green Version]
- Verkade, J.S.; Brown, J.D.; Reggiani, P.; Weerts, A.H. Post-processing ECMWF precipitation and temperature ensemble reforecasts for operational hydrologic forecasting at various spatial scales. J. Hydrol. 2013, 501, 73–91. [Google Scholar] [CrossRef]
- Vogel, P.; Gneiting, T.; Knippertz, P.; Fink, A.H.; Schlüter, A. Statistical ensemble postprocessing for precipitation forecasting during the West African Monsoon. In EGU General Assembly Conference Abstracts; EGU: Munich, Germany, 2017; p. 14208. [Google Scholar]
- Vogel, P.; Knippertz, P.; Fink, A.H.; Schlueter, A.; Gneiting, T. Skill of Global Raw and Postprocessed Ensemble Predictions of Rainfall over Northern Tropical Africa. Weather Forecast. 2018, 33, 369–388. [Google Scholar] [CrossRef]
- McCulloch, W.; Pitts, W. A Logical Calculus of Ideas Immanent in Nervous Activity. Bull. Math. Biophys. 1943, 5, 18. [Google Scholar] [CrossRef]
- Whan, K.; Schmeits, M. Probabilistic forecasts of extreme local precipitation using Harmonie predictors and comparing 3 different post-processing methods. In EGU General Assembly Conference Abstracts; EGU: Munich, Germany, 2017; p. 5596. [Google Scholar]
- Williams, R.M.; Ferro, C.A.T.; Kwasniok, F. A comparison of ensemble post-processing methods for extreme events. Q. J. R. Meteorol. Soc. 2014, 140, 1112–1120. [Google Scholar] [CrossRef]
- Wu, L.; Zhang, Y.; Adams, T.; Lee, H.; Liu, Y.; Schaake, J. Comparative Evaluation of Three Schaake Shuffle Schemes in Postprocessing GEFS Precipitation Ensemble Forecasts. J. Hydrometeorol. 2018, 19, 575–598. [Google Scholar] [CrossRef]
- Wutzler, T.; Lucas-Moffat, A.; Migliavacca, M.; Knauer, J.; Sickel, K.; Šigut, L.; Menzer, O.; Reichstein, M. Basic and extensible post-processing of eddy covariance flux data with REddyProc. Biogeosciences 2018, 15, 5015–5030. [Google Scholar] [CrossRef] [Green Version]
- Yang, X.; Sharma, S.; Siddique, R.; Greybush, S.J.; Mejia, A. Postprocessing of GEFS Precipitation Ensemble Reforecasts over the U.S. Mid-Atlantic Region. Mon. Weather Rev. 2017, 145, 1641–1658. [Google Scholar] [CrossRef] [Green Version]
- Zhao, P.; Yu, B. Boosted Lasso; California University Berkeley Department of Statistics: San Diego, CA, USA, 2004. [Google Scholar]
- Moosavi, J.; Fathollahi-Fard, A.M.; Dulebenets, M.A. Supply chain disruption during the COVID-19 pandemic: Recognizing potential disruption management strategies. Int. J. Disaster Risk Reduct. 2022, 18, 102983. [Google Scholar] [CrossRef]
- Soleimani, H.; Chhetri, P.; Fathollahi-Fard, A.M.; Mirzapour Al-e-Hashem, S.M.J.; Shahparvari, S. Sustainable closed-loop supply chain with energy efficiency: Lagrangian relaxation, reformulations and heuristics. Ann. Oper. Res. 2022, 623, 1–26. [Google Scholar] [CrossRef]


| Method | RSME | Pear_Corr |
|---|---|---|
| GRNN | 41.99 | 0.67 |
| NN | 41.79 | 0.58 |
| ELM | 51.19 | 0.15 |
| BRT | 36.81 | 0.74 |
| RF | 25.94 | 0.87 |
| LB | 33.02 | 0.77 |
Publisher’s Note: MDPI stays neutral with regard to jurisdictional claims in published maps and institutional affiliations. |
© 2022 by the authors. Licensee MDPI, Basel, Switzerland. This article is an open access article distributed under the terms and conditions of the Creative Commons Attribution (CC BY) license (https://creativecommons.org/licenses/by/4.0/).
Share and Cite
Ghazikhani, A.; Babaeian, I.; Gheibi, M.; Hajiaghaei-Keshteli, M.; Fathollahi-Fard, A.M. A Smart Post-Processing System for Forecasting the Climate Precipitation Based on Machine Learning Computations. Sustainability 2022, 14, 6624. https://0-doi-org.brum.beds.ac.uk/10.3390/su14116624
Ghazikhani A, Babaeian I, Gheibi M, Hajiaghaei-Keshteli M, Fathollahi-Fard AM. A Smart Post-Processing System for Forecasting the Climate Precipitation Based on Machine Learning Computations. Sustainability. 2022; 14(11):6624. https://0-doi-org.brum.beds.ac.uk/10.3390/su14116624
Chicago/Turabian StyleGhazikhani, Adel, Iman Babaeian, Mohammad Gheibi, Mostafa Hajiaghaei-Keshteli, and Amir M. Fathollahi-Fard. 2022. "A Smart Post-Processing System for Forecasting the Climate Precipitation Based on Machine Learning Computations" Sustainability 14, no. 11: 6624. https://0-doi-org.brum.beds.ac.uk/10.3390/su14116624