
Assessment of Indoor Air Quality in Academic Buildings Using IoT and Deep Learning


1
Structural Engineering Department, Faculty of Engineering, Cairo University, Giza 12613, Egypt
2
Social Housing and Mortgage Finance Fund, Ministry of Housing, Utilities and Urban Communities, Cairo 11516, Egypt
*
Author to whom correspondence should be addressed.
Sustainability 2022, 14(12), 7015; https://0-doi-org.brum.beds.ac.uk/10.3390/su14127015
Submission received: 16 April 2022
/
Revised: 23 May 2022
/
Accepted: 25 May 2022
/
Published: 8 June 2022
(This article belongs to the Special Issue IT-Enabled Sustainability and Development)
Abstract
:Humans spend most of their lifetime indoors; thus, it is important to keep indoor air quality within acceptable levels. As a result, many initiatives have been developed by multiple research centers or through academic studies to address the harmful effects of increased indoor pollutants on public health. This research introduces a system for monitoring different air parameters to evaluate the indoor air quality (IAQ) and to provide real-time readings. The proposed system aims to enhance planning and controlling measures and increase both safety and occupants’ comfort. The system combines microcontrollers and electronic sensors to form an Internet of Things (IoT) solution that collects different indoor readings. The readings are then compared with outdoor readings for the same experiment period and prepared for further processing using artificial intelligence (AI) models. The results showed the high effectiveness of the IoT device in transferring data via Wi-Fi with minimum disruptions and missing data. The average readings for temperature, humidity, air pressure, CO2, CO, and PM2.5 in the presented case study are 30 °C, 42%, 100,422 pa, 460 ppm, 2.2 ppm, and 15.3 µ/m3, respectively. The developed model was able to predict multiple air parameters with acceptable accuracy. It can be concluded that the proposed system proved itself as a powerful forecasting and management tool for monitoring and controlling IAQ.
1. Introduction
According to the US Environmental Protection Agency [1], poor indoor air quality (IAQ) is considered a major risk to human health. People spend most of their lifetime indoors, where some pollutant concentrations are as high as five times more than the pollutants outdoors. In recent years, pollutant concentrations have increased due to a lack of ventilation and the extensive use of synthetic materials in both residential and commercial buildings that hinder air exchange, certain occupant behaviors, and chemicals used in personal products. Those who are affected the most are young adults and those with respiratory diseases. Weather conditions and building quality represent an additional concern, since the outdoor air can easily flow inside through cracks and windows, affecting different rooms and spaces inside; even those under controlled ventilation remain vulnerable to air pollutants. The ultimate goal of any building is to improve quality of life and to provide occupants with a sustainable, healthy environment. Building studies show that many health problems are caused by poor indoor air quality and the economic value of a building is badly affected if the building is known for its poor performance in air quality [2]. Indoor air quality and sustainability management have become vital considerations in today’s human lives. Buildings that are unique in nature, such as hospitals, are in need of adequate control of their indoor environment, and in such cases, a sustainable approach is highly required to continuously evaluate and control any risks that may affect patient health [3]. The term “sustainability development” is often used to describe an approach to improve quality of life, thus providing a healthy environment and enhancing both social and economic conditions for generations to come [4].
There is growing attention given to indoor air quality (IAQ) due to its effects on occupants’ comfort and productivity. Indoor air quality depends on parameters that are not easily measured, and such a challenge requires a fundamental innovation. The Internet of things (IoT) can be used as an alternative to measure predefined indoor air parameters, but it is associated with technical details (i.e., sensor availability and Wi-Fi connectivity). Since the IAQ parameters will depend on continuous monitoring for managing and controlling later, cloud services can be a good option to effectively store and capture trends from data. However, choosing a suitable cloud for IoT applications remain a challenging task. The main objective of this research is to develop a methodology for measuring different indoor parameters with the ability to store large amounts of data and use prediction models to enhance both forecasting and controlling ability. This paper’s objectives include both evaluating and predicting indoor air quality in buildings. It reduces the gap of studying the relationship between indoor and outdoor air quality. The study identifies IAQ parameters and their different detection technologies in order to investigate how IoT technology can be utilized. Finally, an IoT system is developed to provide real-time measurements with the ability to store large amounts of data for the application of prediction models.
2. Literature Review
Over the last five decades, the human population has increased rapidly and urban areas have expanded as a result. Such an increase has a significant impact on our environment. The extensive use of transportation and manufacturing activities has caused a significant increase in greenhouse gases (GHGs) and a continual increase in Earth’s temperature. The last decades witnessed a continuous improvement in air quality monitoring technologies, which facilitated further studies to inspect the relationship between air quality and climate changes. Air quality studies from the past and present will improve our understanding of air pollution, health effects, and ecosystem viability [5]. In Europe, different scenarios have been applied, including the effects of fuel consumption as a result of factories and transportation activities, in order to evaluate air quality polices. Crippa et al. [6] concluded that air quality measures and polices, if accurately implemented, can control pollution and, subsequently, health is enhanced. In India, Rajak et al. [7] presented a comprehensive review regarding short- and long-term exposure to air pollution and its effects on human health. It was noted that despite air pollution exposure occurring in both urban and rural areas, air pollution monitoring systems mainly collect data from mega cities, which implies that many cases in rural areas are frequently neglected. Arsic et al. [8] also predicted ozone concentrations depending on different air quality parameters, including CO, H2S, and SO2. Other factors were also investigated, including wind speed, wind direction, and air pressure. The study utilized multiple linear regression analysis and compared the results with an artificial neural network (ANN). The results showed that the ANN demonstrated better performance when incorporating different primary concentrations and meteorological factors. It was concluded that predicting air quality variables is better modeled by ANNs to consider any nonlinear relationships.
Tran et al. [9] presented a procedure to assess personal exposure (PE) to airborne particulate matter (PM) across diverse microenvironments (MEs). The procedure was performed over 24 h. Considering different exposure scenarios is necessary to identify appropriate strategies to improve urban air quality and mitigate the health effects of PM. The researchers concluded that there are potential carcinogenic risks associated with long-term exposure to elevated levels of PM2.5-bound toxic trace elements. Zhou and Ooka [10] studied the feasibility of adopting deep neural networks (DNNs) for predicting indoor airflow distribution; they investigated the influence of DNN architecture on prediction performance, considering two DNNs for different prediction strategies. The performance of the two DNN architectures was tested on both a training dataset and a test dataset, which were compared. Qiu et al. [11] performed an experiment to continuously monitor the variability of indoor particulate matter in six office buildings in Chengdu, Sichuan Province. Four out of the six buildings showed a reduction in indoor PM2.5 during work hours, suggesting functional filtration systems. The results indicated that the daily accumulation of indoor CO2 was due to ineffective ventilation. Khaniabadi et al. [12] modeled air quality for health risk assessment and focused on selected parameters such as sulfur compounds and fine particles. Data collected hourly were used to accurately calculate the average daily concentrations. The study concluded that mitigation policies are needed to be taken by governments to control air pollution, especially fine particles. Steinemann et al. [13] illustrated that green buildings might not result in better IAQ. Many developers in recent years have aimed to certify their building as a green building. Although certificates have minimum requirements in order to gain IAQ credits, it was noticed that many buildings may obtain certification without satisfying the IAQ requirements. Luo et al. [14] shed some light on the relationship between occupants’ indoor climate experience and their thermal comfort expectations in buildings. The study emphasized the need for physical measurements, and encouraged the review of the current indoor environment standards. It is usually claimed that ventilation will lead to better IAQ. Francisco et al. [15] conducted an in-depth study of ventilation effects on IAQ and occupants’ health in households. It was concluded that more studies are needed in order to discover the relationship between ventilation and IAQ. In New Zealand, Bennett et al. [16] studied sources of pollution for the indoor environment, and it was concluded that school location highly affected the IAQ. Hesaraki and Huda [17] analyzed and discussed radiant low-temperature heating (LTH) and high-temperature cooling (HTC) systems based on their results on energy usage, thermal comfort, indoor air quality, design, and control. The authors concluded that LTH/HTC systems can save between 10% and 30% energy and provide better thermal comfort in comparison with all-air systems.
Jin et al. [18] investigated the relationship between lung cancer and poor indoor environment to provide a base for future studies related to IAQ. The results showed that the pollution sources linked directly to lung cancer are smoking, indirect smoking, oil fumes, coal used for cooking, and solid fuel used for heating. In Egypt, Osman et al. [19] studied IAQ in hospitals as the indoor environment is highly critical and needs to be continuously monitored and controlled. It was concluded that further studies need to investigate the dispersion of different contaminants. Maesano et al. [20] studied the relationship between pollution sources and health effects. It was observed that there is a lack of studies for IAQ in educational buildings, and a poor indoor environment greatly affects students’ performance. Chang et al. [21] studied indoor decoration materials and their relationship with IAQ, and concluded that sources of indoor pollution included wall decorations, panel furniture, and latex paints. The study concluded that an increase in temperature will lead to an increase in pollutant concentrations, and ventilation will positively decrease concentrations. Mutis et al. [22] utilized IR sensors to detect indoor motion and to predict the occupants’ activities using deep learning to balance between the energy consumption and the indoor environment through optimizing the working hours of the HVAC systems. Jang et al. [23] developed a neural network that enhanced the use of a building energy management system (BEMS) to overcome the lack of historical data for prediction and provide better thermal control. Heracleous et al. [24] investigated the indoor comfort conditions in classrooms by collecting and analyzing in situ measurements of relative humidity, temperature, and CO2. The recommendations included the need for natural ventilation at a low air change rate to keep the indoor air quality within the limits provided by international standards.
Amoatey et al. [25] reviewed IAQ studies from the Gulf Cooperation Council (GCC) countries. People from this area spend most of their time indoors due to dust storms, inconvenient temperatures, and relatively high humidity. The review results showed that mitigation studies and IAQ modeling are urgently needed. The recommendations included studying the effect of multiple pollutants on health compared to a single pollutant, and that future studies should focus on rural areas instead of only concentrating on urban areas. Cao et al. [26] studied the associations between air pollution, outdoor activities, and symptoms of wheeze and rhinitis for pre-school children in Wuhan and the surrounding cities. The research provided a guide to the design of outdoor activities and outdoor courses for pre-school children during the process of urban construction.
Jin et al. [27] monitored unauthorized intrusion on construction sites to reduce safety incidents using IoT-based methodology. They developed a monitoring system and provided means to plan countermeasures such as a reward and punishment mechanism. Rafsanjani [28] proposed an approach to control occupant energy-use behavior through combining IoT technologies with behavior intervention techniques to enhance energy savings. The study was able to track individual occupants’ energy-use actions to identify inefficient behaviors, and to drive energy-saving behaviors. Boje et al. [29] investigated the integration between building information modeling (BIM) and digital twin (DT) concepts to revolutionize the construction industry. The study also stated that the cyber-security of large-scale infrastructure concerns will remain an issue for years to come. Asif et al. [30] utilized system dynamics tools to report the indoor CO2, temperature, and relative humidity levels within naturally ventilated classrooms, and the records of ventilation rates were presented. The study concluded that the CO2 levels remain almost the same when comparing between summer and winter seasons. Lei et al. [31] investigated the use of different neural networks to evaluate the air quality within shopping malls, and compared the results between the fuzzy neural network and Elman neural network to test the use of a wavelet neural network. The study proved that the wavelet network is optimized by the use of a rough set to reduce the redundant attributes, and can accurately evaluate buildings’ IAQ.
Zhou et al. [32] proposed a multi-output neural network to improve air quality forecasts. The model depended on multiple input sources from different monitoring stations. The factors measured included PM2.5, PM10, and NO compounds. The model used long short-term memory (LSTM) in the network architecture for adding memory capabilities to the network. The network proved effective in recognizing complex air quality patterns compared to shallow networks. Khazaei et al. [33] presented a network to predict carbon dioxide (CO2) concentrations for indoor air based on room parameters. The results showed that CO2 can be accurately estimated based on temperature and humidity measurements; thus, a strong relationship exists between these air quality parameters. The study indicated that such results can improve ventilation studies and the control of indoor environments. For further studies, it was suggested that more rooms should be monitored to collect more data and to study other air parameters, as these may affect CO2 concentrations. Johnston et al. [34] also applied a system that is able to measure fine particles. The system is considered a low-cost option, since it costs less than USD 100. Although the developed system showed accurate results, its lack of mobility, due to the need for a continuous power supply, is considered a major limitation for scalability.
Previous research efforts have either concentrated on the IoT solutions without performing a reading analysis, or focused on the IAQ processing and prediction models, which are based on previously collected data, without considering either real-time readings or outdoor environment effects on the indoor environment. Any applied solution for assessing IAQ needs to provide the continuous monitoring of critical parameters with easy access to the collected historical data. IoT technologies are a promising method for collecting environmental measurements, but in order to develop a full comprehension, advanced modeling is required. The literature presented different modeling techniques for predicting IAQ, but frequently failed to include outdoor variables within their inputs.
3. Air Quality Parameters
The following sub-sections identify the main parameters that are essential to evaluate the IAQ. Thermal comfort, including temperature and relative humidity, varies based on occupants’ preferences. Air pressure is a main component in order to control the indoor environment. Carbon dioxide concentrations indicate the air circulation rate within confined spaces. Carbon monoxide is a toxic gas that causes poisoning. Fine air particles can accumulate in the human lungs, causing different respiratory diseases. Finally, the relationship between the outdoor and indoor environment is a crucial factor for controlling internal spaces.
3.1. Thermal Comfort
According to the American Society of Heating, Refrigerating and Air-Conditioning Engineers (ASHRAE Standard 55-2017 [35]), thermal comfort is an expression of satisfaction with the surrounding thermal environment, and that satisfaction is evaluated subjectively according to the human condition of mind. Thermal comfort is greatly affected by clothes, air temperature, relative humidity, and air speed. In addition, the occupant’s expectation is considered an important psychological factor. In buildings, improvement in indoor air quality greatly increases productivity and contributes towards the provision of a healthy environment [36]. Thus, keeping the surrounding environment within an acceptable range of temperature and relative humidity is one of the objectives to control IAQ.
3.2. Air Pressure
Air pressure is the weight of air molecules that press on objects. Temperature and wind have a significant influence on building pressure. All controlling systems and mechanisms installed in buildings to provide thermal comfort either result in high pressure in buildings or low pressure. A slightly higher pressure will keep hot air outside of the building during summer, and in winter, low pressure will allow outside air inside, which will stabilize the humidity. Controlling air pressure inside the building is key to a comfortable indoor environment.
3.3. Carbon Dioxide
Carbon dioxide (CO2) is a gas with no color that consists of one carbon and two oxygen atoms. The gas results from aerobic organisms as they metabolize carbohydrates and lipids. Other sources of the gas include volcanoes and hot springs. It is the main component of the surrounding air and is essential to all forms of life. It is also a versatile gas that can be used for different industrial purposes. Since the industrial revolution, the concentration of CO2 has been increasing rapidly, leading to global warming and the acidification of oceans and seas. According to the National Oceanic and Atmospheric Administration [37], the concentration of CO2 gas reached 417 ppm in 2019. The growth rate in 2019 was 2.2 ppm, which is highest rate for the last 10 years.
3.4. Carbon Monoxide
Carbon Monoxide (CO) consists of on carbon atom bonded with one oxygen atom. It is a colorless and odorless gas. The gas is known for its toxicity to all beings that depend on hemoglobin to carry oxygen through the blood stream. CO is generated from the partial oxidation of carbon compounds. During the burning process, the carbon compounds are decomposed to CO2, but the lack of oxygen during the burning process leads to the formation of CO gas. According to Omaye [38], fatal air poisoning in many countries is mainly caused by CO poisoning.
3.5. Fine Particles
According to the United States Environmental Protection Agency [39], fine particles (also known as particulate matter) are a mixture of tiny solid and liquid particles that exists in the air. Particles such as dust may be seen by normal eyes, but other particles may need a microscope to be seen. Both the size and shape of the particles vary greatly. Particles are emitted directly from fires, unpaved roads, and construction activities. Other sources of particulate matter (PM) include chemical reactions in the atmosphere and industry emissions. The most common PM types are PM10 and PM2.5, which are classified based on the diameter of the particle, being either greater than 10 micrometers or 2.5 micrometers. The classification is important, since particles less than 2.5 micrometers can easily accumulate in the lungs and enter the blood stream.
3.6. Relationship between Indoor and Outdoor Air Quality
The relationship between indoor and outdoor air quality is represented in the literature either as a model or a conducted experiment. The modeling approach often depends on computer simulation or attempting to develop a comprehensive relationship starting from basic mathematical equations. On the other hand, the experimental approach typically requires sampling using advanced instruments and a controlled environment in order to acquire accurate results. Software is available to simulate the relationship between the indoor and outdoor environments to predict pollutant concentrations in small spaces, but it is also able to simulate the air flow and provide pollutant predictions for entire buildings or complex projects. Such a methodology provides guidelines for designers to integrate the results with designs and to improve HVAC performance. The disadvantage of modeling is that during the facility operation, the simulation might not be that useful for controlling the indoor environment, and there will be a need for further experiments to account for the actual activities of the occupants and changes to the outdoor environment. Thus, in order to control the IAQ, there is a need to link the sampling and software simulation to better improve decision making.
4. Research Method
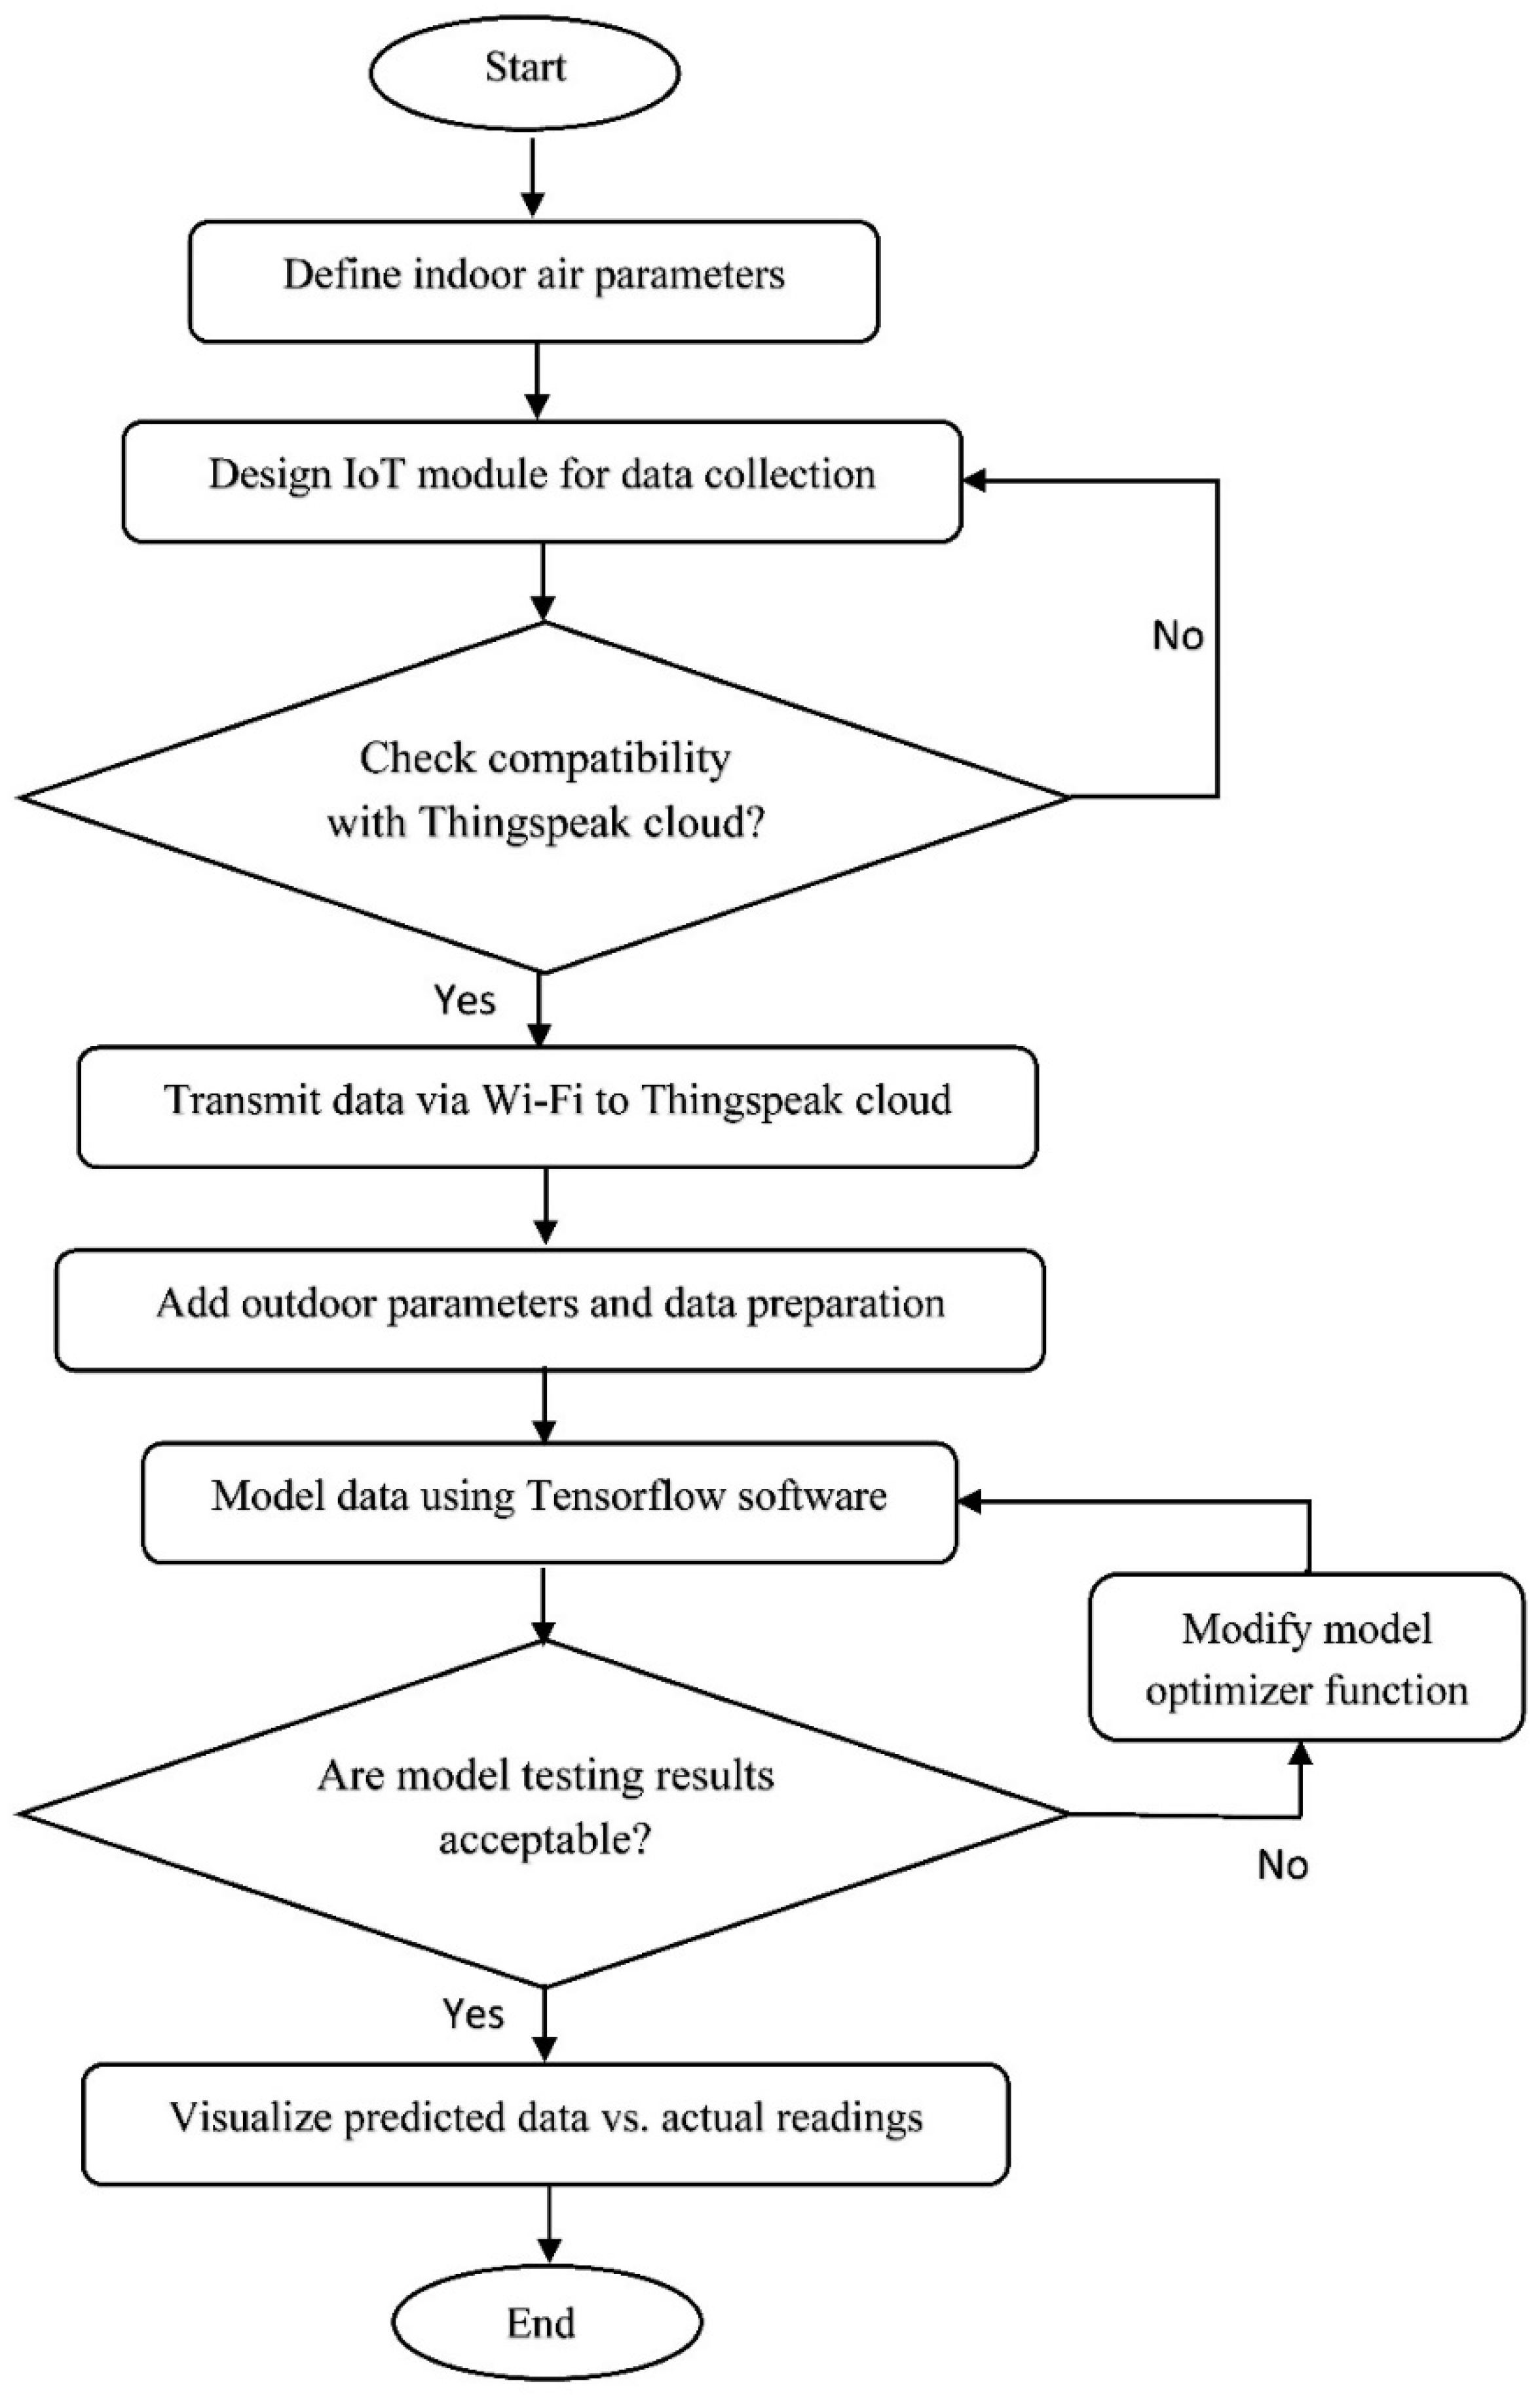
The proposed system activities for evaluating IAQ in academic buildings are depicted in Figure 1. These tasks can be grouped into four main phases, including developing the IoT module (Phase 1), which consists of microcontrollers connected with sensors; then, the data are transferred (Phase 2) via Wi-Fi to a designated cloud to be accumulated for deep-learning model application (Phase 3) to enhance the prediction and visualization of IAQ (Phase 4) analysis.
4.1. IoT Module
Internet of Things (IoT) technologies are rapidly developing and provide huge possibilities in terms of satisfying our changing needs. IoT applications are being integrated into all aspects of our life, from Smart Cities to controlling small equipment in factories. The technology facilitates the collection and analysis of huge amounts of data and supports the decision maker with real-time information to maximize the output results. IoT technology includes the following five steps:
- ▪
- Data ingestion: IoT devices collect data from different environments.
- ▪
- Data transmission: the collected data are then transmitted to a cloud via an internet service.
- ▪
- Data processing: once the data are collected and transmitted, the IoT platform contains different algorithms to analyze the data.
- ▪
- Data visualization: the information that results from processing is then provided to the end user in an interface or as an alert via text messages or emails.
- ▪
- Data prediction: over time, the accumulated data can be used to provide trends and to introduce predictions.
An IoT application typically consists of microcontrollers attached to sensors, which collect different readings from the surrounding environment and send them to an IoT platform via an internet service. Monitoring air parameters has been a goal for IoT developers. The measurement and evaluation of air conditions were being investigated a long time ago, but with the innovation of IoT technology, providing real-time information is possible and responses to events have become faster than ever.
Thingspeak [40] is an open-source IoT platform established in 2010 that aims to revolutionize IoT applications by providing cloud services to improve applications’ scalability. Thingspeak is divided into channels, where each channel contains eight fields that collect data from sensors and present real-time data visualization. There are some key capabilities that make Thingspeak unique among other common IoT platforms. The following are some of Thingspeak’s characteristics, which enable IoT designers to:
- Easily set up devices to directly connect to the cloud services.
- Present collected sensor data in different charts according to each field.
- Use the powerful features of MATLAB to deeply analyze the sensor data.
- Schedule specific analytics to run based on certain events.
- Prototype IoT applications without the need for any web or server programming.
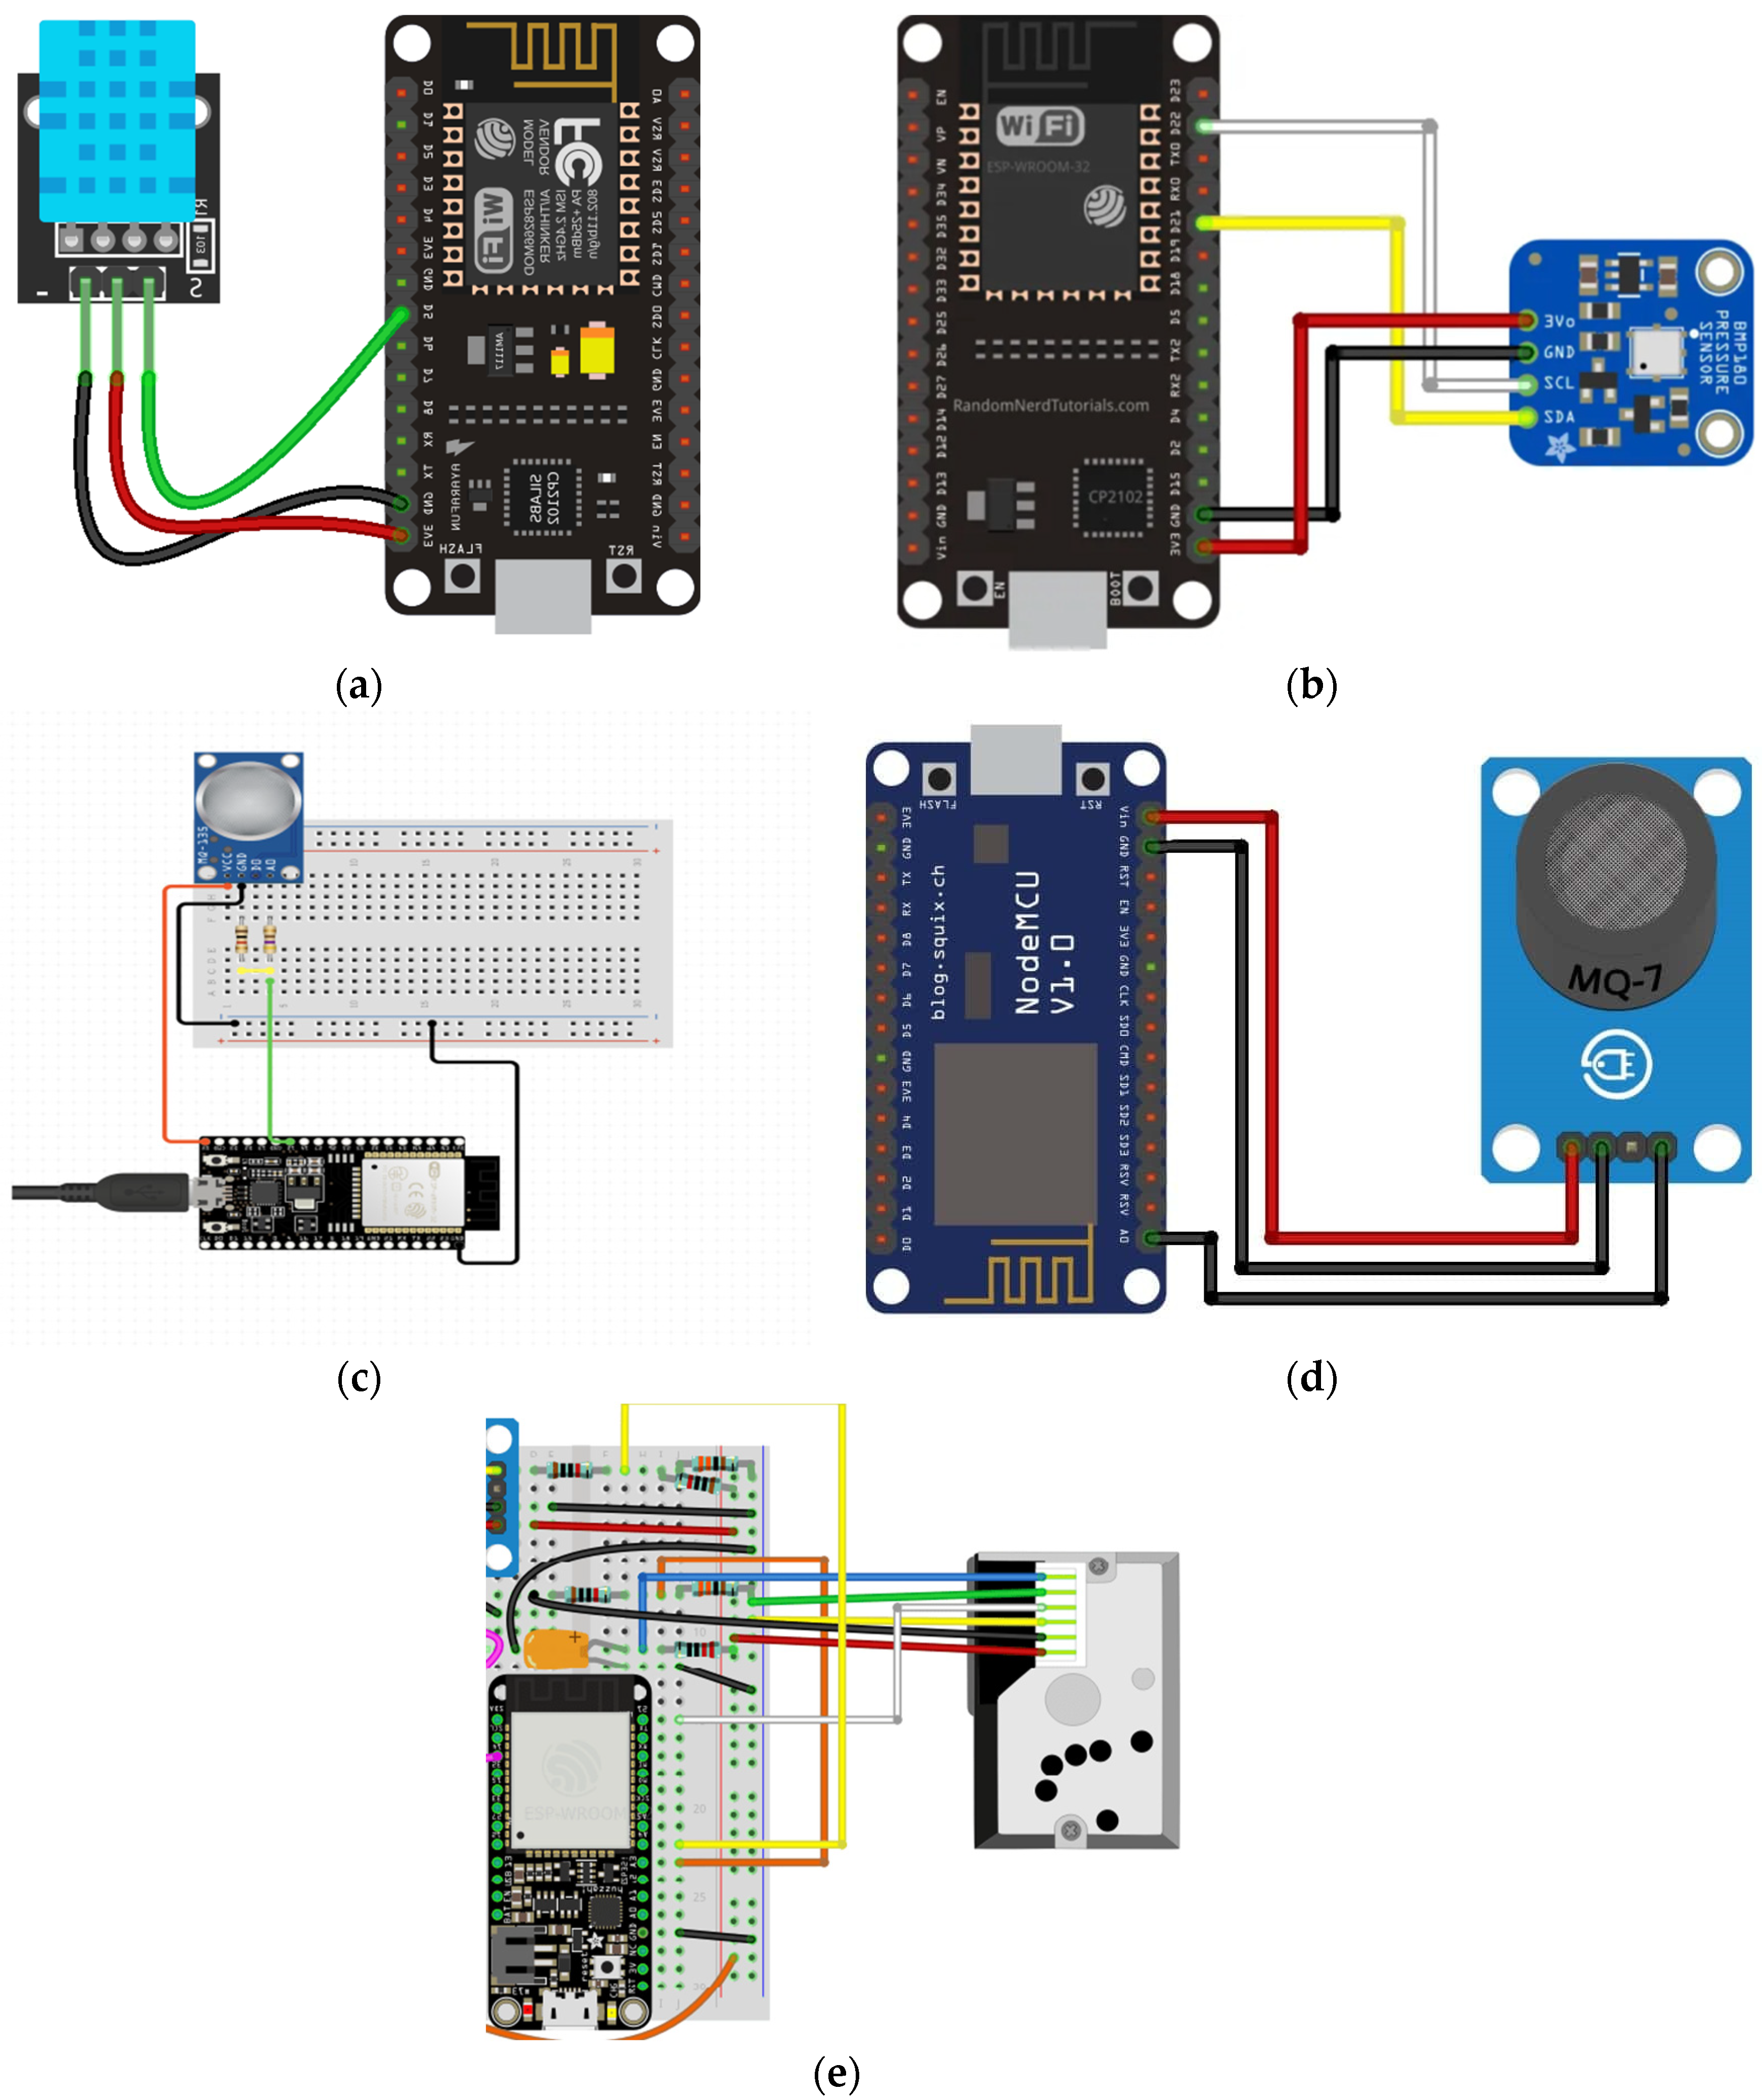
Table 1 lists the components and their respective designated functions of the proposed IoT application. Figure 2 illustrates sensors connection with ESP32 Microcontroller.
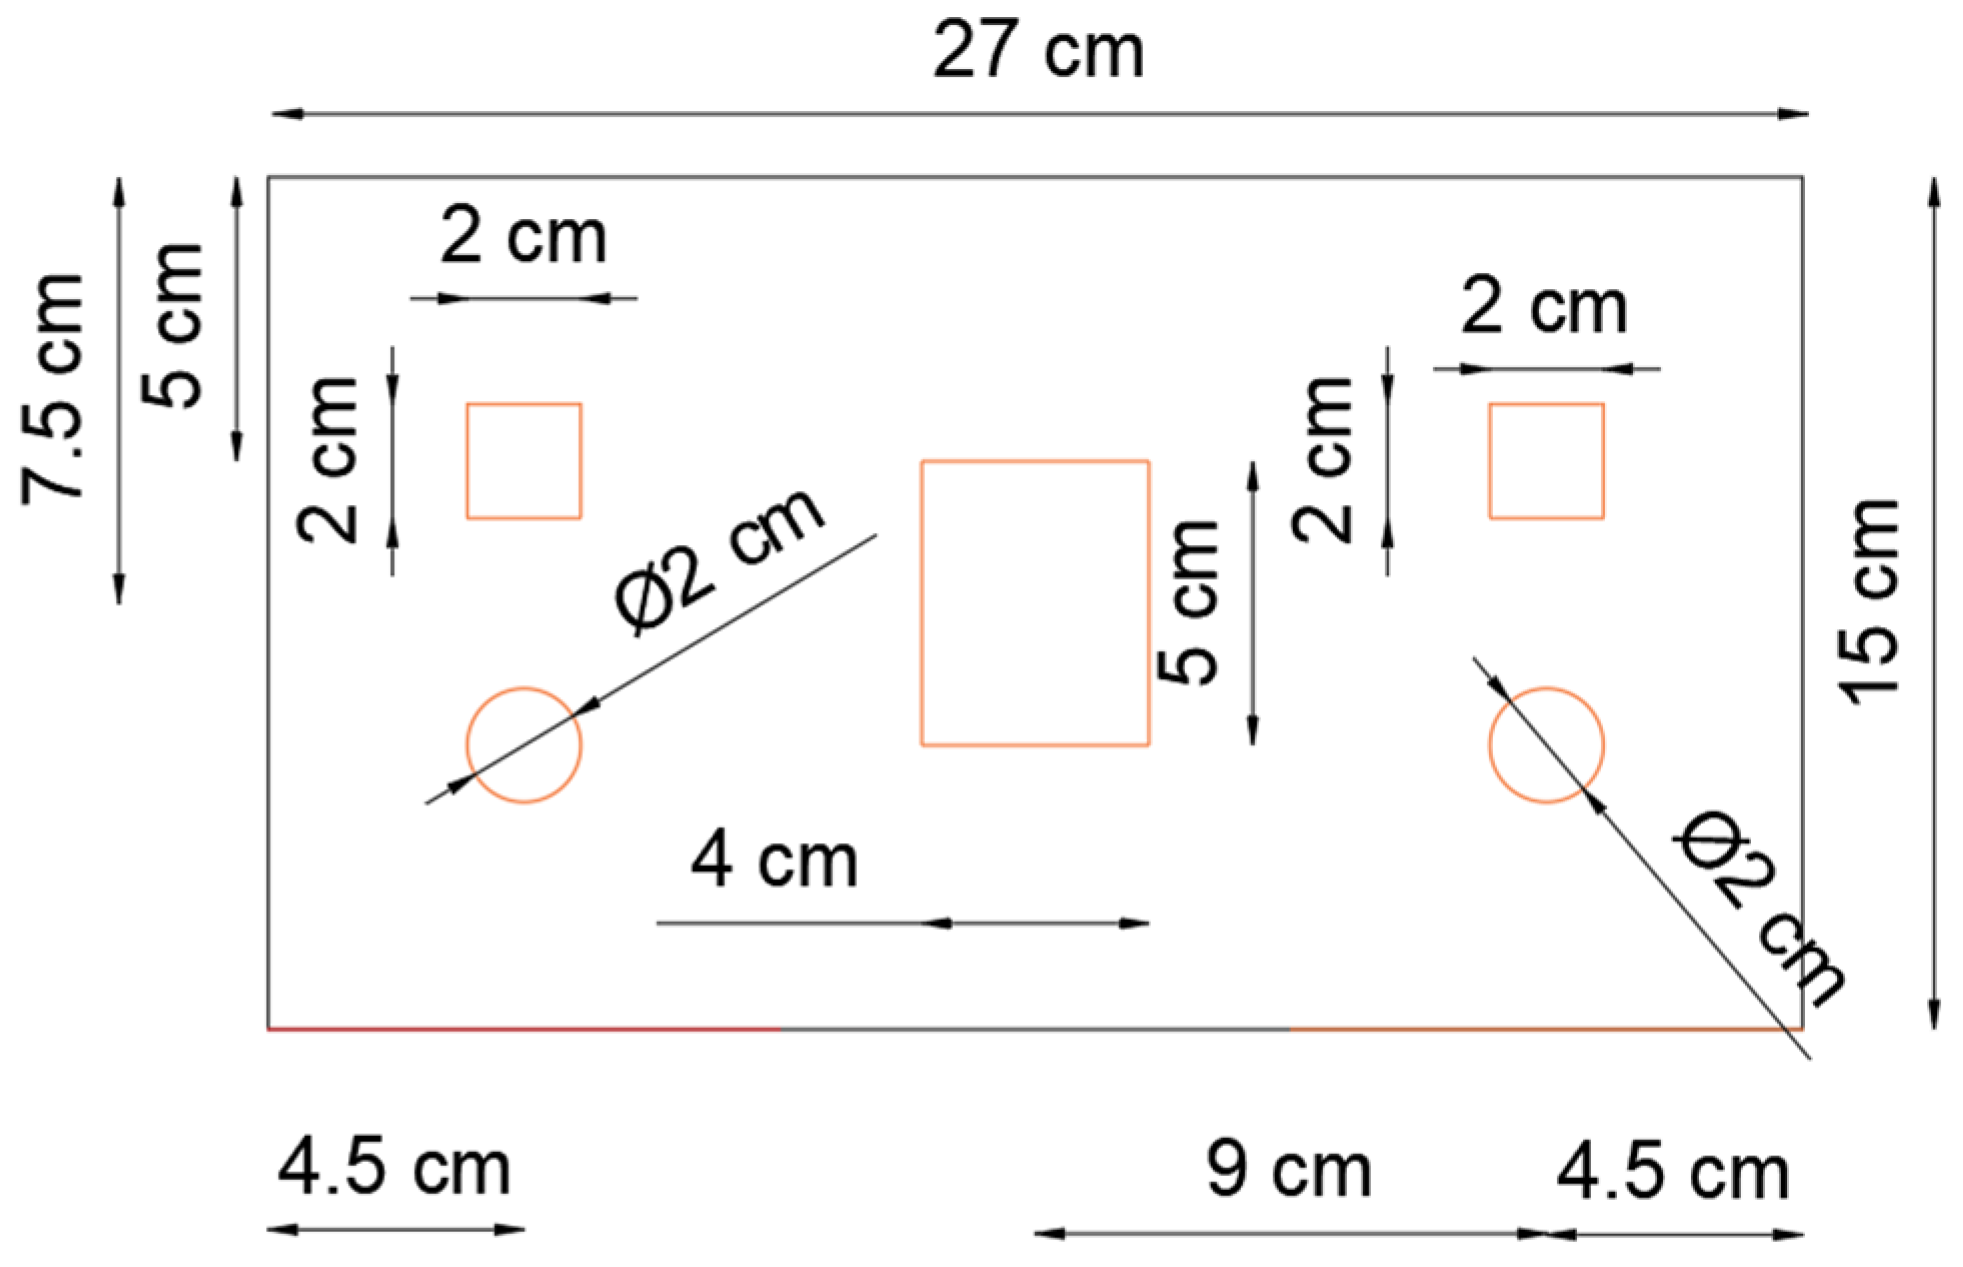
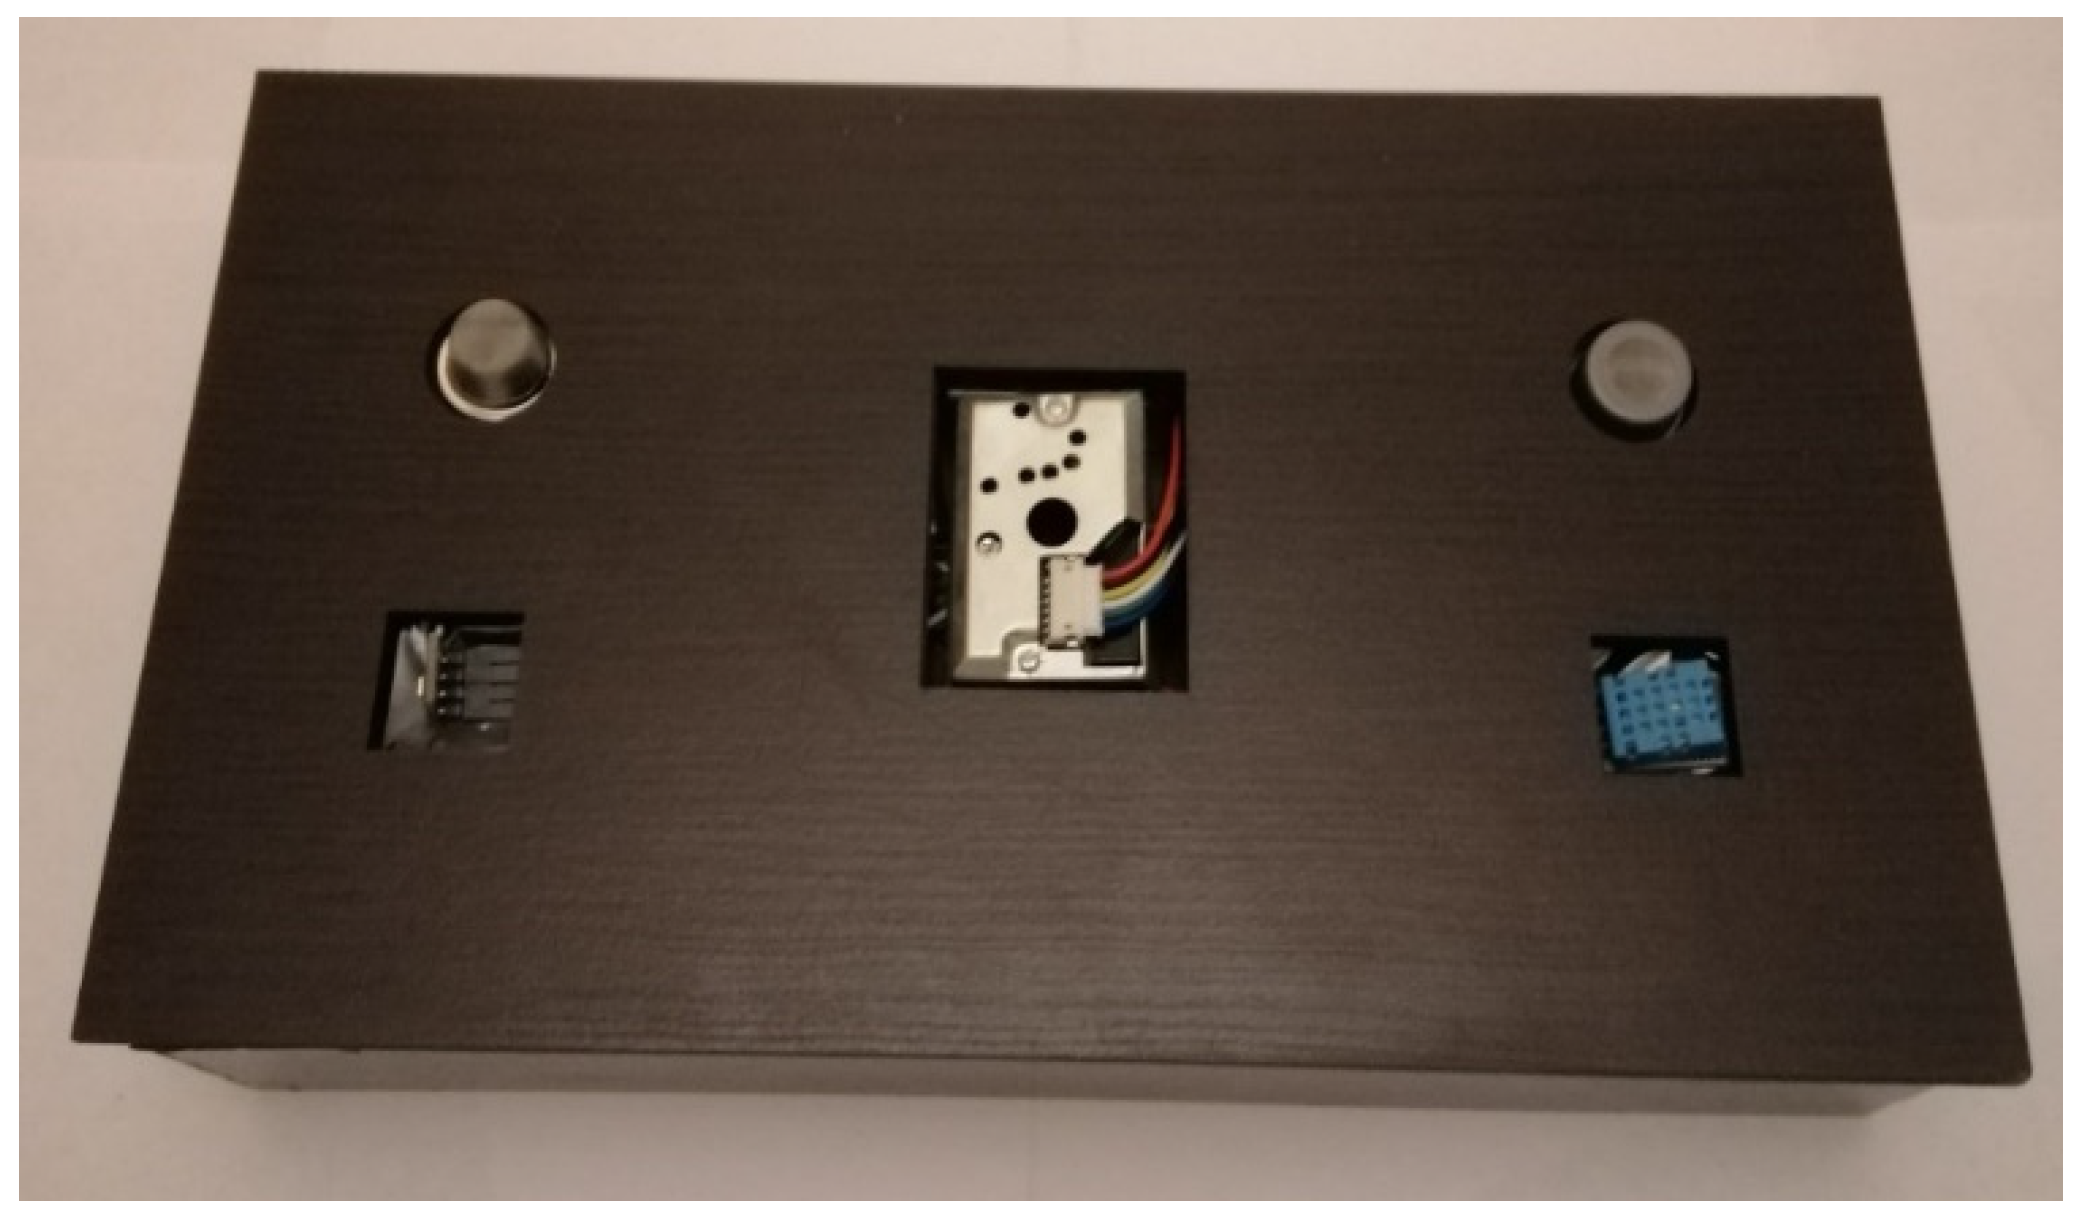
A wooden box of size 27 cm × 15 cm was designed and created to contain all of the sensors and microcontrollers to create an air-quality monitoring device, as depicted in Figure 3. An IoT box was provided with a moving mechanism at the bottom to allow the sensors, microcontrollers, and batteries to fit in easily as clearly shown in Figure 4. After the box was assembled, tests were performed to make sure that the sensors were sending readings to their specific channel on the Thingspeak platform.
4.2. Data Transmission
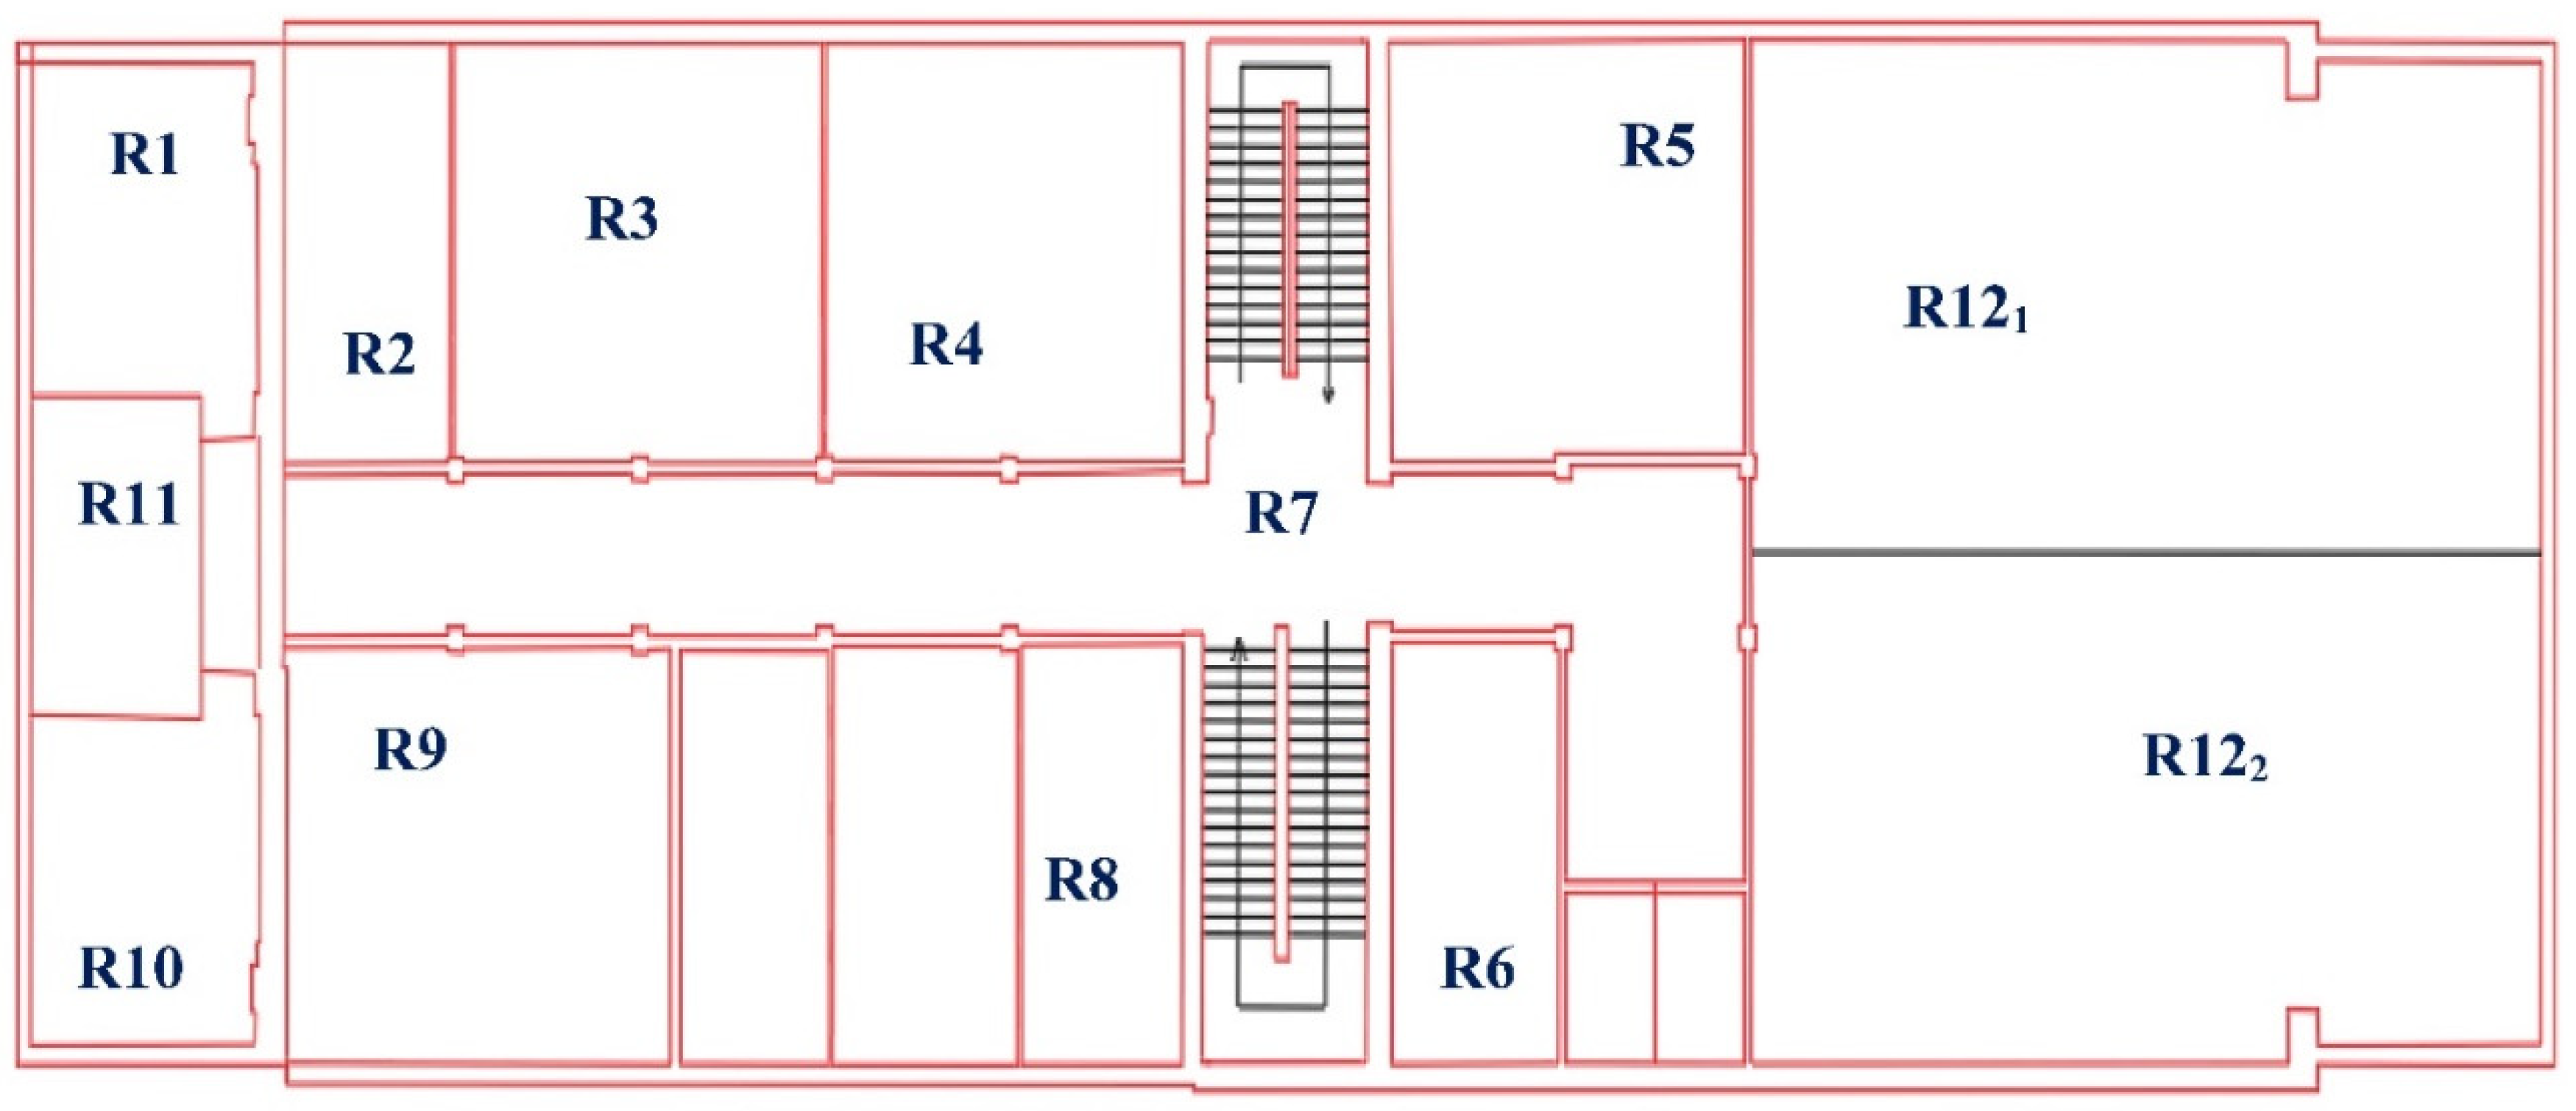
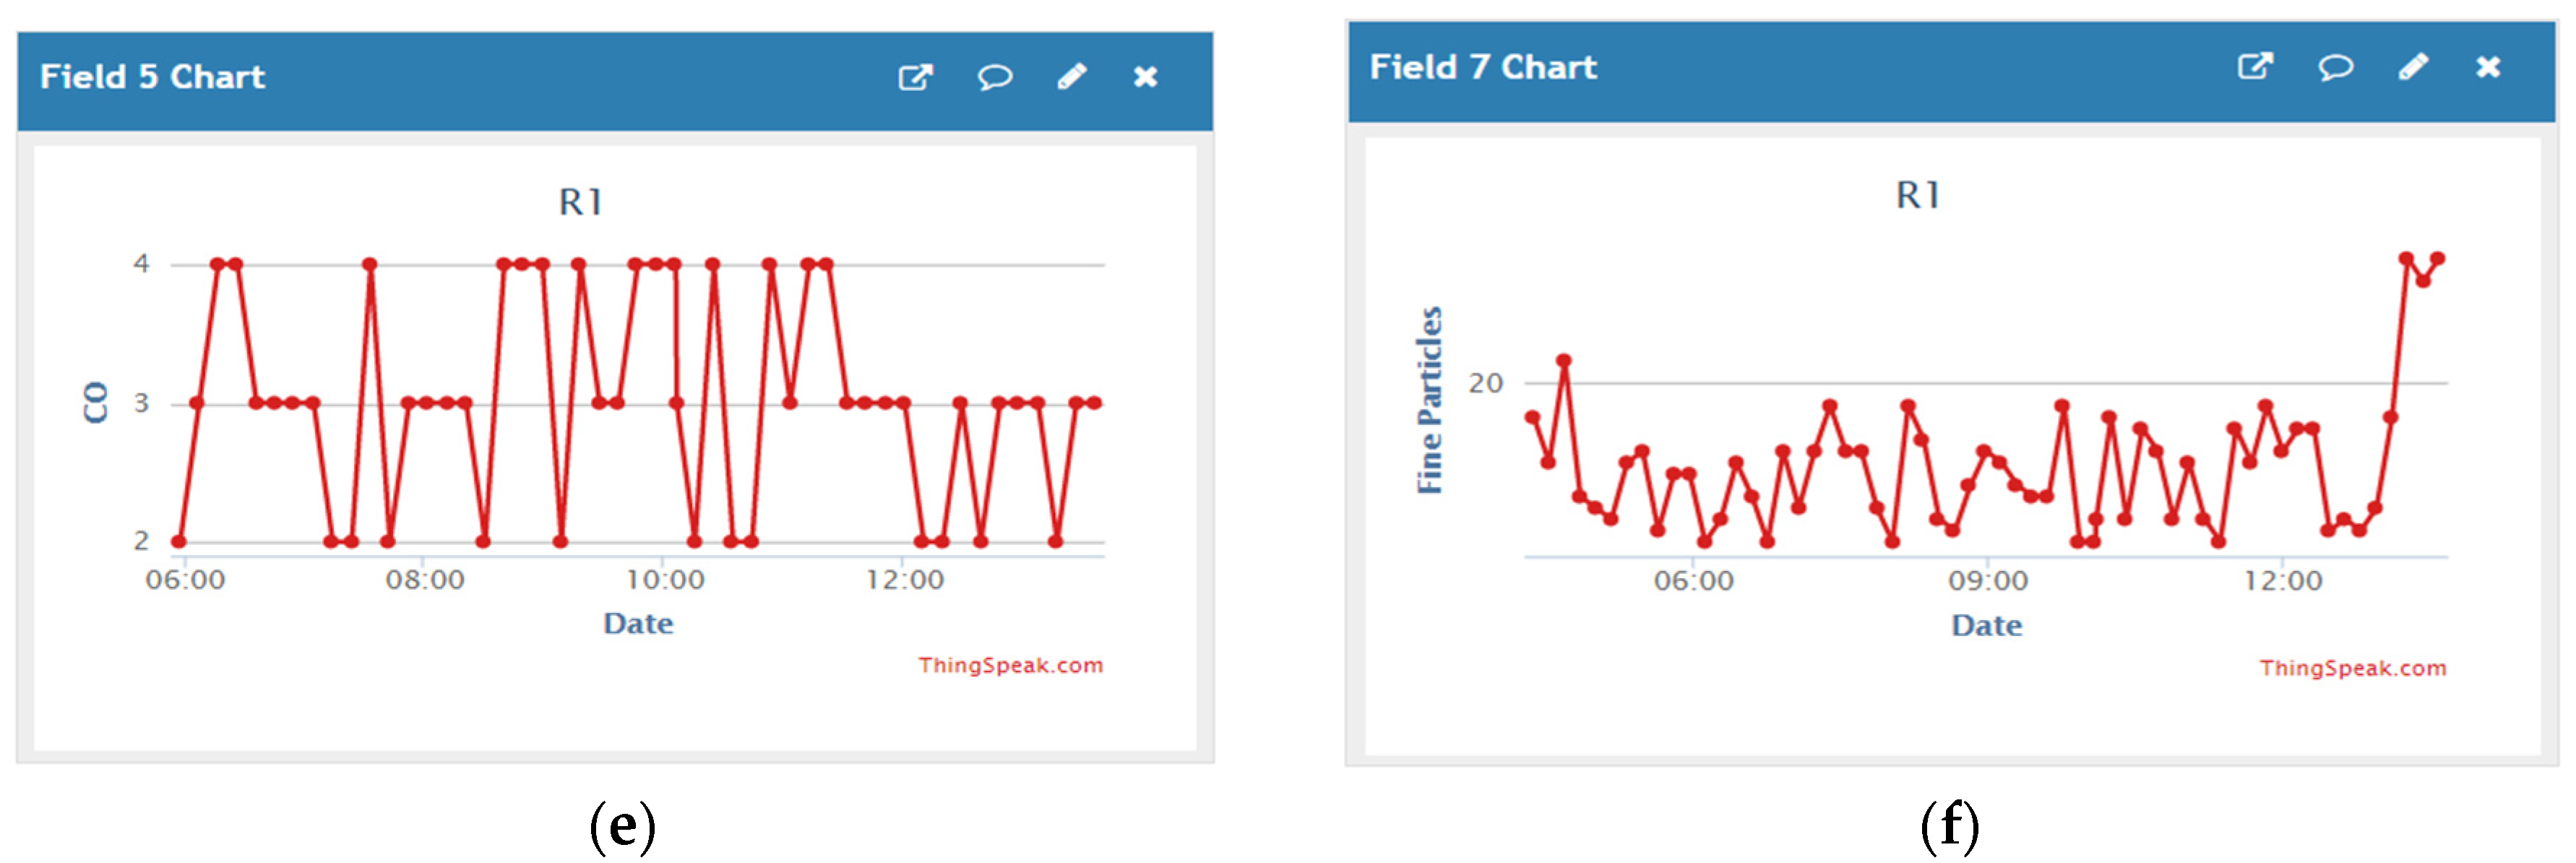
For data transmission, the floor of a university building was chosen to conduct the experiment in different rooms for several days. Figure 5 shows the floor plan and dimensions. For every room, a code was given (for example R1), and a channel was created on the Thingspeak platform. Multiple IoT boxes were assembled so that every room had a box to effectively monitor the IAQ, and all sensors were put at a reasonable height (as close to the middle as possible) and not close to walls and windows. The microcontrollers were programmed to send a reading every 10 min. Each reading contained measurements for temperature, humidity, air pressure, CO2, CO, and PM. All boxes sent their data via Wi-Fi and the Thingspeak channels were tested to receive the readings. The measurements were collected from all rooms and uploaded to the Thingspeak platform during July and August 2019. Figure 6 shows the monitoring of the collected readings on Thingspeak for the case study.
After collecting readings for 9 days, from 1:00 PM on the 29 July to 1:00 PM on the 7 August, the number of readings totaled 16,764 for 13 different spaces. Many readings were lost due to Wi-Fi instability and the checking of the connectivity of the devices from time to time. Table 2 illustrates the average reading for each day for the whole floor. It can be noticed that the average of the readings varies for temperature and humidity on a daily basis, but for other variables, the readings show steady averages for the floor.
Table 3 provides more details for each of the studied academic building rooms, and it can be noticed that the space with the code R7 is the hottest in terms of temperature with an average of 31.7 °C, while R2 is considered the coldest. The average CO2 concentration in room R2 was 475.3 ppm, and since the average in this is the highest, it can be concluded that R2 is the worst in terms of ventilation. R3 contained the least number of fine particles and this was not expected, as R9 is not used on a regular basis and it was expected to have the lowest concentration. The maximum CO reading was 5 ppm, and this was detected in R1, R4, R7, R121, and R122. In general, the rooms show acceptable readings for CO and particulate matter, and varied for CO2 according to the ventilation mechanism for each room. The relationship between temperature and humidity can be observed in both R8 and R11, which have one of the lowest temperature averages and the highest average humidity. To extract more information about the rooms, further analysis is needed to develop a comprehensive conclusion about the IAQ.
4.3. Deep-Learning Module
After successfully utilizing the IoT for collecting IAQ measurements, raw data were downloaded from the cloud to be labeled and prepared for modeling. In order to fully understand the indoor environment, outdoor air parameters must be considered; thus, outdoor measurements were added. The Meteoblue [46] database was utilized in this study for collecting outdoor environment historical data. Multiple columns were added, including outdoor temperature, outdoor humidity, outdoor wind velocity, and outdoor wind direction. It can be noticed from Table 4 that CO and dust were excluded from the readings, as their concentrations depend on the occupants’ behavior, which is not considered in this study. The table provides a sample of the readings collected from 29 July to 7 Aug. The total number of readings is 16,764 records. The model inputs include all outdoor variables and the indoor pressure due to the physical relationship between temperature and pressure. The outputs that the model predicts are indoor temperature, humidity, and CO2 for the 13 different rooms considered in the case study. To facilitate the training process, the outdoor wind direction from Meteoblue was selected to be in degrees rather than text directions (N, E, S, and W) to provide maximum accuracy and the fastest training performance. Moreover, blank readings or missing variables were excluded so that all collected readings contained all variables. Once all of the data were ready, they were saved as Excel sheet files to be imported later to TensorFlow.
5. Results Visualization
The Anaconda software interface is an open-source platform for data scientists that provides different libraries and various applications to model and analyze data. The platform supports programming languages including Python and R to facilitate different statistical operations. In this study, the TensorFlow library and Jupyter Notebook web application were loaded through the Anaconda platform to provide essential machine learning functions and to facilitate sharing codes and visualizing the simulation results.
The following libraries and functions were used during the modeling process:
- The pandas library provides operations to manipulate data within tables and to import the numerical readings into Excel or csv formats.
- NumPy contains high-level mathematical operations, which are essential before loading TensorFlow.
- Sklearn provides statistical operations and is used to provide data normalization functions.
- Matplotlib is imported to visualize data and modeling results in various graph presentations and comparisons.
- MinMaxScaler is used for data normalization.
- TensorFlow is imported to start the modeling process.
- The Keras library, which operates within the TensorFlow system, is imported for quick modeling, allowing multiple architectures to be tested for better results.
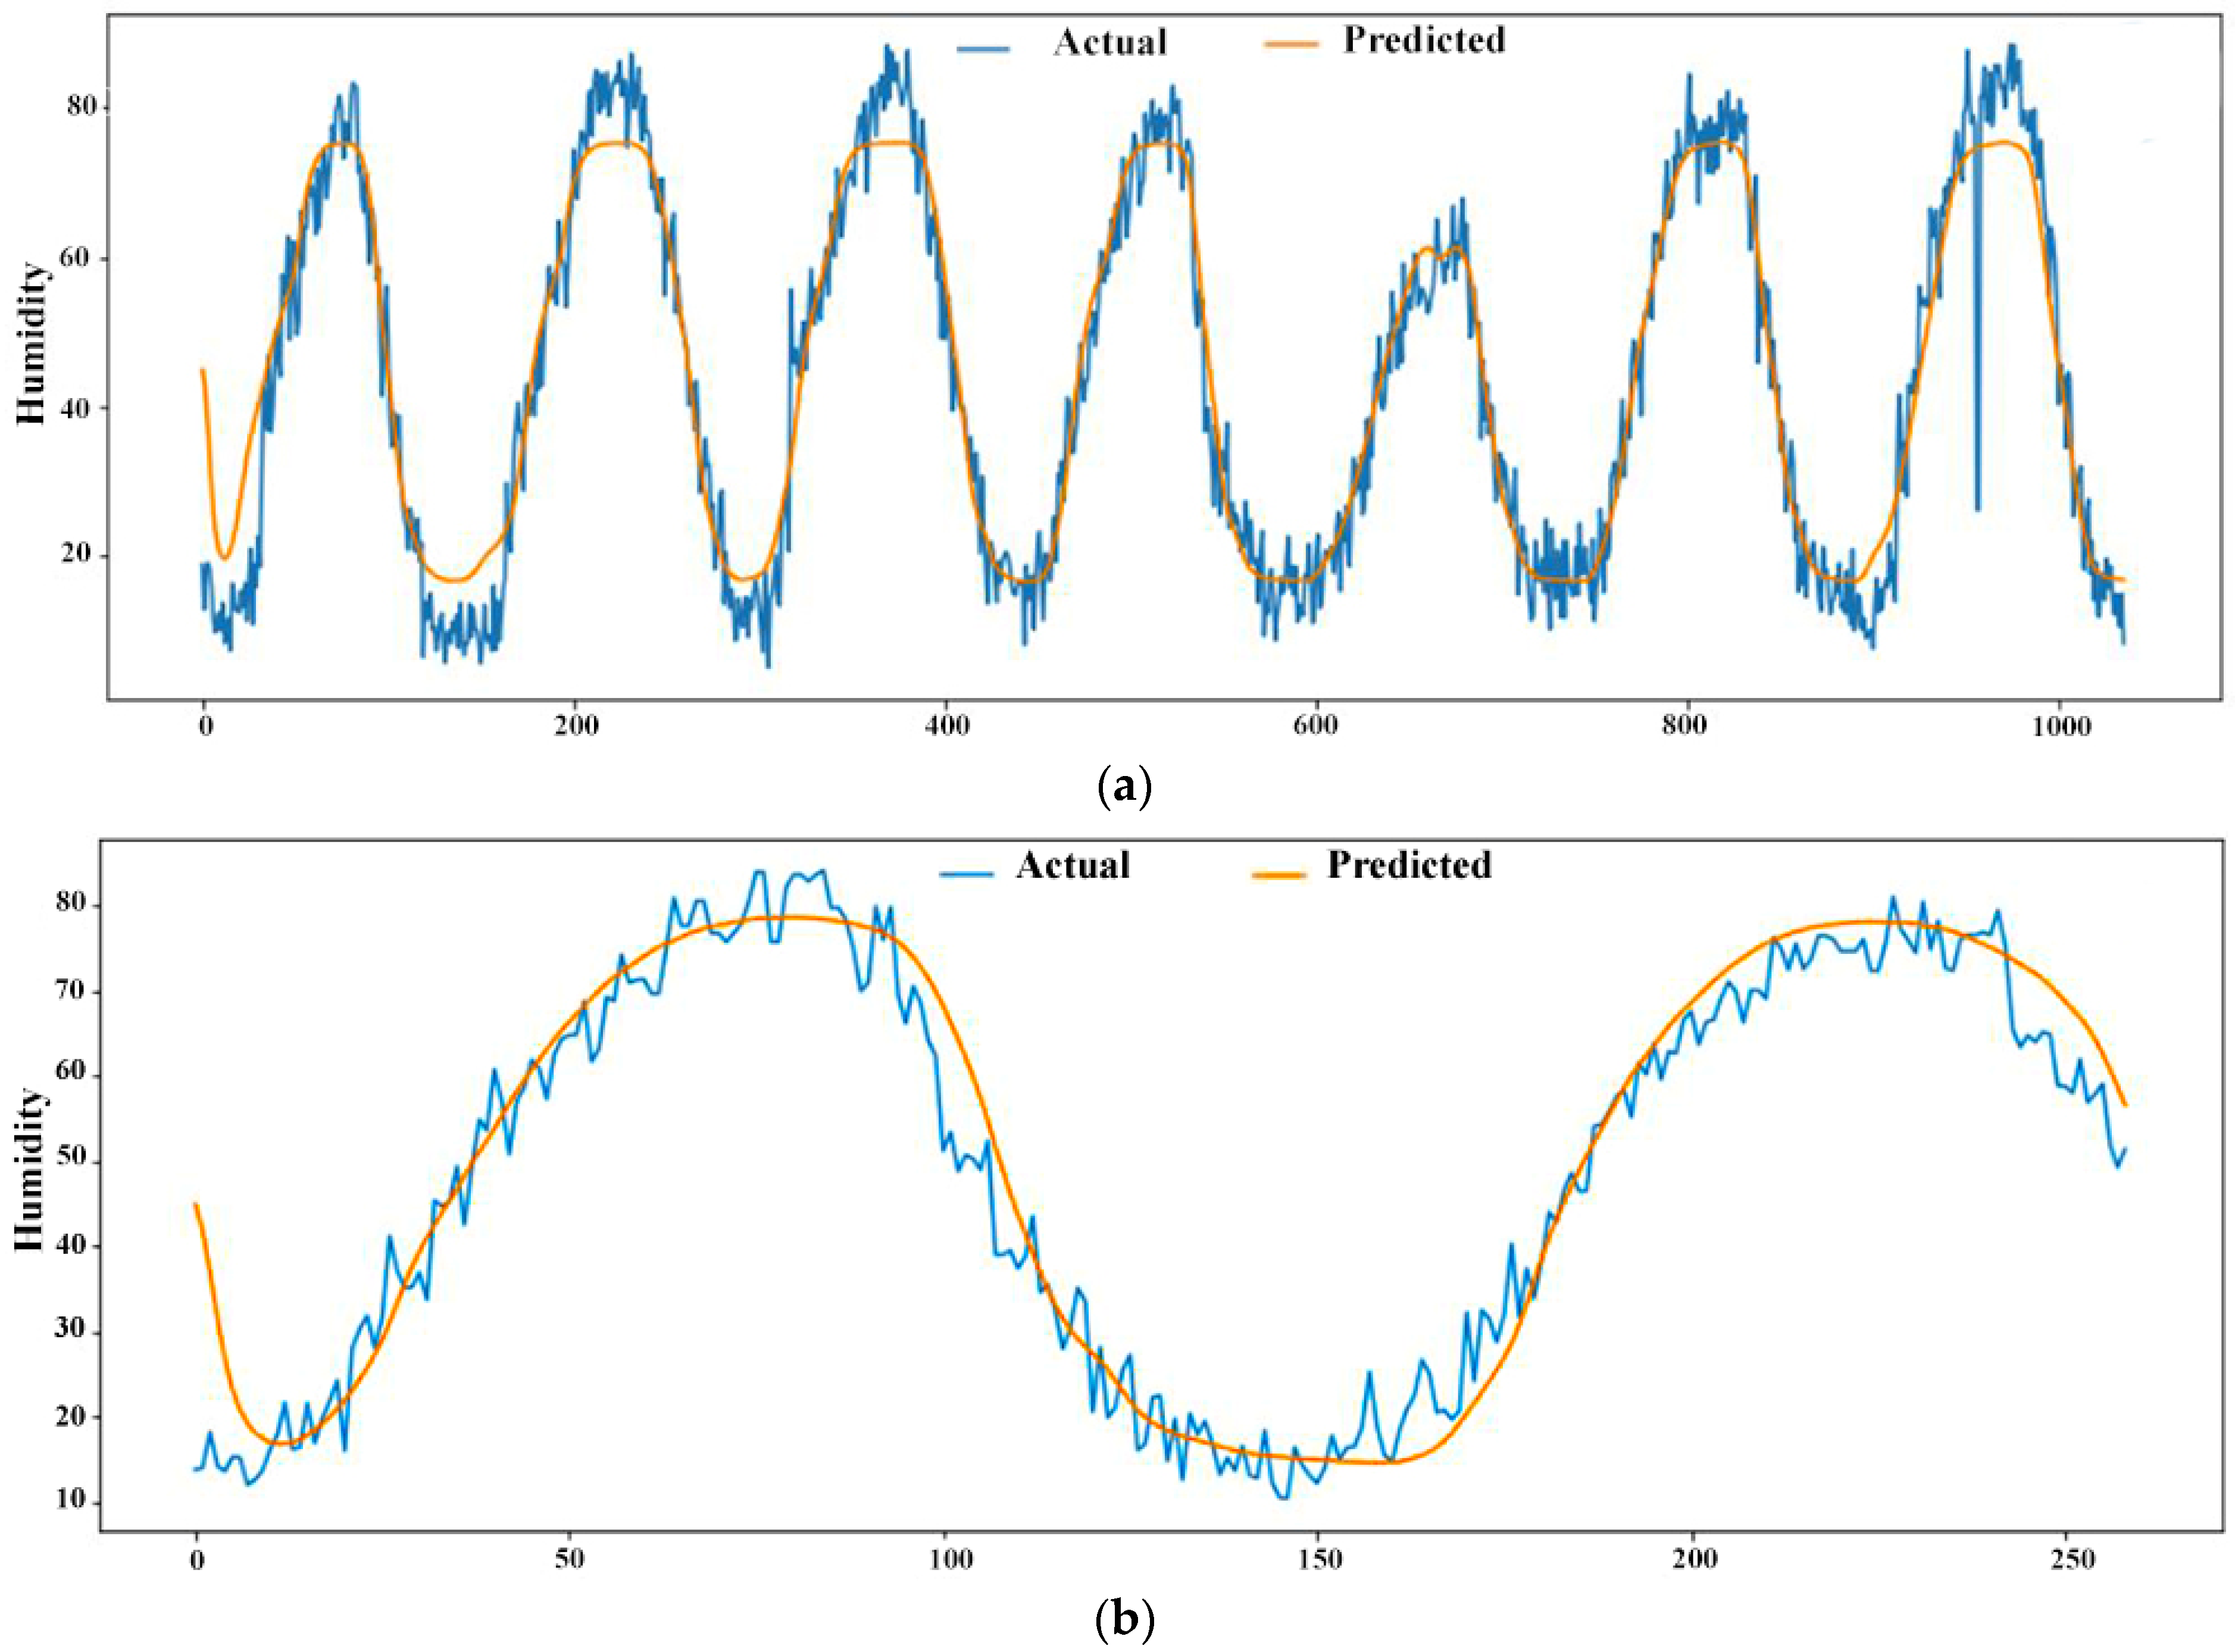
After conducting trials with multiple proportions, the percentages of the data used for training and testing were 80% and 20%, respectively. A validation set was used to independently check the performance of the ANN weights obtained in the training process. This was conducted to ensure that the ANN model had not simply overfitted or memorized the relationship between the training data and the output, but actually developed the capability to make a prediction for an unseen set of data. Figure 7 depicts the predicted (orange line) results against actual (blue line) humidity data of room R7 for the training and testing data, respectively.
6. System Validation
The validation of this research is based on experimental data obtained from the case study, which was previously conducted using IoT technology. It should be noted that despite the model effectiveness in providing acceptable predictions, the model capabilities are limited, as it was developed based on readings collected within a relatively short period of time and during the summer season in different spaces for the same building due to the lack of any formal datasets regarding IAQ in Egypt. In order to enhance the model’s predictions and to expand its capabilities, readings should be collected over a long period to cover different seasons and to apply the model to multiple buildings with different uses.
Table 5 lists the model results when applied to different rooms. It can be noted that, in general, the training accuracy is higher than both the validation and testing. In addition, the rooms R1, R3, and R4, which are on the eastern side of the building, provided higher accuracy. However, R2 was exceptional as the use of air conditioning affected the readings and disrupted the relationship between the data, resulting in 80.94%, which is the lowest model accuracy for the testing dataset. In general, the testing accuracy was less than the validation accuracy, but it was noted that rooms R4, R8, and R122 provided higher accuracy for testing comparing to the validation datasets. The rooms that provided the lowest test accuracy were R2, R5, R10, R11, R121, and R122. Despite R121 and R122 being within the same space (Lecture Hall), the results’ accuracy varied, indicating that wide spaces should be divided into smaller areas and that more sensors should be provided to cover the entire area. The average accuracy for training, validation, and testing was 91.07, 87.28, and 85.95, respectively, for the entire floor, but as the model reacted differently for each room, it is important to emphasize the need to study rooms separately when evaluating IAQ in buildings.
7. Results and Discussion
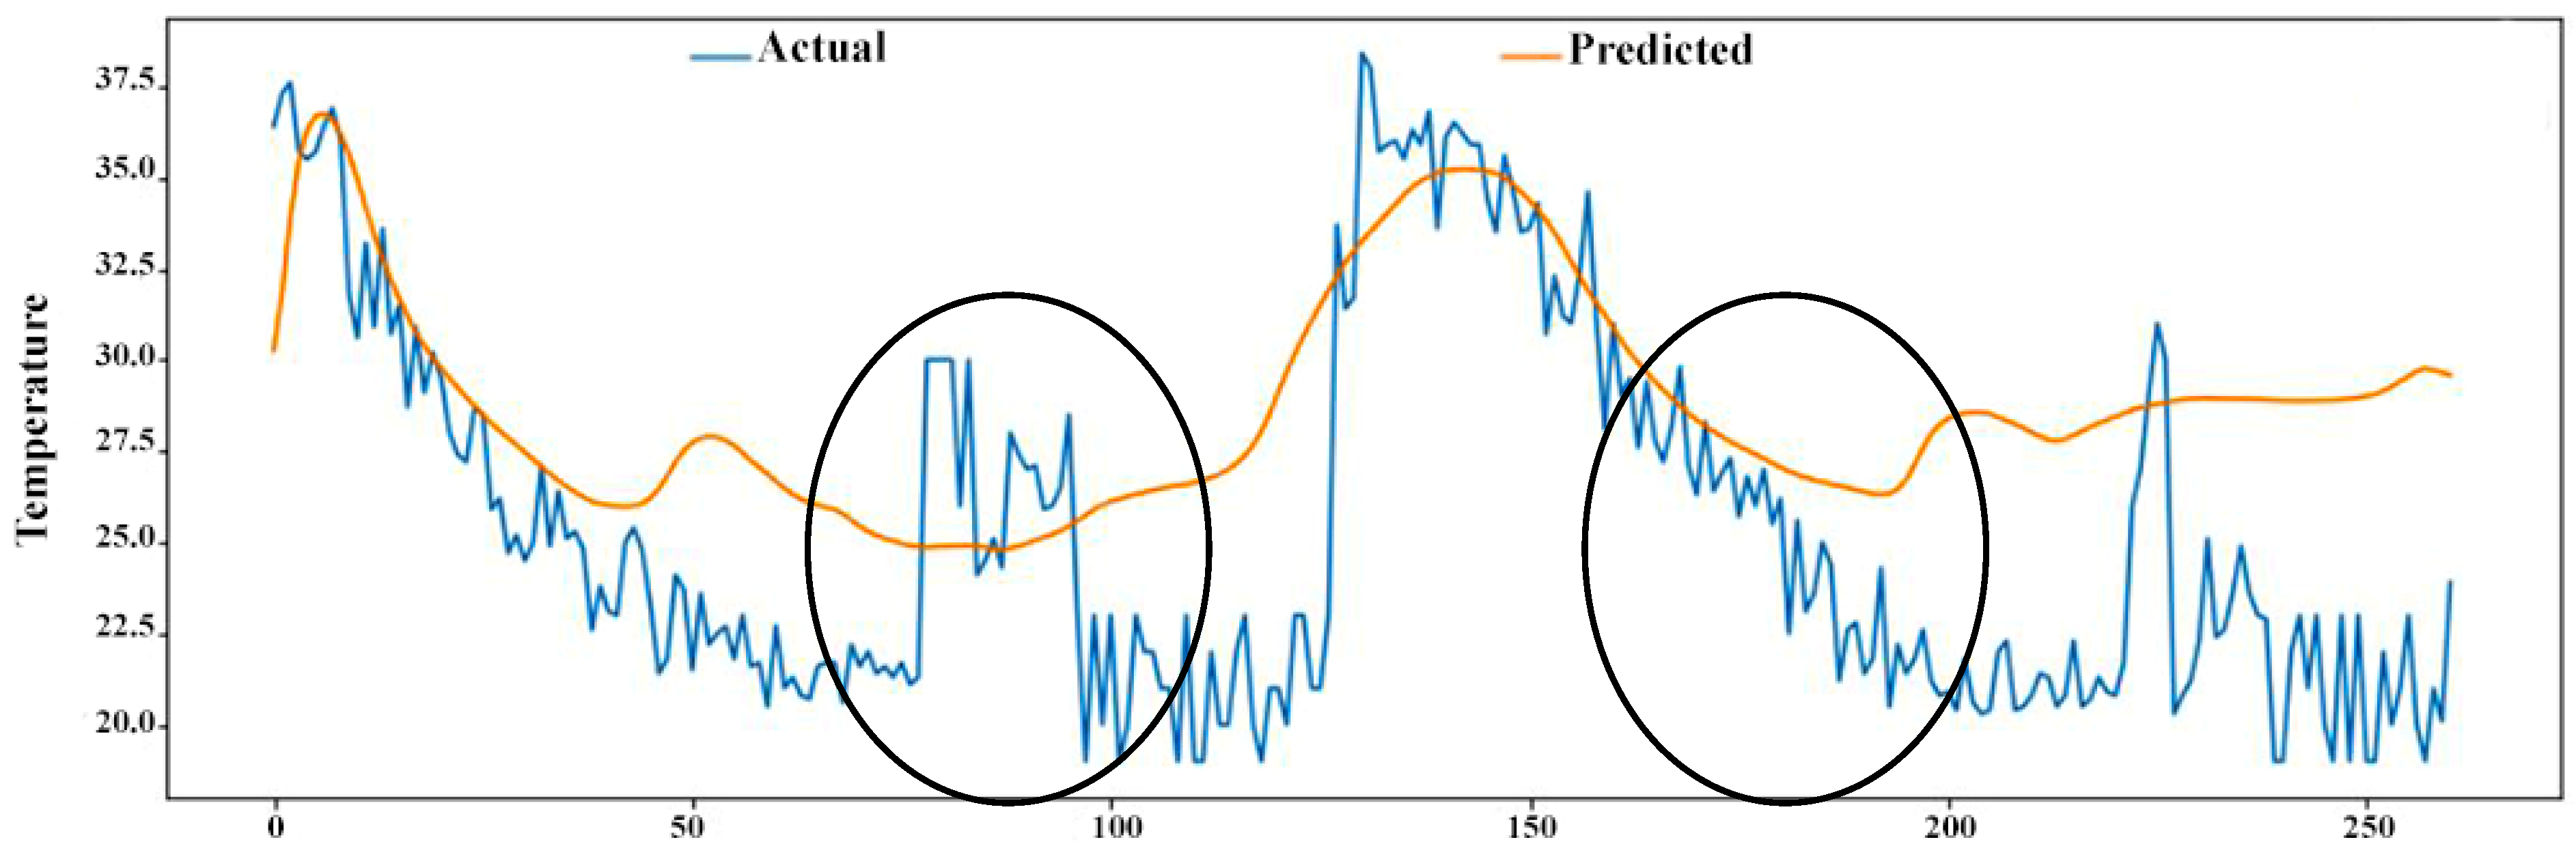
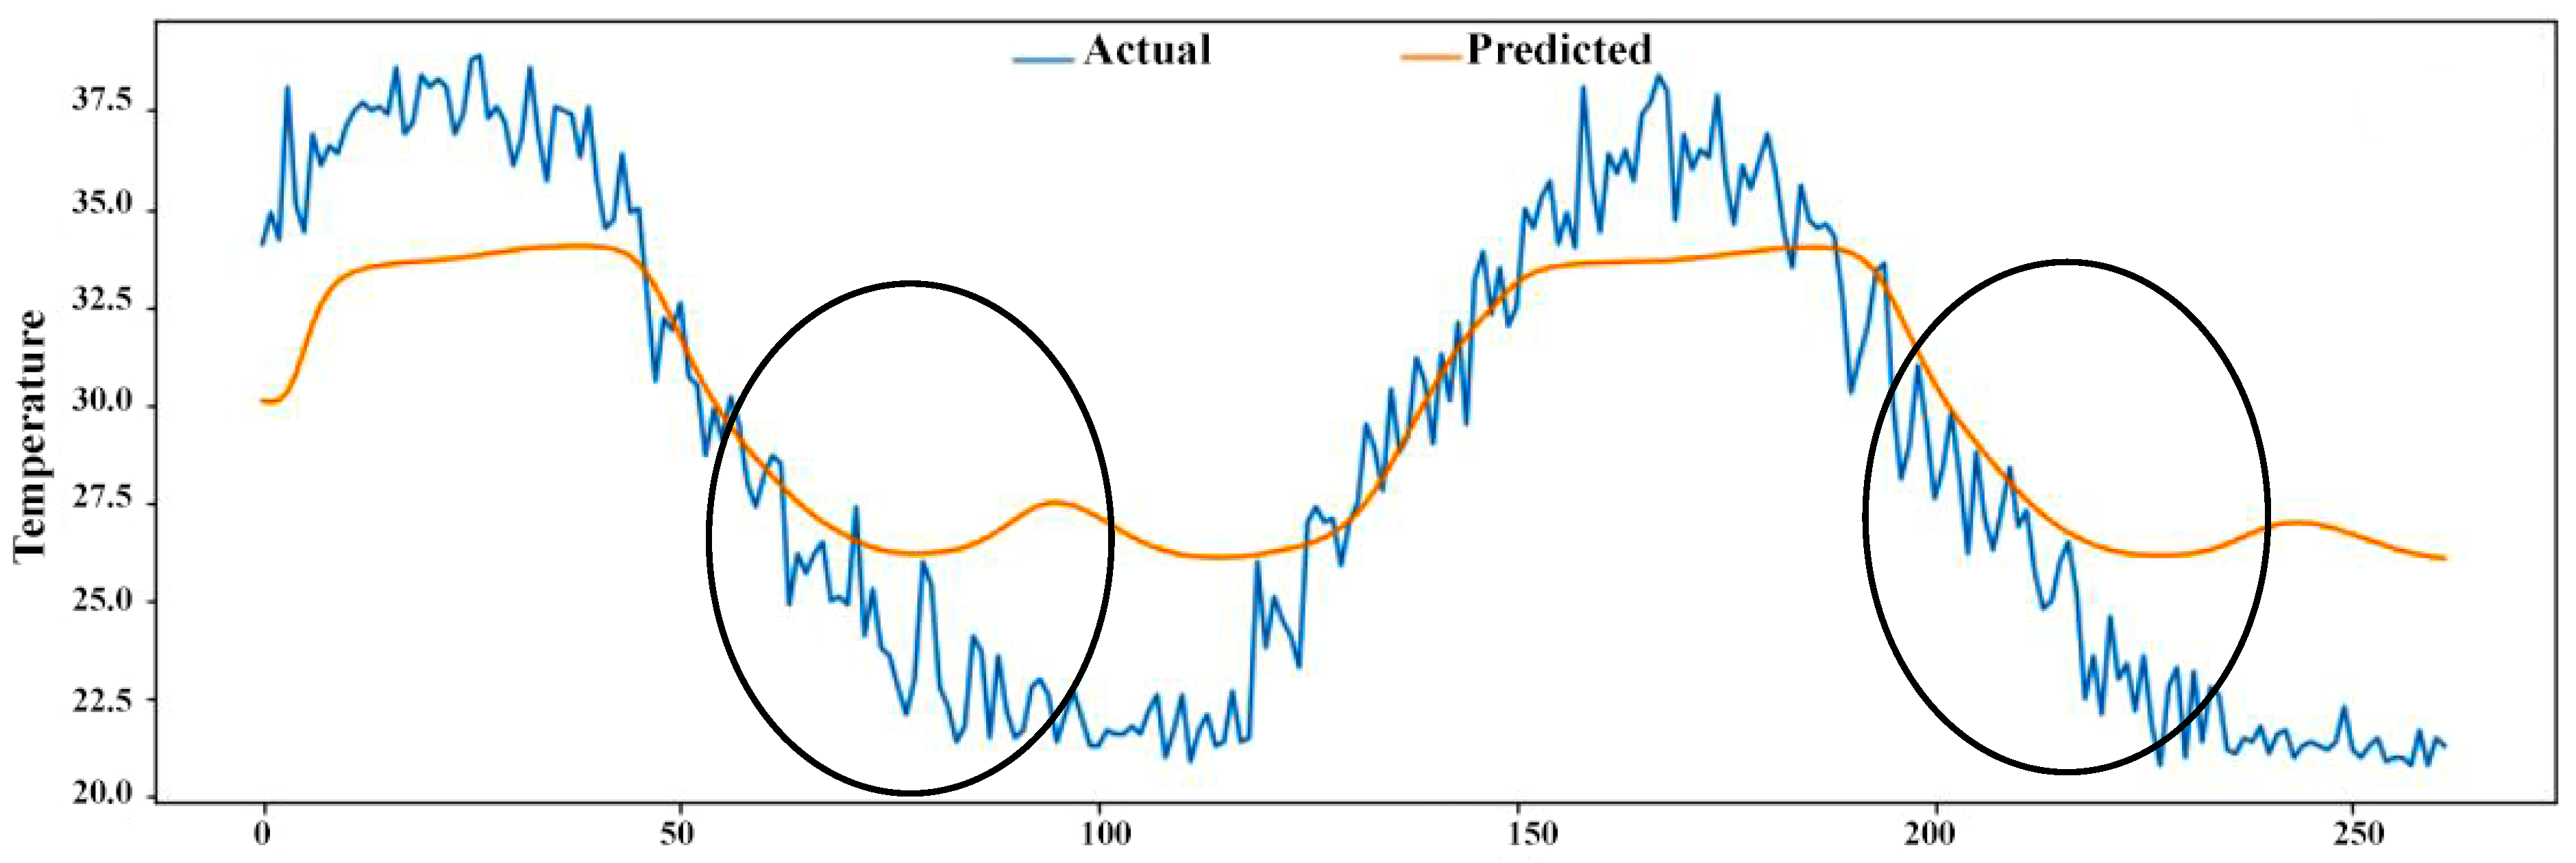
After running the model on the 13 room readings collected from the sensors, it is concluded that the model outputs varied for each room, indicating that rooms need to be studied separately, as every room possesses different characteristics including the number of windows, opening measurements, and usage. Moreover, it was noted that the model provided lower accuracy in Room 2 due to the use of air-conditioning systems by the room’s occupants, which indicates the need for occupants’ behavior to be integrated into the model to enhance the prediction accuracy, as depicted in Figure 8.
Another observation was made with respect to the loss of readings, which is attributed to wireless interruptions. Thus, such losses are represented by the discontinuity of the data and disruption over time, which affected the prediction accuracy (see Figure 9). It is worth noting that the accuracy of the model differed based on the rooms’ readings and provided, in several rooms, more than 90% accuracy for the predicted data. The high accuracy is regarded as being connected to the case study conditions (low volatile environment during summer), indicating the need to collect more readings during other seasons.
8. Conclusions
Indoor air quality is the study of air quality within and around different structures. The effects of poor IAQ include health issues, productivity loss, and occupant discomfort. The construction industry is yet to improve IAQ measures and procedures to reduce these harmful effects, as the subject is not adequately addressed within the industry. The most dominant causes of indoor pollution include lack of indoor ventilation, the outdoor environment, building materials, and occupants’ behavior. The addressed pollutants in the literature involved temperature, humidity, CO2 concentrations, CO concentrations, and fine particles (PM2.5). Collecting IAQ measurements requires advanced equipment and significant effort; thus, there is a need for sustainable, reliable, and innovative solutions, which are provided in this study through the Internet of Things (IoT). This research presented a solution to continuously monitor IAQ to assess and evaluate the indoor environment in an educational building using the IoT. The innovative application consists of multiple sensors to collect indoor measurements with the ability to communicate and connect with different microcontrollers. Once the readings are collected, the microcontroller sends them to a cloud via wireless connection. After the collection of the readings, a deep-learning model is developed, where inputs and outputs are identified to train a model in order to discover the embedded relationships between different air quality variables. The integration of continuous monitoring and the ability to provide numerical relationships between air quality variables paved the way for providing an improved understanding of the interactions within the building’s indoor environment.
An academic building was used to test the IoT application, where 13 stations were prepared and positioned in rooms to cover the entire floor. After the experiment was conducted, the readings were prepared and labeled for modeling using TensorFlow, a machine learning library to predict the indoor environment of rooms over time. Outdoor readings were also added to enhance the model for better reliability.
It was concluded that the model should be enhanced with occupants’ behavior, as the logical relationships between readings were disrupted. Despite the case study having limitations due to the experiment being conducted during the summer, the model was able to provide highly accurate predictions for the selected deep-learning architecture. Therefore, utilizing the IoT and deep-learning techniques provided an innovative solution to investigate buildings’ IAQ, and provided a foundation for developing IAQ standards within the Egyptian construction industry. The research in hand is one of the few available studies that not only provide a solution for collecting real-time readings of multiple IAQ parameters, but also utilize deep-learning techniques to create a prediction model that considers outdoor parameters. Hence, a comprehensive overview was presented to accurately evaluate the IAQ of the investigated indoor spaces. This research can be extended in the future by modeling the effect of occupants’ behavior, which influences indoor environments, and providing guidelines to be followed by occupants to cope with indoor air pollution. In addition, more sensors can be integrated to measure more indoor environment parameters such as volatile organic compounds (VOCs), ammonia (NH3), and ozone (O3). As such, quantitative analysis can be conducted to provide a benchmark with the results obtained in this research. Furthermore, a digital twin can be used to allow the continuous monitoring of physical facilities and reflect the results in a digital prototype.
Author Contributions
Conceptualization, M.M.; Data curation, M.A.; Formal analysis, M.A.; Funding acquisition, M.M.; Investigation, M.A.; Methodology, M.M. and M.A.; Project administration, M.M.; Validation, M.A.; Visualization, M.A.; Writing – review & editing, M.M. All authors have read and agreed to the published version of the manuscript.
Funding
This research was funded by the Academy of Scientific Research and Technology (ASRT), Egypt, JESOR Development Program—Project ID: 5251.
Institutional Review Board Statement
Not applicable.
Informed Consent Statement
Not applicable.
Data Availability Statement
The data presented in this study are available on request from the corresponding author. The data are not publicly available due to privacy restrictions.
Acknowledgments
The support of the Construction Engineering Technology Lab (CETL)—Faculty of Engineering, Cairo University, is acknowledged. The collaboration with the Ministry of Housing, Utilities and Urban Communities is acknowledged.
Conflicts of Interest
The authors declare no conflict of interest.
References
- EPA Introduction to Indoor Air Quality. Available online: https://www.epa.gov/indoor-air-quality-iaq/introduction-indoor-air-quality (accessed on 11 November 2019).
- Brown, N.J. Indoor air quality [Electronic version]. In Workplace Health and Safety Program; Cornell University: Ithaca, NY, USA, 2019. [Google Scholar]
- Fonseca, A.; Abreu, I.; Guerreiro, M.J.; Abreu, C.; Silva, R.; Barros, N. Indoor air quality and sustainability management—Case study in three Portuguese healthcare units. Sustainability 2018, 11, 101. [Google Scholar] [CrossRef] [Green Version]
- Zimmermann, R.K.; Skjelmose, O.; Jensen, K.G.; Jensen, K.K.; Birgisdottir, H. Categorizing Building Certification Systems According to the Definition of Sustainable Building; IOP Publishing: Bristol, UK, 2019; p. 092060. [Google Scholar]
- Parrish, D.D.; Singh, H.B.; Molina, L.; Madronich, S. Air quality progress in North American megacities: A review. Atmos. Environ. 2011, 45, 7015–7025. [Google Scholar] [CrossRef]
- Crippa, M.; Janssens-Maenhout, G.; Dentener, F.; Guizzardi, D.; Sindelarova, K.; Muntean, M.; Van Dingenen, R.; Granier, C. Forty years of improvements in European air quality: Regional policy-industry interactions with global impacts. Atmos. Chem. Phys. 2016, 16, 3825–3841. [Google Scholar] [CrossRef] [Green Version]
- Rajak, R.; Chattopadhyay, A. Short and long term exposure to ambient air pollution and impact on health in India: A systematic review. Int. J. Environ. Health Res. 2020, 30, 593–617. [Google Scholar] [CrossRef]
- Arsić, M.; Mihajlović, I.; Nikolić, D.; Živković, Ž.; Panić, M. Prediction of ozone concentration in ambient air using multilinear regression and the artificial neural networks methods. Ozone Sci. Eng. 2020, 42, 79–88. [Google Scholar] [CrossRef]
- Tran, P.T.M.; Adam, M.G.; Tham, K.W.; Schiavon, S.; Pantelic, J.; Linden, P.F.; Sofianopoulou, E.; Sekhar, S.C.; Cheong, D.K.W.; Balasubramanian, R. Assessment and mitigation of personal exposure to particulate air pollution in cities: An exploratory study. Sustain. Cities Soc. 2021, 72, 103052. [Google Scholar] [CrossRef]
- Zhou, Q.; Ooka, R. Comparison of Different Deep Neural Network Architectures for Isothermal Indoor Airflow Prediction; Springer: Berlin/Heidelberg, Germany, 2020; pp. 1409–1423. [Google Scholar]
- Qiu, Y.; Wang, Y.; Tang, Y. Investigation of Indoor Air Quality in Six Office Buildings in Chengdu, China Based on Field Measurements; Springer: Berlin/Heidelberg, Germany, 2020; pp. 1009–1020. [Google Scholar]
- Omidi Khaniabadi, Y.; Sicard, P.; Omidi Khaniabadi, A.; Mohammadinejad, S.; Keishams, F.; Takdastan, A.; Najafi, A.; De Marco, A.; Daryanoosh, M. Air quality modeling for health risk assessment of ambient PM10, PM2.5 and SO2 in Iran. Hum. Ecol. Risk Assess. Int. J. 2019, 25, 1298–1310. [Google Scholar] [CrossRef]
- Steinemann, A.; Wargocki, P.; Rismanchi, B. Ten questions concerning green buildings and indoor air quality. Build. Environ. 2017, 112, 351–358. [Google Scholar] [CrossRef] [Green Version]
- Luo, M.; Wang, Z.; Brager, G.; Cao, B.; Zhu, Y. Indoor climate experience, migration, and thermal comfort expectation in buildings. Build. Environ. 2018, 141, 262–272. [Google Scholar] [CrossRef] [Green Version]
- Francisco, P.W.; Jacobs, D.E.; Targos, L.; Dixon, S.L.; Breysse, J.; Rose, W.; Cali, S. Ventilation, indoor air quality, and health in homes undergoing weatherization. Indoor Air 2017, 27, 463–477. [Google Scholar] [CrossRef]
- Bennett, J.; Davy, P.; Trompetter, B.; Wang, Y.; Pierse, N.; Boulic, M.; Phipps, R.; Howden-Chapman, P. Sources of indoor air pollution at a New Zealand urban primary school; a case study. Atmos. Pollut. Res. 2019, 10, 435–444. [Google Scholar] [CrossRef]
- Hesaraki, A.; Huda, N. A comparative review on the application of radiant low-temperature heating and high-temperature cooling for energy, thermal comfort, indoor air quality, design and control. Sustain. Energy Technol. Assess. 2022, 49, 101661. [Google Scholar] [CrossRef]
- Jin, Z.-Y.; Wu, M.; Han, R.-Q.; Zhang, X.-F.; Wang, X.-S.; Liu, A.-M.; Zhou, J.-Y.; Lu, Q.-Y.; Kim, C.H.; Mu, L. Household ventilation may reduce effects of indoor air pollutants for prevention of lung cancer: A case-control study in a Chinese population. PLoS ONE 2014, 9, 102685. [Google Scholar] [CrossRef]
- Osman, M.E.; Ibrahim, H.Y.; Yousef, F.A.; Elnasr, A.A.A.; Saeed, Y.; Hameed, A.A.A. A study on microbiological contamination on air quality in hospitals in Egypt. Indoor Built Environ. 2018, 27, 953–968. [Google Scholar] [CrossRef]
- Annesi-Maesano, I.; Baiz, N.; Banerjee, S.; Rudnai, P.; Rive, S.; Sinphonie, G. Indoor air quality and sources in schools and related health effects. J. Toxicol. Environ. Health Part B 2013, 16, 491–550. [Google Scholar] [CrossRef]
- Chang, T.; Ren, D.; Shen, Z.; Huang, Y.; Sun, J.; Cao, J.; Zhou, J.; Liu, H.; Xu, H.; Zheng, C. Indoor air pollution levels in decorated residences and public places over Xi’an, China. Aerosol Air Qual. Res. 2017, 17, 2197–2205. [Google Scholar] [CrossRef] [Green Version]
- Mutis, I.; Ambekar, A.; Joshi, V. Real-time space occupancy sensing and human motion analysis using deep learning for indoor air quality control. Autom. Constr. 2020, 116, 103237. [Google Scholar] [CrossRef]
- Jang, J.; Baek, J.; Leigh, S.-B. Prediction of optimum heating timing based on artificial neural network by utilizing BEMS data. J. Build. Eng. 2019, 22, 66–74. [Google Scholar] [CrossRef]
- Heracleous, C.; Michael, A. Experimental assessment of the impact of natural ventilation on indoor air quality and thermal comfort conditions of educational buildings in the Eastern Mediterranean region during the heating period. J. Build. Eng. 2019, 26, 100917. [Google Scholar] [CrossRef]
- Amoatey, P.; Omidvarborna, H.; Baawain, M.S.; Al-Mamun, A. Indoor air pollution and exposure assessment of the gulf cooperation council countries: A critical review. Environ. Int. 2018, 121, 491–506. [Google Scholar] [CrossRef]
- Cao, Y.; Cai, Y. Urban air pollution characteristics and associations with pre-school children respiratory health in four cities of Central China. Afr. Educ. Res. J. 2022, 10, 71–82. [Google Scholar] [CrossRef]
- Jin, R.; Zhang, H.; Liu, D.; Yan, X. IoT-based detecting, locating and alarming of unauthorized intrusion on construction sites. Autom. Constr. 2020, 118, 103278. [Google Scholar] [CrossRef]
- Rafsanjani, H.N.; Ghahramani, A. Towards utilizing internet of things (IoT) devices for understanding individual occupants′ energy usage of personal and shared appliances in office buildings. J. Build. Eng. 2020, 27, 100948. [Google Scholar] [CrossRef]
- Boje, C.; Guerriero, A.; Kubicki, S.; Rezgui, Y. Towards a semantic Construction Digital Twin: Directions for future research. Autom. Constr. 2020, 114, 103179. [Google Scholar] [CrossRef]
- Asif, A.; Zeeshan, M. Indoor temperature, relative humidity and CO2 monitoring and air exchange rates simulation utilizing system dynamics tools for naturally ventilated classrooms. Build. Environ. 2020, 180, 106980. [Google Scholar] [CrossRef]
- Lei, L.; Chen, W.; Xue, Y.; Liu, W. A comprehensive evaluation method for indoor air quality of buildings based on rough sets and a wavelet neural network. Build. Environ. 2019, 162, 106296. [Google Scholar] [CrossRef]
- Zhou, Y.; Chang, F.-J.; Chang, L.-C.; Kao, I.F.; Wang, Y.-S. Explore a deep learning multi-output neural network for regional multi-step-ahead air quality forecasts. J. Clean. Prod. 2019, 209, 134–145. [Google Scholar] [CrossRef]
- Khazaei, B.; Shiehbeigi, A.; Haji Molla Ali Kani, A.R. Modeling indoor air carbon dioxide concentration using artificial neural network. Int. J. Environ. Sci. Technol. 2019, 16, 729–736. [Google Scholar] [CrossRef]
- Johnston, S.J.; Basford, P.J.; Bulot, F.M.J.; Apetroaie-Cristea, M.; Easton, N.H.C.; Davenport, C.; Foster, G.L.; Loxham, M.; Morris, A.K.R.; Cox, S.J. City scale particulate matter monitoring using LoRaWAN based air quality IoT devices. Sensors 2019, 19, 209. [Google Scholar] [CrossRef] [Green Version]
- ASHRAE. ASHRAE/ANSI Standard 55-2017 Thermal Environmental Conditions for Human Occupancy; American Society of Heating, Refrigerating, and Air-Conditioning Engineers: Atlanta, GA, USA, 2017. [Google Scholar]
- Clements-Croome, D. Creating the Productive Workplace: Places to Work Creatively; Taylor & Francis: London, UK, 2019. [Google Scholar]
- NOAA Carbon Dioxide Levels in Atmosphere Hit Record High in May. Available online: https://www.noaa.gov/news/carbon-dioxide-levels-in-atmosphere-hit-record-high-in-may (accessed on 31 January 2020).
- Omaye, S.T. Metabolic modulation of carbon monoxide toxicity. Toxicology 2002, 180, 139–150. [Google Scholar] [CrossRef]
- EPA Particulate Matter (PM) Basics. Available online: https://www.epa.gov/pm-pollution/particulate-matter-pm-basics (accessed on 7 February 2020).
- Thingspeak ThingSpeak Plus Third-Party Hardware—An Alternative to ioBridge Hardware. Available online: http://blog.iobridge.com/2014/12/thingspeak-plus-third-party-hardware-an-alternative-to-iobridge-hardware (accessed on 7 February 2019).
- Srivastava, D.; Kesarwani, A.; Dubey, S. Measurement of Temperature and Humidity by using Arduino Tool and DHT11. Int. Res. J. Eng. Technol. 2018, 5, 876–878. [Google Scholar]
- Dickow, A.; Feiertag, G. A framework for calibration of barometric MEMS pressure sensors. Procedia Eng. 2014, 87, 1350–1353. [Google Scholar] [CrossRef] [Green Version]
- Abbas, F.N.; Saadoon, M.I.M.; Abdalrdha, Z.K.; Abud, E.N. Capable of gas sensor MQ-135 to monitor the air quality with Arduino Uno. Int. J. Eng. Res. Technol. 2020, 13, 2955–2959. [Google Scholar] [CrossRef]
- Modaresi, Z.K.; Karimi, G.; Mowla, D. Study of co-combustion of dried sewage sludge with coke: Thermogravimetric assessment and gaseous emissions. J. Environ. Chem. Eng. 2019, 7, 102871. [Google Scholar] [CrossRef]
- Hsu, W.-L.; Chen, W.-T.; Kuo, H.-H.; Shiau, Y.-C.; Chern, T.-Y.; Lai, S.-C.; Fan, W.-H. Establishment of smart living environment control system. Sens. Mater. 2020, 32, 183–195. [Google Scholar] [CrossRef] [Green Version]
- Meteoblue History Plus. Available online: https://www.meteoblue.com/en/historyplus (accessed on 15 April 2019).
Figure 1.
IAQ system flowchart.

Figure 2.
Sensors connected with ESP32. (a) DHT 11, (b) BMP180, (c) MQ 135, (d) MQ 7, (e) GP2Y1010AU0F.
Figure 2.
Sensors connected with ESP32. (a) DHT 11, (b) BMP180, (c) MQ 135, (d) MQ 7, (e) GP2Y1010AU0F.

Figure 3.
IoT wooden box.

Figure 4.
Assembled IoT box.

Figure 5.
Academic building floor plan.

Figure 6.
Collected readings on Thingspeak for the considered case study. (a) Temperature field test, (b) humidity field test, (c) pressure field test, (d) CO2 field test, (e) CO field test, (f) fine particles field test.
Figure 6.
Collected readings on Thingspeak for the considered case study. (a) Temperature field test, (b) humidity field test, (c) pressure field test, (d) CO2 field test, (e) CO field test, (f) fine particles field test.


Figure 7.
Predicted vs. actual humidity data for R7. (a) Training data, (b) testing data.

Figure 8.
Comparison between actual and predicted temperature for R2.

Figure 9.
Discontinuity of data and disruptions due to loss of readings for R5.


Table 1.
Designated functions of IoT application components.
| Component | Function | Illustration |
|---|---|---|
| ESP32 Microcontroller | ESP series, especially ESP32, provide the designer with unique abilities including Bluetooth and Wi-Fi connections to enable the board to act not only as a microcontroller, but also as gateway for different IoT applications. |  |
| DHT 11 | DHT 11 is used to measure both temperature and relative humidity, and then it changes the received analog signal to a digital signal. This simplifies the use of the sensor and enables compatibility with any microcontroller with no need for prior calibration, as it gives a calibrated digital signal output [41]. The sensor is tested when attached with an ESP32, and the uploaded code contains specific lines to allow the sending of readings directly to the Thingspeak platform. Sensor error: max. 5% for humidity and 2 °C for temperature. |  |
| BMP180 | Pressure sensors that are compatible with microcontrollers usually adopt a three- or four-pin interface connected to a ground (Gnd) pin, power (Vcc) pin, and data pin. BMP180 is a highly accurate barometric pressure sensor with an embedded temperature sensor for different purposes, and is fully calibrated by the manufacturer as a ready-to-use sensor [42]. Sensor error: max. 0.12 hpa. |  |
| MQ135 | MQ135 is an electrochemical sensor designed specifically for IAQ applications. The device is highly sensitive to CO2 gas and is known for its stability and long life. Reliability and calibration of the sensor was evaluated and integrated with the operating code according to Abbas et al. [43]. Sensor error: Chemical sensor errors depend on compound concentrations and vary according to the case study. |  |
| MQ7 | MQ7 is specialized in detecting CO and providing accurate readings in parts per million (PPM). It is larger in size and widely used for air quality applications. The sensor’s calculations were integrated within the code, as illustrated by Modaresi et al. [44]. Sensor error: Chemical sensor errors depend on compound concentrations and vary according to the case study. |  |
| GP2Y1010AU0F | GP2Y1010AU0F sensor is manufactured by Sharp industries and is well known for its accuracy and durability. It is an optical sensor that uses a laser, as it calculates the number of particles according to their wavelengths. Hsu et al. [45] studied occupants’ comfort within indoor environments to evaluate Smart Buildings in Taiwan, and GP2Y1010AU0F was utilized to collect dust measurements. Sensor error: max. 0.1 mg/m3. |  |
Table 2.
Average daily readings of the case.
| Day | Avg. Temp. (°C) | Avg. Humidity (%) | Avg. Air Pressure (Pascal) | Avg. CO (PPM) | Avg. CO2 (PPM) | Avg. PM (µ/m3) |
|---|---|---|---|---|---|---|
| 29 July | 34.0 | 24.1 | 100,403.2 | 2.4 | 463.20 | 15.30 |
| 30 July | 29.8 | 40.0 | 100,404.3 | 2.4 | 460.10 | 14.20 |
| 31 July | 29.1 | 50.3 | 100,409.1 | 2.4 | 474.30 | 15.90 |
| 1 August | 28.9 | 48.2 | 100,406.7 | 2.4 | 477.90 | 16.80 |
| 2 August | 30.5 | 39.5 | 100,405.9 | 2.4 | 448.70 | 15.20 |
| 3 August | 30.8 | 38.6 | 100,407.2 | 2.4 | 459.10 | 16.50 |
| 4 August | 30.5 | 42.3 | 100,403.3 | 2.4 | 471.80 | 17.20 |
| 5 August | 29.9 | 45.6 | 100,403.8 | 2.4 | 461.10 | 13.50 |
| 6 August | 28.4 | 43.8 | 100,404.1 | 2.5 | 459.30 | 13.70 |
| 7 August | 24.2 | 61.9 | 100,406.7 | 2.5 | 460.20 | 15.10 |
Table 3.
IAQ readings for the academic building rooms.
| Room ID | No. of Readings | Temperature (°C) | Humidity (%) | Air Pressure (Pa) | Carbon Dioxide (PPM) | Carbon Monoxide (PPM) | Particulate Matter (µ/m3) | ||||||||||||
|---|---|---|---|---|---|---|---|---|---|---|---|---|---|---|---|---|---|---|---|
| Min | Avg. | Max. | Min | Avg. | Max. | Min | Avg. | Max. | Min | Avg. | Max. | Min | Avg. | Max. | Min | Avg. | Max. | ||
| R1 | 1318 | 19.3 | 29.5 | 39.7 | 7.3 | 41.6 | 82.8 | 100,390 | 100,407.1 | 100,418 | 422 | 460.1 | 511 | 1 | 3.3 | 5 | 7 | 14.3 | 19 |
| R2 | 1302 | 20.3 | 28.2 | 39.4 | 8.9 | 43.4 | 79.6 | 100,389 | 100,405.3 | 100,423 | 442 | 475.3 | 548 | 2 | 2.1 | 4 | 5 | 17.2 | 21 |
| R3 | 1285 | 18.2 | 30.3 | 38.5 | 10.6 | 45.5 | 91.3 | 100,386 | 100,403.5 | 100,420 | 393 | 440.1 | 505 | 0 | 1.9 | 3 | 7 | 12.9 | 19 |
| R4 | 1310 | 20.8 | 31.4 | 38.9 | 9.7 | 42.7 | 85.6 | 100,389 | 100,406.2 | 100,422 | 416 | 462.8 | 514 | 2 | 2.4 | 5 | 8 | 16.1 | 21 |
| R5 | 1296 | 21.5 | 30.5 | 40.3 | 8.4 | 44.8 | 77.2 | 100,391 | 100,407.8 | 100,426 | 404 | 451.3 | 514 | 2 | 3.3 | 4 | 10 | 15.2 | 21 |
| R6 | 1300 | 22.6 | 29.3 | 41.6 | 10.1 | 45.7 | 89.7 | 100,387 | 100,404.1 | 100,422 | 441 | 473.2 | 551 | 1 | 2.1 | 3 | 9 | 17.8 | 25 |
| R7 | 1293 | 19.7 | 31.7 | 37.9 | 5.2 | 43.8 | 85.8 | 100,390 | 100,407.7 | 100,424 | 428 | 461.9 | 538 | 3 | 2.2 | 5 | 14 | 13.2 | 20 |
| R8 | 1291 | 21.8 | 28.8 | 39.1 | 7.8 | 46.4 | 79.6 | 100,389 | 100,407.1 | 100,425 | 422 | 467.1 | 524 | 0 | 2.8 | 4 | 4 | 16.7 | 21 |
| R9 | 1275 | 22.1 | 30.6 | 40.5 | 6.3 | 45.3 | 83.9 | 100,389 | 100,406.4 | 100,422 | 435 | 471.8 | 522 | 1 | 1.7 | 4 | 5 | 16.3 | 23 |
| R10 | 1286 | 20.4 | 31.2 | 39.5 | 8.5 | 42.1 | 79.8 | 100,391 | 100,408.7 | 100,425 | 413 | 455.2 | 527 | 0 | 3.2 | 3 | 11 | 15.1 | 22 |
| R11 | 1294 | 19.9 | 29.7 | 37.8 | 5.6 | 46.4 | 90.3 | 100,388 | 100,405.2 | 100,423 | 434 | 464.7 | 542 | 0 | 2.9 | 3 | 9 | 13.9 | 20 |
| R121 | 1272 | 21.2 | 30.9 | 41.8 | 7.2 | 44.4 | 84.6 | 100,391 | 100,408.3 | 100,426 | 423 | 470.1 | 529 | 1 | 2.2 | 5 | 13 | 16.4 | 21 |
| R122 | 1242 | 20.7 | 30.5 | 41.4 | 7.9 | 44.2 | 89.3 | 100,387 | 100,404.1 | 100,421 | 422 | 472.3 | 549 | 1 | 2.3 | 4 | 12 | 15.9 | 20 |
Table 4.
Readings after adding outdoor parameters.
| Date/Time | Indoor | Outdoor | ||||||
|---|---|---|---|---|---|---|---|---|
| Temp. (°C) | Humidity (%) | Air Pressure (Pa) | CO2 (PPM) | Temp. (Cᵒ) | Humidity (%) | Wind Velocity (Km/hr.) | Wind Direction (Degree) | |
| 7/29 01:01 PM | 30 | 22.6 | 100,408.0 | 430.0 | 37.3 | 21.0 | 16.0 | 340.6 |
| 7/29 01:11 PM | 29.8 | 17.9 | 100,410.0 | 431.2 | ||||
| 7/29 01:20 PM | 31.1 | 16.9 | 100,407.0 | 430.2 | ||||
| 7/29 01:30 PM | 29.1 | 22.1 | 100,410.0 | 430.2 | ||||
| 7/29 01:39 PM | 29.3 | 15.1 | 100,411.0 | 430.2 | ||||
| 7/29 01:49 PM | 30.6 | 21.3 | 100,407.0 | 430.8 | ||||
| 7/29 01:58 PM | 30.3 | 15.8 | 100,407.0 | 431.0 | ||||
Table 5.
Model accuracy for training, validating, and testing.
| Room No. | No. of Readings | Training Accuracy (%) | Validation Accuracy (%) | Testing Accuracy (%) |
|---|---|---|---|---|
| R1 | 1318 | 93.87 | 91.21 | 90.56 |
| R2 | 1302 | 86.21 | 83.15 | 80.94 |
| R3 | 1285 | 92.54 | 89.26 | 88.17 |
| R4 | 1310 | 93.83 | 90.11 | 91.12 |
| R5 | 1296 | 90.56 | 86.17 | 84.31 |
| R6 | 1300 | 89.28 | 87.49 | 85.67 |
| R7 | 1293 | 91.47 | 88.51 | 85.19 |
| R8 | 1291 | 89.68 | 86.30 | 86.72 |
| R9 | 1275 | 90.29 | 85.64 | 85.35 |
| R10 | 1286 | 91.36 | 85.78 | 84.28 |
| R11 | 1294 | 87.48 | 84.93 | 82.17 |
| R121 | 1272 | 92.75 | 87.88 | 84.68 |
| R122 | 1242 | 94.64 | 88.19 | 88.23 |
Publisher’s Note: MDPI stays neutral with regard to jurisdictional claims in published maps and institutional affiliations. |
© 2022 by the authors. Licensee MDPI, Basel, Switzerland. This article is an open access article distributed under the terms and conditions of the Creative Commons Attribution (CC BY) license (https://creativecommons.org/licenses/by/4.0/).
Share and Cite
MDPI and ACS Style
Marzouk, M.; Atef, M. Assessment of Indoor Air Quality in Academic Buildings Using IoT and Deep Learning. Sustainability 2022, 14, 7015. https://0-doi-org.brum.beds.ac.uk/10.3390/su14127015
AMA Style
Marzouk M, Atef M. Assessment of Indoor Air Quality in Academic Buildings Using IoT and Deep Learning. Sustainability. 2022; 14(12):7015. https://0-doi-org.brum.beds.ac.uk/10.3390/su14127015
Chicago/Turabian StyleMarzouk, Mohamed, and Mohamed Atef. 2022. "Assessment of Indoor Air Quality in Academic Buildings Using IoT and Deep Learning" Sustainability 14, no. 12: 7015. https://0-doi-org.brum.beds.ac.uk/10.3390/su14127015
Note that from the first issue of 2016, this journal uses article numbers instead of page numbers. See further details here.