Article

Research on Maximum Penetration Ratio of Wind Power under the Voltage Stability Margin Constraint

1
Energy Development Research Institute of China Southern Power Grid, Guangzhou 510530, China
2
School of Electrical and Electronic Engineering, Huazhong University of Science and Technology, Wuhan 430074, China
*
Author to whom correspondence should be addressed.
Sustainability 2022, 14(12), 7217; https://0-doi-org.brum.beds.ac.uk/10.3390/su14127217
Submission received: 11 May 2022 / Revised: 8 June 2022 / Accepted: 10 June 2022 / Published: 13 June 2022
(This article belongs to the Special Issue Sustainable Power System Planning and Analysis)

Abstract

:
With the large-scale integration of wind power, the voltage stability problem in the power system has become increasingly prominent. Therefore, this paper studies the maximum penetration ratio of wind power from the perspective of voltage stability. Firstly, the mathematical grid-connection model of the wind generator is established. Secondly, using the impedance modulus margin index (IMMI) and the Thevenin model, the analytical calculation method for maximum wind power penetration under the voltage stability margin constraint is proposed with theoretical derivation. Then, a typical case study is used to verify the feasibility and effectiveness of the proposed method. Finally, based on this, the key factors affecting the wind power penetration limit are analyzed from the source–grid–load side, and practical engineering measures to improve the maximum penetration ratio of wind power are summarized. This research will be helpful for the planning and operation of the high-proportion renewable energy power systems.

1. Introduction

1.1. Motivation and Background

Against the background of the energy revolution and "dual carbon" strategic goal, vigorously developing renewable energy has become the consensus of all countries [1]. As the most promising renewable energy, the development of wind power is considerable. By the end of 2021, China’s newly installed wind power capacity reached 48GW, and the cumulative installed capacity reached 328GW, accounting for about 13.8% of the total installed capacity [2]. Wind power has gradually become an important force in promoting China’s energy revolution and sustainable development [3]. However, the large-scale integration of wind power has brought severe challenges to the security and stability of the power system. In recent years, there have been many large-scale power outages in the power grid, with a high proportion from wind power [4,5]. Therefore, it is of great significance to study the maximum proportion of wind power that the power grid can accept, that is, the maximum penetration ratio of wind power, which provides basic guidance for the planning of wind power plants.

1.2. Related Work

The ability of the power grid to accept wind power involves multiple factors. At present, the academic community has not yet formed a complete and unified calculation method, but some scholars have carried out related research from different perspectives [6,7,8]. References [9,10,11] established a calculation model for the maximum grid-connected capacity of wind farms by using transient and dynamic stability constraints. In [12,13,14], the primary frequency modulation response model of wind farms was analyzed and established, and the upper limit of wind power penetration was obtained from the perspective of frequency safety. According to the risk probability of cascading failures in the power grid, the literature [15] proposes an evaluation model for the maximum access capacity of wind power based on the interval optimal power flow. Reference [16] calculates the maximum wind power penetration rate of the power grid with DC external transmission based on the critical short-circuit ratio index. In [17], the influence mechanism of wind power on system power angle stability was studied, and the optimal wind power penetration rate to stabilize the power angle in a multi-generator system was provided. From the perspective of system peak shaving backup, reference [18] evaluates the maximum capacity of wind power that the grid can accept.
Although the existing research on the maximum penetration ratio of wind power has achieved quite fruitful results, related studies involving voltage stability margin constraints are few and tricky. In fact, wind farms are generally transported to the 110kV busbar via long-distance lines for centralized grid access, and the electrical distance is usually three to five times that of traditional thermal power units [19]. Therefore, when the high-penetration wind power is connected, the electrical connection between the unit and the power grid will be weakened, and the line voltage drop will increase, thereby reducing the system voltage stability margin. Although it is equipped with widely distributed reactive power compensation devices, the voltage support capacity it provides under faults cannot be compared with the forced excitation of the unit, and it also increases the difficulty of system voltage adjustment and control. In addition, some theoretical studies have shown that, with the continuous increase in the proportion of wind power, the system instability mode will change from power angle instability, dominated by the synchronous machine, to voltage instability, dominated by wind power [20], indicating that voltage stability has become a key factor restricting the further improvement of the wind power penetration rate. Therefore, it is urgent to study the maximum wind power penetration under the constraint of the voltage stability margin.
From the perspective of the solution method of maximum wind power penetration, at present, there are mainly the time-domain simulation and optimization methods [21]. The time-domain method is a kind of transient calibration method that increases wind power penetration continuously according to the response deviation of each simulation until the set deviation constraints are met. Obviously, the process of this approach is complicated, and it involves repeated operation when the system operation mode changes. The maximum wind power penetration calculation can be transformed into an optimization problem for the purpose of promoting wind power access under certain operational and safety constraints [10]. In reference [22], considering constraints such as spinning reserve, N-1 reliability, and effective inertial constant, the optimal access capacity of wind power is obtained by using a genetic algorithm. Reference [23] proposes a three-stage optimization framework for calculating the maximum penetration rate of wind power, which adopts the chance-constrained technique based on probabilistic, multi-objective particle swarm optimization (PSO) to deal with uncertainty in the wind power system. As the applications of optimal power flow (OPF) [24], these optimization methods can incorporate all relevant constraints, but they all share a common problem, namely, the convergence of the solution algorithm, and tend to be computationally inefficient.
To sum up, this paper takes the voltage stability margin constraint as the entry point and deduces the analytical solution formula for the maximum penetration ratio of wind power, which is based on the established mathematical model of wind generator grid-connection, the impedance modulus margin index, and the Thevenin model. The method proposed is concise and efficient, which avoids a complicated process of dynamic simulation and optimization calculation. The IEEE-typical system is used as a case study, and the result not only verifies the feasibility of the proposed method, but also shows that the maximum permeability of wind power is affected by many factors, such as the source, grid, and load side. On this basis, this paper summarizes the measures to improve maximum wind power penetration under the constraint of the voltage stability margin, which provides references for the planning and operation of a power system with renewable energy as the main body.
The rest of the paper is organized as follows. The mathematical model of wind generator grid connection is established in Section 2. The impedance modulus margin index and Thevenin equivalent model are described in Section 3. Section 4 and Section 5 present the analytical solution method of maximum wind power penetration and the case study. Finally, Section 6 concludes the paper.

2. Mathematical Model of Wind Generator Grid Connection

Wind generators and conventional units are the active power sources of power systems, and the corresponding grid-connected models can be established as shown in Figure 1.
In the figure, ZSG and ZWG are the equivalent impedances of conventional units and wind generators to the grid-connected node, respectively; ZST represents the Thevenin equivalent impedance of the system viewed from the grid-connected point; PL and QL are the active and reactive loads of the grid; the calculation formula of ZSG and ZWG is as follows (1):
{ Z S G = Z S G ( 0 ) 1 λ Z W G = γ Z S G ( 0 ) λ
where λ is the wind power penetration rate, and the calculation method is the wind power output/total output of the unit; Z S G ( 0 ) represents the impedance of the conventional unit to the grid-connected point when the penetration rate is 0; γ is the impedance multiple of the wind power unit to the same grid-connected node compared to the conventional unit, and, according to actual power grid statistics, the value is mostly in the range of 3 to 5; that is, the long-distance transmission of wind generators weakens the connection between the power supply and the grid-connected nodes and increases the electrical distance.
When only the voltage stability is studied, if the power angle difference between the ESG and EWG of the power supply at the same grid-connected point is ignored, and the modulus value is assumed to be 1, the equivalent impedance of the power supply at the grid-connected node can be obtained as:
Z e q = Z S G / / Z W G = γ Z S G ( 0 ) γ + ( 1 γ ) λ
As can be seen in Formula (2), as wind power permeability increases, the equivalent impedance from the generator set to the grid-connected node gradually increases.

3. Impedance Mode Margin and Thevenin Model

3.1. IMMI

The impedance mode margin index (IMMI) can effectively measure the voltage stability level of the load point according to reference [25], and its calculation formula is listed as follows (3):
η = | Z L | | Z t h | | Z L |
where ZL is the load impedance, Zth is the system Thevenin equivalent impedance at the load point. When η = 1, it indicates that the voltage stability of the load point is strong; when η = 0, it indicates that it is at the critical point of voltage stability.
Among them, when considering the ZIP comprehensive model of the load, the size of the load impedance ZL is the parallel connection of the constant impedance load, the constant current load, and the constant power load equivalent impedance, namely, Z L = Z L , 0 / / Z L , 1 / / Z L , 2 . According to Z = U/I and Z = U2/S, it is easy to know that ZL,1 and ZL,2 are the primary and quadratic functions of the node voltage, respectively. If the load power factor is assumed to be the same, the calculation formula of ZL is:
Z L = U o p 2 a 0 U o p 2 + a 1 U o p + a 2 Z L N
where ZLN is the load impedance at the rated voltage, and a0, a1, and a2 are the ratios of the constant impedance, constant current, and constant power loads under the rated voltage, respectively, satisfying a0+a1+a2 = 1.

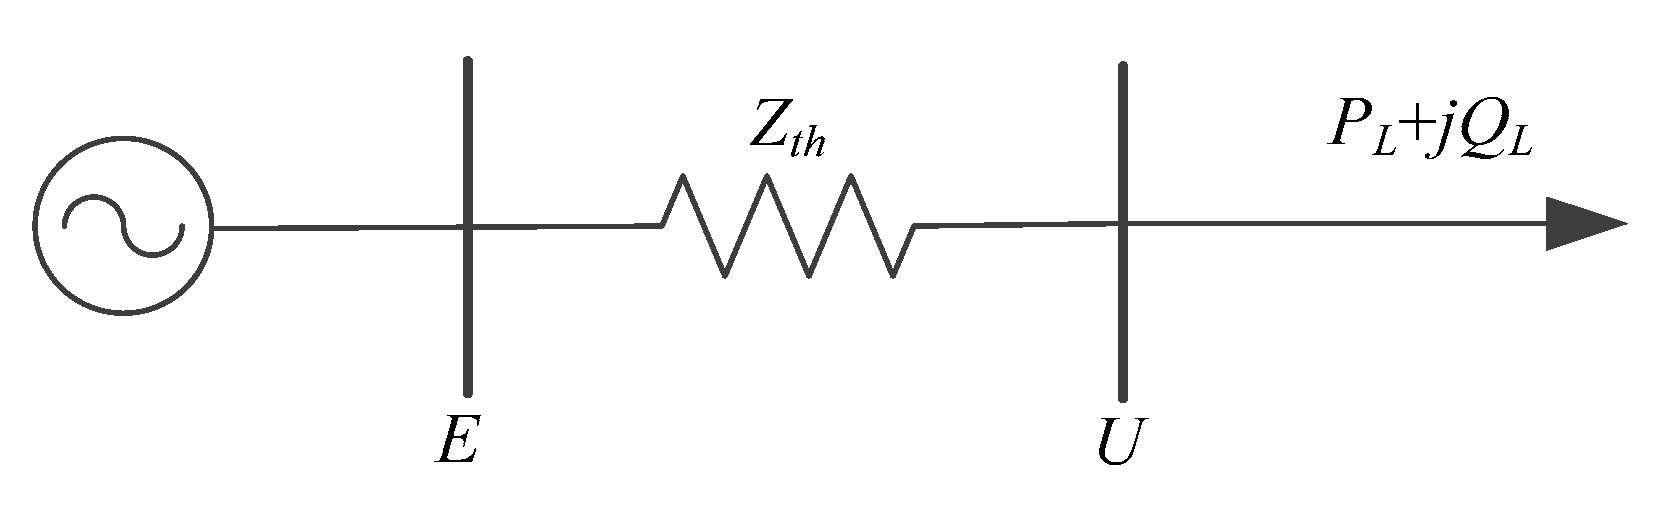
3.2. Thevenin Equivalent Model

The Thevenin equivalent circuit model can be described as shown in Figure 2.
According to the criterion of impedance mode margin, it is not difficult to find that |Zth|=|ZL| under the condition of voltage critical stability; that is, the Thevenin impedance voltage drop, Uth, is equal to the load operating voltage, Uop, at this time. When the Thevenin equivalent impedance angle and the load power factor are kept constant, Uth and Uop can form a circular trajectory of the voltage phasors, and if the load power factor changes, a semicircle cluster can be formed, as shown in Figure 3.
Among these, θ is the supplementary angle of the difference between the Thevenin impedance angle, θth, and the load impedance angle, θl; namely, θ = π ( θ t h θ l ) . It is not difficult to calculate the corresponding critical stable voltage, Uc, as follows (5):
U c = E 2 cos θ t h θ l 2

4. Calculation of Maximum Wind Power Permeability under Voltage Stability Margin Constraints

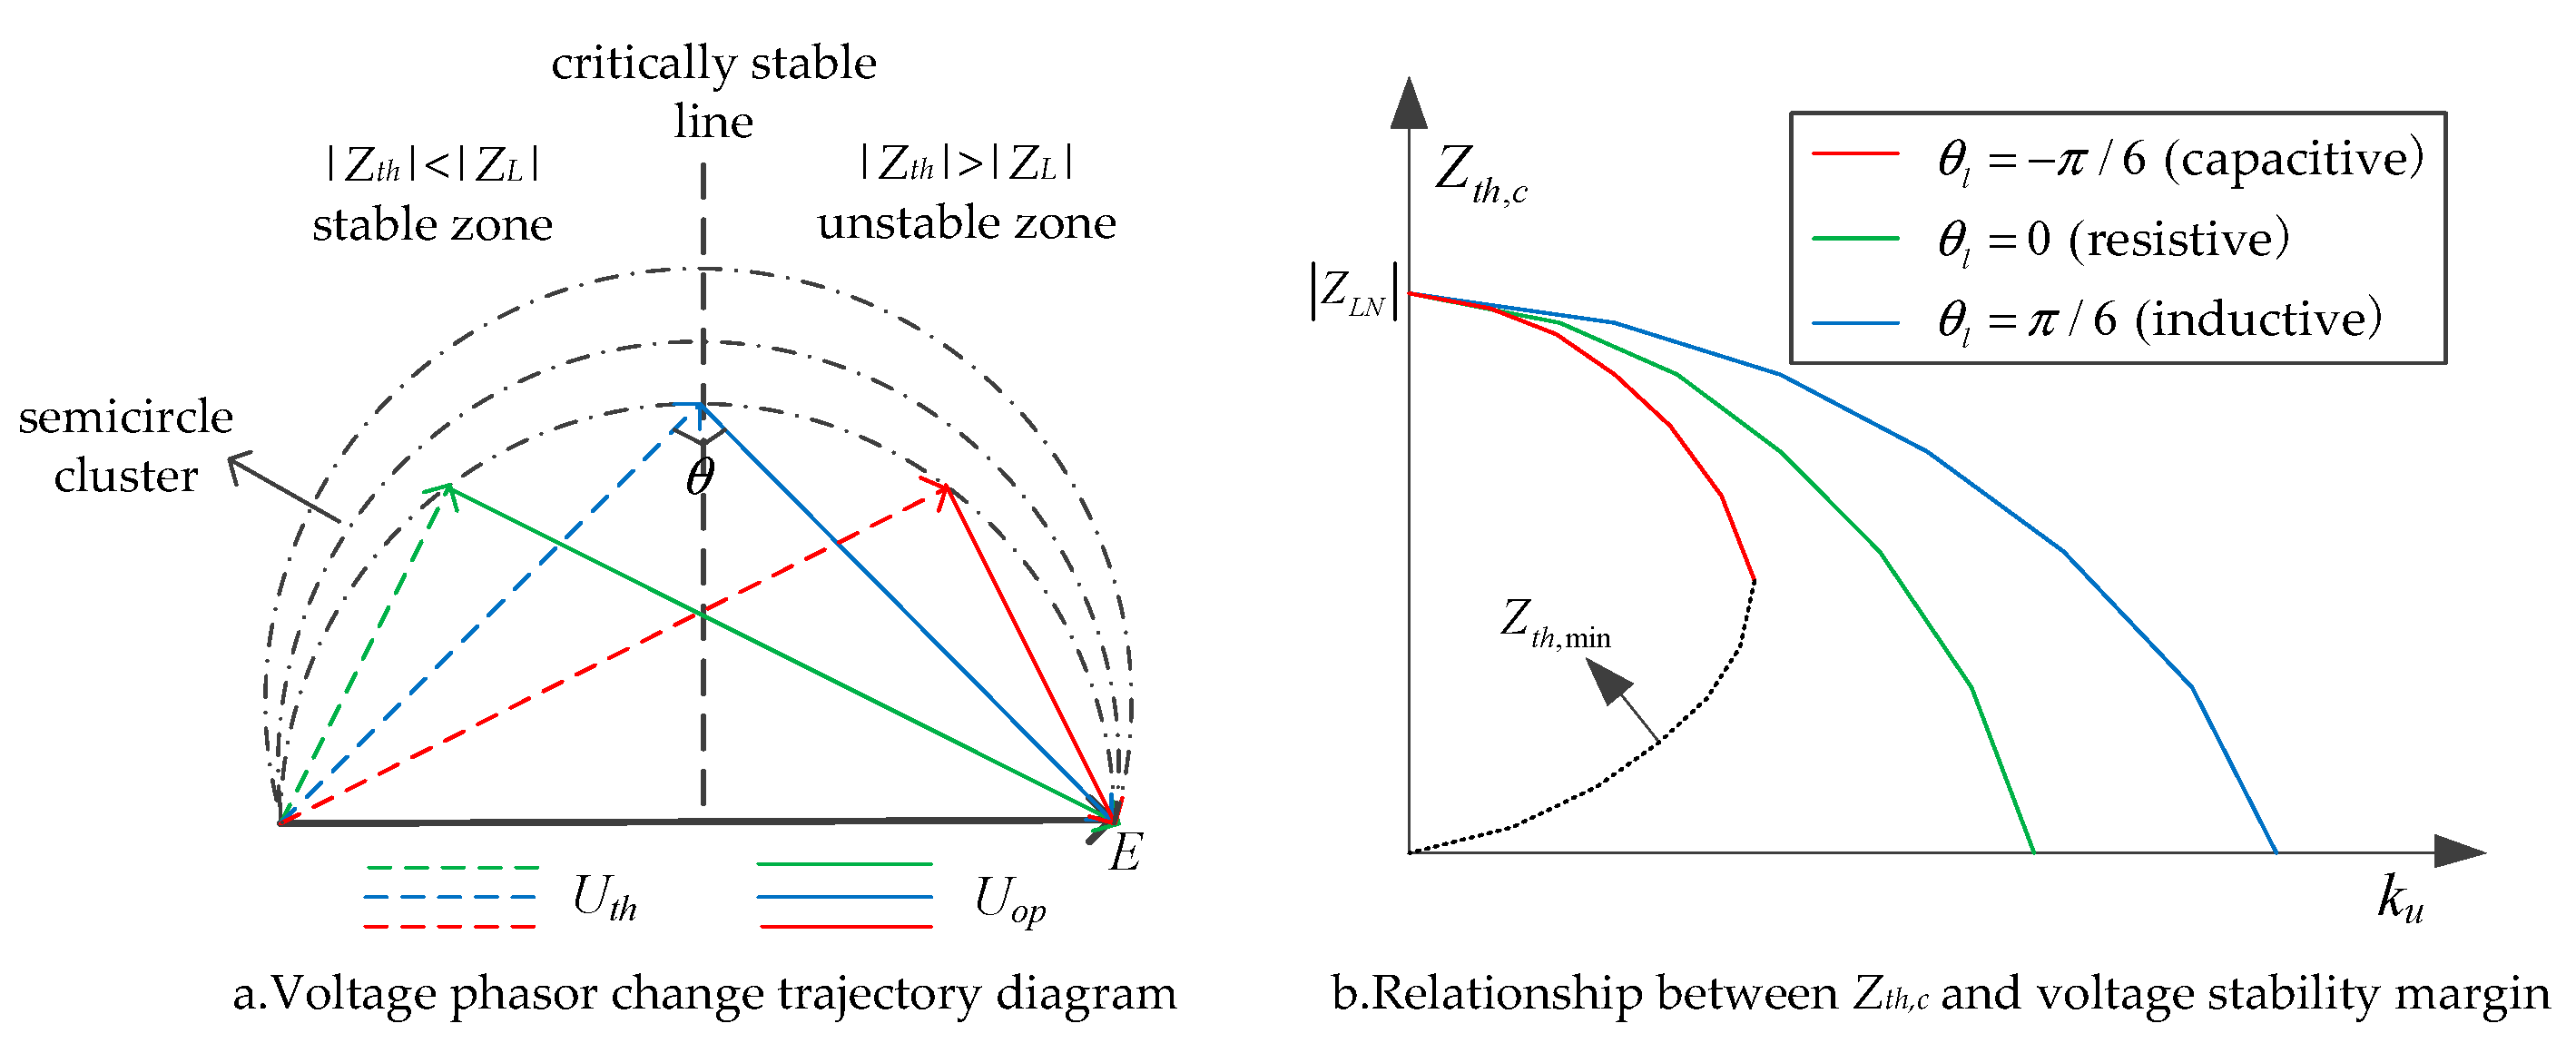
4.1. Thevenin Critical Impedance

According to the provisions of the static stability reserve for the safe operation of the power system, in the normal operation mode, the static stability reserve coefficient should satisfy ku ≥ 10–15% according to the reactive power voltage criterion, and the calculation formula of ku is shown in (6).
k u = U o p U c U o p × 100 %
where Uop is the voltage under normal operation, and Uc is the critical value of voltage stability.
Combining Equations (5) and (6), the minimum operating voltage, Uop,min, under the constraint of the voltage stability margin ku can be obtained as (7):
U o p , min = E 2 cos θ t h θ l 2 ( 1 k u )
It can be seen from Figure 3a that the Thevenin impedance Zth satisfies (8):
| Z t h | = U t h U o p | Z L |
Considering that the line resistance of the transmission network is much smaller than the reactance, the resistive part of the Thevenin equivalent impedance of the system may be ignored for the sake of simplicity, and thus, θ = π / 2 + θ L . Then, the maximum Thevenin critical impedance under the constraint of the voltage stability margin, ku, can be obtained as follows (9):
Z t h , c = U t h , max U o p , min | Z L |
where Z L is the load impedance under the minimum operating voltage, Uop,min, and Uth,max represents the maximum voltage drop of Thevenin impedance, the calculation formula can be described as follows (10):
U t h , max = E 2 U c 2 cos 2 θ l ( 1 k u ) 2 U c sin θ l ( 1 k u )
Combining Formula (4) and Formulas (6)–(10), we find:
Z t h , c = ( k θ l 2 ( 1 k u ) 2 cos 2 θ l sin θ l ) E 2 a 0 E 2 + a 1 k θ l ( 1 k u ) E + a 2 k θ l 2 ( 1 k u ) 2 | Z L N |
In the formula, k θ l = 2 sin ( π / 4 + θ l / 2 ) .
From Equation (11), it is easy to see that the Thevenin critical impedance, Zth,c, is affected by many factors. When the load is a pure constant impedance type, the relationship between Zth,c and the voltage stability margin, ku, is shown in Figure 3b.
It can be seen from Figure 3b that, with the increase in the voltage stability margin requirement, the Thevenin critical impedance drops sharply, and when the load is capacitive, the limit of the Thevenin minimum critical impedance will also appear, which is because the critical voltage calculated according to formula (5) is higher than the rated voltage causing the overvoltage problem. This is similar to the capacity lift effect at the end of a long no-load line. Considering that the load of the power system is mostly inductive, this situation can be ignored.

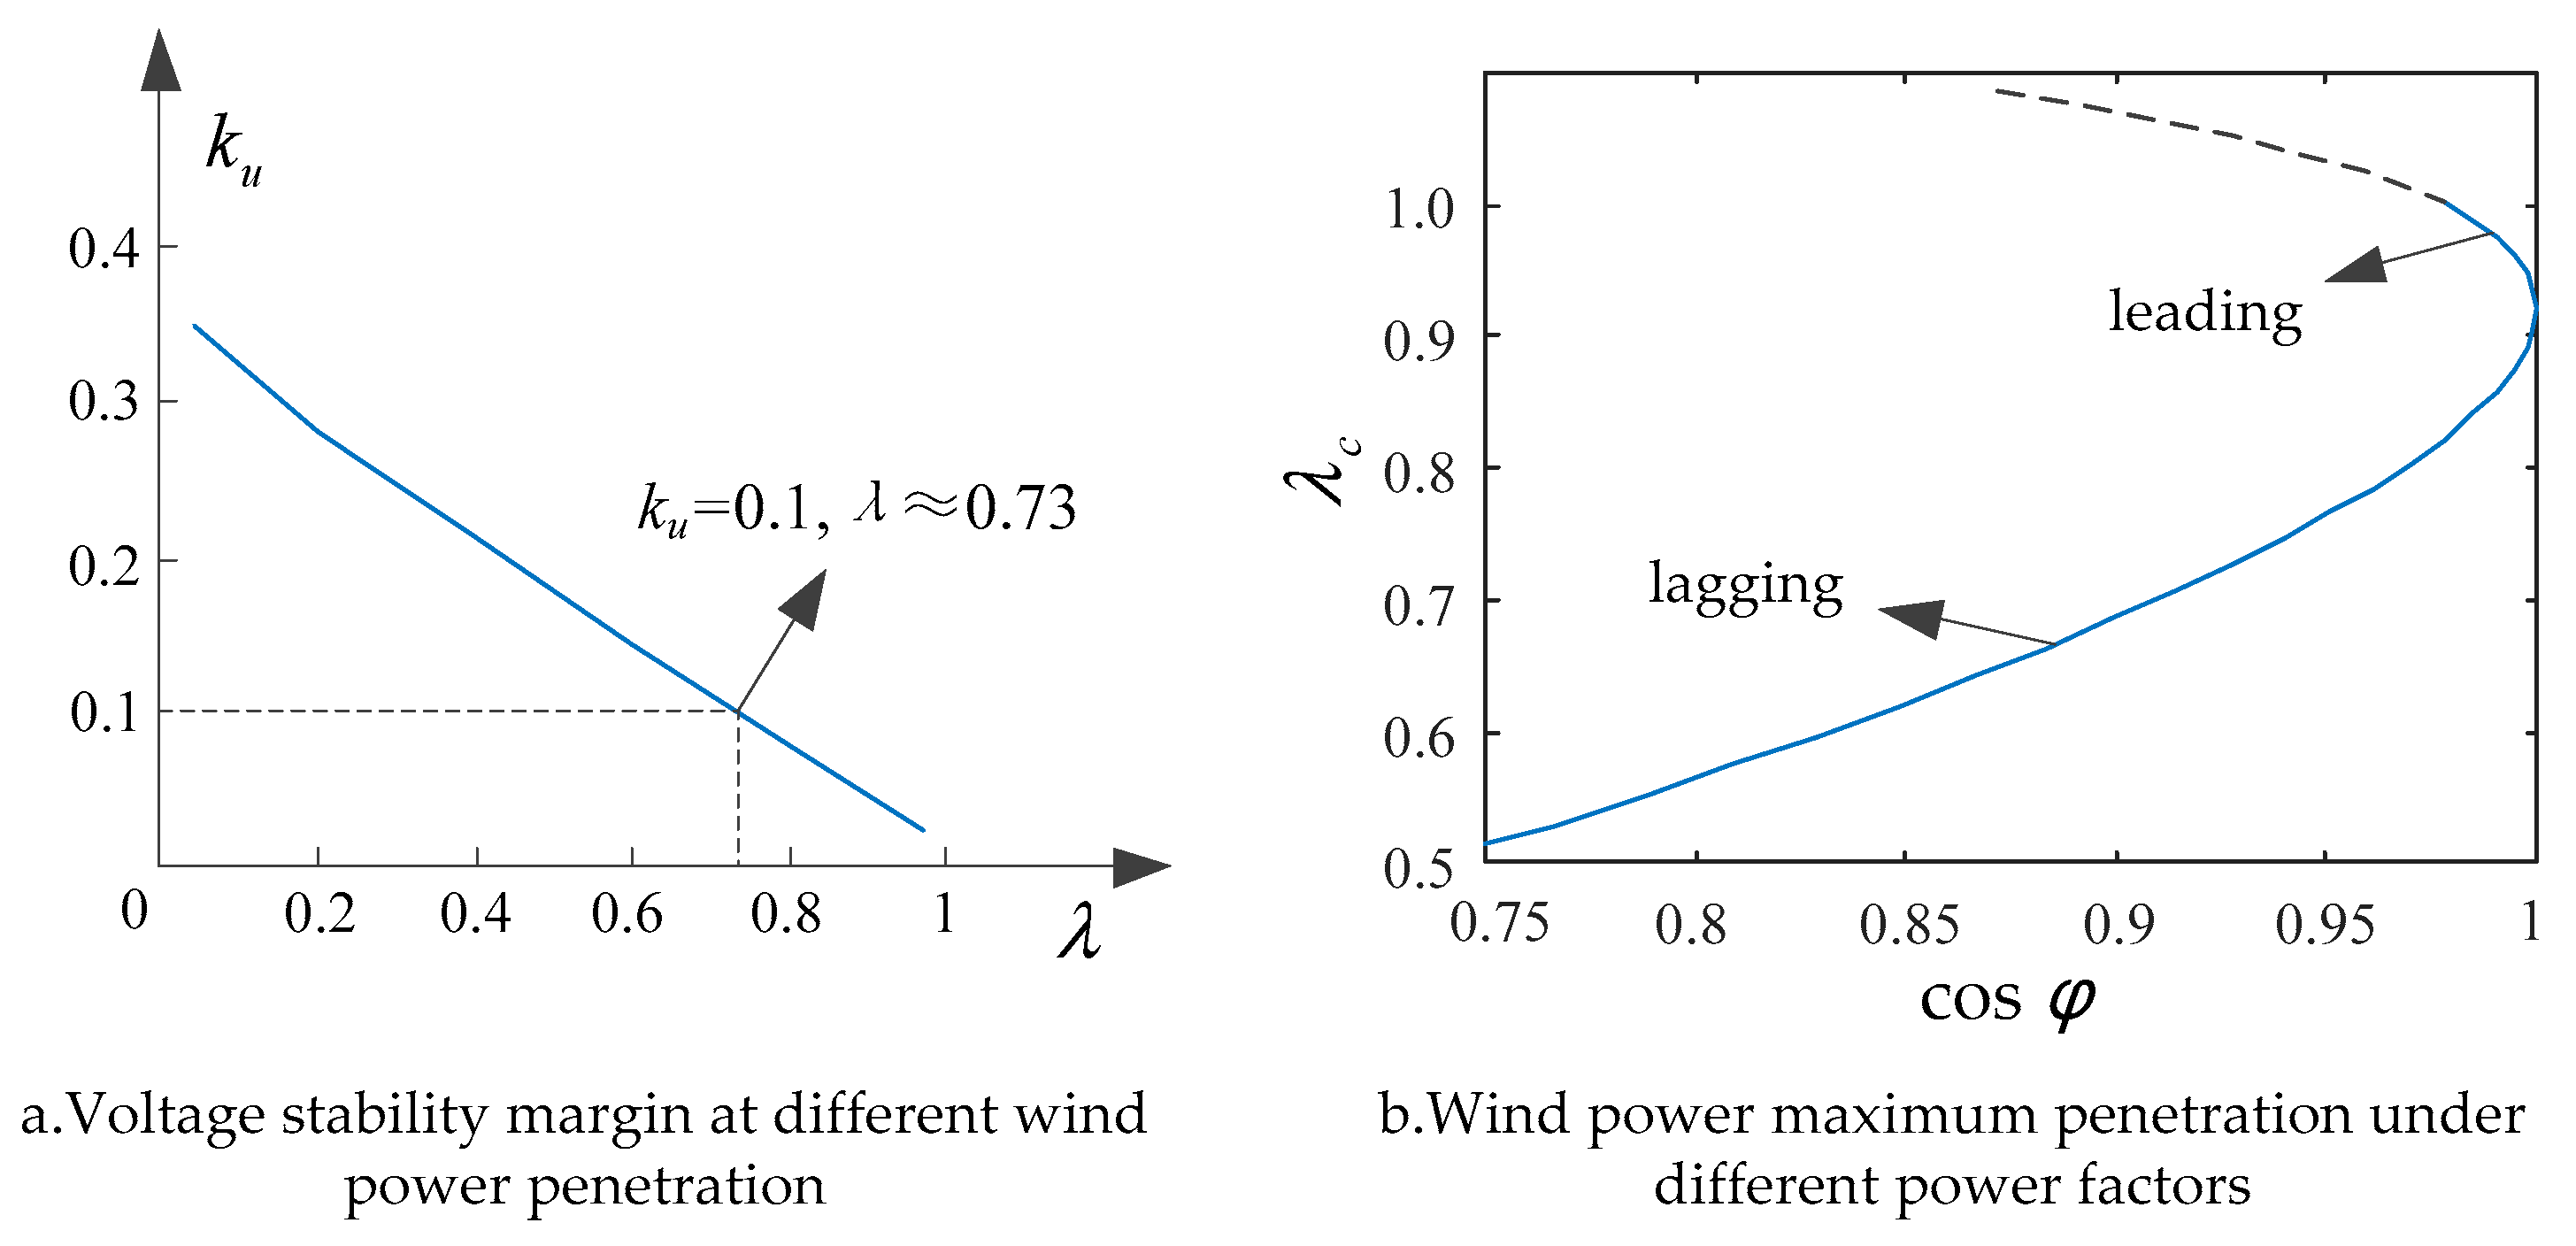
4.2. Maximum Penetration Ratio of Wind Power

To sum up, the calculation formula of Thevenin maximum critical impedance considering the load type under the voltage stability margin constraint is derived. According to Figure 1 and Equation (2), it is easy to know that the Thevenin equivalent impedance from the unit to the load is Zeq+ZST, so it is necessary to satisfy Zeq+ZSTZth,c under the constraint of the voltage stability margin so that the corresponding maximum penetration can be obtained. The formula for calculating the rate, λc, is:
λ c = γ ( Z t h , c Z S G ( 0 ) Z S T ) ( γ 1 ) ( Z t h , c Z S T )
Based on Equations (11) and (12), it is not difficult to find that the maximum penetration rate of wind power under the constraint of the voltage stability margin is affected by many factors, where γ reflects the electrical distance from the wind generator to the grid connection point; ZST represents the connection between the grid connection point and the system; and Zth,c mainly reflects the influence of load, including load type, size and power factor.

5. Case Analysis

5.1. Maximum Wind Power Penetration Calculation

Taking the improved IEEE-9 node as an example, the system is divided into two areas: the sending-end power unit (G1) and the receiving-end power grid (others). The rated load of the receiving-end power grid is 160 MW, and the power factor is 0.94. The power reference value is 100 MVA. The coefficients a0, a1, and a2 of constant impedance, constant current, and constant power load, respectively, are each taken as one third, and the grid-connected line impedance multiple γ, after the wind generator replaces the conventional one, is set to four, and the voltage stability margin ku is taken as 10%, as required. Using Formula (12), the maximum penetration rate of wind power is calculated to be 74.7%.
In order to verify the correctness of the method in this paper, keeping the conditions of the example unchanged, the continuous power flow method is used to calculate the voltage stability margin of the system under different penetration rates, in which the load growth mode is the constant power factor, and the calculation results obtained are shown in Figure 4a.
It can be seen from Figure 4a that the maximum wind power permeability calculated by continuous power flow is about 73%, which is basically consistent with the calculation result of Formula (12). This shows the feasibility of the method in this paper. Compared to complex continuous power flow, the analytical calculation formula of maximum wind power permeability under the voltage stability margin constraint proposed by this paper is intuitive, simple, and practical.

5.2. Influencing Factors Analysis of Maximum Wind Power Penetration Rate

5.2.1. Load Power Factor

By adjusting the load power factor and keeping the rated load impedance and other conditions unchanged, the maximum penetration rate of wind power under the constraint of a voltage stability margin of 10% is calculated, and the results are shown in Figure 4b.
It can be seen from Figure 4b that, with the increase in the load power factor (hysteresis), the maximum penetration rate of wind power increases gradually. When the power factor becomes advanced, the penetration rate will further increase and even reach the 100% level. Considering that the grid load is mostly inductive, and that it is also subject to other safety constraints, such as overvoltage and power angle stability during operation, the maximum penetration rate of wind power may not actually reach 100%, but the results in Figure 4b indicate that increasing the power factor of the grid load within a certain range is beneficial to the access of wind power.

5.2.2. Load Type Ratio

Keeping other conditions unchanged, the corresponding maximum penetration rate of wind power is calculated only by adjusting the values of various types of load ratios, a0, a1, and a2, in the power grid. The results are shown in Table 1.
It can be seen from Table 1 that: (1) There are differences in the maximum penetration rate of wind power under different load types ratios. The increase in the ratio of constant impedance load and constant current load has a lifting effect on the maximum penetration rate of wind power, and the former’s lifting effect is more obvious. (2) The increase in the constant power load ratio will significantly reduce the maximum penetration rate of wind power. On the other hand, it also shows that the traditional load model, when only considering the constant power type, is more conservative. The use of the ZIP load model is not only more practical, but also improves system voltage stability, which is more conducive to the access of wind power.

5.2.3. Grid-Connected Node

Keeping other conditions unchanged, only adjusting the grid-connected nodes of wind generators, and randomly selecting nodes 4, 5, 6, 7, and 8 as examples, the connection impedance between each node and the system can be found, and the corresponding calculation results are shown in Table 2.
It can be seen in Table 2 that, the smaller the connection impedance between the grid-connected point and the system, the greater the maximum wind power penetration rate. This shows that selecting a node that is closely related to the electrical distance of the system, that is, with a larger short-circuit capacity, can effectively improve the maximum wind power penetration rate under the constraint of the voltage stability margin.

5.2.4. Grid-Connected Line Impedance

Keeping other conditions unchanged, the corresponding maximum permeability of wind power can be calculated only by adjusting the γ value, which can reflect the impedance of the transmission line from the wind generator to the grid-connected node. The results are shown in Figure 5.
It can be seen from Figure 5a that, as the impedance of the wind power grid-connected transmission line increases, the maximum penetration rate of wind power gradually decreases. It shows that the long-distance transmission of wind power limits the access capacity level of wind power to a certain extent; thus, reducing the impedance of the grid-connected line can effectively improve the maximum wind power penetration rate under the constraint of the voltage stability margin. In practical projects, measures such as multi-circuit lines, split conductors, and series compensation TCSC can be used.

5.2.5. Generator Terminal Voltage

Keeping other conditions unchanged, by changing the terminal voltage of the generator and considering the actual adjustment range, and then setting the value of E to vary between 0.9 and 1.1, the corresponding maximum permeability of wind power can be calculated. The results are shown in Figure 5b.
It can be seen from Figure 5b that increasing the terminal voltage can increase the maximum permeability of wind power, but there is a certain saturation effect. In addition, it is also affected by insulation factors in actual operation, so increasing the terminal voltage has a limited effect on improving the maximum penetration rate of wind power.

5.2.6. Reactive Power Compensation Capacity

Keeping other conditions unchanged, by gradually increasing the reactive power compensation capacity of the wind power grid connection point, the corresponding maximum wind power penetration rate can be calculated, and the results are shown in Figure 5c.
It can be seen from Figure 5c that, as the capacity of reactive power compensation equipment increases, the maximum penetration rate of wind power has an upward trend, which is similar to increasing the power factor of the load. Therefore, measures such as parallel capacitors and static var compensator (SVC) can be used in practical projects to improve the maximum wind power penetration rate under the constraint of the voltage stability margin.

5.2.7. Receiver Power Grid Strength

Grid strength can be characterized by short-circuit capacity, so it is closely related to the number of grid power sources. For simplicity, this paper simulates the change in grid strength by setting the number of PV nodes in the receiving-end grid, keeping other conditions unchanged. The calculation results of maximum wind power permeability are shown in Table 3.
It can be seen from Table 3 that increasing the number of PV nodes in the system can improve the maximum penetration of wind power. This can be explained from two perspectives: (1) From the perspective of the grid, adding a PV node is equivalent to adding a reactive power source, which enhances the voltage support capability of the system. (2) From a circuit perspective, the PV node is equivalent to a voltage source, reducing the Thevenin connection impedance between the grid connection point and the system, which is beneficial to the system voltage stability. This shows that, the stronger the power grid at the receiving end is, the greater the maximum penetration rate of wind power is. Therefore, measures to enhance the strength of the power grid at the receiving end, such as optimizing the grid structure and improving the interconnection of the power grid, can be adopted in an actual project to facilitate the access of wind power.

5.2.8. Voltage Stability Margin

The maximum wind power permeability in the above research is calculated under the condition that the voltage stability margin is 10%. Next, the system voltage stability margin is taken as a single variable to study its influence on maximum wind power permeability. The calculation results are as follows (Figure 5d).
As can be seen from Figure 5d, as the voltage stability margin requirement increases, the maximum wind power penetration rate will drop rapidly. When the voltage stability margin reaches by 20%, the maximum wind power penetration rate is only about 37%, which is also consistent with the change trend in Figure 3b. Obviously, this is because the system has higher requirements for voltage stability, and it only shows the negative impact on the system voltage stability after the wind generators replace the conventional ones. It is worth mentioning that this result was obtained under the conditions of the example studied in this paper. If the above measures to improve the maximum permeability of wind power are taken, the curve in Figure 5d will move upward.

6. Conclusions

The voltage stability problem has become a key factor restricting the further improvement of wind power penetration. From the perspective of the voltage stability margin constraint, this paper studies the calculation problem of maximum wind power permeability, and the conclusions are as follows:
(1) Through the established wind generator grid-connected model and the derivation of the theoretical formula, an analytical solution method for maximum wind power penetration under the constraint of the voltage stability margin is proposed, which avoids complex dynamic simulation and optimization calculation. The effectiveness is verified by a case study, and the results help to form a forward-looking understanding of the grid’s ability to accept wind power from the perspective of voltage stability.
(2) The research shows that the maximum penetration rate of wind power is affected by many factors, such as terminal voltage, grid-connected line impedance, grid-connected nodes, reactive power compensation capacity, load model and power factor, power grid strength, etc. Based on this, this paper summarizes the engineering and practical measures to improve the maximum penetration rate of wind power, which has certain references for the planning and operation of a power system.
Of course, the calculation of maximum wind power penetration is a wide-ranging problem, and it is also affected by many other factors. For example, wind power has the characteristics of low inertia and anti-peak regulation, and its maximum penetration rate will be constrained by the requirements of power grid peak and frequency regulation. In addition, as more and more mobile flexible loads are connected to the active distribution network (ADN) [26], research on the maximum penetration rate of wind power needs to establish an optimization model combining the demand response potential of different types of ADN loads, which is worth further study.

Author Contributions

Conceptualization, C.L.; methodology, Y.W. funding acquisition, C.L.; resources, C.L. and Y.H.; software, Y.L. (Yi Luo); writing—original draft preparation, Y.W. and X.Y.; writing—review and editing, M.T.; visualization, Y.L. (Yu Liang) and J.N. All authors have read and agreed to the published version of the manuscript.

Funding

This work was supported by the Science and Technology Project of the China Southern Power Grid (2800002021030304GH00006).

Institutional Review Board Statement

Not applicable.

Informed Consent Statement

Not applicable.

Data Availability Statement

The main data in this study are available in the paper.

Conflicts of Interest

The authors declare no conflict of interest.

References

  1. The Central People’s Government of the People’s Republic of China. Xi Jinping Delivered an Important Speech at the General Debate of the 75th United Nations General Assembly [EB/OL]. Available online: http://www.gov.cn/xinwen/2020-09/22/content_5546168.htm (accessed on 22 September 2020).
  2. National Bureau of Statistics of China. 2021 Statistical Bulletin on National Economic and Social Development [EB/OL]. Available online: http://www.stats.gov.cn/tjsj/zxfb/202202/t20220227_1827960.html (accessed on 28 January 2022).
  3. Chen, G.; Dong, Y.; Liang, Z. Analysis and reflection on high-quality development of renewable energy with Chinese characteristics in energy transition in energy transition. Proc. CSEE 2020, 40, 5493–5506. [Google Scholar] [CrossRef]
  4. Sun, H.; Xu, T.; Guo, Q.; Li, Y.; Lin, W.; Yi, J.; Li, W. Analysis on blackout in Great Britain Power Grid on August 9th, 2019 and its enlightenment to power grid in China. Proc. CSEE 2019, 39, 6183–6191. [Google Scholar] [CrossRef]
  5. Wang, W.; Lin, W.; He, G.; Shi, W.; Feng, S. Enlightenment of 2021 Texas blackout to the renewable energy development in China. Proc. CSEE 2021, 41, 4033–4043. [Google Scholar] [CrossRef]
  6. Weisser, D.; Garcia, R.S. Instantaneous wind energy penetration in isolated electricity grids: Concepts and review. Renew. Energy 2005, 30, 1299–1308. [Google Scholar] [CrossRef]
  7. Ahmadi, H.; Ghasemi, H. Maximum penetration level of wind generation considering power system security limits. IET Gener. Transm. Distrib. 2012, 6, 1164–1170. [Google Scholar] [CrossRef]
  8. Jiang, P.; Yan, D.; Wu, X. Research on penetration level of intermittent energy considering wind and PV hybrid system. Power Syst. Technol. 2013, 37, 1965–1970. [Google Scholar]
  9. Lin, H.M.; Liu, T.Q.; Li, X.Y.; Wang, J.; Li, Q.; Qijiang, P.S.B. A computational model of wind power penetration limit considering transient stability. Power Syst. Prot. Control 2013, 41, 47–52. [Google Scholar]
  10. Bai, H.; Zhang, P.; Su, J. Model study for determining the wind farm penetration limit based on corrected energy function and credibility theory. Trans. China Electrotech. Soc. 2017, 32, 264–273. [Google Scholar] [CrossRef]
  11. Zhang, J.; Chao, Q.; Duan, X.; Yuan, T.J. Research on maximum access capacity of wind farm based on dynamic constraints. Power Syst. Prot. Control 2011, 39, 62–66, 73. [Google Scholar]
  12. Zhang, Y.; Zhang, H.; Yao, D.; Li, Q. Research on the wind power penetration limit in power system. Telkomnika Indones. J. Electr. Eng. 2013, 11, 4433–4438. [Google Scholar] [CrossRef]
  13. Zhao, S.S.; Zhou, Q.Y.; Zhao, Q.; Tang, Y. Research on maximum penetration level of wind generation considering frequency constraint. Proc. CSEE 2018, 38, 24–31. [Google Scholar] [CrossRef]
  14. Li, S.C.; Tang, H.Y.; Deng, C.H. Calculation of wind power penetration limit involving frequency constraints and frequency regulation control of wind generators. Autom. Electr. Power Syst. 2019, 43, 33–43. [Google Scholar] [CrossRef]
  15. Zhang, Y.; Wang, Z.; Lei, Y.; Wu, D.; Cheng, R.; Hua, D. An evaluation method for the maximum penetration of wind power of district power grid based on the self-organization criticality. Power Syst. Prot. Control 2019, 47, 9–15. [Google Scholar]
  16. Zhang, H.; Zhang, L.; Jiang, W. Calculation method for maximum penetration ratio of wind power in wind-thermal-bundled HVDC sending system. Autom. Electr. Power Syst. 2019, 43, 52–57. [Google Scholar] [CrossRef]
  17. Mou, P. Influence of High Penetration Wind Power Integration Power System Stability; North China Electric Power University: Beijing, China, 2017. [Google Scholar]
  18. Han, X.; Sun, S.; Qi, Q. Evaluation of wind power penetration limit from peak regulation from the perspective of system peak regulation. China Electr. Power 2010, 43, 16–19. [Google Scholar]
  19. Yi, J.; Lin, W.; Yu, F.; Lin, A.; Yang, F. Calculation method of critical permeability of renewable energy constrained by static voltage stability. Power Syst. Technol. 2020, 44, 2906–2912. [Google Scholar]
  20. Mao, A.; Ma, J.; Kuai, S. Evolution mechanism of transient and voltage stability for power system with high renewable penetration level after high proportion of renewable energy replaces conventional power supply. Proc. CSEE 2020, 40, 2745–2755. [Google Scholar] [CrossRef]
  21. Dai, J.F.; Tang, Y.; Wang, Q. Fast method to estimate maximum penetration level of wind power considering frequency cumulative effect. IET Gener. Transm. Distrib. 2019, 13, 1726–1733. [Google Scholar] [CrossRef]
  22. Minhan, Y.; Jang, Y.T.; Jang, G. A study on maximum wind power penetration limit in Island power system considering high-voltage direct current interconnections. Energies 2015, 8, 14244–14259. [Google Scholar] [CrossRef] [Green Version]
  23. Wang, M.; Qiu, C. A multiobjective optimization-based calculation framework of maximum wind power penetration limit considering system transient stability. Int. Trans. Electr. Energ. Syst. 2020, 30, e12465. [Google Scholar] [CrossRef]
  24. Ye, M.; Liu, Y.; Gu, X.; Han, S.; Wang, S. Calculation of dynamic wind power penetration limit considering system transient safety under background of blackout. Electr. Power Autom. Equip. 2018, 38, 167–173. [Google Scholar] [CrossRef]
  25. Liu, S.; Cao, Y.; Liu, G. Optimal Allocation Method of Dynamic Var Compensator Based on the Impedance Modulus. Proc. CSEE 2014, 34, 3791–3798. [Google Scholar] [CrossRef]
  26. Li, Z.; Su, S.; Jin, X.; Chen, H.; Li, Y.; Zhang, R. A hierarchical scheduling method of active distribution network considering flexible loads in office buildings. Int. J. Electr. Power Energy Syst. 2021, 131, 106768. [Google Scholar] [CrossRef]
Figure 1. Grid-connected model of wind generators.
Sustainability 14 07217 g001
Figure 2. Thevenin equivalent circuit model.
Sustainability 14 07217 g002
Figure 3. Voltage stability margin analysis based on Thevenin equivalent.
Sustainability 14 07217 g003
Figure 4. Voltage stability margin and maximum wind power penetration diagram.
Sustainability 14 07217 g004
Figure 5. Maximum wind power penetration λc change diagram.
Sustainability 14 07217 g005
Table 1. Maximum wind power penetration under different load types.
Load Type ProportionMaximum Wind Power Penetration λc
a0a1a2
0.330.330.3374.7%
0.40.30.379.2%
0.30.40.375.3%
0.30.30.468.9%
0.60.20.290.8%
0.20.60.277.2%
0.20.20.647.1%
Table 2. Maximum wind power penetration under different grid connection nodes.
NodeZSTMaximum Wind Power Penetration λc
40.170j74.7%
50.153j81.4%
60.157j79.9%
70.049j100%
80.075j98.4%
Table 3. Maximum wind power penetration under different numbers of PV nodes.
PV NodeMaximum Wind Power Penetration λc
2, 374.7%
2, 3, 878.8%
2, 3, 5, 896.03%
Publisher’s Note: MDPI stays neutral with regard to jurisdictional claims in published maps and institutional affiliations.

