
Woodland for Sludge Disposal in Beijing: Sustainable?

1
School of Water and Soil Conservation, Beijing Forestry University, Beijing 100083, China
2
China Municipal Engineering Southwest Design and Research Institute Co., Ltd., Chengdu 610056, China
3
Hangzhou Lingjian Data Technology Co., Ltd., Hangzhou 310000, China
*
Author to whom correspondence should be addressed.
Sustainability 2022, 14(12), 7444; https://0-doi-org.brum.beds.ac.uk/10.3390/su14127444
Submission received: 3 May 2022
/
Revised: 3 June 2022
/
Accepted: 16 June 2022
/
Published: 17 June 2022
(This article belongs to the Topic Solid Waste Management)
Abstract
:The sludge products of urban sewage treatment plants in Beijing are increasing year by year, and there is a large amount of stagnation, which requires scientific and reasonable disposal strategies. Currently, the woodland in the mountainous area of Beijing is considered the main means for sludge disposal; however, because the heavy metals in the sludge may cause potential pollution to the soil and groundwater, it is unclear how much sludge can be applied per unit area. To ensure the sustainable disposal of sludge, it is necessary to measure the risk of heavy metals on soil and groundwater under different sludge application rates to determine the most scientific disposal plan. In this study, the undisturbed soil columns obtained from the field were used to clarify the migration behaviors and accumulation of eight hazardous heavy metals under simulated rainfall conditions, and three sets of tests (the application rates of sludge products were 30 t·ha−1·a−1, 60 t·ha−1·a−1 and 120 t·ha−1·a−1 respectively) were set based on the supply–demand relationship between Beijing’s annual sludge output and the woodland area available for sludge disposal. The results showed that there were significant differences in the migration rules of heavy metals under different application rates, which were mainly reflected in the differences in accumulation in each layer of the soil. In terms of the leaching efficiency of heavy metals, except for Cadmium, the leaching rates of other heavy metals did not exceed 0.1%, indicating that most heavy metals accumulated in the soil. During the application process of sludge products, Arsenic and Cadmium posed a greater potential risk to groundwater than other heavy metals, to which should be paid sufficient attention. Based on the accumulation of heavy metals in soil, Arsenic was the main factor limiting the amount and frequency of sludge product application. The application rate of 60 t·ha−1·a−1 was preferred compared with the other two tests because it presented minimal risk to groundwater and soil in the short term, while the total amount of sludge disposal can be maximized.
Keywords:
sludge products; heavy metals; undisturbed soil column; risk assessment; soil; groundwater1. Introduction
In recent years, as economic development has accelerated and public and governmental consciousness of environmental protection has grown, a large number of sewage treatment facilities were built and renovated in Beijing, and the capacity to treat sewage has rapidly expanded [1]. The number of urban sewage treatment plants in Beijing increased from 41 in 2011 to 108 in 2021. By the end of 2021, the annual treatment capacity of the Beijing sewage treatment plant had reached 1.94 × 10⁸ m3, generating about 1.65 × 10⁶ tons of dry sludge; the total sludge production increased significantly and had an average annual growth of 25.9% [2]. As for proper disposal in China, the most common disposal methods for sludge were sanitary landfills, followed by land application, incineration, and building materials [3]. In Beijing, due to the scarcity of land and the anxiety of government departments about the air quality of the capital, the land application was planned as the primary route for sludge product disposal [4]. Stabilized sewage sludge could be used as a fertilizer in the soil because of nitrogen, phosphorus, and other micronutrition material to improve the properties of the soil [5]. However, the selection of land application objects had been greatly limited. Specifically, the application of sludge to agricultural land was prohibited in China [6], because this approach can result in the accumulation of metals, potentially entering the food chain and threatening human health [7], which made woodland far from the food chain the only acceptable option for sludge product disposal. Unfortunately, despite the widespread distribution of woodland in Beijing, relevant local standards had not yet been issued to regulate the quantity and frequency of sludge application due to the lack of appropriate scientific research, resulting in a large number of sludge products temporarily deposited in sewage treatment plants.
According to statistics obtained from “the second phase of Forestry Project in Sandification-Combating Program for Areas in the Vicinity of Beijing”, nearly 55,000 hectares per year of woodland with low soil fertility in Beijing was available for sludge disposal. In other words, not considering the distance of transport and location of woodland, an application rate of 30 t/ha·a−1 would meet the annual sludge disposal requirements in Beijing. One of the most important factors restricting the large-scale woodland application of sludge products was the heavy metals in them which would present a risk of pollution to soil and groundwater [8], and so far, there was no relevant sludge application standard for woodland. To evaluate the environmental risks of heavy metals following the land application of sludge products, the leaching behavior of heavy metals under different sludge application rates should be investigated.
At present, the soil column leaching experiment is the most convenient and reliable method to study the leaching characteristics of heavy metals after the land application of sludge [9,10]. For example, Feizi and Jalali [11] showed that the addition of sewage sludge decreased Cd and Cu leaching but did not affect Ni and Zn leaching and the presence of nanoparticles and zeolite reduced the leaching of heavy metals; Ma et al. [12] showed that the mobility of various heavy metals in loess followed the order of Pb > Zn > Ni > Cu in 0–40 cm, while Cd migrated more easily than the other metals in 50–55 cm; Fang et al. [13] revealed that the organic matter, including both particulate organic matter and dissolved organic matter, were critical factors influencing heavy metal leaching from both sewage sludge compost and the soil. However, in most studies, on the one hand, the application rate of sludge did not fully consider the relationship between supply and demand, while the water consumption and leaching times of the test failed to consider the local natural rainfall condition, so the design of sludge and water volume lacked specific physical meaning. On the other hand, soil columns of the leaching test were made from repacked soil, which is usually considered a homogeneous medium [14]. These repacked soil samples were air-dried, ground, sieved and then filled into the columns, which would largely destroy the original soil structure, while undisturbed soil had a stable structure that resisted the destructive force of infiltrated water flow. In addition, good bedding structures and fine pore structures are not available in disturbed soil [15,16]. Therefore, previous studies have proved difficult to reflect on the migration and leaching behavior of heavy metals in the actual land application of sludge products as well as their risks to soil and groundwater.
To evaluate the risk of heavy metal pollution to soil and groundwater after woodland application of sludge products, we used the undisturbed soil column instead of the previous self-designed soil columns for the leaching test. The undisturbed soil columns were directly obtained from the woodland soil in the mountainous area of Beijing, maintaining the soil structure to the greatest extent. According to the annual output of sludge products and the area of woodland available for consumption, we set up three sets of application rates equivalent to the current yearly output, double, and quadruple the yearly output. By collecting the natural rainfall data of the sampling location, water consumption and leaching times were designed. Through the undisturbed soil column leaching test, we studied the migration and leaching behavior of eight heavy metals under different sludge application rates, and then evaluated their risks to soil and groundwater by comparing them with relevant standards. Finally, we tried to propose the most appropriate amount of sludge application based on our research results. The purpose of this study was to solve the urgent situation that the sewage treatment plant in Beijing cannot effectively dispose of the sludge due to the unclear sludge application standards for woodland in recent years. Based on the supply and demand relationship between the annual output of sludge products and the area of woodland available for consumption, we assumed three sludge application rates, and evaluated the soil pollution risks and groundwater pollution risks that may be caused by different sludge application rates so as to determine the feasibility and sustainability of the woodland for sludge disposal in Beijing.
2. Materials and Methods
2.1. Test Materials
The sludge products used in this experiment, sampled from the dehydrated sludge after anaerobic digestion in the Gaobeidian Wastewater Treatment Plant of Beijing, are finished products that can be directly applied to the soil without composting treatment, and the background values of the materials were showed in Table 1. The contents of heavy metals in these sludge products can meet the standard of sludge land application [17].
The soil samples used in this experiment, sampled from the woodland of Zhangshanying Town in Yanqing District, were the typical agrotype of the cinnamon soil widely distributed in Beijing’s mountainous area.
2.2. Undisturbed Soil Columns Preparation
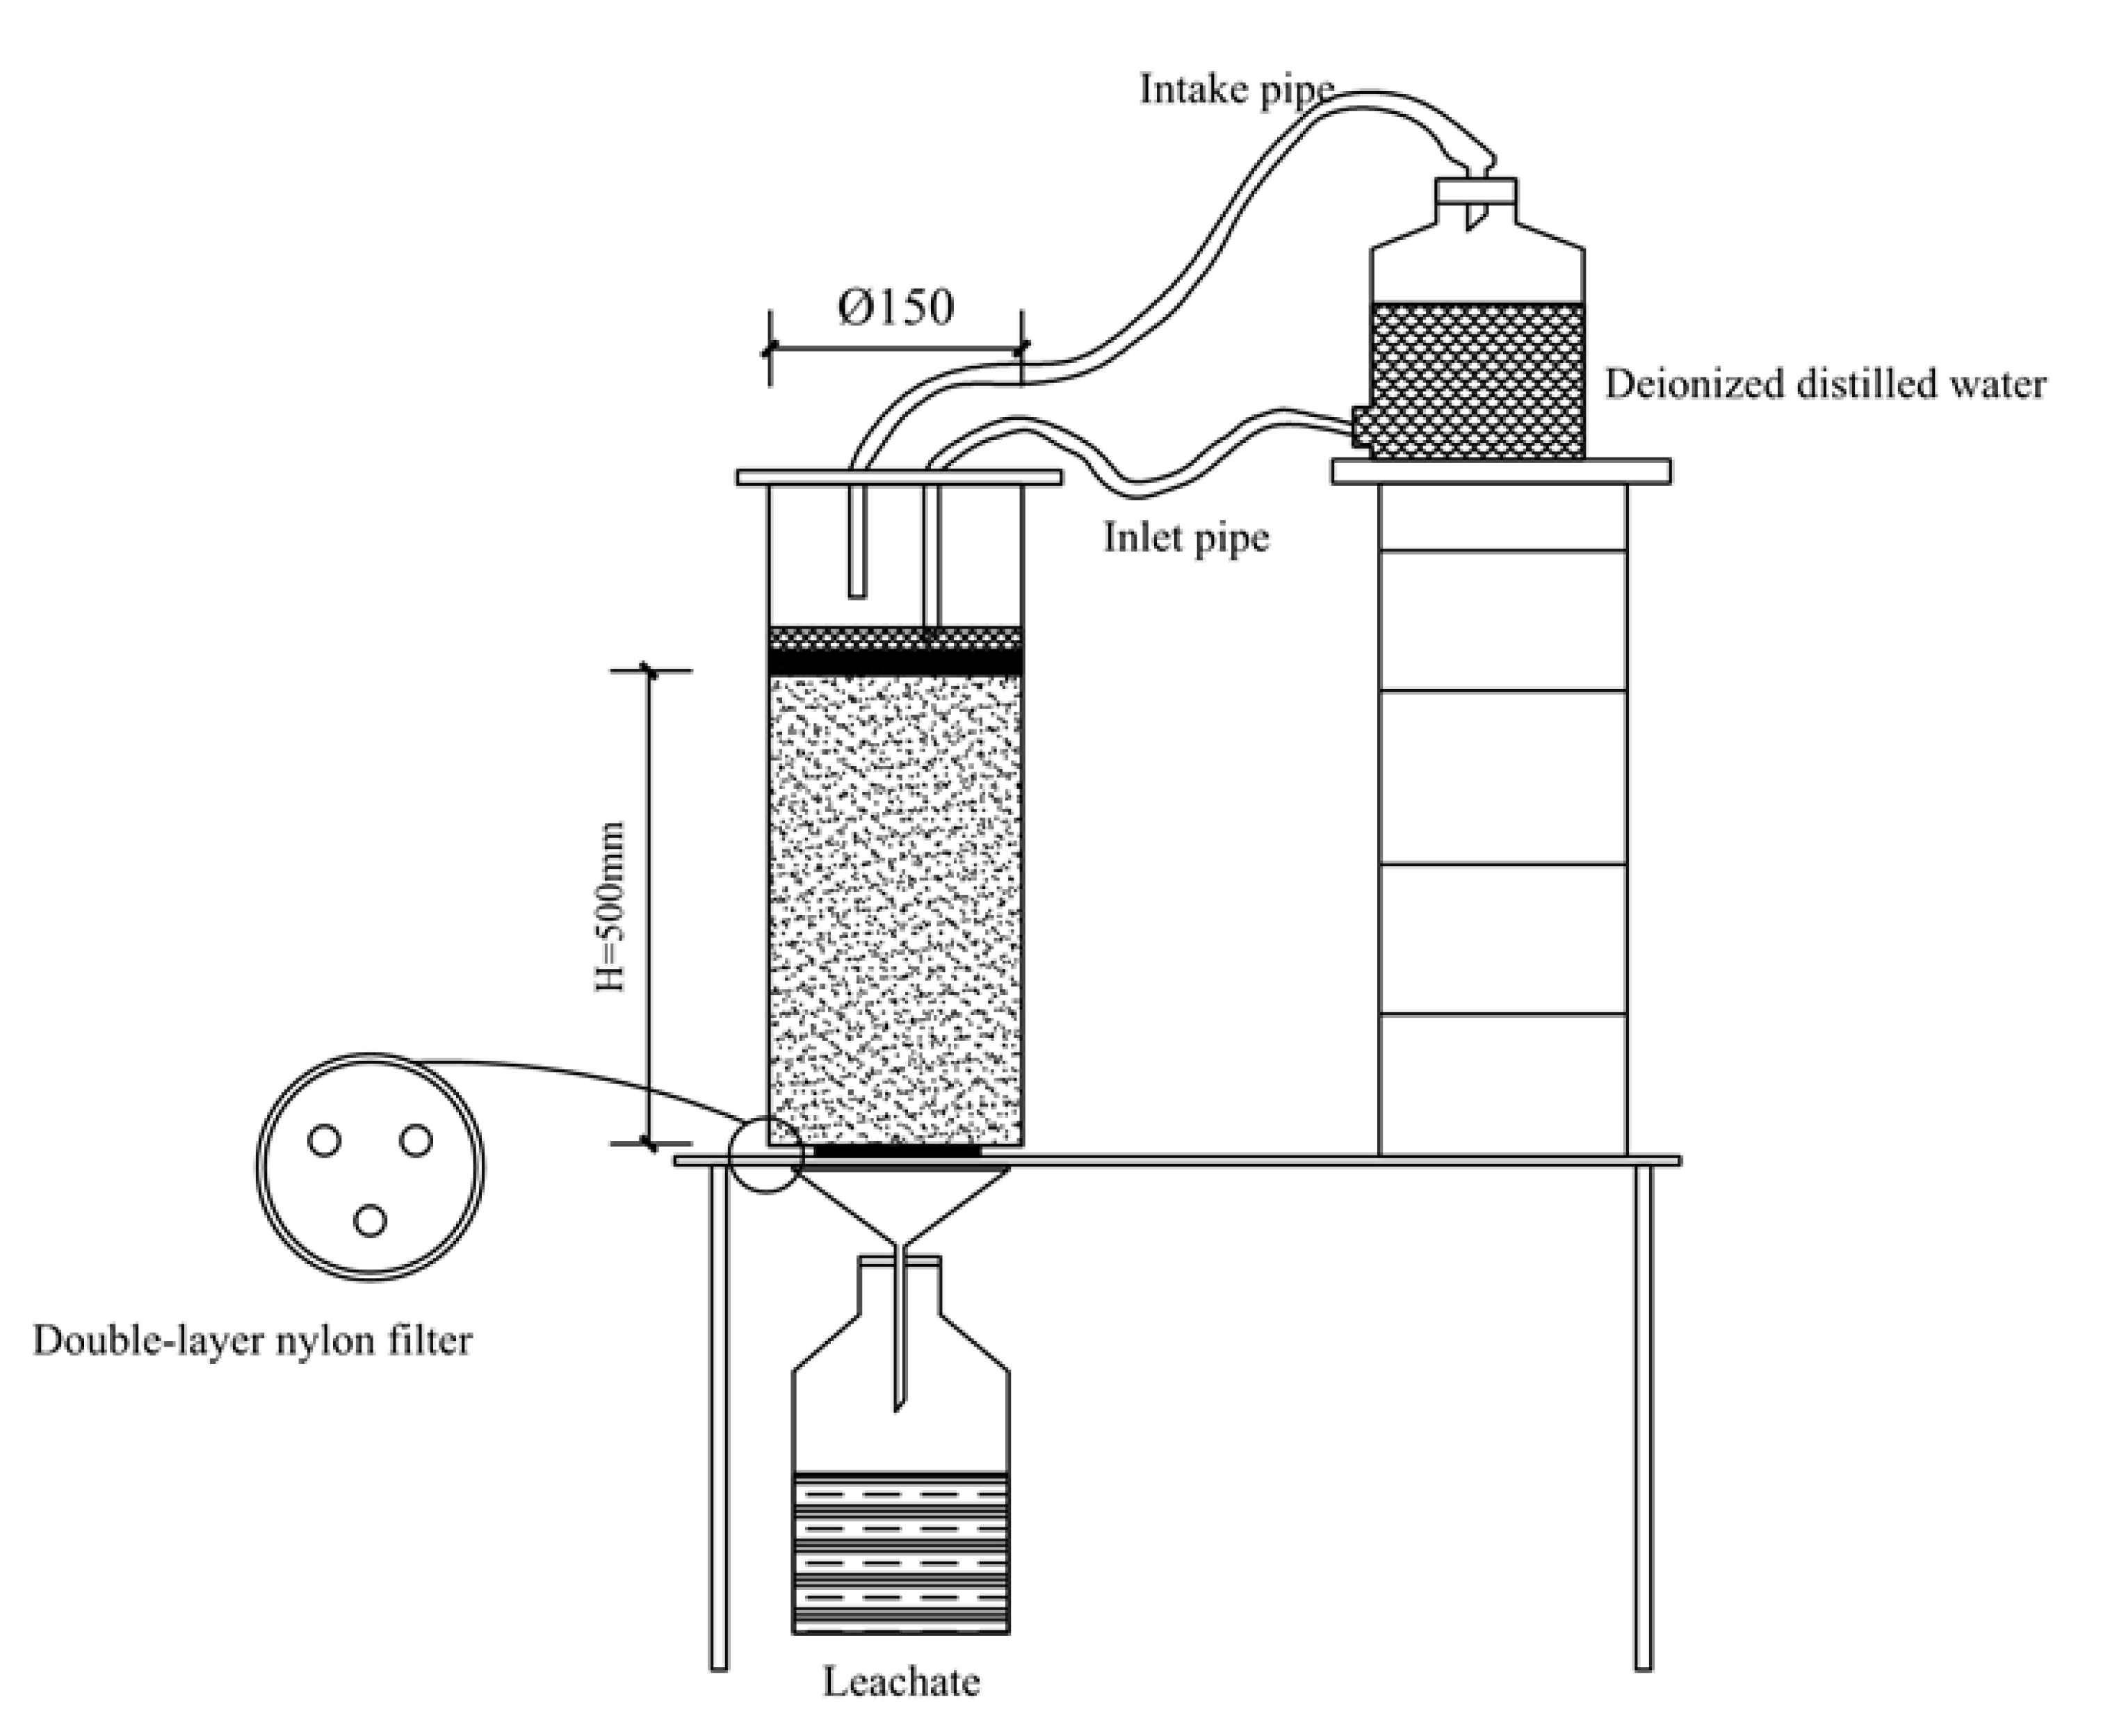
A PVC pipe with a diameter of 15 cm and a height of 60 cm was used as an undisturbed soil column-collecting device. Before sampling, Vaseline was applied to the inner wall of the PVC pipe to eliminate the side wall effect during the later leaching process. We nailed the PVC pipe into the soil to a depth of 50 cm, ensuring that the soil column contained the leaching layer, illuvial layer, and parent material layer of the soil. After that, we excavated the soil profile and carefully removed the PVC pipe from the soil. Then, we cut off the excess soil outside the bottom of the pipe and sealed it with a self-made perforated bottom cover. A double-layer nylon filter was arranged in the bottom cover to avoid the outflow of soil particles from the soil column.
The excavation depth (50 cm) of the soil column in this study was consistent with the relevant research [18]. Although it was much smaller than the buried depth of the groundwater (about 8.8 m), recharge mechanisms for shallow groundwater, especially in low-lying areas, are derived from the infiltration of surface water [19]. With the occurrence of the leaching process, the heavy metal pollutants would gradually accumulate in the seepage interlayer through rock-soil interfaces and weathered rock fissures in slopes, forming a “time bomb” whose migration was a huge risk to groundwater.
2.3. The Leaching Experiment
2.3.1. The Experimental Device
The simulation experiment used the Markov bottle principle to supply liquid. The liquid was fed from the upper end of the soil column to maintain a certain thickness of the liquid layer on the top surface of the column so that the leaching solution was infiltrated only by gravity. The leachate was collected in a 1000 mL jar, and the mouth of the bottle was connected with a funnel to prevent the evaporation of water. The experimental device is shown in Figure 1.
2.3.2. The Experimental Design
Four test groups were prepared: three for adding different sludge amounts (T1-50 g, T2-100 g, T3-200 g; 50 g was equivalent to 30 t/ha·a−1) and one for the control (CK-no sludge). Three replicates were set for each test group. When designing the application rates, we fully considered the annual sludge production in Beijing as well as the area available for sludge disposal in Beijing’s mountainous areas. CK was set to eliminate the interference of the original heavy metal contents in the soil during data analysis. The method of sludge application was based on the technical specifications for the land application of sewage sludge in China, and the sludge was mixed with surface soil via plowing.
The simulated leaching water volume and leaching times were calculated based on the rainfall data of the past 5 years in the Yanqing District of Beijing. Data showed that regional precipitation was mainly concentrated from May to September, during which the rainfall was about 475 mm. So, we used a total of 8.4 L of leaching water to simulate the rainfall of 475 mm. Considering the continuity of rainfall, there were 5 designed leaching times, with 1.68 L each time. Distilled water was used as the simulated rain in the leaching experiment. Table 2 presents a list of the different treatment sets in the leaching tests.
2.4. Methods
2.4.1. Sample Analysis
Heavy metals in the leachate were analyzed by a third-party testing institution that has obtained China’s Metrology Accreditation. The concentrations of Cu, Cr, Ni, Zn, Pb, Cd, and As were analyzed using ICP-MS [20], and the concentration of Hg was detected using ICP-AES [21]. The detection limits for all the elements were 5 µg/L, except for Hg and Cd, which were 0.5 µg/L and 0.1 µg/L. For soil columns, after the leaching test was finished, the PVC pipes were cut from the side, and the samples were layered every 10 cm. We mixed the soil samples taken from each layer and prepared the test soil sample after air-drying and grinding. A small portion (50–100 g) of each layer was sent to the same agency as above for solid analysis.
2.4.2. Statistical Methods
Microsoft Excel, SPSS 20.0, and STATISTICA 10.0 were used for data processing. Regression analysis of the relationship between heavy metal concentration in the leachate, sludge application amount, and leaching water amount was conducted by STATISTICA 10.0, and the response surface methodology was employed by STATISTICA 10.0 to understand the coupling effect of sludge application and leaching water on the net concentration of heavy metals in the leachate.
3. Results and Discussion
3.1. Changes in Heavy Metal Concentration in Leachate and Its Risk to Groundwater
3.1.1. Analysis of Heavy Metal Concentration in Leachate
The concentration of heavy metals in leachate is an important indicator for assessing the risk of groundwater contamination; once the leachate passes through the parent material layer and enters the seepage interlayer, it can enter the groundwater through rock fissures. Therefore, we investigated the concentration of heavy metals in leachate under four treatment groups during five leaching processes. At the same time, the three sludge addition groups were corrected by the CK group to obtain a net concentration of heavy metals in leachate after each test.
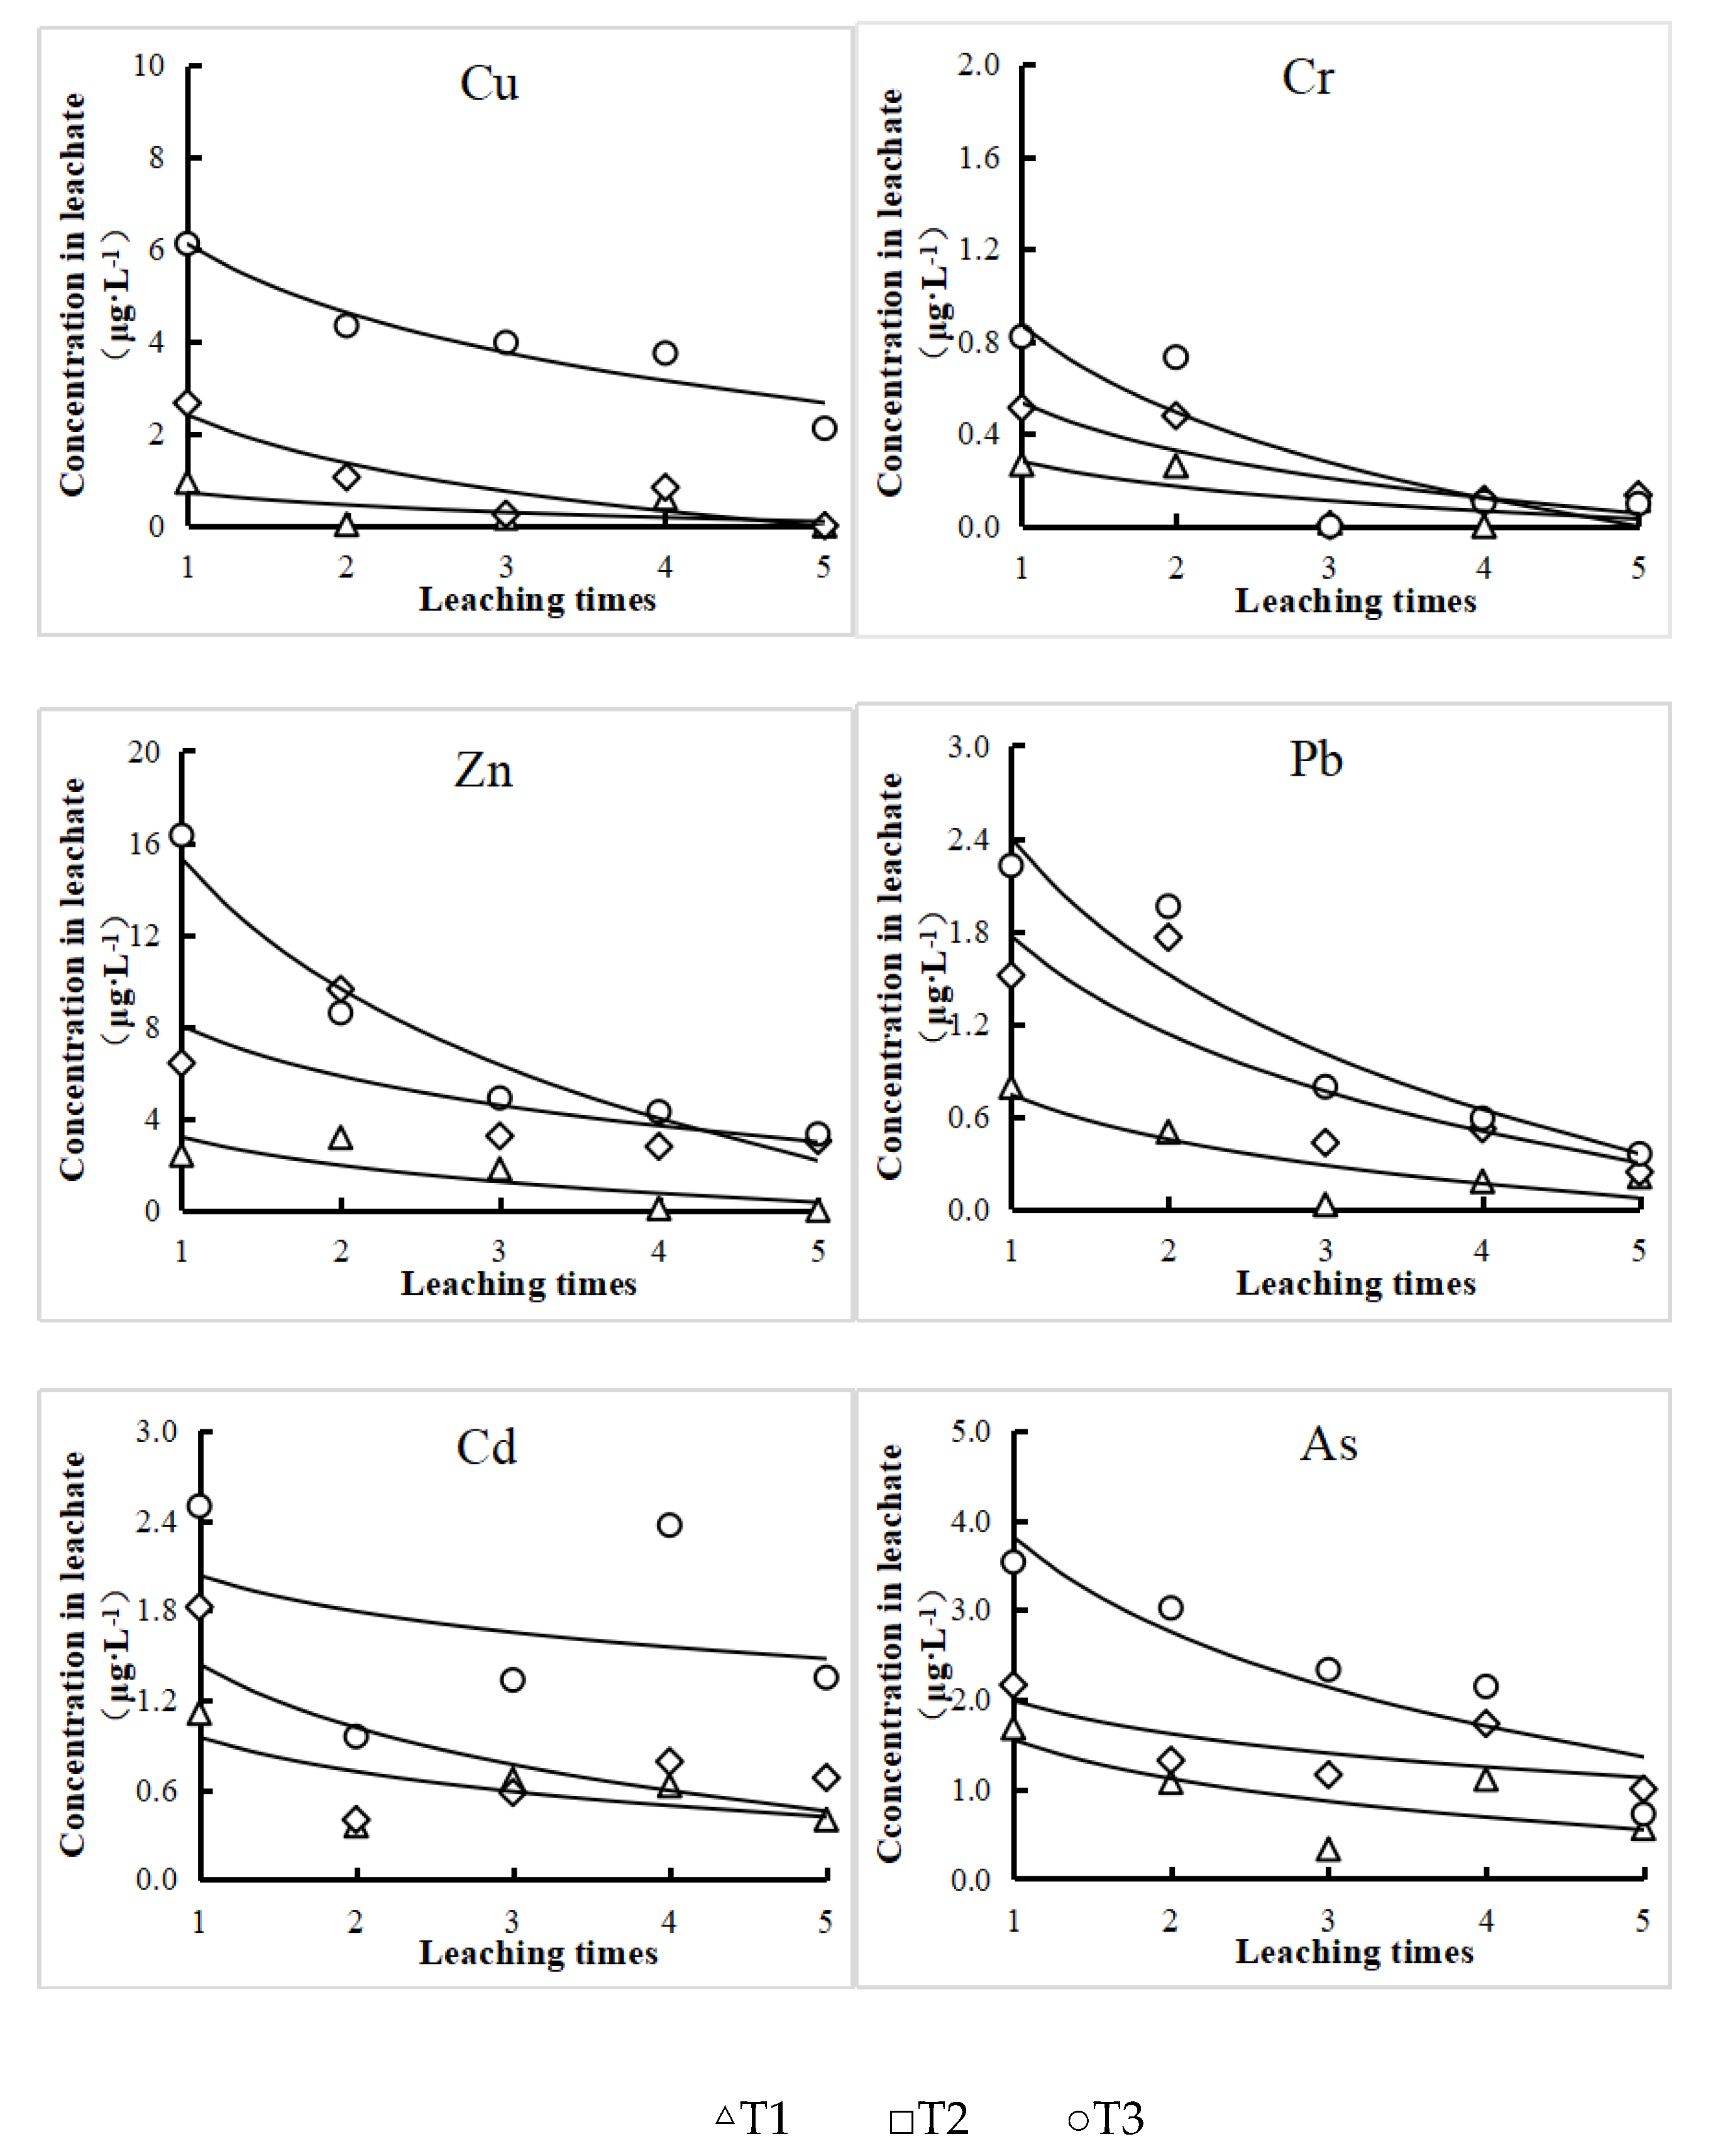
Figure 2 shows the change in the net concentration of six heavy metals in leachate (without Ni and Hg because they were not detected in the leachate) with the number of leaching times. The relationship between the concentrations of the six elements in the leachate was Zn > Cu > As > Cd, Pb > Cr. In general, the concentration of heavy metals in leachate behaved a downward trend as the number of leaching increased, but it could also be found there were conspicuous fluctuations in the leaching process such as Pb concentration in the leachate obtained from T2 and Cd concentration in the leachate obtained from T3. For Pb, under the T2 group, its fluctuation appeared after the second leaching, and the reason for this fluctuation was that the Pb concentration of the second leaching was extremely high, while the Pb concentration of the third leaching was extremely low. For Cd, under the T3 group, its fluctuation appeared after the second leaching and the fourth leaching, and the reason for this fluctuation was that the Cd concentration of the second leaching was extremely low, while the Cd concentration of the fourth leaching was extremely high. The above fluctuation may be caused by the competitive sorption–desorption behavior under the coexistence of Pb and Cd [22]. Relevant studies have shown that the release of Pb in the soil increased first and then decreased, and the release of Cd was closely related to the alternating cycle of soil moisture [23].
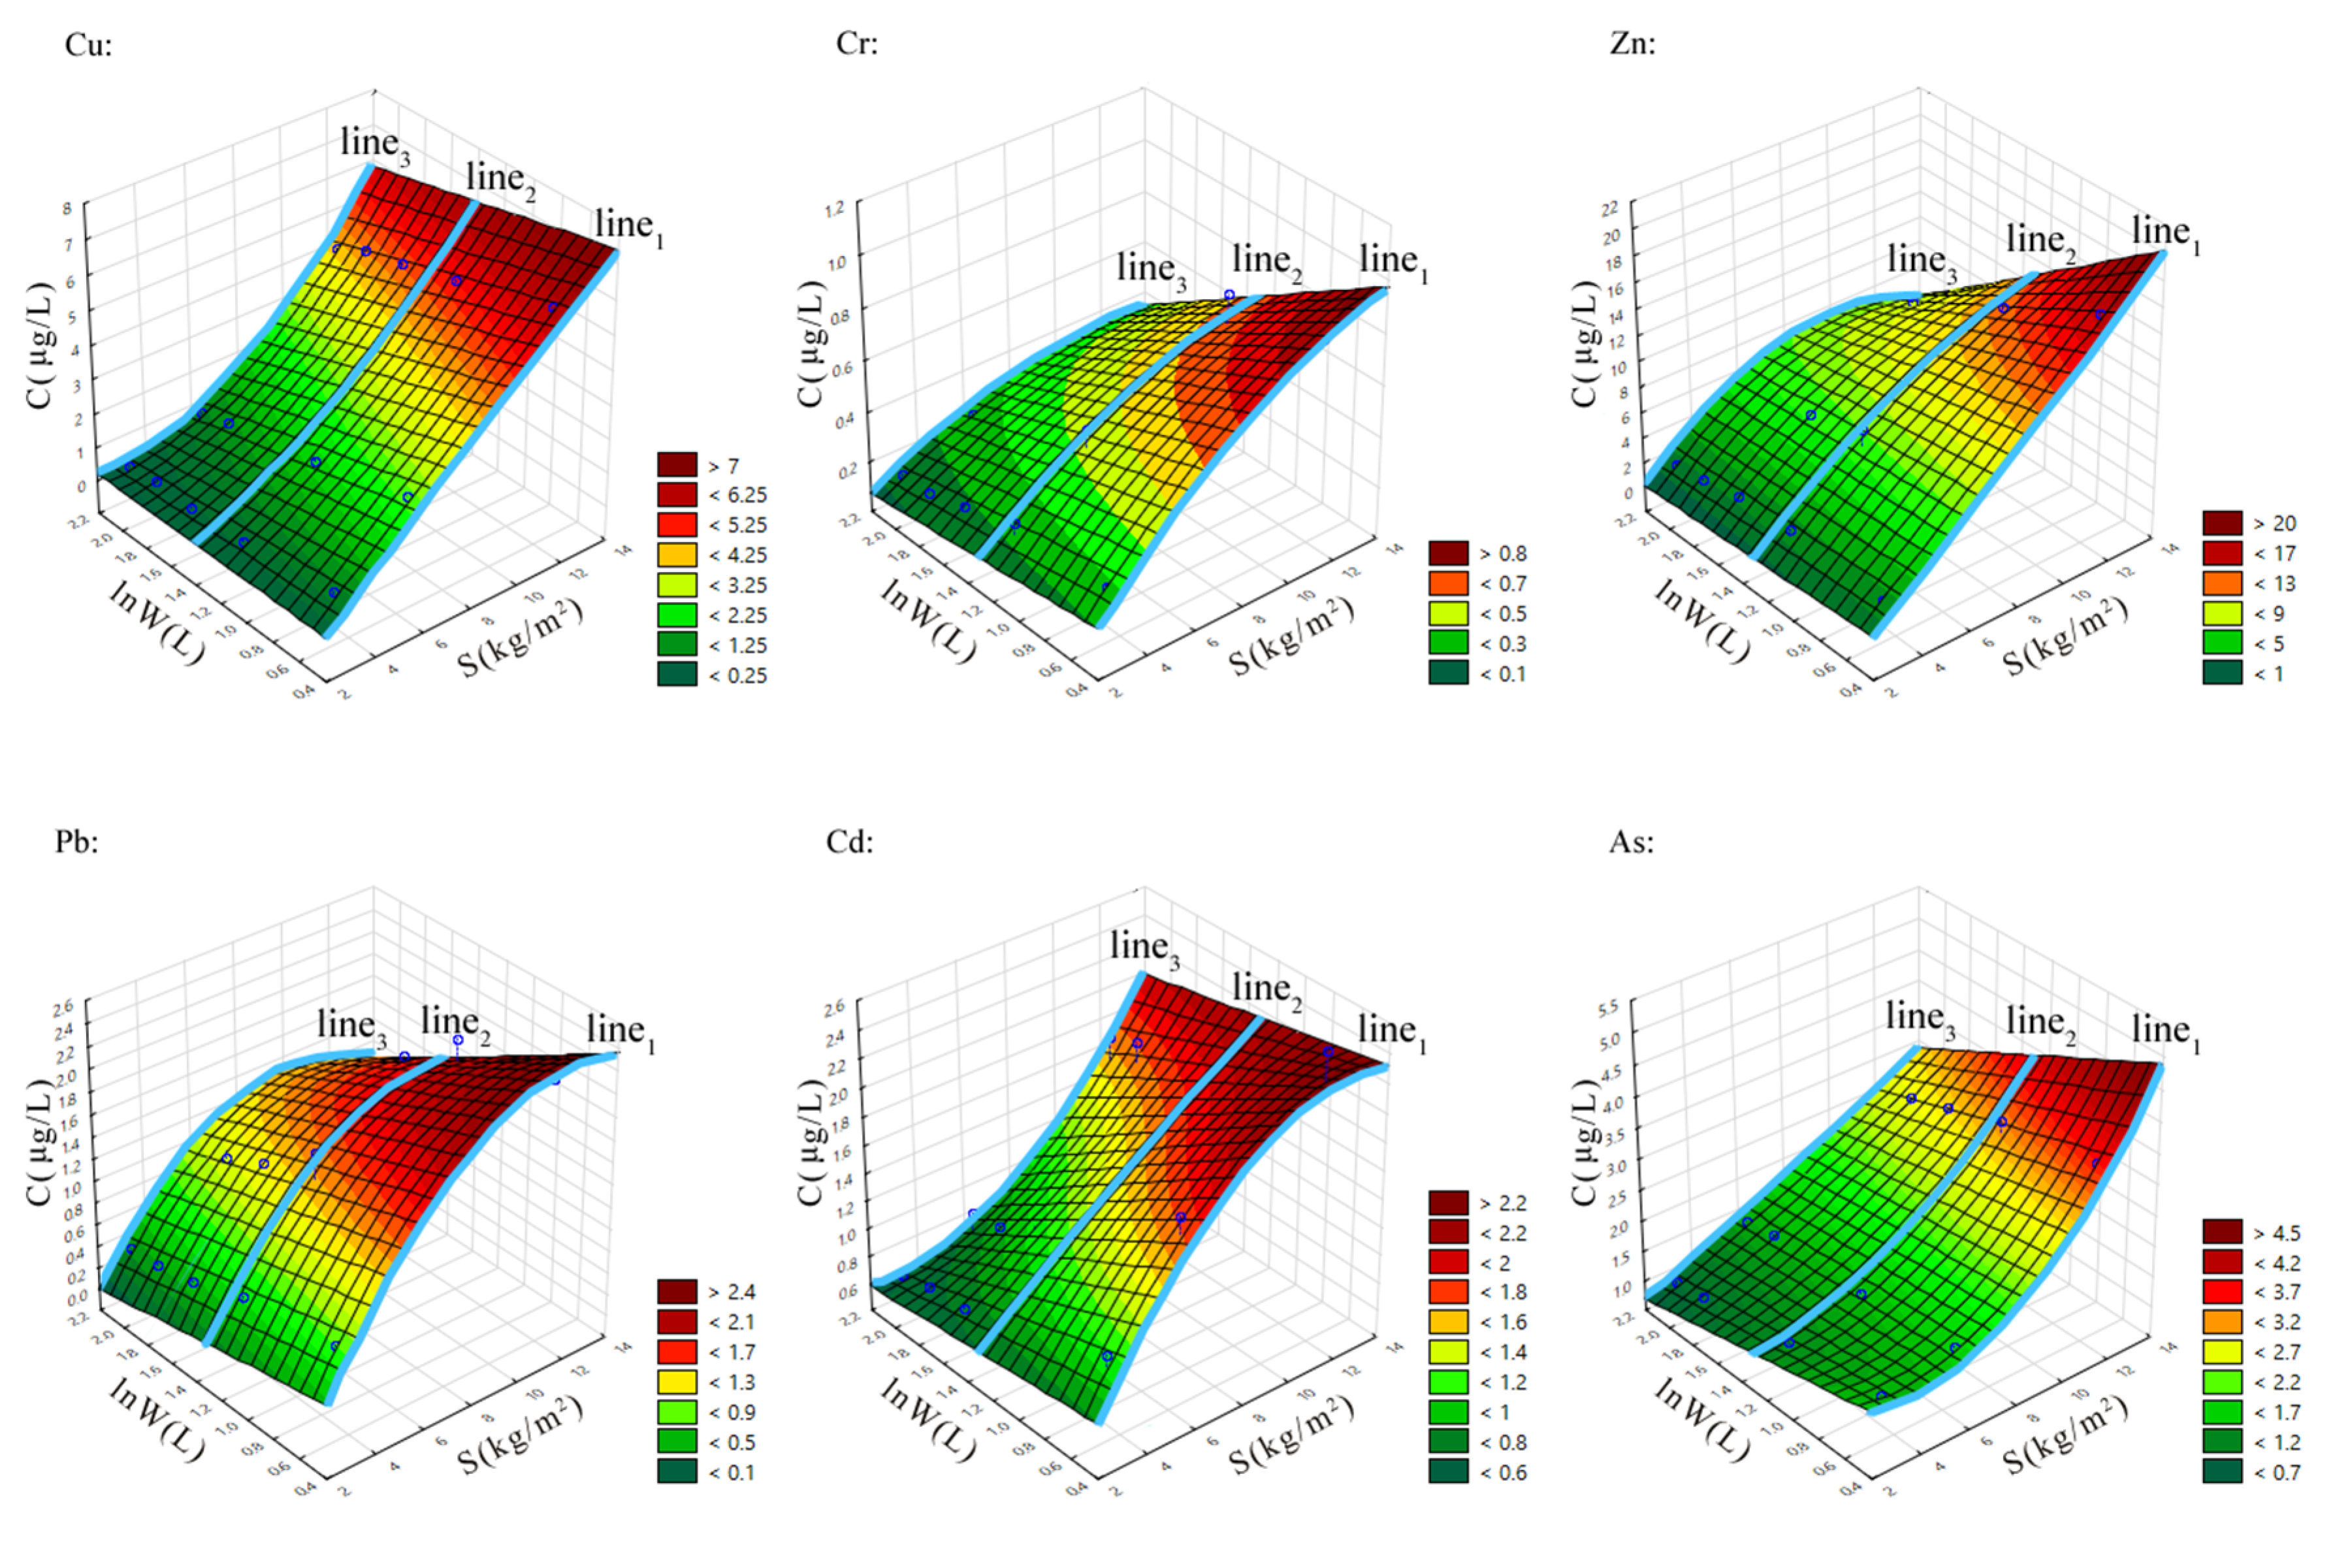
The main factors affecting the net concentration of heavy metals in leachate were the amount of sludge added and the accumulated leaching water. To further understand the coupling effect of sludge application and leaching water on the net concentration of heavy metals in the leachate, we used a three-dimensional curve presented in Figure 3 to simulate the binary nonlinear relationship between these three variables. The curve was generated by Statistica 10.0, and the fitting equation of the net concentration of each heavy metal in leachate is shown in Table 3. We found that the net concentration of the six heavy metals in leachate as a function of the two independent variables could be expressed by using Equation (1).
where C is the net concentration of each heavy metal in leachate, μg/L; S is the amount of sludge addition, kg/m2; and W is the cumulative leaching water, L.
According to the curve feature in Figure 3, the relationship between the net concentration of heavy metals in leachate and the two independent variables could be classified into four types. The first type included Cu and As. By observing changes in line 1 to line 3, we would find that, regardless of the cumulative leaching water, the net concentration of these two elements continued to rise as the amount of sludge addition increased, which indicated the leaching of these two elements had not reached saturation. The second type included Cr and Pb. The difference from the first type was that as the amount of sludge addition increased, the net concentration of these two elements gradually stabilized. The third type was Zn. In the case of low cumulative leaching water, the net concentration was linear with the amount of sludge addition. As the amount of accumulated leaching water increased, the net concentration gradually became stable. The last type was Cd. Under the condition of low cumulative leaching water, the net concentration gradually stabilized with the increase in sludge addition. When the cumulative leaching water reached a certain level, the net concentration increased with the increase in sludge addition.
3.1.2. Risk Assessment of Groundwater by Heavy Metals in Sludge
To evaluate the risk of contamination of groundwater by sludge application, it is necessary to compare the concentration of heavy metals in the leachate with the standard limits of groundwater quality. To this end, we referred to the latest standards of groundwater pollution indicators and limits in China [24]. According to the standard, groundwater quality has been divided into five grades. The first three grades are applicable to drinking water, while the fourth and fifth grades are less suitable because the pollutant content is relatively high. Considering the importance of forest land in Beijing for water conservation and purification, we only included the first three grades in the evaluation of our study. The specific standards are shown in Table 4, and the maximum concentration of each heavy metal in leachate under different treatment groups is presented in Table 5. By comparing Table 4 and Table 5, we could find that in leachate, the concentrations of Cu, Cr, Ni, Zn, and Pb could meet the class I standard of groundwater quality in China, while the concentrations of Cd, Hg, and As could only meet class III standards. Furthermore, it could be found that under the application rates of T1 and T2, the risk of sludge to groundwater was relatively low, and Cd and As were the main heavy metals that limit the application of sludge.
3.2. Accumulation of Heavy Metals in Different Soil Layers and Its Risk to Soil Environment
3.2.1. Analysis of Accumulation Behavior of Heavy Metals from Sludge in Different Soil Layers
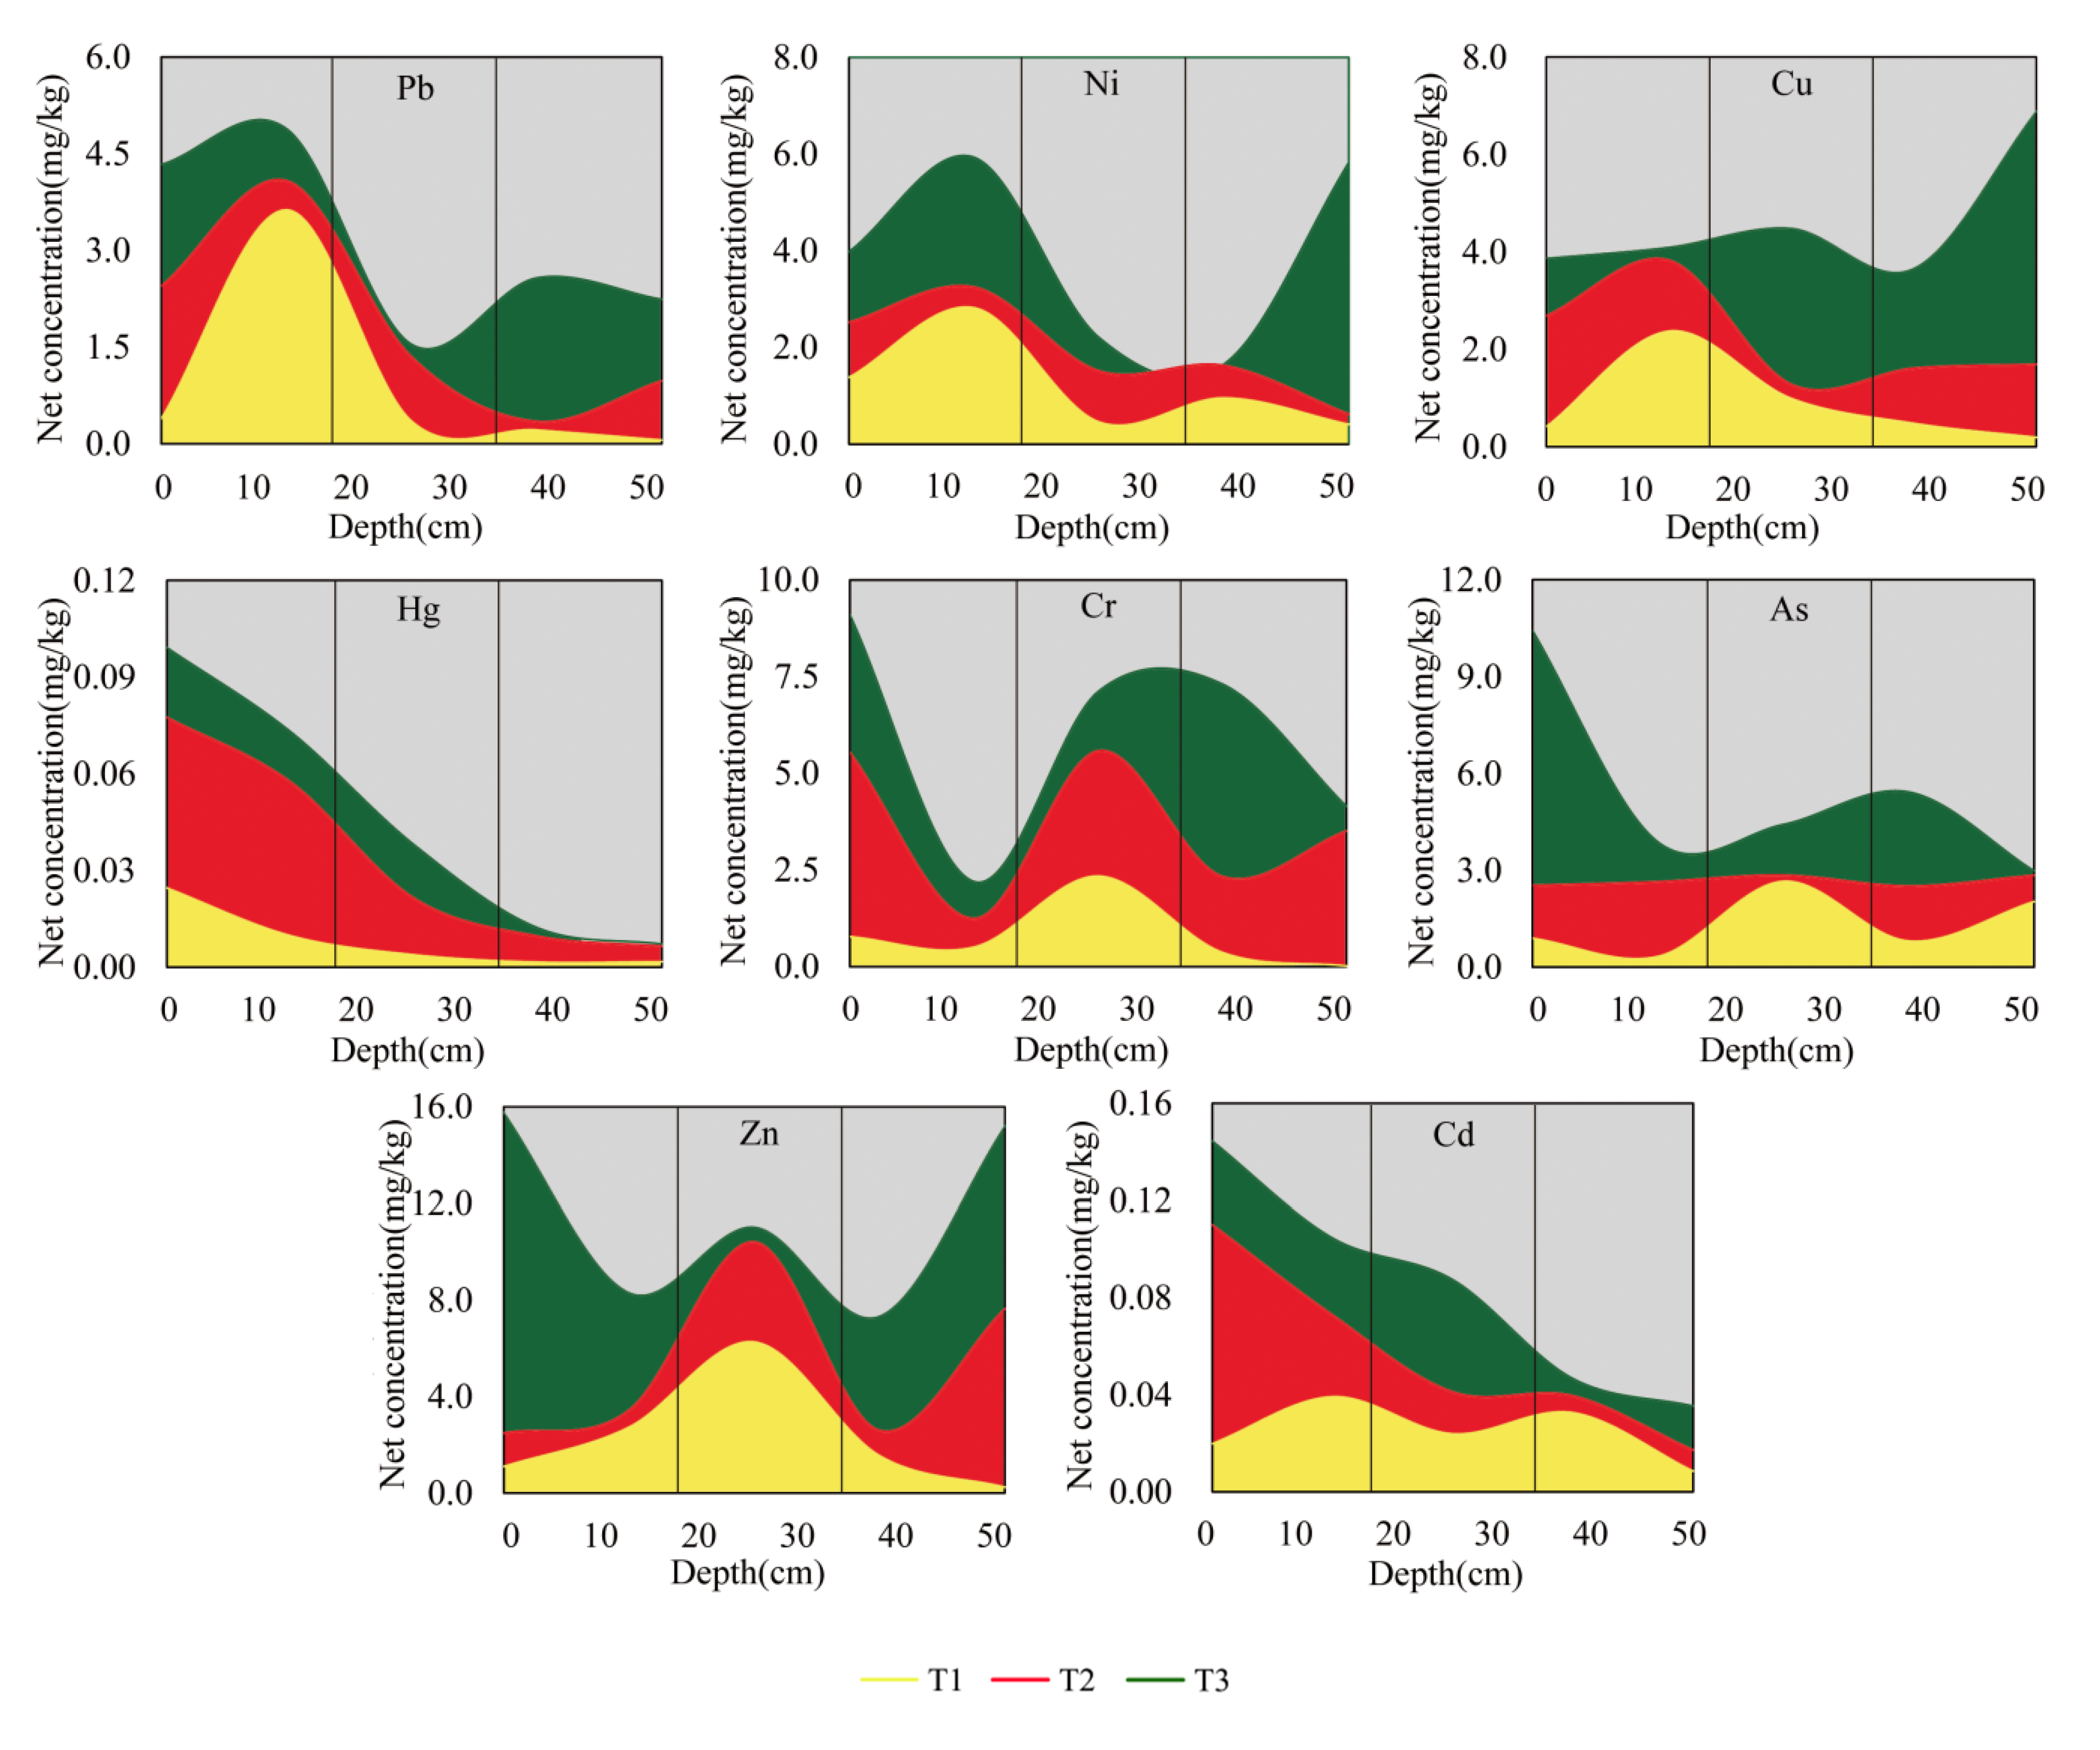
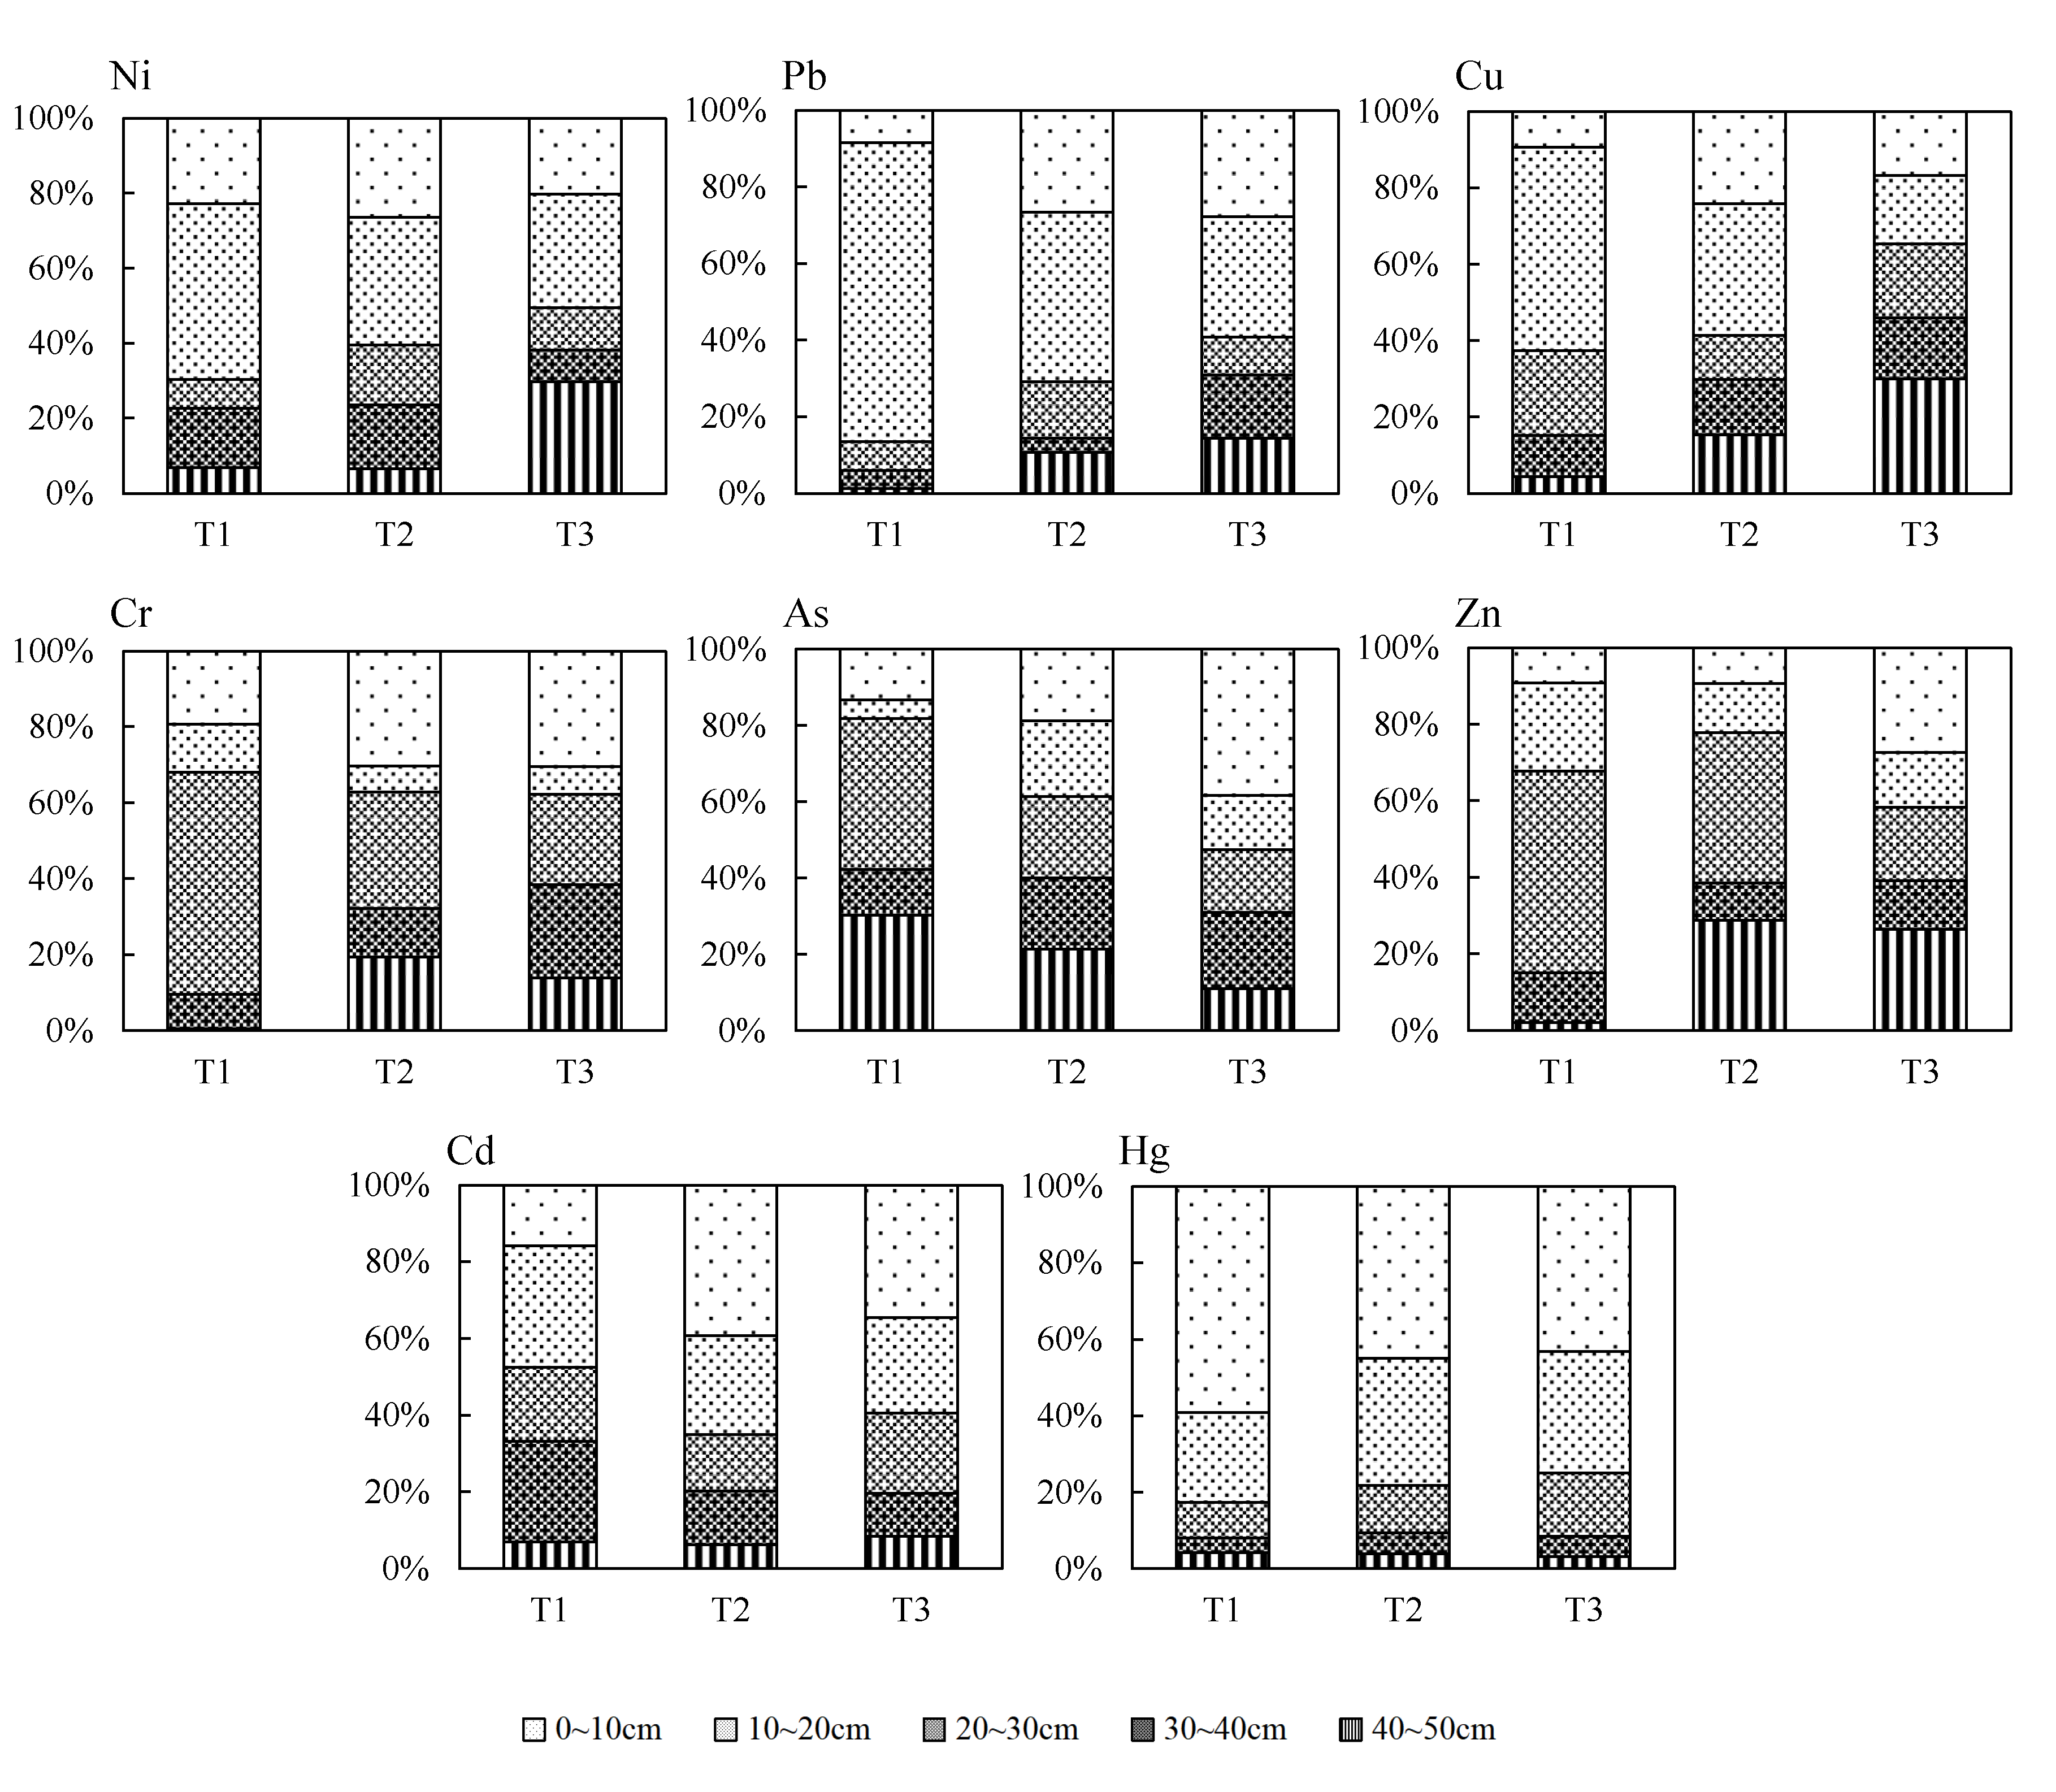
We investigated the content of heavy metals in different soil layers under the four treatment groups, and the three sludge addition groups were corrected by the CK group to obtain the net content of heavy metals accumulated in different soil layers. The curves presented in Figure 4 show the net content of eight heavy metals as a function of soil depth, and the area enclosed by the curve and the coordinate axis represents the cumulative content of the layer. In addition, Figure 5 shows more intuitively the proportion of heavy metal accumulation in each soil layer to total soil accumulation. Combined with Figure 4 and Figure 5, the accumulation behavior of these heavy metals can be divided into four categories: enrichment in topsoil (0–20 cm), enrichment in the middle layer (20–40 cm), enrichment in the bottom layer (40–50 cm) and uniform distribution of each layer.
However, the accumulation behavior of the three sludge addition groups was quite different. If we considered that the leaching degree of the T1 group was deeper than T2 and T3 due to the same amount of leaching water, we could classify the accumulation behavior of eight heavy metals based on the T1 group, and then analyzed the change of accumulation behavior when the amount of sludge applied increased.
Accordingly, we would see that Pb, Ni, Cu, and Hg belonged to the first category, the proportions of which that accumulated in topsoil were 86.5%, 69.8%, 62.6%, and 82.7%, respectively. Comparing the cumulative characteristics of these four elements in different treatment groups, it could be found that the proportions of Pb, Ni, and Cu, accumulated in a deeper layer of the soil in the T3 group, were significantly larger than that of T2 and T1 when T1 and T2 were highly similar. One possible explanation for this phenomenon was that when the amount of sludge applied reached a certain level, the adsorption of Pb, Ni, and Cu in the topsoil layer was nearly saturated, and excessive parts continued to migrate to a deeper layer of the soil with leaching solution. Related research has shown that the adsorption mechanism of Pb, Ni, and Cu was mainly not ion exchange, but specific adsorption or precipitation, usually combined with Fe Mn oxides and organic matter [25,26]. Specifically, in lower added concentrations, most Pb, Ni, and Cu were adsorbed to high energy sites such as soil humus and clay fractions, while in higher added concentrations, the excessive Pb, Ni, and Cu were extracted in the more mobile solvent [27,28,29,30]. In contrast, the accumulation behavior of Hg in T1, T2, and T3 was similar. As the depth of the soil deepened, the accumulation of Hg decreased. Previous studies have shown that Hg exhibited a great affinity for organic matter in soils, especially at higher concentrations [31,32]. Therefore, in the T3 group, the adsorption sites for Hg in topsoil were not yet saturated.
Cr, As, and Zn belonged to the second category, the proportions accumulated in the middle layer were 67.7%, 48.0%, and 65.7%, respectively. For Cr, as the amount of sludge applied increased, more Cr accumulated into a deeper layer. Meanwhile, the three treatment groups all showed a valley value of 10–20cm. Studies have shown that Cr was usually present in the form of Cr (VI) and Cr (III) in the soil. However, Cr (VI) has extremely high fluidity compared to Cr (III), especially in alkaline environments. The low hydroxyl solubility of Cr (III) coupled with its strong retention on soil surfaces limits its mobility in soil and water, while the electrostatic repulsion between Cr (VI) and negatively charged soil colloids increases the mobility of Cr (VI), as all Cr (VI) is anionic [33,34]. In addition, the presence of soil organic matter can promote the reduction of Cr (VI) to Cr (III), thereby reducing the mobility of Cr [35,36]. Therefore, the accumulation behavior of Cr in soil depended on its ratio between the valence states of Cr (VI) and Cr (III), and the influence of soil surface organic matter could explain the phenomenon of the valley value. Similarly to Cr, Arsenic also has two contrasting chemical forms in soils; one is As (V) which has poor mobility, and the other is As (III), which can rapidly move, but the redox reaction of arsenic is more sensitive [37,38]. This may explain the significant difference in the accumulation of Arsenic in the soil between three different treatment groups. For Zn, in the topsoil, the content of Zn in T3 was significantly larger than in T2 and T1, while T1 and T2 were similar. Additionally, the accumulation behavior of Zn in a deeper layer of the soil was similar in the T2 and T3 groups, and the cumulative amount is significantly higher than T1. Studies have shown that the concentration of Zn in soil solutions was controlled by the adsorption–desorption reaction on the surface of soil colloids [39,40]. Soils with high organic matter, high CEC, and high pH exhibited strong adsorption for Zn, but with no exception for Cd, Cu, Ni, and Pb [41]. However, competitive adsorption behaviors between different heavy metals would produce great influence [42,43]. When Cu was present, Zn was weakly bound to soil surfaces and was released in high amounts during desorption [44]. These would explain the difference in accumulation behavior of Zn in topsoil between T1, T2, and T3.
For Cd, its accumulation behavior belonged to the last category. Studies have shown that the transport and accumulation of Cd in soils were closely related to soil texture and pH [45,46]. In alkaline soil, the solubility of Cd was small because of precipitation of solid phases [47], much more precipitation of solid phases occurred in the top soil layers, and the precipitation coefficient decreased with increasing depth [48]. Therefore, there was no significant difference in the content of Cd in the bottom layer of the soil under the three treatment groups.
3.2.2. Risk Assessment of Soil Environment by Heavy Metals in Sludge
Considering the background value of heavy metal content in the soil, and the net increase in each soil layer after sludge application, we list the current and net added value of heavy metals in the riskiest soil layers under each treatment group. The results are shown in Table 6. To evaluate the risk of contamination of the soil environment after sludge application, we referred to the latest standards of soil pollution indicators and limits in China [49].
By comparison, we could find that the existing heavy metal accumulation was far from reaching the soil pollution limit. However, a large amount of sludge is produced every year, and the annual application will inevitably lead to more accumulation of heavy metals in the soil. When we accumulated the net increase of different heavy metals in the highest risk soil layer year by year and used the standard limit as a reference, we could calculate the land application period for sludge disposal. Calculations proved that, for all the metals, Arsenic had the most restrictions on the period of application. Under the application rate of T1 and T2, the Arsenic content limit allows the current sludge application rate to be applied only for 5 and 4 years. The application rate of T3 was above the limits. By comparing these three groups, the application of 60 t/ha·a−1 in T2 would not put any risk to groundwater and soil in the short term, while the total sludge disposal could be maximized.
3.3. Leaching Efficiency of Heavy Metals in Sludge
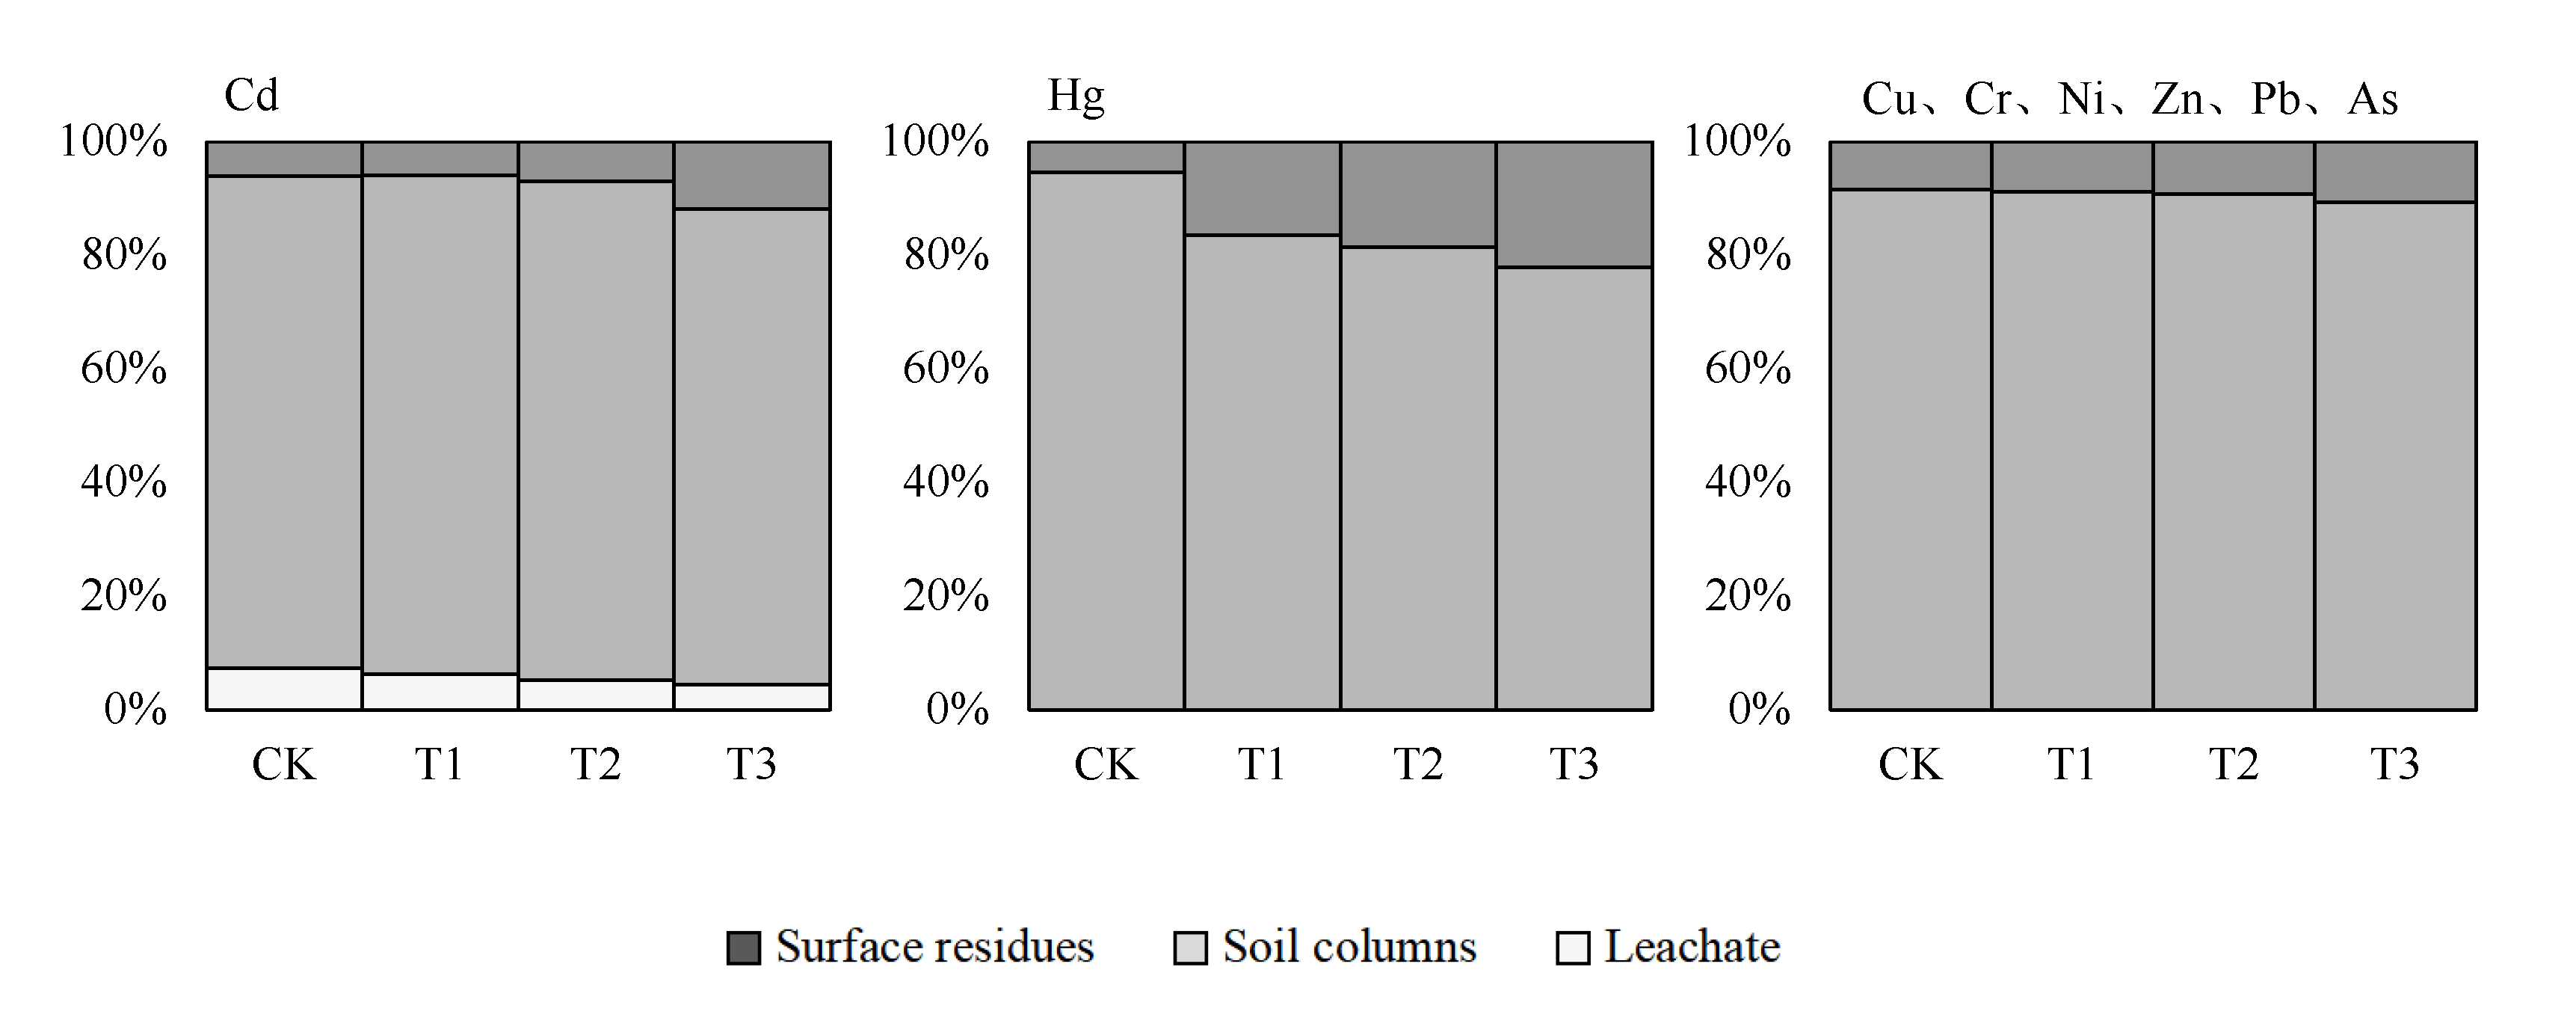
To understand the leaching efficiency of each heavy metals from sludge to groundwater, we investigated the contents of heavy metal in surface residues, soil columns, and leachate under each test group, and the three sludge addition groups were corrected by the CK group to obtain the ratio of heavy metals from sludge in each media. According to the proportion of each heavy metal in different media, it could be classified into three categories, which are shown in Figure 5 and Figure 6. From Figure 5, by calculating the average value of the three groups, it was found that the proportions allocated to the 0–20 cm soil layer were Hg (78.7%) > Pb (72.2%) > Ni (60.3%) > Cd (57.4%) > Cu (52.0%) > As (36.5%) > Cr (35.7%) > Zn (32.0%), the proportions allocated to the 20–40 cm soil layer were Cr (53.2%) > Zn (48.9%) > As (42.7%) > Cd (35.5%) > Cu (31.5%) > Ni (25.4%) > Pb (19.1%) > Hg (17.6%), and the proportions allocated to the 40-50cm soil layer were As (20.8%) > Zn (19.1%) > Cu (16.5%) > Ni (14.3%) > Cr (11.1%) > Cd (7.1%) > Pb (8.7%) > Hg (3.7%). Among the eight elements, Hg, Pb, Ni, Cd, and Cu were mainly concentrated in the 0–20 cm soil layer, while Cr, Zn, and As were mainly concentrated in the 20–40 cm soil layer.
From Figure 6, Cd had the highest leaching efficiency and Hg showed the lowest. Except for Hg and Cd, the other six elements had great similarities in the distribution of each media. The distribution ratio of Cu, Cr, Ni, Zn, Pb, and As in the surface residues was between 8% to 13%, and the proportion increased slightly as sludge amounts increased, while their distribution ratio in the leachate did not exceed 0.1%. The distribution ratio of Cd in the leachate reached 4–6%, which was significantly higher than that of other elements, probably because of its strong migration characteristics in the solid phase. It was commonly known that the migration characteristics had a strong correlation with the chemical form of heavy metals, and the extractable form could have better mobility than the residual form [50]. Referring to Meng’s investigation of heavy metals in the sludge of the Beijing sewage treatment plant, the extractable form of Cd was between 81.3% to 85.7%, which was significantly higher than the other seven heavy metals [51]. Therefore, the existence of a large number of extractable Cd significantly increases its leaching ratio.
Contrary to Cd, Hg was not detected in leachate, while the distribution ratio in surface residues was significantly higher than the other seven elements. Studies have shown that the majority of the added Hg tended to be bound by soil organic matter on the surface and precipitation input had a slight influence on its mobility [52,53,54]. This may explain the large distribution ratio of Hg in surface residues and the reason for its obvious growth with the increased adding of sludge.
Comparing the difference between the undisturbed soil column test in our study and the self-made homogeneous soil column test in the previous study, we could find that the leaching efficiency was completely different. In our test, the leaching efficiency of heavy metals in sludge was extremely low, although some heavy metals were enriched at the bottom of the soil column, performing a sharp contrast with the result that over half of the Zn was leaching out of the soil in the previous study [55]. One possible explanation was that, in an undisturbed soil column, as the water migrated to the subsoil, a layer of cement was formed at the bottom of the soil column due to the leaching effect, and the permeability coefficient became extremely low, whereas the self-made homogeneous soil failed to form this cement layer due to the destruction of the soil structure [56]. In addition, the porosity of the compact illuvial layer was significantly lower than the surface layer, which would greatly reduce the infiltration of leaching water and cause most of the heavy metals to stay in the deep soil layer [57]. The self-made homogeneous soil ignored the existence of this phenomenon, causing the concentration of heavy metals in the leachate to be much higher than in the field, which exaggerated the impact of sludge heavy metals on groundwater. Therefore, it could be seen that the leaching test using an undisturbed soil column was more effective in reflecting the leaching efficiency of heavy metals from sludge to groundwater.
4. Conclusions
After the sludge application in woodland soil, Cd had the highest leaching efficiency while Hg showed the lowest. The distribution ratio of Cu, Cr, Ni, Zn, Pb, and As in the surface residues was between 8% to 13%, the proportion increased slightly as sludge amounts increased, and the distribution ratio of these five elements in the leachate did not exceed 0.1%. The enrichment characteristics of each metal in soil were expressed as Pb, Ni, Cu, and Hg were enriched in topsoil (0–20 cm), and Cr, As, and Zn was enriched in the middle layer (20–40 cm), and Cd showed a uniform distribution in each layer. The main factor affecting the net concentration of heavy metals in leachate was the amount of sludge addition and accumulated leaching water, and there was a nonlinear binary relationship between these three variables. After sludge application, the accumulation behavior of different heavy metals in soil was different; as the application rate increased, the accumulation behavior would change, probably related to changes in the adsorption–desorption behavior and chemical form. During the application process of sludge products, more attention should be given to As and Cd due to their higher potential risk to groundwater than other heavy metals. Accumulation of Arsenic in the soil was the main factor limiting the amount and frequency of sludge product application. The sludge application of 60 t/ha·a−1 was preferred compared with the other two application rates because it performed minimal risk to groundwater and soil in the short term, while the total sludge disposal could be maximized.
Author Contributions
Conceptualization, S.Q.; methodology, B.W.; software, B.W.; validation, B.W.; formal analysis, Y.H.; investigation, Y.H.; resources, Y.L.; data curation, J.Z.; writing—original draft preparation, B.W.; writing—review and editing, B.W.; visualization, Y.H.; supervision, S.Q.; project administration, J.Z.; funding acquisition, J.Z. All authors have read and agreed to the published version of the manuscript.
Funding
This research was funded by (1) the Beijing Monitoring and evaluation project of Beijing-Tianjin Sandstorm Source Control Phase II (grant numbers 2020-SYZ-01-17JC05), and (2) the Beijing Science and Technology Plan Project (grant numbers Z151100002115006).
Informed Consent Statement
Informed consent was obtained from all subjects involved in the study.
Data Availability Statement
Data will be made available on request.
Acknowledgments
Much appreciation to Beijing Forestry University for supporting this study.
Conflicts of Interest
The authors declare no conflict of interest.
References
- Zhang, G.F.; Wang, T.Y.; Mizunoya, T.; Yabar, H.; Yan, J.J.; Sha, J.H.; Higano, Y. An Analysis of Economic and Environmental Impact of Sewage Treatment in Beijing City. Appl. Mech. Mater. 2013, 368–370, 275–281. [Google Scholar] [CrossRef]
- BDGC (Beijing Drainage Group Co., Ltd.). Social Responsibility Report; BDGC: Beijing, China, 2022. [Google Scholar]
- Yang, G.; Zhang, G.; Wang, H. Current state of sludge production, management, treatment and disposal in China. Water Res. 2015, 78, 60–73. [Google Scholar] [CrossRef] [PubMed]
- Wang, T.; Yang, M. General situation and problems of sludge treatment and disposal in Beijing sewage treatment plant. China Environ. Prot. Ind. 2016, 11, 64–68. (In Chinese) [Google Scholar]
- Koyuncu, S. Occurrence of organic micropollutants and heavy metals in the soil after the application of stabilized sewage sludge. J. Environ. Health Sci. Eng. 2022, 20, 385–394. [Google Scholar] [CrossRef] [PubMed]
- MOEE (Ministry of Ecology and Environment of the People’s Republic of China). Measures for the Management of Agricultural Land Soil Environment; MOEE: Beijing, China, 2017. Available online: http://www.gov.cn/gongbao/content/2017/content_5248223.htm (accessed on 2 May 2022).
- Zhuang, P.; McBride, M.B.; Xia, H.P.; Li, N.Y.; Li, Z.A. Health risk from heavy metals via consumption of food crops in the vicinity of Dabaoshan mine, South China. Sci. Total Environ. 2009, 407, 1551–1561. [Google Scholar] [CrossRef]
- Wuana, R.A.; Okieimen, F.E. Heavy metals in contaminated soils: A review of sources, chemistry, risks and best available strategies for remediation. ISRN Ecol. 2011, 2011, 402647. [Google Scholar] [CrossRef] [Green Version]
- Ashworth, D.J.; Alloway, B.J. Soil mobility of sewage sludge-derived dissolved organic matter, copper, nickel and zinc. Environ. Pollut. 2004, 127, 137–144. [Google Scholar] [CrossRef]
- Lu, J.M.; Leiviskä, T.; Walder, I. The effect of temperature and digested sewage sludge cover over tailings on the leaching of contaminants from Ballangen tailings deposit. J. Water Clim. Chang 2021, 12, 3573–3581. [Google Scholar] [CrossRef]
- Feizi, M.; Jalali, M. Leaching of Cd, Cu, Ni and Zn in a sewage sludge-amended soil in presence of geo- and nano-materials. J. Clean. Prod. 2021, 297, 126506. [Google Scholar] [CrossRef]
- Ma, K.J.; Zhang, M.Q.; Cai, P. Leaching characteristics of heavy metals from compost sludge in loess. Chin. J. Environ. Eng. 2013, 4, 361–366. (In Chinese) [Google Scholar]
- Fang, W.; Wei, Y.H.; Liu, J.G. Comparative characterization of sewage sludge compost and soil: Heavy metal leaching characteristics. J. Hazard. Mater. 2016, 310, 1–10. [Google Scholar] [CrossRef] [PubMed]
- Fang, J.; Zhang, K.K.; Sun, P.D.; Lin, D.H.; Shen, B.; Luo, Y. Co-transport of Pb2+ and TiO2 nanoparticles in repacked homogeneous soil columns under saturation condition: Effect of ionic strength and fulvic acid. Sci. Total Environ. 2016, 57, 471–478. [Google Scholar] [CrossRef] [PubMed]
- Tuli, A.; Hopmans, J.W.; Rolston, D.E.; Moldrup, P. Comparison of Air and Water Permeability between Disturbed and Undisturbed Soils. Soil Sci. Soc. Am. J. 2005, 69, 1361–1371. [Google Scholar] [CrossRef]
- Dong, L.Y.; Wang, W.H. Water Movement Characteristics of Undisturbed and Disturbed Soil Under Drip Irrigation. J. Soil Water Conserv. 2017, 5, 164–169. (In Chinese) [Google Scholar]
- GB 4284-2018; Control Standards of Pollutants in Sludge for Agricultural Use. MEP (Ministry of Environmental Protection): Beijing, China, 2018. Available online: http://www.gb688.cn/bzgk/gb/newGbInfo?hcno=B40A49F7734797DF61D90FE1F6BA5442 (accessed on 2 May 2022).
- Zhao, L.; Shangguan, Y.X.; Yao, N.; Sun, Z.J.; Ma, J.; Hou, H. Soil migration of antimony and arsenic facilitated by colloids in lysimeter studies. Sci. Total Environ. 2020, 728, 138874. [Google Scholar] [CrossRef]
- Cao, J.S.; Zhang, W.J. Research on Shallow Groundwater Recharge and Control in Taihang Mountain Area of North China. Adv. Mater. Res. 2010, 113–116, 1572–1576. [Google Scholar] [CrossRef]
- Caccia, V.G.; Millero, F.J.; Palanques, A. The distribution of trace metals in Florida Bay sediments. Mar. Pollut. Bull. 2003, 46, 1420–1433. [Google Scholar] [CrossRef]
- Rahman, L.; Corns, W.T.; Bryce, D.W.; Stockwell, P.B. Determination of mercury, selenium, bismuth, arsenic and antimony in human hair by microwave digestion atomic fluorescence spectrometry. Talanta 2000, 52, 833–843. [Google Scholar] [CrossRef]
- Mouni, L.; Belkhiri, L.; Merabet, D. Monometal and competitive sorption of heavy metals in mine soils: Influence of mine soil characteristics. Environ. Sci. 2013, 8, 94–102. [Google Scholar]
- González Costa, J.J.; Reigosa, M.J.; Matias, J.M.; Covelo, E.F. Soil Cd, Cr, Cu, Ni, Pb and Zn sorption and retention models using SVM: Variable selection and competitive model. Sci. Total Environ. 2017, 593–594, 508–522. [Google Scholar] [CrossRef]
- GB/T14848-2017; Standard for Groundwater Quality. MONR (Ministry of Natural Resources of the People’s Republic of China): Beijing, China, 2017. Available online: http://www.gb688.cn/bzgk/gb/newGbInfo?hcno=F745E3023BD5B10B9FB5314E0FFB5523 (accessed on 2 May 2022).
- Bellarbi, M.; Rais, N.; Elsass, F.; Duplay, J.; Ijjaali, M. Speciation of Cr, Cu, Ni and Zn in soils irrigated with contaminated waters: A case study of agricultural soils from the plain of Saiss (Fez, Morocco). Environ. Earth Sci. 2015, 73, 3465–3474. [Google Scholar] [CrossRef]
- Wang, Y.F.; van Zwieten, L.; Wang, H.L.; Wang, L.; Li, R.Z.; Qu, J.H.; Zhang, Y. Sorption of Pb(II) onto biochar is enhanced through co-sorption of dissolved organic matter. Sci. Total Environ. 2022, 825, 153686. [Google Scholar] [CrossRef] [PubMed]
- McLaren, R.G.; Williams, J.G.; Swift, R.S. The adsorption of copper by soil samples from scotland at low equilibrium solution concentrations. Geoderma 1983, 31, 97–106. [Google Scholar] [CrossRef]
- Liu, A.; Gonzalez, R.D. Adsorption/desorption in a system consisting of humic acid, heavy metals, and clay minerals. J. Colloid Interface Sci. 1999, 218, 225–232. [Google Scholar] [CrossRef]
- Wang, S.; Nan, Z.; Liu, X.; Zhang, G.Z. Availability and Speciation of Cu, Zn, and Pb Added to Irrigated Desert Soil. Pol. J. Environ. Stud. 2010, 19, 865–869. [Google Scholar]
- Kamini; Singh, B.; Narwal, R.P.; Antil, R.S. Response of adsorption and desorption behaviour of Pb and Ni to different soil organic C levels. Ann. Biol. 2012, 28, 21–27. [Google Scholar]
- Schuster, E. The behavior of mercury in the soil with special emphasis on complexation and adsorption processes-a review of the literature. Water Air Soil Pollut. 1991, 56, 667–680. [Google Scholar] [CrossRef]
- Wang, Y.Q.; Liu, J.; Liem-Nguyen, V.; Tian, S.Y.; Zhang, S.Q.; Wang, D.Y.; Jiang, T. Binding strength of mercury (II) to different dissolved organic matter: The roles of DOM properties and sources. Sci. Total Environ. 2022, 807, 150979. [Google Scholar] [CrossRef]
- Fendorf, S.E. Surface reactions of chromium in soils and waters. Geoderma 1995, 67, 55–71. [Google Scholar] [CrossRef]
- Mitchell, K.; Trakal, L.; Sillerova, H.; Avelar-González, F.J.; Guerrero-Barrera, A.L.; Hough, R.; Beesley, L. Mobility of As, Cr and Cu in a contaminated grassland soil in response to diverse organic amendments; a sequential column leaching experiment. Appl. Geochem. 2018, 88, 95–102. [Google Scholar] [CrossRef]
- Choppala, G.; Bolan, N.; Seshadri, B. Chemo dynamics of chromium reduction in soils: Implications to bioavailability. J. Hazard. Mater. 2013, 261, 718–724. [Google Scholar] [CrossRef] [PubMed]
- Kwikima, M.M.; Said, A. Hexavalent Chromium Mobility and Distribution Behavior in Riparian Agricultural Tropical Soils: A Column Experiment. Chem. Afr. 2022. [Google Scholar] [CrossRef]
- Yang, H.l.; He, M.C.; Wang, X.Q. Concentration and speciation of antimony and arsenic in soil profiles around the world’s largest antimony metallurgical area in China. Environ. Geochem. Health 2015, 37, 21–33. [Google Scholar] [CrossRef] [PubMed]
- Manzano, R.; Rosende, M.; Leza, A.; Esteban, E.; Peñalosa, J.M.; Miró, M.; Moreno-Jiménez, E. Complementary assessment of As, Cu and Zn environmental availability in a stabilised contaminated soil using large-bore column leaching, automatic microcolumn extraction and DGT analysis. Sci. Total Environ. 2019, 690, 217–225. [Google Scholar] [CrossRef] [PubMed]
- Zahedifar, M.; Karimian, N.; Yasrebi, J. Influence of applied zinc and organic matter on zinc desorption kinetics in calcareous soils. Arch. Agron. Soil Sci. 2012, 58, 169–178. [Google Scholar] [CrossRef]
- Hodomihou, N.R.; Feder, F.; Legros, S.; Formentini, T.A.; Lombi, E.; Doelsch, E. Zinc Speciation in Organic Waste Drives Its Fate in Amended Soils. Environ. Sci. Technol. 2020, 54, 12034–12041. [Google Scholar] [CrossRef]
- Elbana, T.A.; Selim, H.M.; Akrami, N.; Newman, A.; Shaheen, S.M.; Rinklebe, J. Freundlich sorption parameters for cadmium, copper, nickel, lead, and zinc for different soils: Influence of kinetics. Geoderma 2018, 324, 80–88. [Google Scholar] [CrossRef]
- Atanassova, I. Competitive effect of Copper, Zinc, Cadmium and Nickel on ion adsorption and desorption by soil clays. Water Air Soil Pollut. 1999, 113, 115–125. [Google Scholar] [CrossRef]
- Kummer, L.; Gonalves, M.S.; Zemiani, A.; Melo, V.d.F.; Gomes, S.D. Individual and Competitive Adsorption of Copper, Zinc and Lead in Soils with Contrasting Texture. J. Exp. Agric. Int. 2018, 27, 1–11. [Google Scholar] [CrossRef]
- Lair, G.J.; Gerzabek, M.H.; Haberhauer, G.; Jakusch, M.; Kirchmann, H. Response of the sorption behavior of Cu, Cd, and Zn to different soil management. J. Plant Nutr. Soil Sci. 2006, 169, 60–68. [Google Scholar] [CrossRef]
- Shaheen, S.M.; Tsadilas, C.D. Influence of fly ash and sewage sludge application on Cadmium and Lead sorption by an acidic alfisol. Pedosphere 2010, 20, 436–445. [Google Scholar] [CrossRef]
- Zheng, Y.H.; Zhang, Z.H.; Chen, Y.C.; An, S.K.; Zhang, L.; Chen, F.L.; Ma, C.N.; Cai, W.Q. Adsorption and desorption of Cd in reclaimed soil under the influence of humic acid: Characteristics and mechanisms. Int. J. Coal Sci. Technol. 2022, 9, 7. [Google Scholar] [CrossRef]
- Voegelin, A.; Kretzschmar, R. Modelling sorption and mobility of cadmium and zinc in soils with scaled exchange coefficients. Eur. J. Soil Sci. 2003, 54, 387–400. [Google Scholar] [CrossRef]
- Qi, Z.M.; Feng, S.Y.; Helmers, M.J. Modeling Cadmium transport in neutral and alkaline soil columns at various depths. Pedosphere 2012, 22, 273–282. [Google Scholar] [CrossRef] [Green Version]
- Zhang, X.X.; Zha, T.G.; Zhu, J.G.; Guo, X.P.; Liu, Y. Loading Capacity of Sewage Sludge for Forestry Application in Chinese Provincial Capital Cities. Sustainability 2020, 12, 7551. [Google Scholar] [CrossRef]
- Ma, L.Q.; Rao, G.N. Chemical Fractionation of Cadmium, Copper, Nickel, and Zinc in Contaminated Soils. J. Environ. Qual. 1997, 26, 259–264. [Google Scholar] [CrossRef] [Green Version]
- Hanc, A.; Szakova, J.; Ochecova, P. Differences in the mobility of Cd, Cu, Pb and Zn during composting of two types of household bio-waste collected in four seasons. Bioresour. Technol. 2014, 168, 204–213. [Google Scholar] [CrossRef]
- Haynes, K.M.; Mitchell, C.P.J. Precipitation input and antecedent soil moisture effects on mercury mobility in soil-laboratory experiments with an enriched stable isotope tracer. Hydrol. Process. 2015, 29, 4161–4174. [Google Scholar] [CrossRef] [Green Version]
- Zhang, Z.Y.; Li, G.; Yang, L.; Wang, X.J.; Sun, G.X. Mercury distribution in the surface soil of China is potentially driven by precipitation, vegetation cover and organic matter. Environ. Sci. Eur. 2020, 32, 89. [Google Scholar] [CrossRef]
- Tersic, T.; Biester, H.; Gosar, M. Leaching of mercury from soils at extremely contaminated historical roasting sites (Idrija area, Slovenia). Geoderma 2014, 226-227, 213–222. [Google Scholar] [CrossRef]
- Chen, G.Q.; Zeng, G.M.; Du, C.Y.; Huang, D.L.; Tang, L.; Wang, L.; Shen, G.L. Transfer of heavy metals from compost to red soil and groundwater under simulated rainfall conditions. J. Hazard. Mater. 2010, 181, 211–216. [Google Scholar] [CrossRef] [PubMed]
- Zhou, Y.X. Research on Geochemical Characters and Environmental Geochemical Effects of Representative Tailings Impoundments in the Region of Tongling, Anhui Province, China. Ph.D. Thesis, Hefei University of Technology, Hefei, China, 2009. (In Chinese). [Google Scholar]
- Salonen, V.P.; Korkka-Niemi, K. Influence of parent sediments on the concentration of heavy metals in urban and suburban soils in Turku, Finland. Appl. Geochem. 2007, 22, 906–918. [Google Scholar] [CrossRef]
Figure 1.
Equipment of soil column experiment.

Figure 2.
Concentration changes of six heavy metal elements in leaching water.

Figure 3.
Simulation of net concentration of heavy metals in leachate.

Figure 4.
Net content curve of heavy metals in various layers of soil after application.

Figure 5.
Distribution ratios of net content of heavy metals in soils of various layers after sludge application.
Figure 5.
Distribution ratios of net content of heavy metals in soils of various layers after sludge application.

Figure 6.
The distribution proportion of sludge heavy metal in different component.


Table 1.
The background values of test materials (mg/kg).
| Materials | Cu | Cr | Ni | Zn | Pb | Cd | As | Hg | pH |
|---|---|---|---|---|---|---|---|---|---|
| Sludge products | 96.3 | 45.3 | 18.3 | 512 | 36.3 | 0.59 | 19.8 | 1.34 | 7.43 |
| soil layer (0–10 cm) | 17.4 | 57.16 | 26.82 | 51.61 | 16.41 | 0.11 | 15.01 | 0.07 | 8.30 |
| soil layer (10–20 cm) | 17.6 | 54.44 | 26.63 | 50.62 | 17.08 | 0.09 | 16.68 | 0.05 | 8.70 |
| soil layer (20–30 cm) | 16.6 | 47.01 | 23.80 | 47.68 | 16.47 | 0.10 | 7.02 | 0.07 | 8.50 |
| soil layer (30–40 cm) | 19.1 | 53.62 | 26.78 | 59.49 | 19.60 | 0.13 | 14.03 | 0.06 | 8.30 |
| soil layer (40–50 cm) | 19.2 | 53.01 | 26.68 | 57.95 | 19.47 | 0.12 | 14.53 | 0.06 | 8.30 |
Table 2.
Description of treatment sets for leaching tests.
| Description | Treatment Code | Leaching Water Volume (L) |
|---|---|---|
| Soil column without sludge | CK | 1.68 × 5 = 8.4 |
| Soil column + 50 g sludge | T1 | 1.68 × 5 = 8.4 |
| Soil column + 100 g sludge | T2 | 1.68 × 5 = 8.4 |
| Soil column + 200 g sludge | T3 | 1.68 × 5 = 8.4 |
Table 3.
Fitting equation of net concentration of heavy metals in leachate.
| Heavy Metals | Equation Model | R2 |
|---|---|---|
| Cu | C = (0.023S2 − 0.44S + 0.75)lnW − 0.012S2 + 0.82S − 1.29 | 0.99 |
| Cr | C = (0.0006S2 − 0.03S − 0.01)lnW − 0.004S2 + 0.13S − 0.03 | 0.95 |
| Zn | C = (−0.07S2 + 0.42S − 1.26)lnW + 0.03S2 + 1.31S − 1.18 | 0.98 |
| Pb | C = (−0.0003S2 − 0.04S − 1.85)lnW − 0.02S2 + 0.48S − 0.31 | 0.96 |
| Cd | C = (0.01S2 − 0.24S − 0.30)lnW − 0.02S2 + 0.46S + 0.002 | 0.94 |
| As | C = (− 0.02S2 + 0.21S − 0.84)lnW + 0.04S2 − 0.31S + 2.24 | 0.99 |
Table 4.
National standard limit for groundwater heavy metal concentration (mg/L).
| Heavy Metals | Class I | Class II | Class III |
|---|---|---|---|
| Cu | ≤0.01 | ≤0.05 | ≤1.00 |
| Cr | ≤0.005 | ≤0.01 | ≤0.05 |
| Zn | ≤0.05 | ≤0.5 | ≤1.00 |
| Pb | ≤0.005 | ≤0.005 | ≤0.01 |
| Cd | ≤0.0001 | ≤0.001 | ≤0.005 |
| As | ≤0.001 | ≤0.001 | ≤0.01 |
| Ni | ≤0.002 | ≤0.002 | ≤0.02 |
| Hg | ≤0.0001 | ≤0.0001 | ≤0.001 |
Table 5.
Maximum concentration of heavy metal under different treatment groups (mg/L).
| Heavy Metals | T1 | T2 | T3 |
|---|---|---|---|
| Cu | 0.00238 | 0.00410 | 0.00756 |
| Cr | 0.00088 | 0.00112 | 0.00143 |
| Zn | 0.00856 | 0.01257 | 0.02248 |
| Pb | 0.00261 | 0.00333 | 0.00404 |
| Cd | 0.00322 | 0.00376 | 0.00443 |
| As | 0.00383 | 0.00431 | 0.00568 |
| Ni | <0.001 | <0.001 | <0.001 |
| Hg | <0.0005 | <0.0005 | <0.0005 |
Table 6.
Background and net added value of heavy metals in the most hazardous soil layers and soil heavy metal control standards (mg/kg).
Table 6.
Background and net added value of heavy metals in the most hazardous soil layers and soil heavy metal control standards (mg/kg).
| Heavy Metals | T1 | T2 | T3 | Limits |
|---|---|---|---|---|
| Cu | 19.20 (+2.38) | 20.66 (+3.83) | 25.67 (+6.89) | <100 |
| Cr | 52.68 (+2.34) | 55.92 (+5.58) | 58.79 (+9.08) | <250 |
| Zn | 50.91 (+6.27) | 55.06 (+10.42) | 65.76 (+15.77) | <300 |
| Pb | 19.54 (+3.63) | 19.99 (+4.08) | 20.80 (+4.89) | <170 |
| Cd | 0.123 (+0.039) | 0.208 (+0.110) | 0.242 (+0.144) | <0.6 |
| As | 15.98 (+2.66) | 16.17 (+2.85) | 21.95 (+10.43) | <25 |
| Ni | 27.34 (+2.82) | 27.76 (+3.25) | 30.45 (+5.93) | <190 |
| Hg | 0.056 (+0.025) | 0.109 (+0.078) | 0.130 (+0.099) | <3.4 |
Publisher’s Note: MDPI stays neutral with regard to jurisdictional claims in published maps and institutional affiliations. |
© 2022 by the authors. Licensee MDPI, Basel, Switzerland. This article is an open access article distributed under the terms and conditions of the Creative Commons Attribution (CC BY) license (https://creativecommons.org/licenses/by/4.0/).
Share and Cite
MDPI and ACS Style
Wu, B.; Qi, S.; Hu, Y.; Li, Y.; Zhou, J. Woodland for Sludge Disposal in Beijing: Sustainable? Sustainability 2022, 14, 7444. https://0-doi-org.brum.beds.ac.uk/10.3390/su14127444
AMA Style
Wu B, Qi S, Hu Y, Li Y, Zhou J. Woodland for Sludge Disposal in Beijing: Sustainable? Sustainability. 2022; 14(12):7444. https://0-doi-org.brum.beds.ac.uk/10.3390/su14127444
Chicago/Turabian StyleWu, Bingchen, Shi Qi, Yishui Hu, Yutong Li, and Jinxing Zhou. 2022. "Woodland for Sludge Disposal in Beijing: Sustainable?" Sustainability 14, no. 12: 7444. https://0-doi-org.brum.beds.ac.uk/10.3390/su14127444
Note that from the first issue of 2016, this journal uses article numbers instead of page numbers. See further details here.