Article

Impact of COVID-19 Lockdown on Vegetation Indices and Heat Island Effect: A Remote Sensing Study of Dhaka City, Bangladesh

by
Mizbah Ahmed Sresto
1,
Md. Manjur Morshed
1,
Sharmin Siddika
1,
Hussein Almohamad
2,*,
Motrih Al-Mutiry
3 and
Hazem Ghassan Abdo
4,5,6
1
Department of Urban and Regional Planning, Khulna University of Engineering and Technology, Khulna 9203, Bangladesh
2
Department of Geography, College of Arabic Language and Social Studies, Qassim University, Buraydah 51452, Saudi Arabia
3
Department of Geography, College of Arts, Princess Nourah bint Abdulrahman University, Riyadh 11671, Saudi Arabia
4
Geography Department, Faculty of Arts and Humanities, University of Tartous, Tartous 2147, Syria
5
Geography Department, Faculty of Arts and Humanities, University of Damascus, Damascus 30621, Syria
6
Geography Department, Faculty of Arts and Humanities, University of Tishreen, Latakia 30621, Syria
*
Author to whom correspondence should be addressed.
Sustainability 2022, 14(13), 7922; https://0-doi-org.brum.beds.ac.uk/10.3390/su14137922
Submission received: 13 May 2022 / Revised: 25 June 2022 / Accepted: 26 June 2022 / Published: 29 June 2022
(This article belongs to the Special Issue Sustainable Forest Management and Natural Hazards Prevention)

Abstract

:
It is predicted that the COVID-19 lockdown decreased environmental pollutants and, hence, urban heat island. Using the hypothesis as a guide, the objective of this research is to observe the change in vegetation pattern and heat-island effect zones in Dhaka, Bangladesh, before and after COVID-19 lockdown in relation to different forms of land use and land cover. Landsat-8 images were gathered to determine the vegetation pattern and the heat island zones. The normalized difference vegetation index (NDVI) and the modified soil-adjusted vegetation index (MSAVI12) were derived for analyzing the vegetation pattern. According to the results of the NDVI, after one month of lockdown, the health of the vegetation improved. In the context of the MSAVI12, the highest MSAVI12 coverages in March of 2019, 2020, and 2021 (0.45 to 0.70) were 22.15%, 21.8%, and 20.4%, respectively. In May 2019, 2020, and 2021, dense MSAVI12 values accounted for 23.8%, 25.5%, and 18.4%, respectively. At the beginning of lockdown, the calculated LST for March 2020 was higher than March 2019 and March 2021. However, after more than a month of lockdown, the LST reduced (in May 2020). After the lockdown in May 2020, the highest UHI values ranging from 3.80 to 5.00 covered smaller land-cover regions and reduced from 22.5% to 19.13%. After the end of the lockdown period, however, industries, markets, and transportation resumed, resulting in the expansion of heat island zones. In conclusion, strong negative correlations were observed between the LST and vegetation indices. The methodology of this research has potential for scholarly and practical implications. Secondly, urban policymakers can use the methodology of this paper for the low-cost monitoring of urban heat island zones, and thus take appropriate spatial counter measures.

1. Introduction

In 2020, as COVID-19 began to spread, lockdowns were enforced in a number of countries to impede its progress. At the beginning of February 2021, more than 100 million people were fighting the disease and approximately 2.3 million had already died as a result [1,2]. COVID-19 has spread globally by human-to-human transmission, resulting in a significant rise in human mortality and enormous economic losses [3,4]. In an effort to stop the spread of the disease, some governments have taken painstaking measures to close cities and prohibit outdoor activity [3,4,5]. Heat-island impact lessened as plant growth increased, as a result of transportation network and industrial activity restrictions [6,7,8].
The COVID-19-induced lockdown had a substantial influence on the local ecosystem [9,10]. Lockdown delayed the discharge of pollutants from industrial and other building sites, resulting in a society that was more efficient and less dirty [7,8,9] due to reductions in carbon dioxide, nitrogen oxide, and aerosol emissions, as well as temperature [11]. As a result of these alterations, vegetation was able to grow at a rapid rate without interruption. This shows an immediate favorable impact on the environment as a result of a decrease in land surface temperature (LST) [11,12]. The COVID-19 lockdown is also anticipated to have an effect on urban heat islands (UHIs), a problem that is characterized by higher temperatures in urban areas compared to their rural equivalents [8,13,14]. Historically, it was believed that changes in land use and land cover (LULC), climate change, and fast urbanization were the primary drivers of land degradation processes in the Earth system [15,16].
Since urban heat islands (UHIs) are one of the most significant human-caused climatic changes [17,18,19,20], academics around the world have raised the alarm and paid them close attention. Not only climatic issues, but also excessive heat phenomena have proven to be one of the major threats to human health, increasing the death of individuals with pre-existing health issues such as cardiovascular disease, respiratory allergies, and airway illnesses [21,22]. The principal causes of the UHI [23,24,25,26] include the alteration of surface form, surface structure, fabric, and property changes that are linked with urbanization and the subsequent change in climate. Nevertheless, UHI is also influenced by human activities that emit anthropogenic heat (AHR) [27,28].
Cities are typically more densely populated than rural areas; hence, their anthropogenic heat release output is higher [29,30]. This is mostly due to the increased usage of roadways, industrial and commercial operations, air conditioning in the home, and the human metabolism [29,30]. There is substantial evidence that AHR leads to UHIs in both atmospheric and surface temperature. Several AHR-related characteristics, such as energy consumption, urban city expansion, and population density, show a substantial association with UHII, according to reports [17,31]. In cities at high latitudes where the AHR that is generated by winter domestic heating systems is large, UHI increases at night throughout the winter [18,32]. Variations in UHI have also been evaluated during periods of large human activity shifts [33,34]. COVID-19 has demonstrated that limiting human activity during lockdown is likely to have a substantial effect on urban climates, particularly UHIs and LST. Some of the steps that were adopted to prevent the spread of COVID-19 reduced UHIs, including the reduction in outdoor human activities, the loss of output, and the closure of markets and transit networks [35,36].
According to a recent study [37], COVID-19 had indirect environmental consequences in China, the United States, Italy, and Spain. To analyze the effects on the climate, a study of traffic congestion in Montreal, Canada during the outbreak was conducted [4]. Throughout the pandemic, Guojun et al. [38] examined urban pollution in China. In contrast, few other scholars [3] have researched the ground surface temperature in the Chinese city of Yogyakarta. Reducing human activity can lessen the impact of urban heat intensity [39]. Similar to Alqasemi et al. and Gaffar et al. [5,35], a few other researchers found that limiting human activity improved the environment, including UHI and air quality. Many studies were undertaken for detecting the relationship between thermal change and vegetation pattern. For example, Kafy et al., (2020) and Zhang et al., (2022) identified the spatiotemporal change in the LST and the normalized difference vegetation index (NDVI). They also quantified the relationship between the LST and the NDVI [40,41]. For detecting the change in vegetation more effectively, a vegetation index named the modified soil-adjusted vegetation index (MSAVII2) was used by different researchers [42,43,44]. During COVID-19, a number of studies were evaluated to investigate the association between heat islands and vegetation. Guha and Govil [45], for example, analyzed the impact of the COVID-19 lockdown on the LST and the NDVI in 2021. Wai et al., (2022) examined the association between human activity and the UHI effect on five international cities that were impacted by COVID-19 [28]. Ibrahim et al., (2021) performed another study by applying machine-learning models to determine the effect of COVID-19 shutdown on aerosol optical depth over Europe [46].
The very first instance of COVID-19 in Bangladesh was identified on 11 March 2020, and the first death was confirmed on 18 March 2020. The Government of Bangladesh then instituted a lockdown from 23 March 2020 to 30 May 2020 in an effort to contain the virus. A total of 14,77,930 cases have been documented in Bangladesh to date (25 August 2021). Fewer emissions arise during longer durations of industrial lockdown and quarantine. According to study [36,45,47], Bangladesh has significantly lower water pollution, air temperature, and air pollution levels.
Dhaka is the fastest-growing metropolis in Bangladesh, and it is believed that the COVID-19 lockdown has caused a number of environmental changes. The significant decrease in human activity during the COVID-19 lockdown is anticipated to have a substantial effect on urban climates, notably urban heat islands (UHIs). Previous studies determined that global (and urban) temperatures are on the rise, and that reducing the intensity of the UHI’s influence is crucial in many metropolitan regions, as heatwaves are projected to become more intense [23,24,48]. At the local level, however, there was little evidence that the COVID-19 lockdown affected vegetation or heat island patterns. So, it is important to assess how the heat island zones and the distribution of vegetation indices changed due to the COVID-19 lockdown in Dhaka.
This study therefore focuses on detecting changes in vegetation patterns by considering two different vegetation indices (NDVI and MSAVI12) and heat-island effect zones in Dhaka, Bangladesh, before and after COVID-19 lockdown, for distinct land-use land cover types. This research particularly determines the current land cover distribution of Dhaka city. Secondly, to detect the vegetation pattern in a more sophisticated way, two vegetation indices—namely the NDVI and the MSAVI12—were identified, and lastly, the heat island pattern was evaluated in order to observe the relationship between the thermal properties of the land surface and vegetation indices. The real contribution of this research is that it is one of the few studies in Bangladesh that uses GIS and remote sensing techniques to measure the impact of COVID-19 lockdown on urban LST and UHI. Secondly, the methodology that is proposed in the study is low-cost and efficient and offers continuous monitoring of the urban environment. Therefore, urban managers and policy makers can use the methodology to evaluate the impact of environmental events that are similar to COVID-19 on the urban environment.

2. Materials and Methods

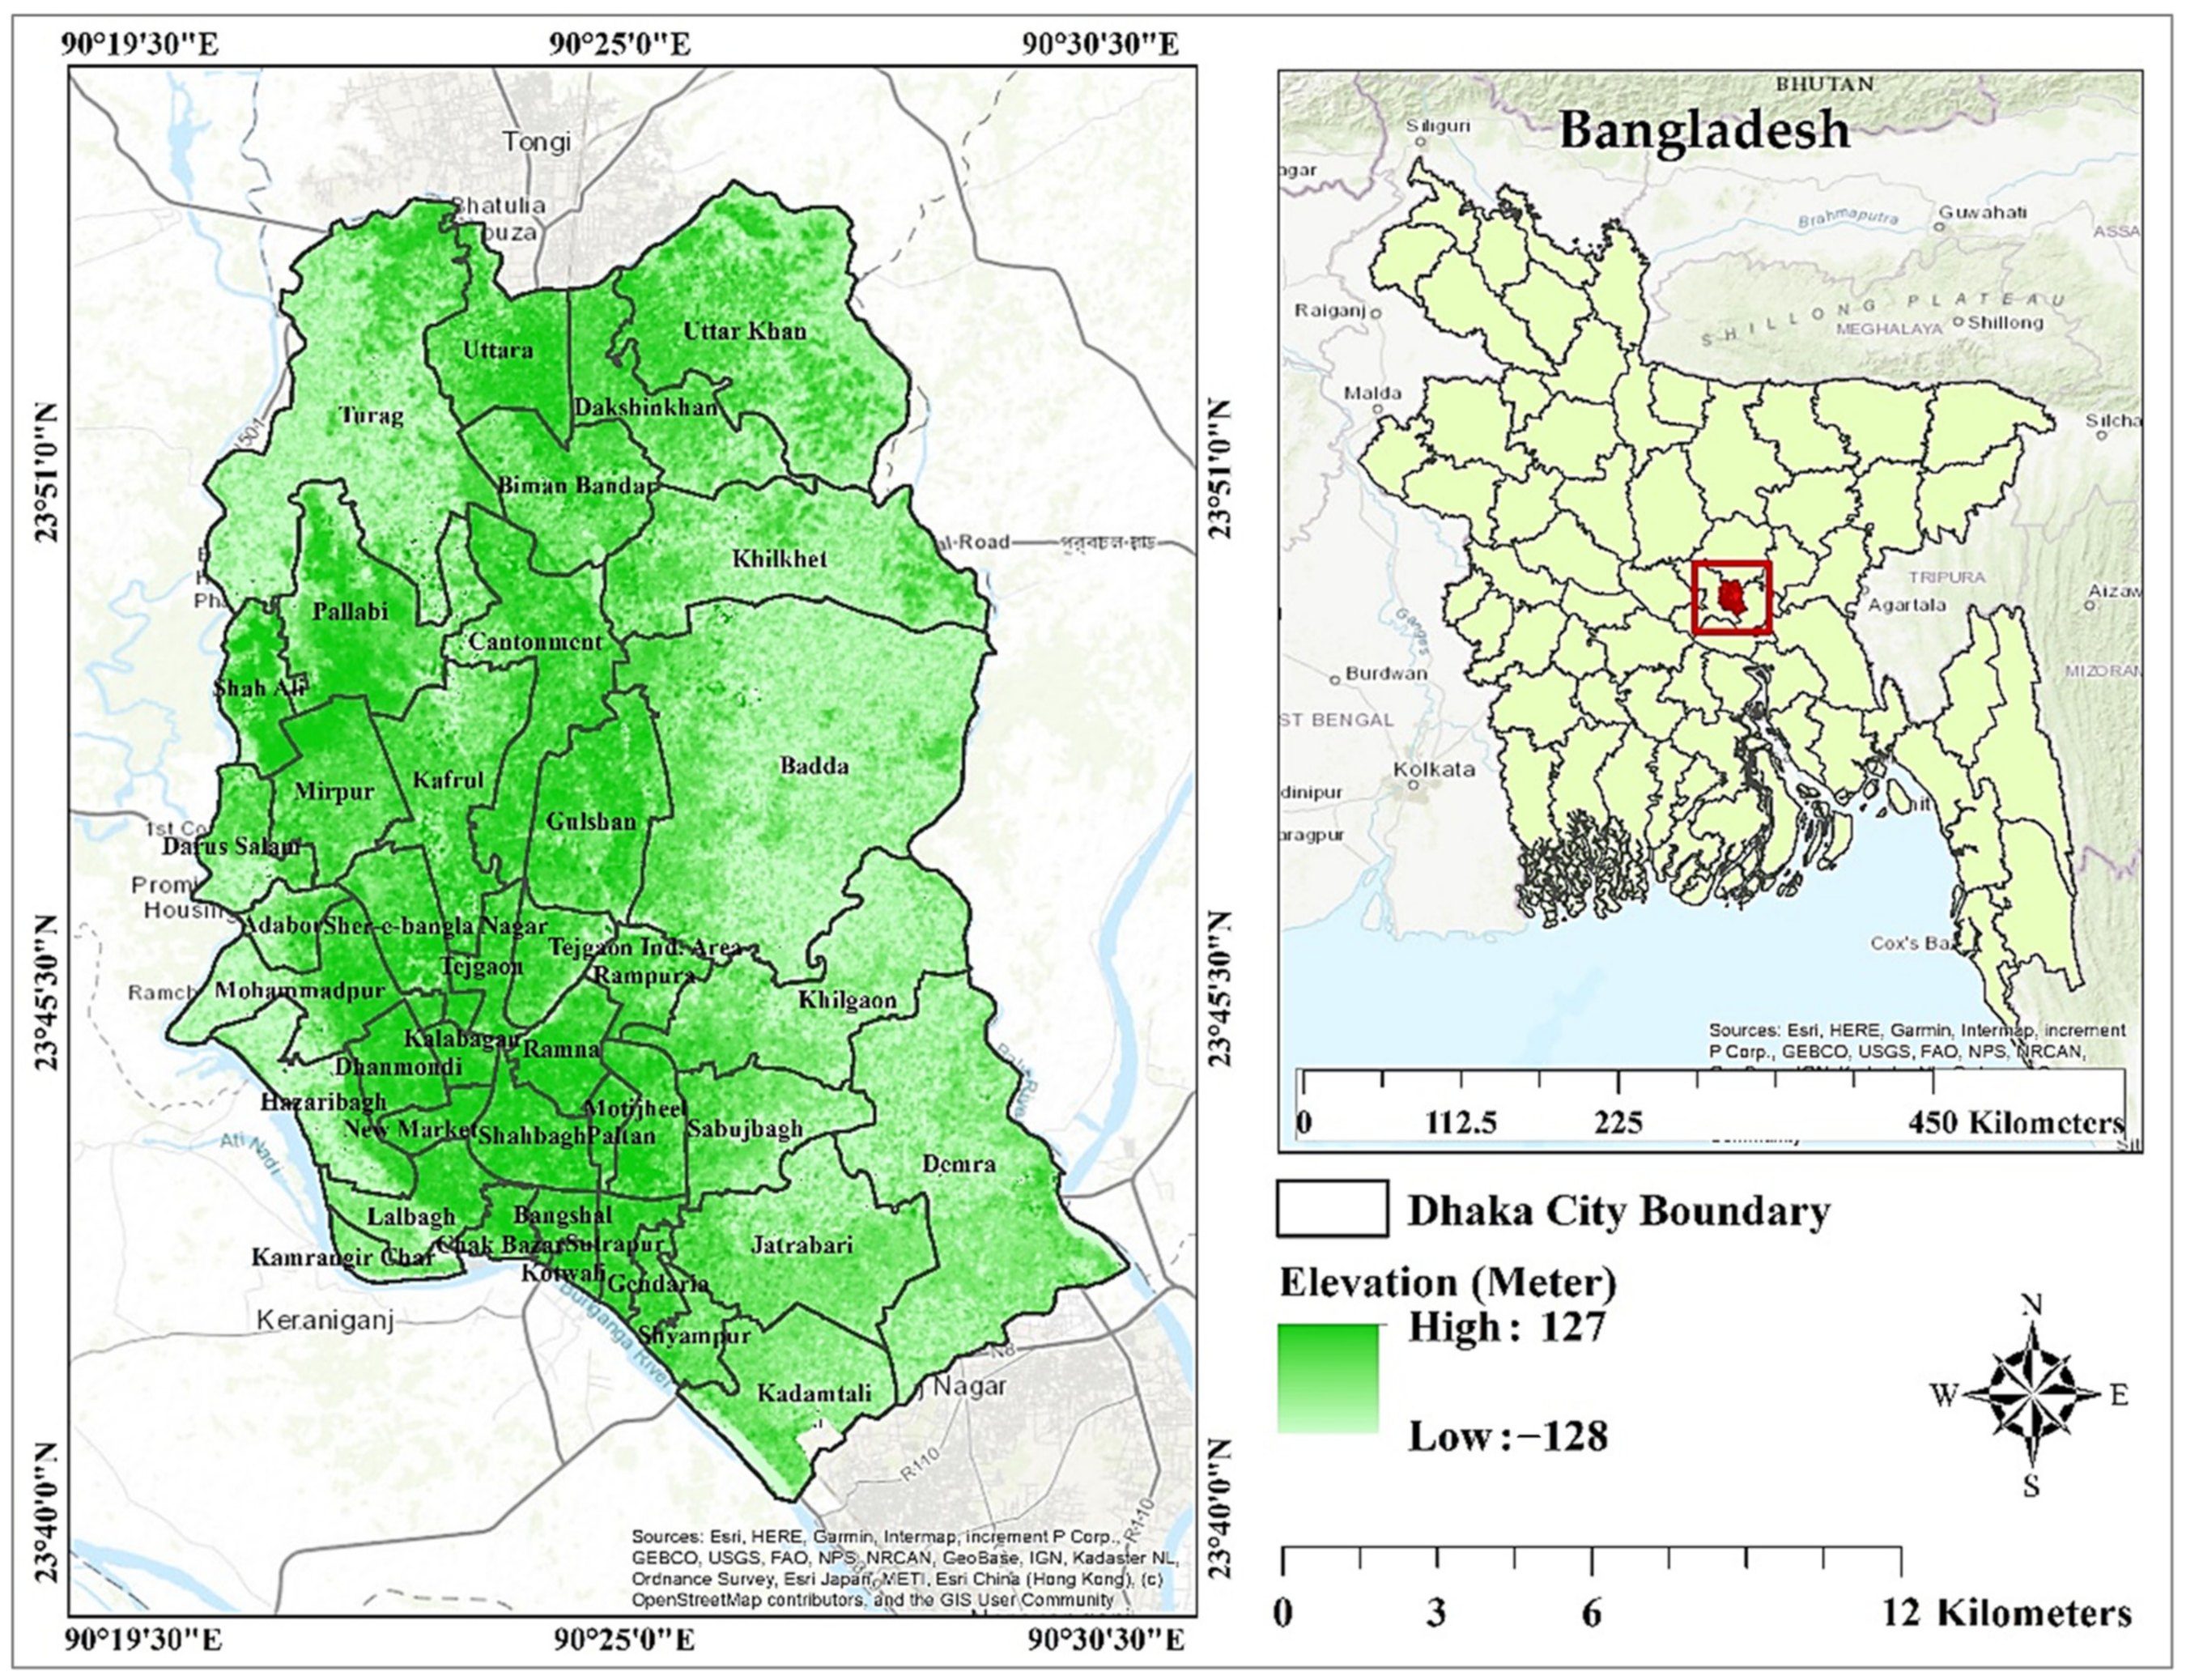
2.1. Selection of the Study Area

The metropolitan region of Dhaka is located between the latitudes 23°53′ and 24°06′ north and the longitudes 90°01′ and 90°37′ east [48]. The district shares its northern border with Tangail and Gazipur, its southern boundary with Munshiganj, its western border with Rajbari and Manikganj, and its eastern border with Narayanganj (Figure 1). Dhaka’s population is increasing at a pace of approximately 4 percent each year, one of the quickest rates among Asian cities [49].
Due to a high population growth rate, migration rate, industrialization, and bad development planning, over 62.80% of the Dhaka Metropolitan Area (DMA) became built-up [49,50]. This resulted in fast urban expansion in the upazilas (tertiary urban centers) surrounding the Dhaka Metropolitan Area, including Dhamrai, Savar, Keraniganj, Dohar, and Nawabganj, which are within the Dhaka district (Figure 1). Various types of infrastructure, including roads and highways, industry, commercial buildings, factories, etc., were constructed in these regions in order to attract foreign investors, and to offer urban service facilities for the local populace, so as to foster economic growth [48,49,50]. Even though such initiatives will provide communities with economic opportunities and socioeconomic benefits, they will also lead to urban expansions, LULC alterations, and an acceleration of urban heat island (UHI) impacts in the study area.

2.2. Image Details

For assessing heat island variation before and after COVID-19 Landsat-8, collection 1 level-1 images were assembled for this study. Geographical information system (GIS) based remote-sensing software Arc map 10.8 was used to process and analyze the acquired images. Image details are given in Table 1.

2.3. Radiometric Image Correction

All bands were blended (a total of 11 for Landsat 8). Following the research of Gogoi et al., (2019) and Saha et al., (2021) [51,52], three types of satellite image pre-processing approaches have been utilized: geometric, atmospheric, and radiometric. The geometric correction was carried out using accurate spatial reference. Following the findings of Morshed et al., a FLAASH atmospheric adjustment was executed [53]. To minimize the noise caused by atmospheric conditions. After radiometric correction, the digital number values (DN) were transformed to reflectance. The following formula was used to convert the DN data to radiance, taking into account the gain and bias of various bands.
Lλ = gain × QCAL + bais
where Lk is the sensor’s spectrum radiance, QCAL is the quantized calibrated pixel value, and gain and bias are the band-specific rescale factors. Taking into account the earth-sun distance and sun elevation, the radiance was transformed to reflectance using the following formula:
ρ λ = L λ × π × d 2 ESUN × sin θ E
where ρ λ = reflectance at ToA, d = earth-sun distance in astronomical units on the day the image was acquired, ESUN = the mean solar exo-atmospheric irradiance, and θ E = the solar elevation angle in degrees.

2.4. Land Use Land Cover Classification (LULC)

The geographic resolution of the Landsat-8 image was utilized to evaluate the LULC categories in ArcGIS 10.7 version [49] for the years 2000, 2010, and 2020. Additionally, atmospheric and radiometric modifications have been made to improve accuracy [54]. In this investigation, supervised image classification was used to identify LULC kinds, as indicated by the literature [48,55]. The maximum likelihood supervised-classification model is used to categorize the land cover type into five distinct groups (built-up area, undeveloped land, agricultural land, aquatic bodies, and vegetation) in order to determine the land cover design [50,56,57].

2.5. Normalized Difference Vegetation Index (NDVI)

The NDVI is identified using pixel values from the near-infrared and red spectral bands of Landsat [55,58]. The NDVI is computed as suggested by the studies of Kafy et al., (2020) and Mostafiz et al., (2021) [42,59]. The equation is given below (Equation (3)):
NDVI = NIR   Band     Red   Band NIR   Band   +   Red   Band
The NDVI was examined in real time to identify differences in land cover over the evaluation period. The NDVI runs from −1.0 (lowest) to +1.0 (highest) (highest). Low NDVI values are related with rocky terrain, urban areas, and other developed regions [58,60,61].

2.6. Modified Soil-Adjusted Vegetation Index (MSAV-I2)

The MSAVI12 was developed to address the limitations of the NDVI in soil-exposed locations. The MSAVI12 was originally another version of the soil-adjusted vegetation index (SAVI). The disadvantage of calculating SAVI is that the user must define the soil-brightness correction factor (L), which is found by trial and error based on the quantity of vegetation in the study area. Many individuals use the default L value of 0.5, which is somewhat incorrect for various locations [44,46]. SAVI was created to provide information about the amount of vegetation on a surface, but before it can be utilized, the user must be aware of the surface’s vegetation characteristics [59]. The MSAVI12 was developed to design a more dependable soil-brightness correction factor. The MSAVI12 is computed with the following formula, as suggested by Chehbouni et al., (1994) and Adeyeri et al., (2017) [42,44]:
MSAVI 12 = ( 2 × NIR + 1 2 × NIR + 1 2 8 × NIR R 2

2.7. Land Surface Temperature (LST)

Using satellite thermal data, the LST is quantified via sensor radiometric alignment, the correction of air and surface reflectance, the presentation of land-cover spatial diversity, and other methods. This study determined the LST of a particular location in order to address the present ecological situation of the studied area. The authors referred to Kafy et al., (2020) [48] for the complexities of the cycle for inducing the LST using Landsat images.
LST is the radioactive temperature of the Earth’s surface, which is essential for comprehending the fundamental science of the land surface via the energy cycle and aquatic interaction with the surrounding environment [34,49]. An LST analysis with satellite thermal data necessitates a number of techniques, such as sensor radiometric alignment, the correction of air and surface reflectance, and the spatial variation of LULC. The LST calculation procedure is explained below in Equations (5)–(9) by following the method of Zhang et al., (2022) and Kafy et al., (2020) [40,41].
Lλ = AL + ML × QCAL
where L = TOA spectral radiance (W/(m2 sr m)); ML = and’s radiance multiplicative scaling factor; AL = band’s radiance additive scaling factor; QCAL = digital numbers (DN) of band 10; and ML = band’s radiance multiplicative scaling factor. Then, the values of TOA spectral radiance (L) are transformed to at-satellite brightness temperature (TB).
TB = K 2 ln K 1 L λ + 1  
where TB = at-satellite brightness temperature, in Kelvin (K); K1, K2 = thermal conversion constants for the band. Then, the percentage of vegetation cover (Pv) and surface emissivity (ε) are computed using the following equations (Equations (8) and (9)):
Pv = NDVI     NDVImin   NDVImax   NDVImin 2
ε = (0.004 × Pv) + 0.986
TOA brightness temperature was finally translated to the LST values in Kelvin (K).
LST = [ TB   1 + λ   × TB   α ln ε ]
where λ = the wavelength of emitted radiance; α = hc/k (1.438 × 10⁻² mK); h = Planck constant (6.626 × 10⁻³⁴ J s−1); c = velocity of light (2.998 × 10⁸ m s−1); and k = Boltzmann constant (1.38 × 10⁻²³ J K−1)

2.8. Surface Urban Heat Island (SUHI)

Typically, the UHI effect is calculated by comparing the temperature readings in an urban location to those of the surrounding area [62,63]. Urban heat island effect’s influence on urban environment and ecological change has been a popular topic. Numerous approaches [63,64] have been employed by academics from around the world in order to measure the amount and magnitude of UHI. The development of RS technology has been useful in the UHI investigation. UHI may be monitored and studied continuously by utilizing multi-temporal infrared RS data [65,66]. UHI is related to LULC and the global expansion of vegetation intensity [67,68,69]. Using sensed spatial information, the intensity of surface heat islands is measured independently in urban and rural locations, and selected pixels are analyzed in this context. This evaluation relies heavily on stations and designated pixels. The LST is compared based on seasonal variation within a year using a standardized technique [49,70,71].
UHI = Ts Tm SD
where Ts = land surface temperature (LST), Tm = mean of the LST, and SD = standard deviation.

3. Results

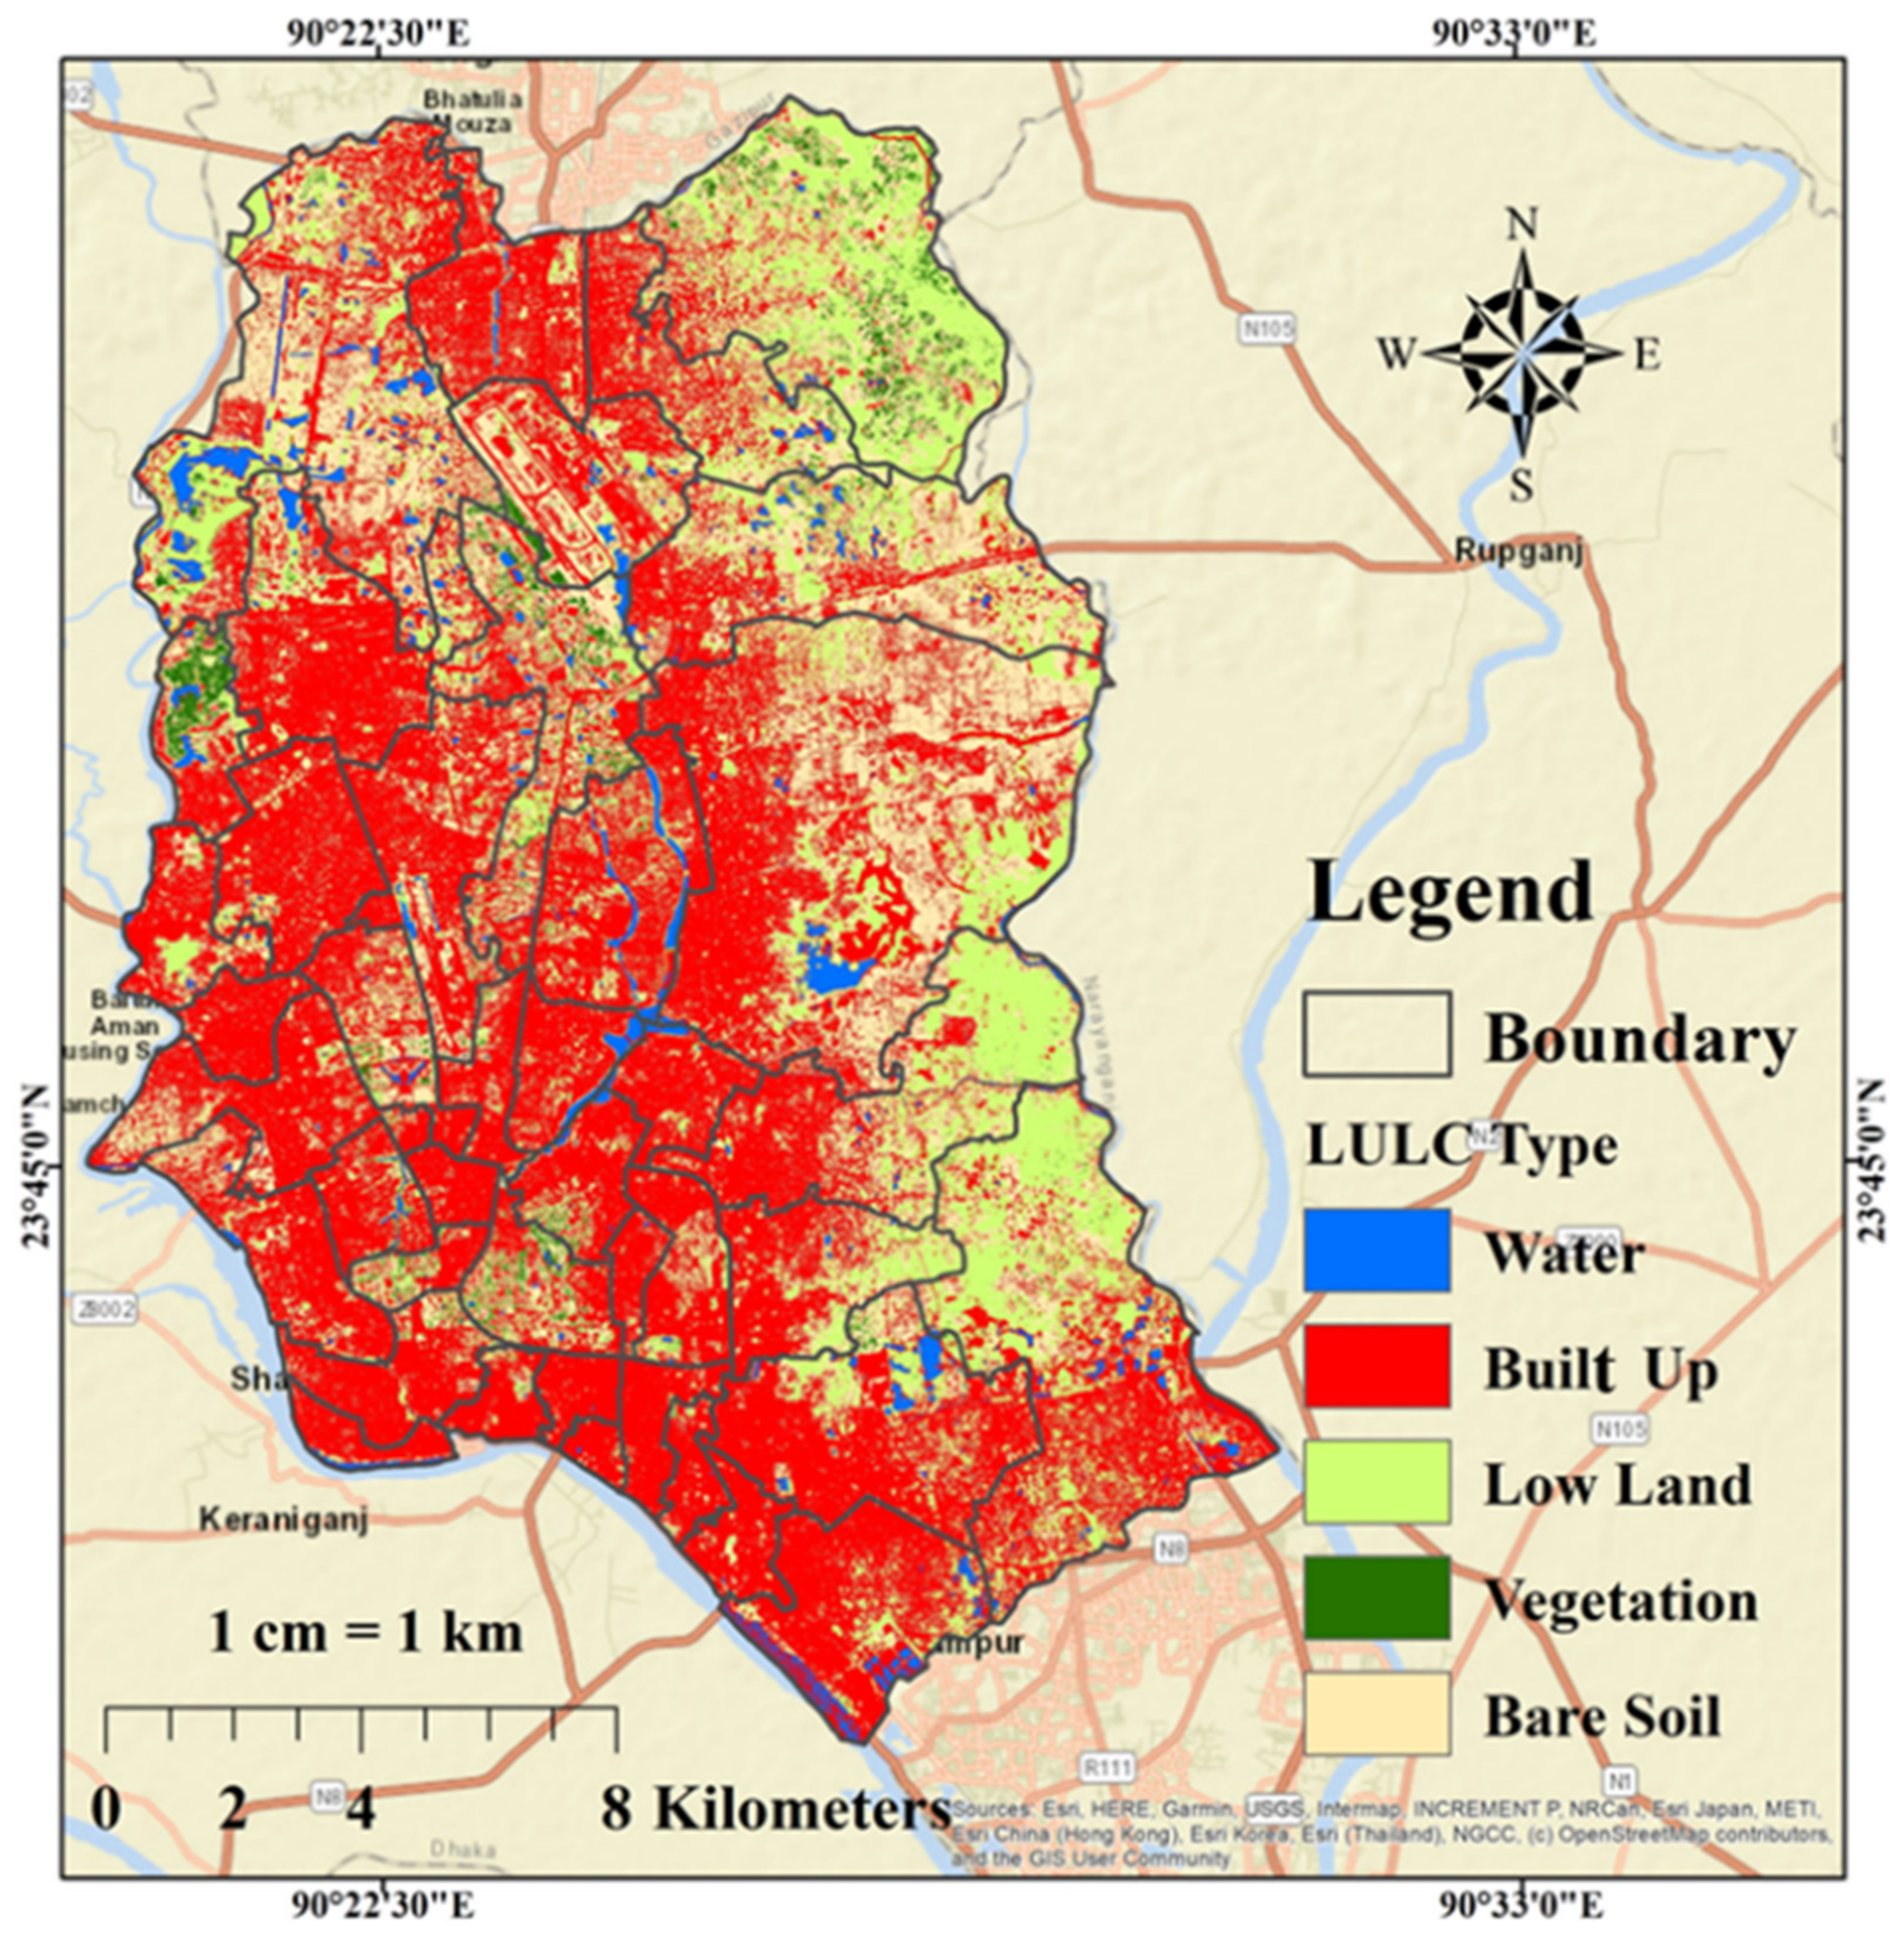
3.1. Land Use Land Cover

The city of Dhaka has a total area of 306 km2. Dhaka’s land use land cover was divided into five major categories: bare soil, built-up area, low land, vegetation cover, and water body. The majority of the LULC classes in the city is built-up areas. A total of 52.7 percent of the land area is developed (161.1702 km2). Approximately 25 percent of the area’s land surface is composed of bare soil (76.5 km2). Low-lying land and water contain 15 percent and 3.5 percent, respectively. In contrast, barely three percent of the whole area is covered by vegetation (Figure 2 and Table 2).

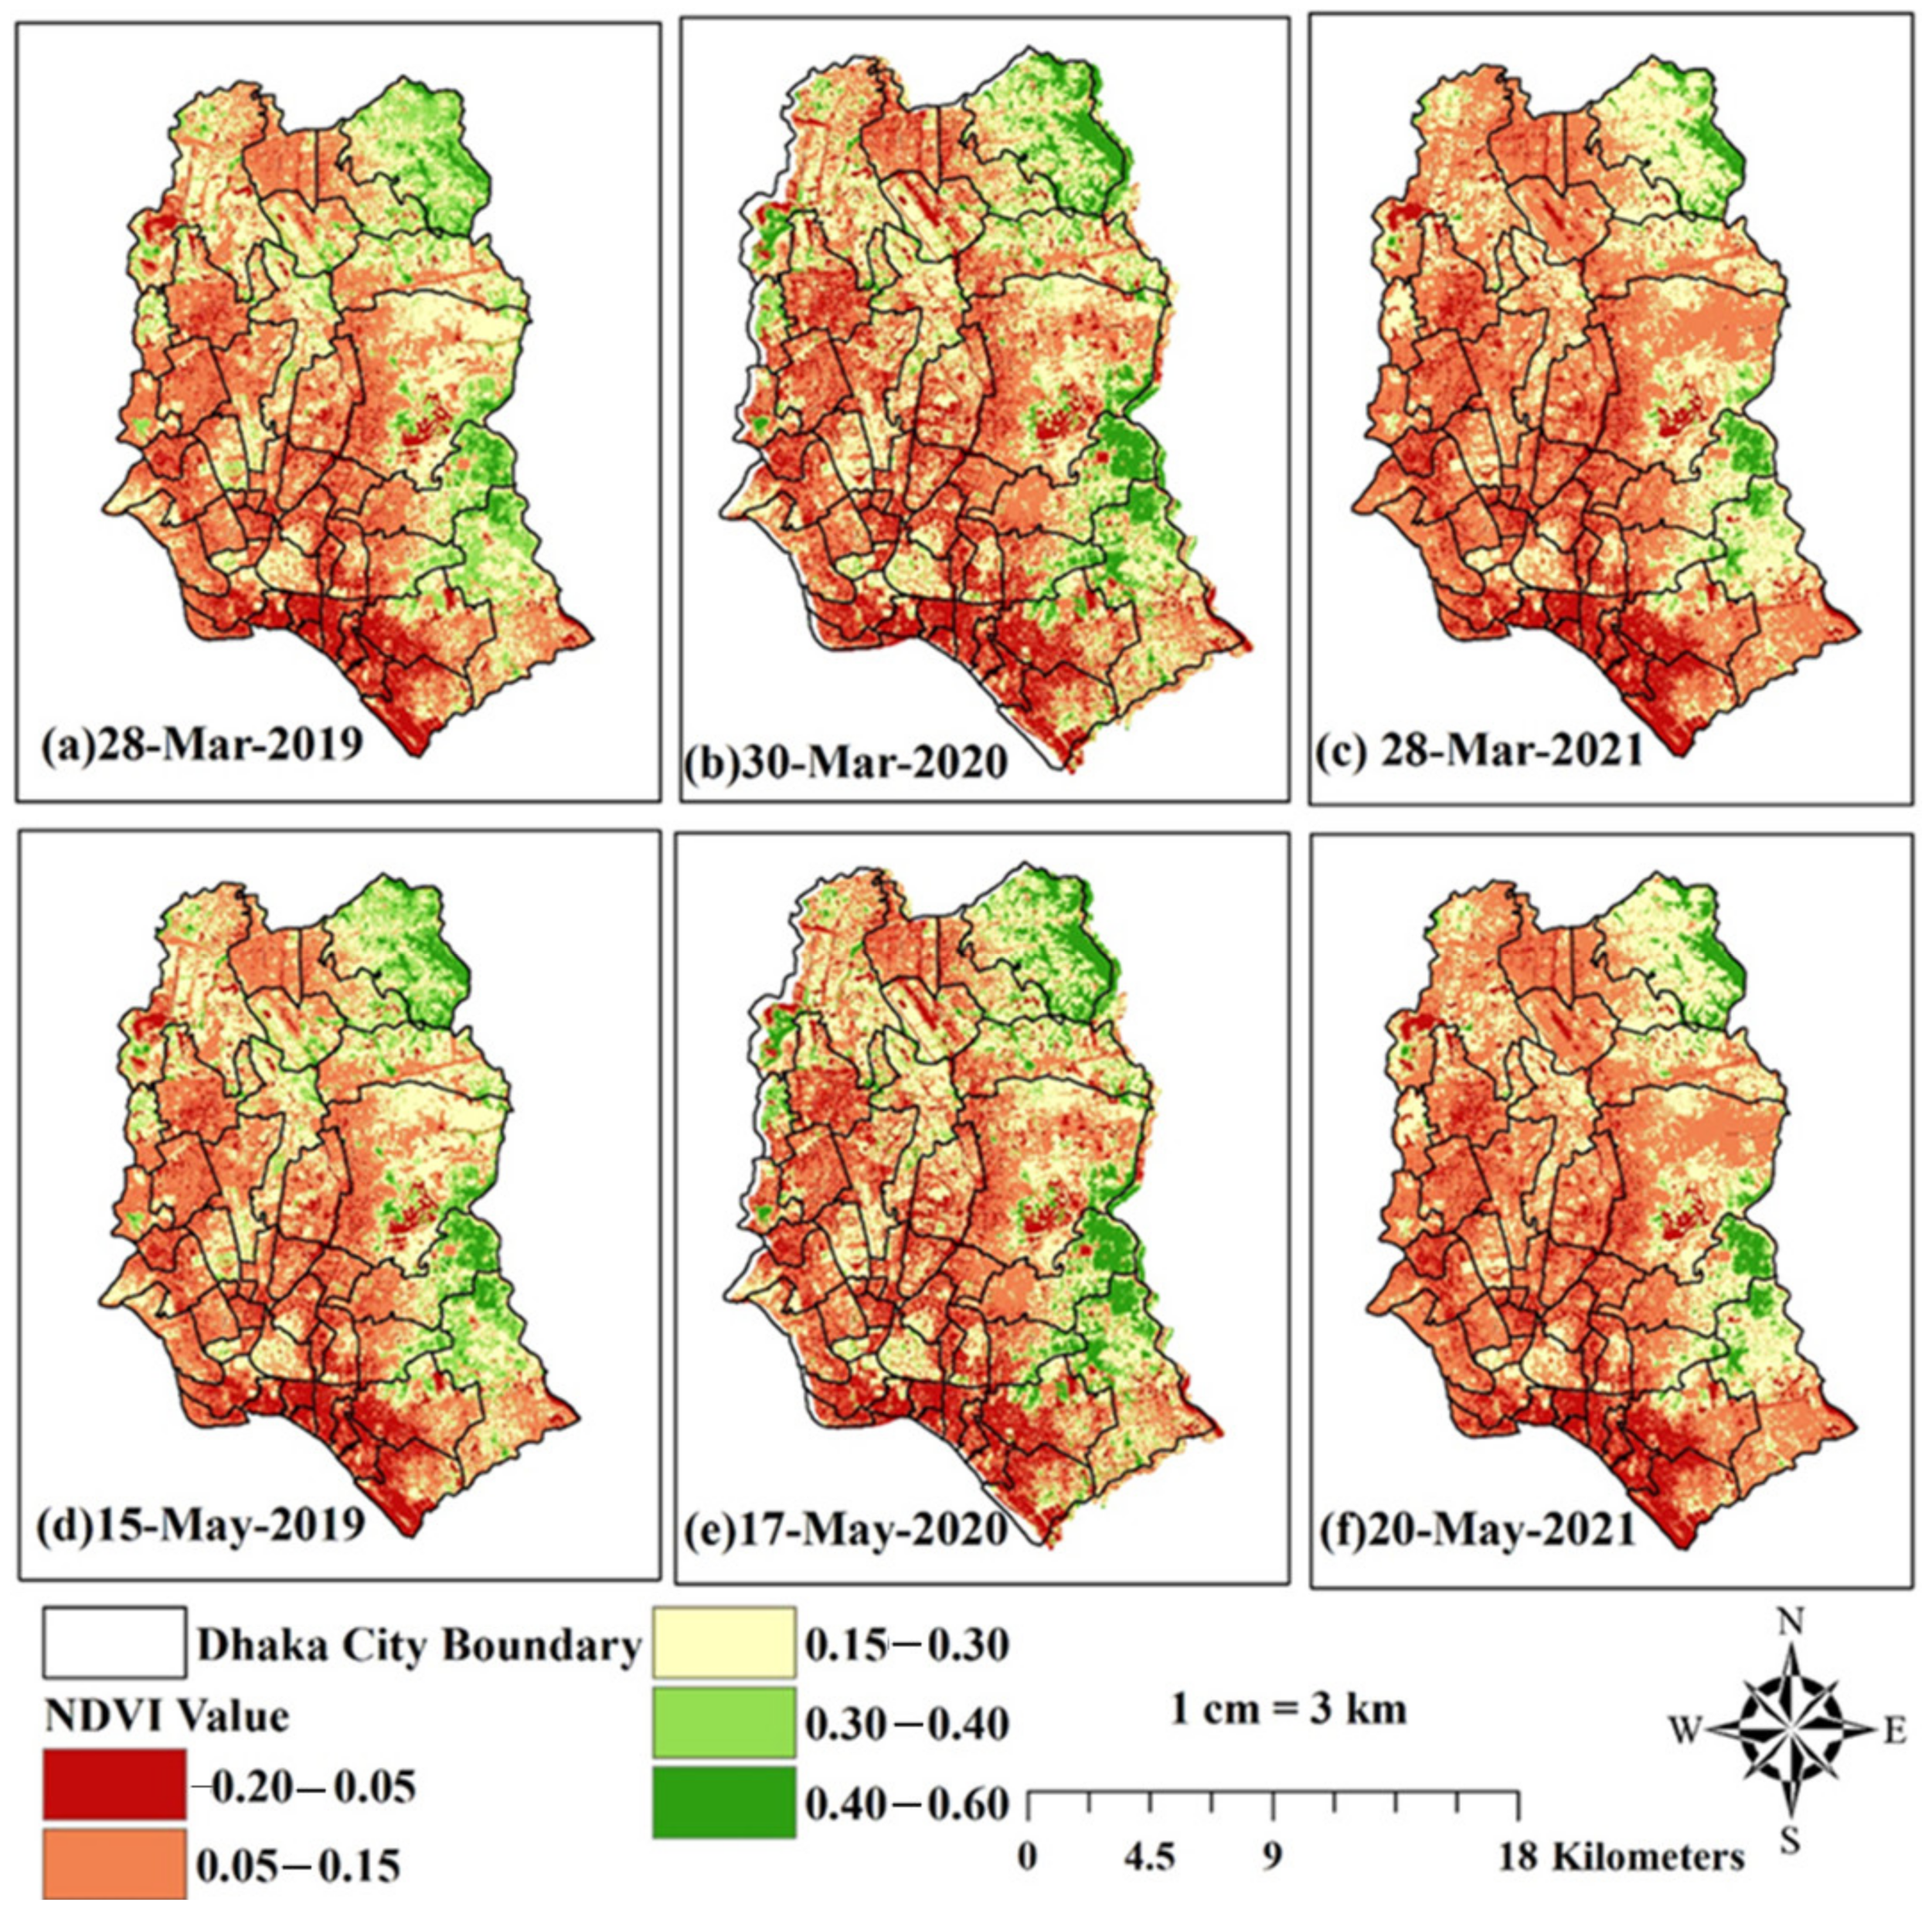
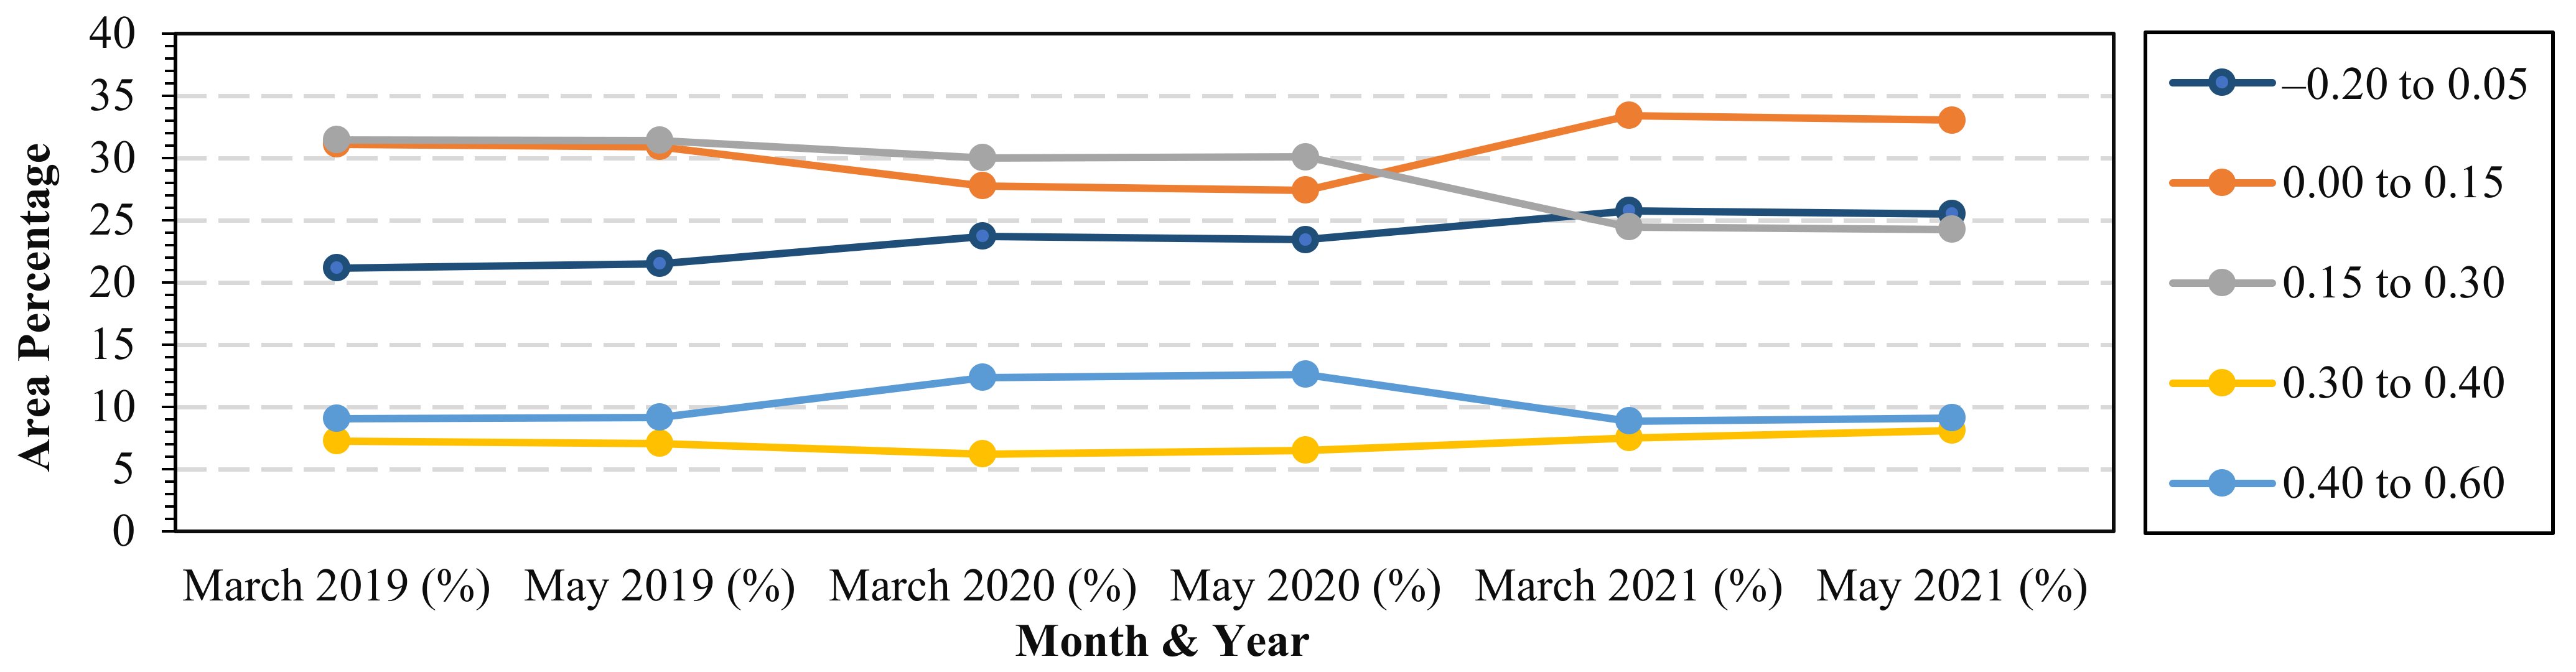
3.2. Normalized Difference Vegetation Index (NDVI)

The results of the NDVI indicate that Dhaka has relatively little dense plant cover. Minimum NDVI values range between −0.20 and 0.05. From March 2019 to March 2021, the area with the lowest NDVI value (−0.20 to 0.05) comprised 21.15 percent, 23.7 percent, and 25.7 percent of the total land area. In May of 2019, 2020, and 2021, the lowest NDVI values covered 21.5, 23.42, and 25.5 percent of the area, respectively.
In March of 2019, 2020, and 2021, the levels of dense NDVI coverage (0.4 to 0.60) were 9%, 12.35%, and 8.85%, respectively. In May of 2019, 2020, and 2021, the dense NDVI values were 9%, 12.6%, and 9.11%, respectively. The moderate to average NDVI value also grew, and after the lockdown phase, it covered a larger region, between 0.08 and 0.3% (from March 2020 to May 2020, values ranging from 0.15 to 0.30 and 0.30 to 0.40) (Figure 3 and Figure 4 and Table 3).

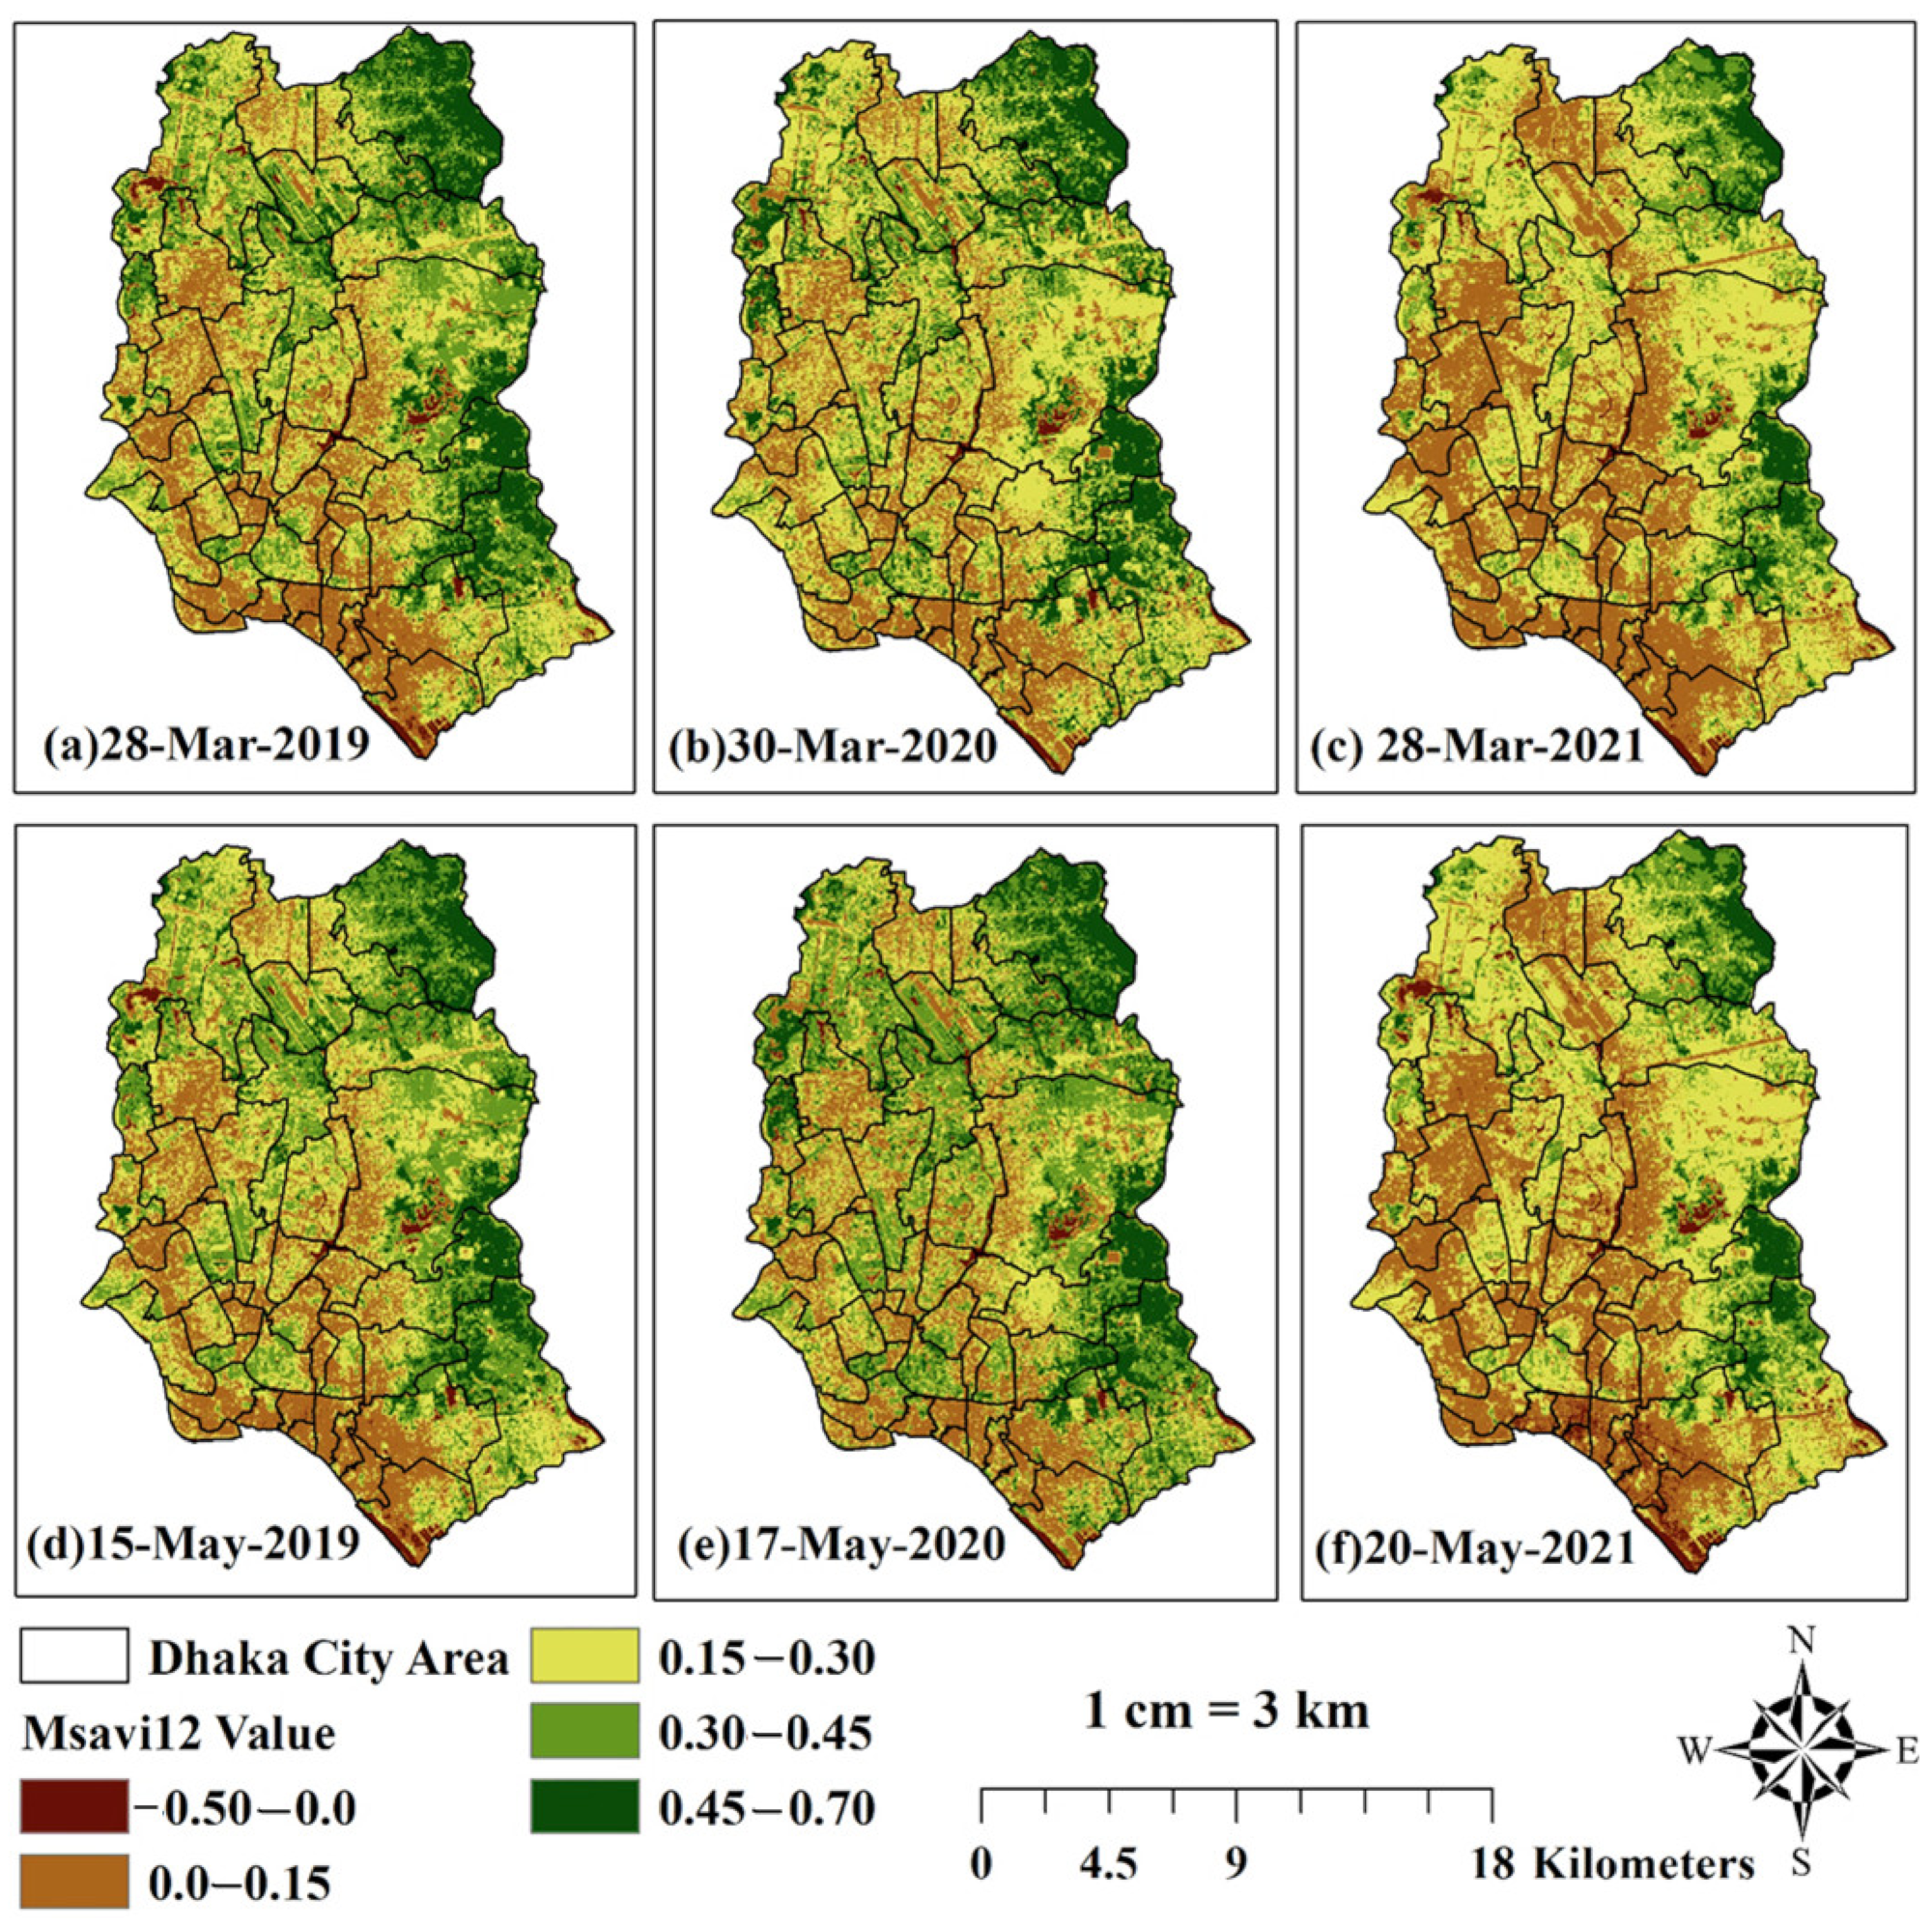
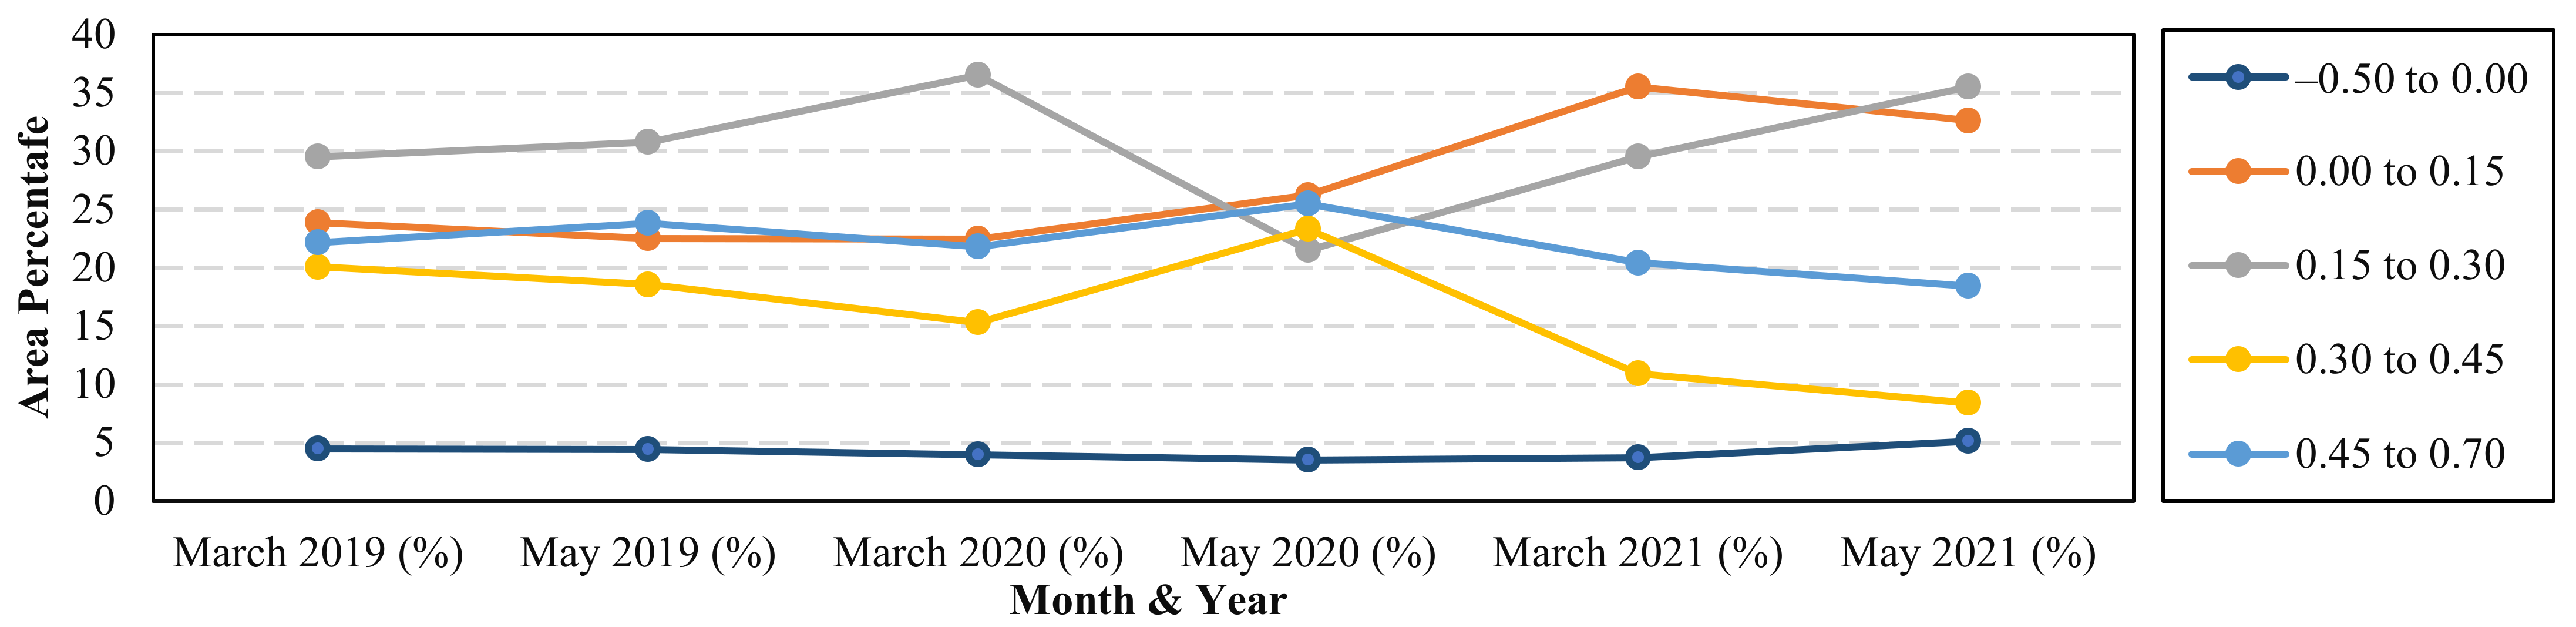
3.3. Modified Soil-Adjusted Vegetation Index (MSAVI12)

The MSAVI12 results showed that there was a much lower amount of vegetation cover in Dhaka before the lockdown (March 2020). However, this improved after the lockdown (May 2020). The lowest MSAVI12 values range from −0.50 to 0.00. From March 2019 to March 2021, the lowest MSAVI12 value (−0.50 to 0.00) covered 4.45%, 3.95%, and 3.7% of the total area. At the same time, from May 2019 to May 2021, the lowest MSAVI12 values covered 4.4%, 3.5%, and 5.1% of the area.
In March of 2019, 2020, and 2021, the highest MSAVI12 values (0.45 to 0.70) covered 22.15 percent, 21.8 percent, and 20.4 percent, respectively. In May 2019, 2020, and 2021, dense MSAVI12 values accounted for 23.8 percent, 25.5 percent, and 18.4 percent, respectively. The moderately good value (between 0.30 and 0.45) of MSAVI12 rose, and after the lockdown (March 2020 to May 2020) it covered approximately 8 percent of additional areas (Figure 5 and Figure 6 and Table 4).

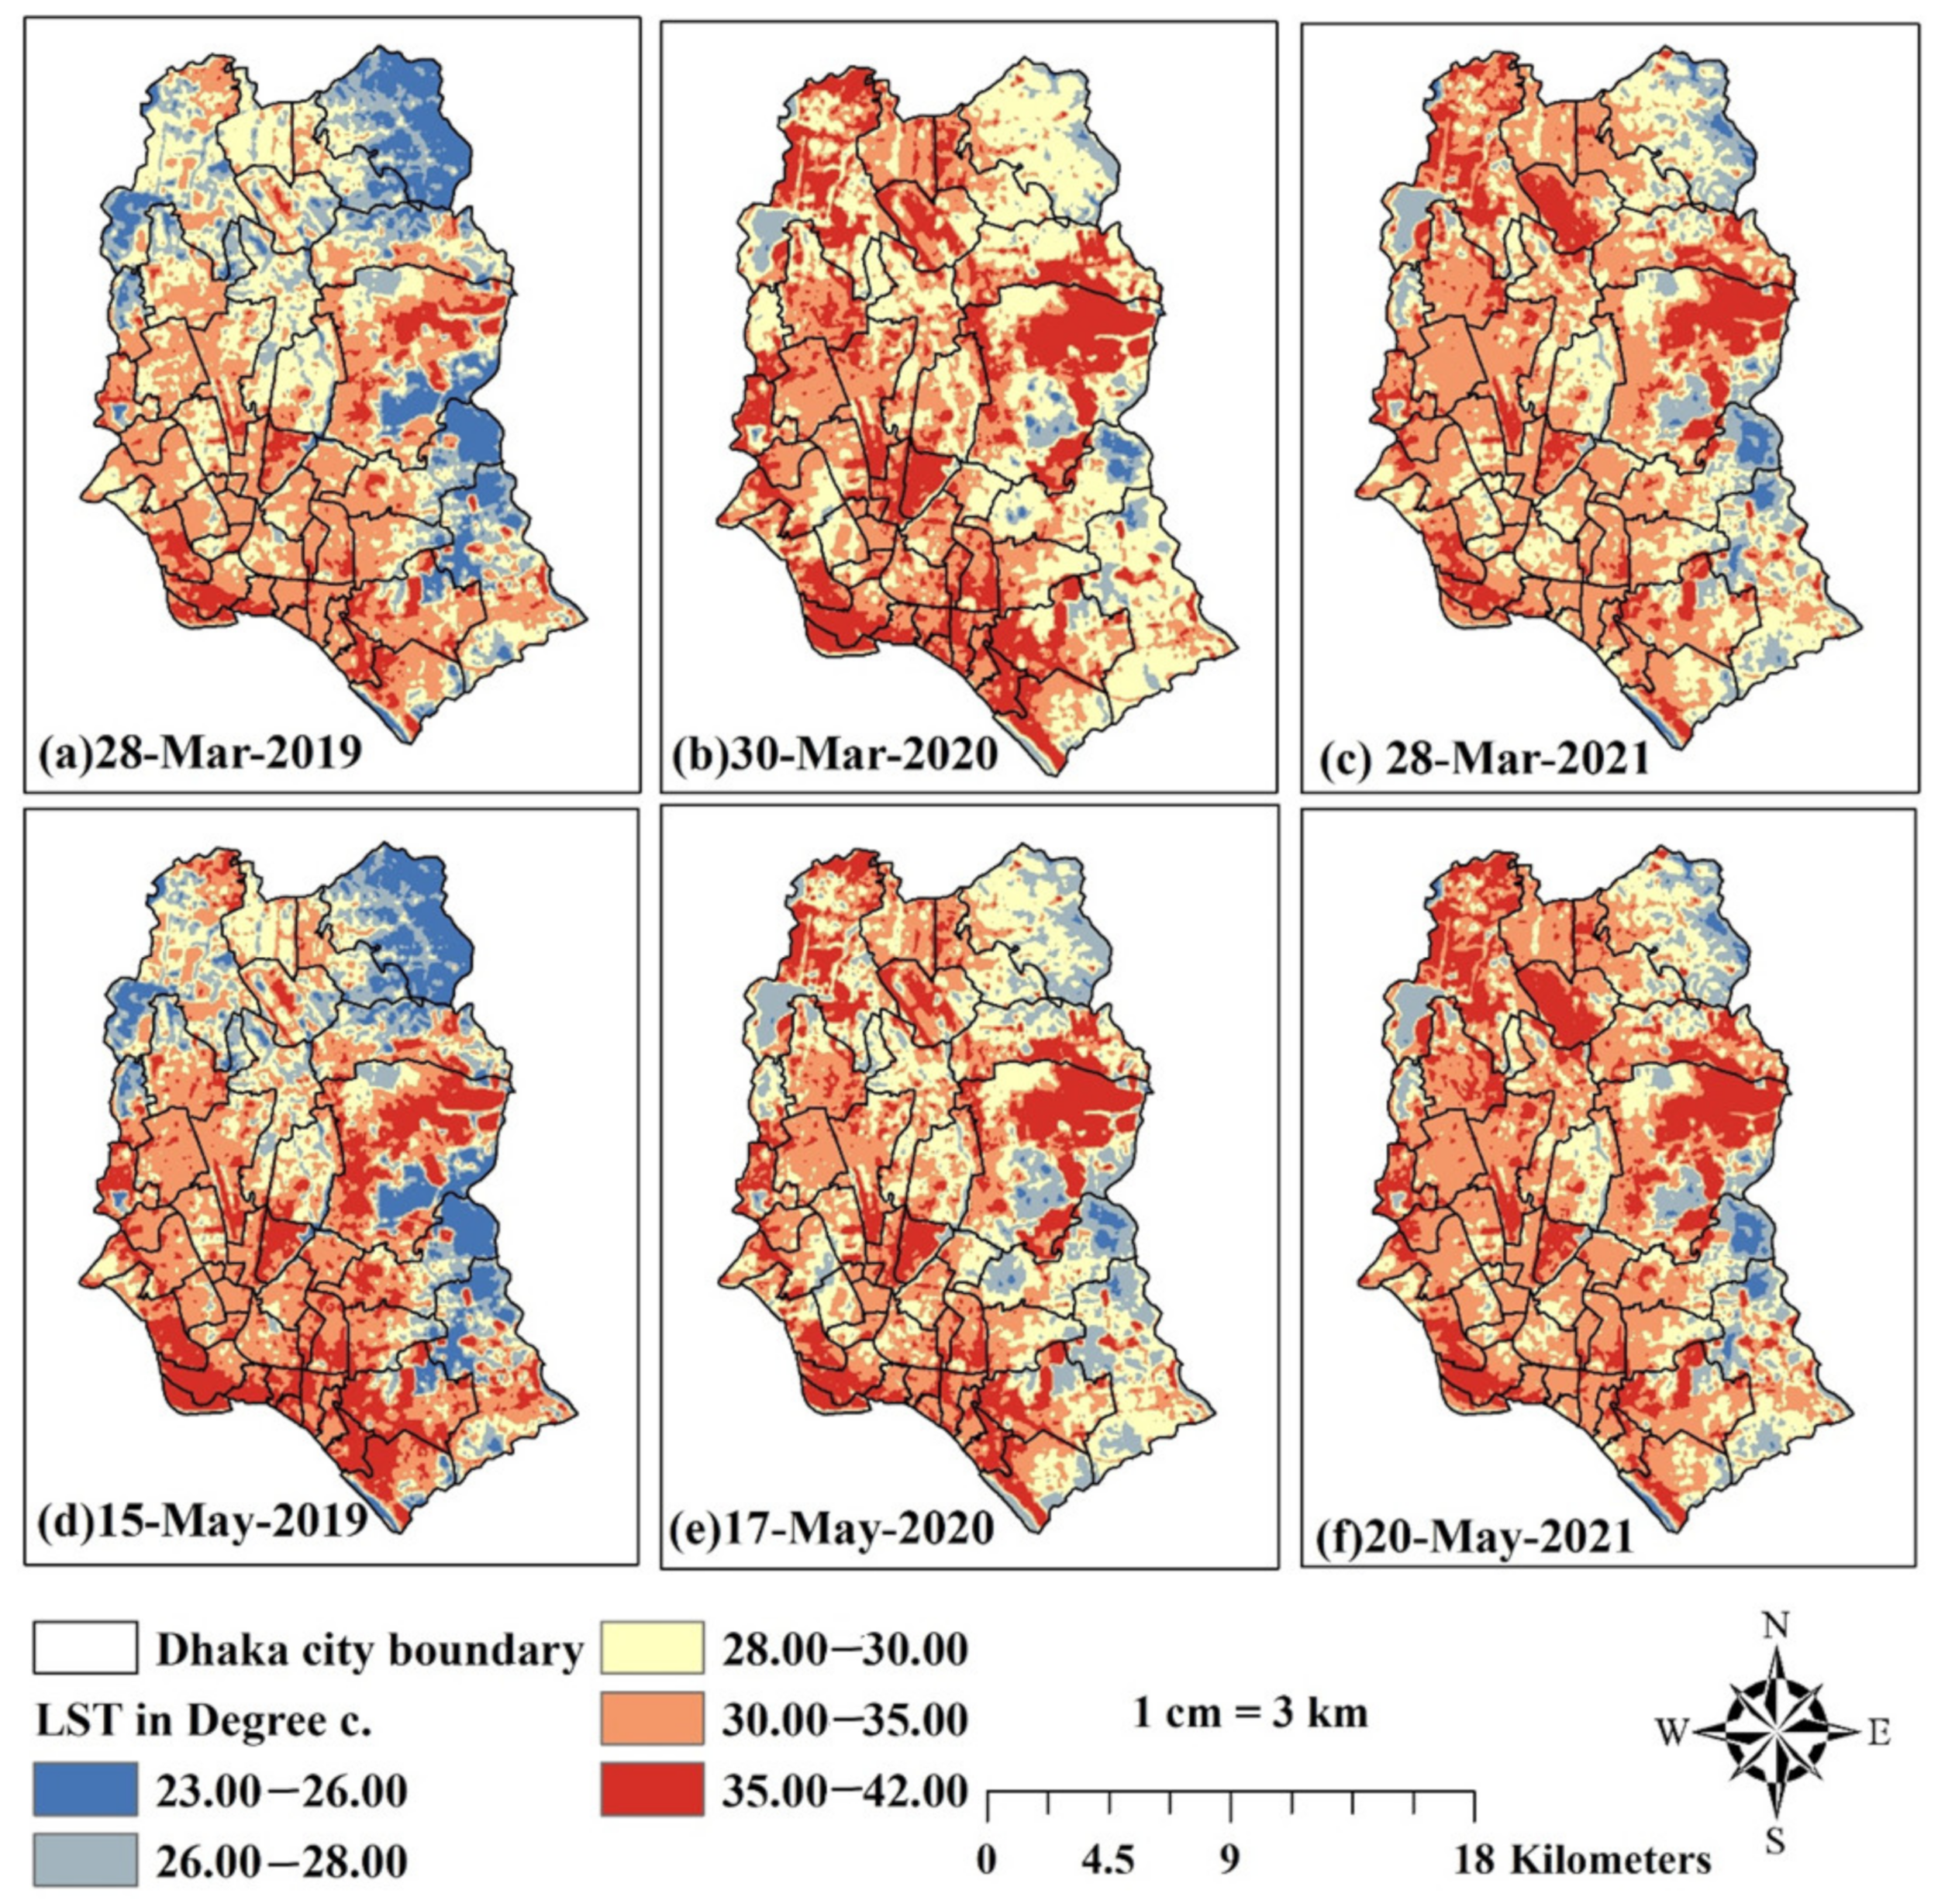
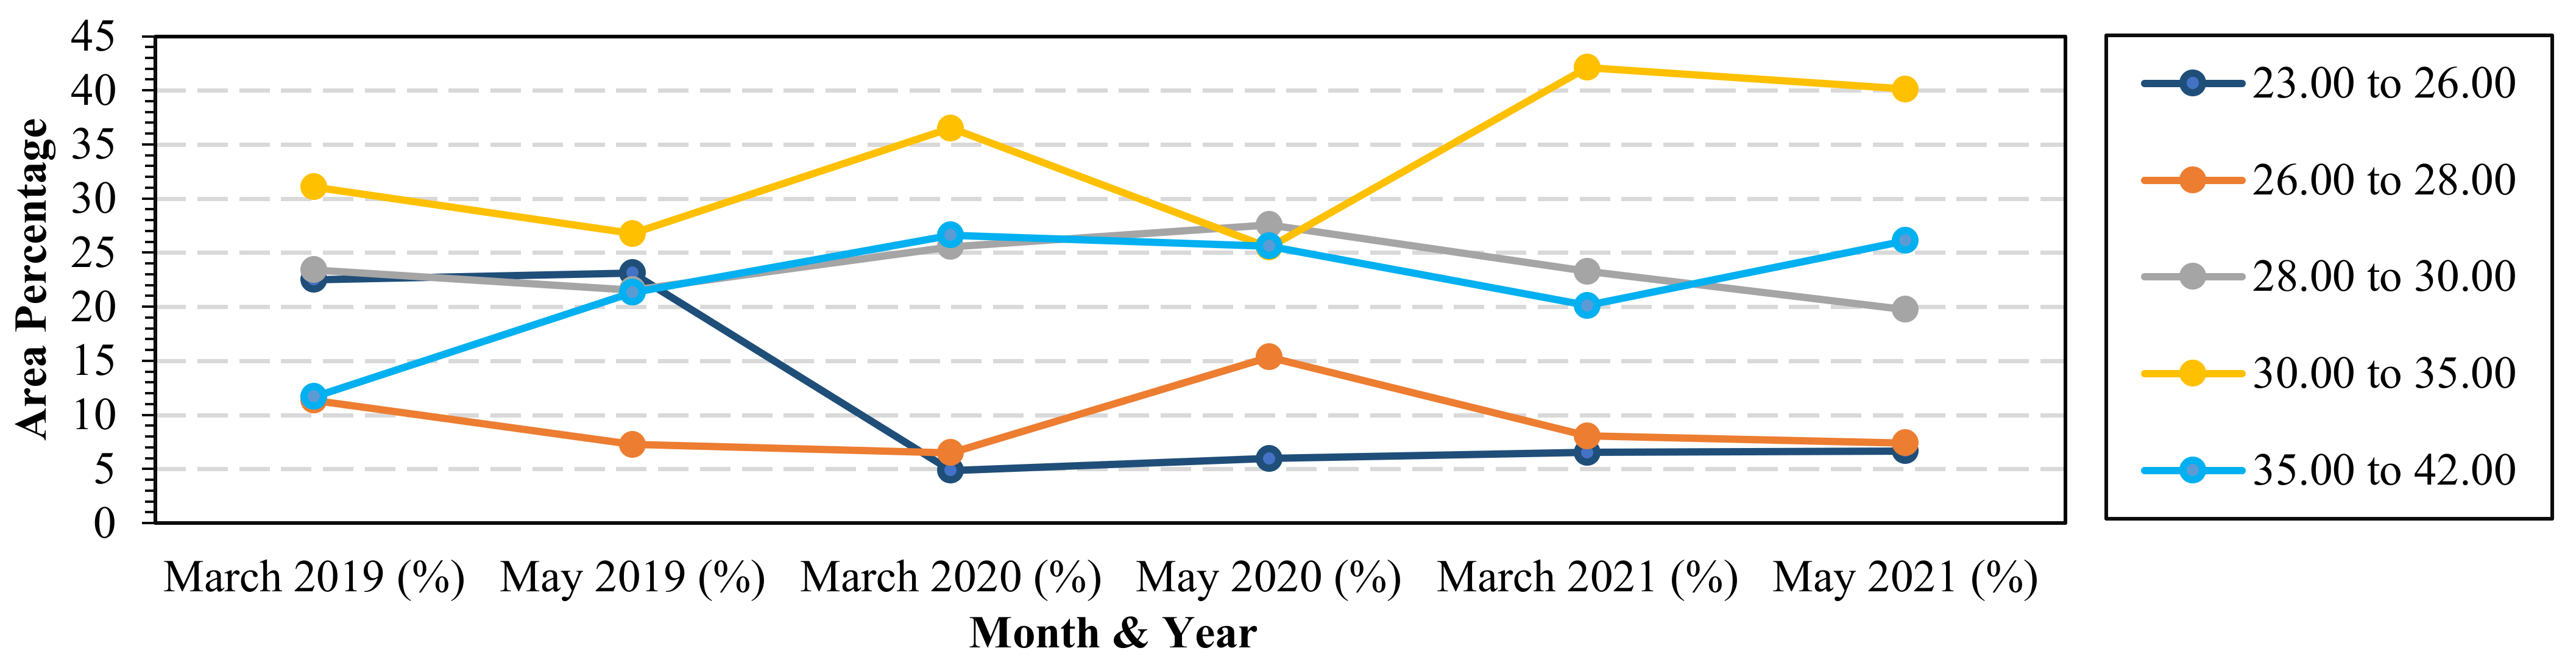
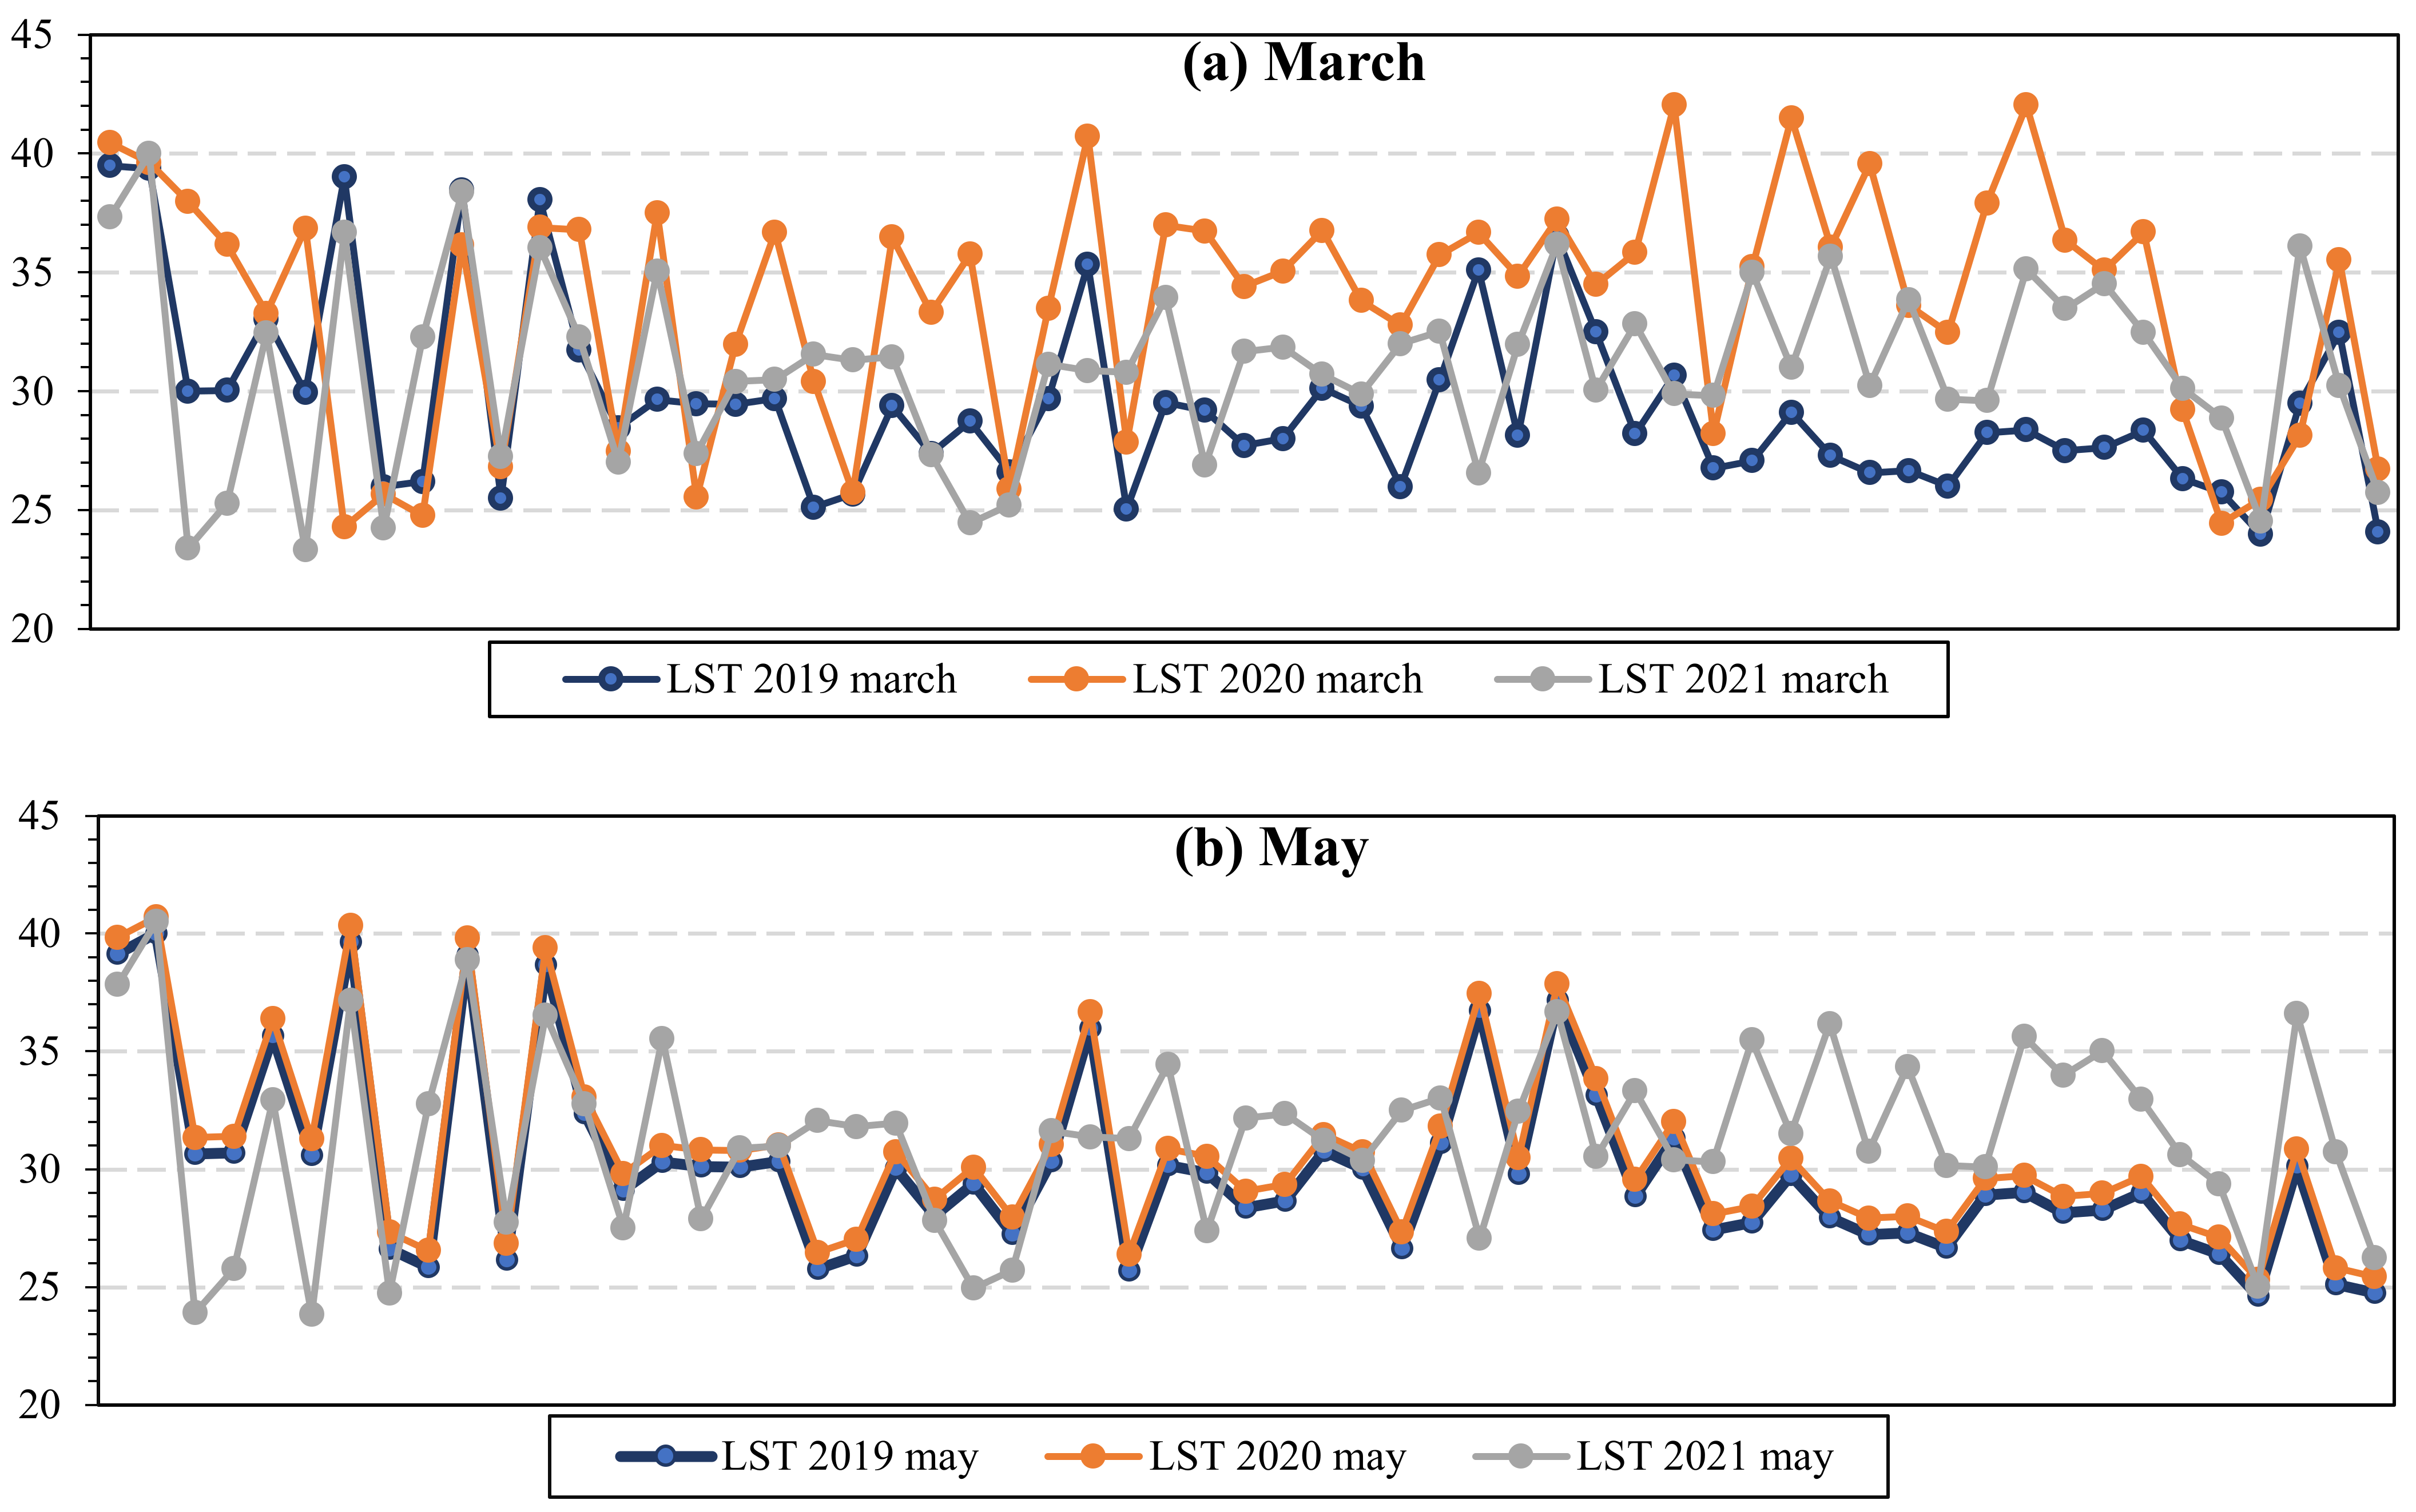
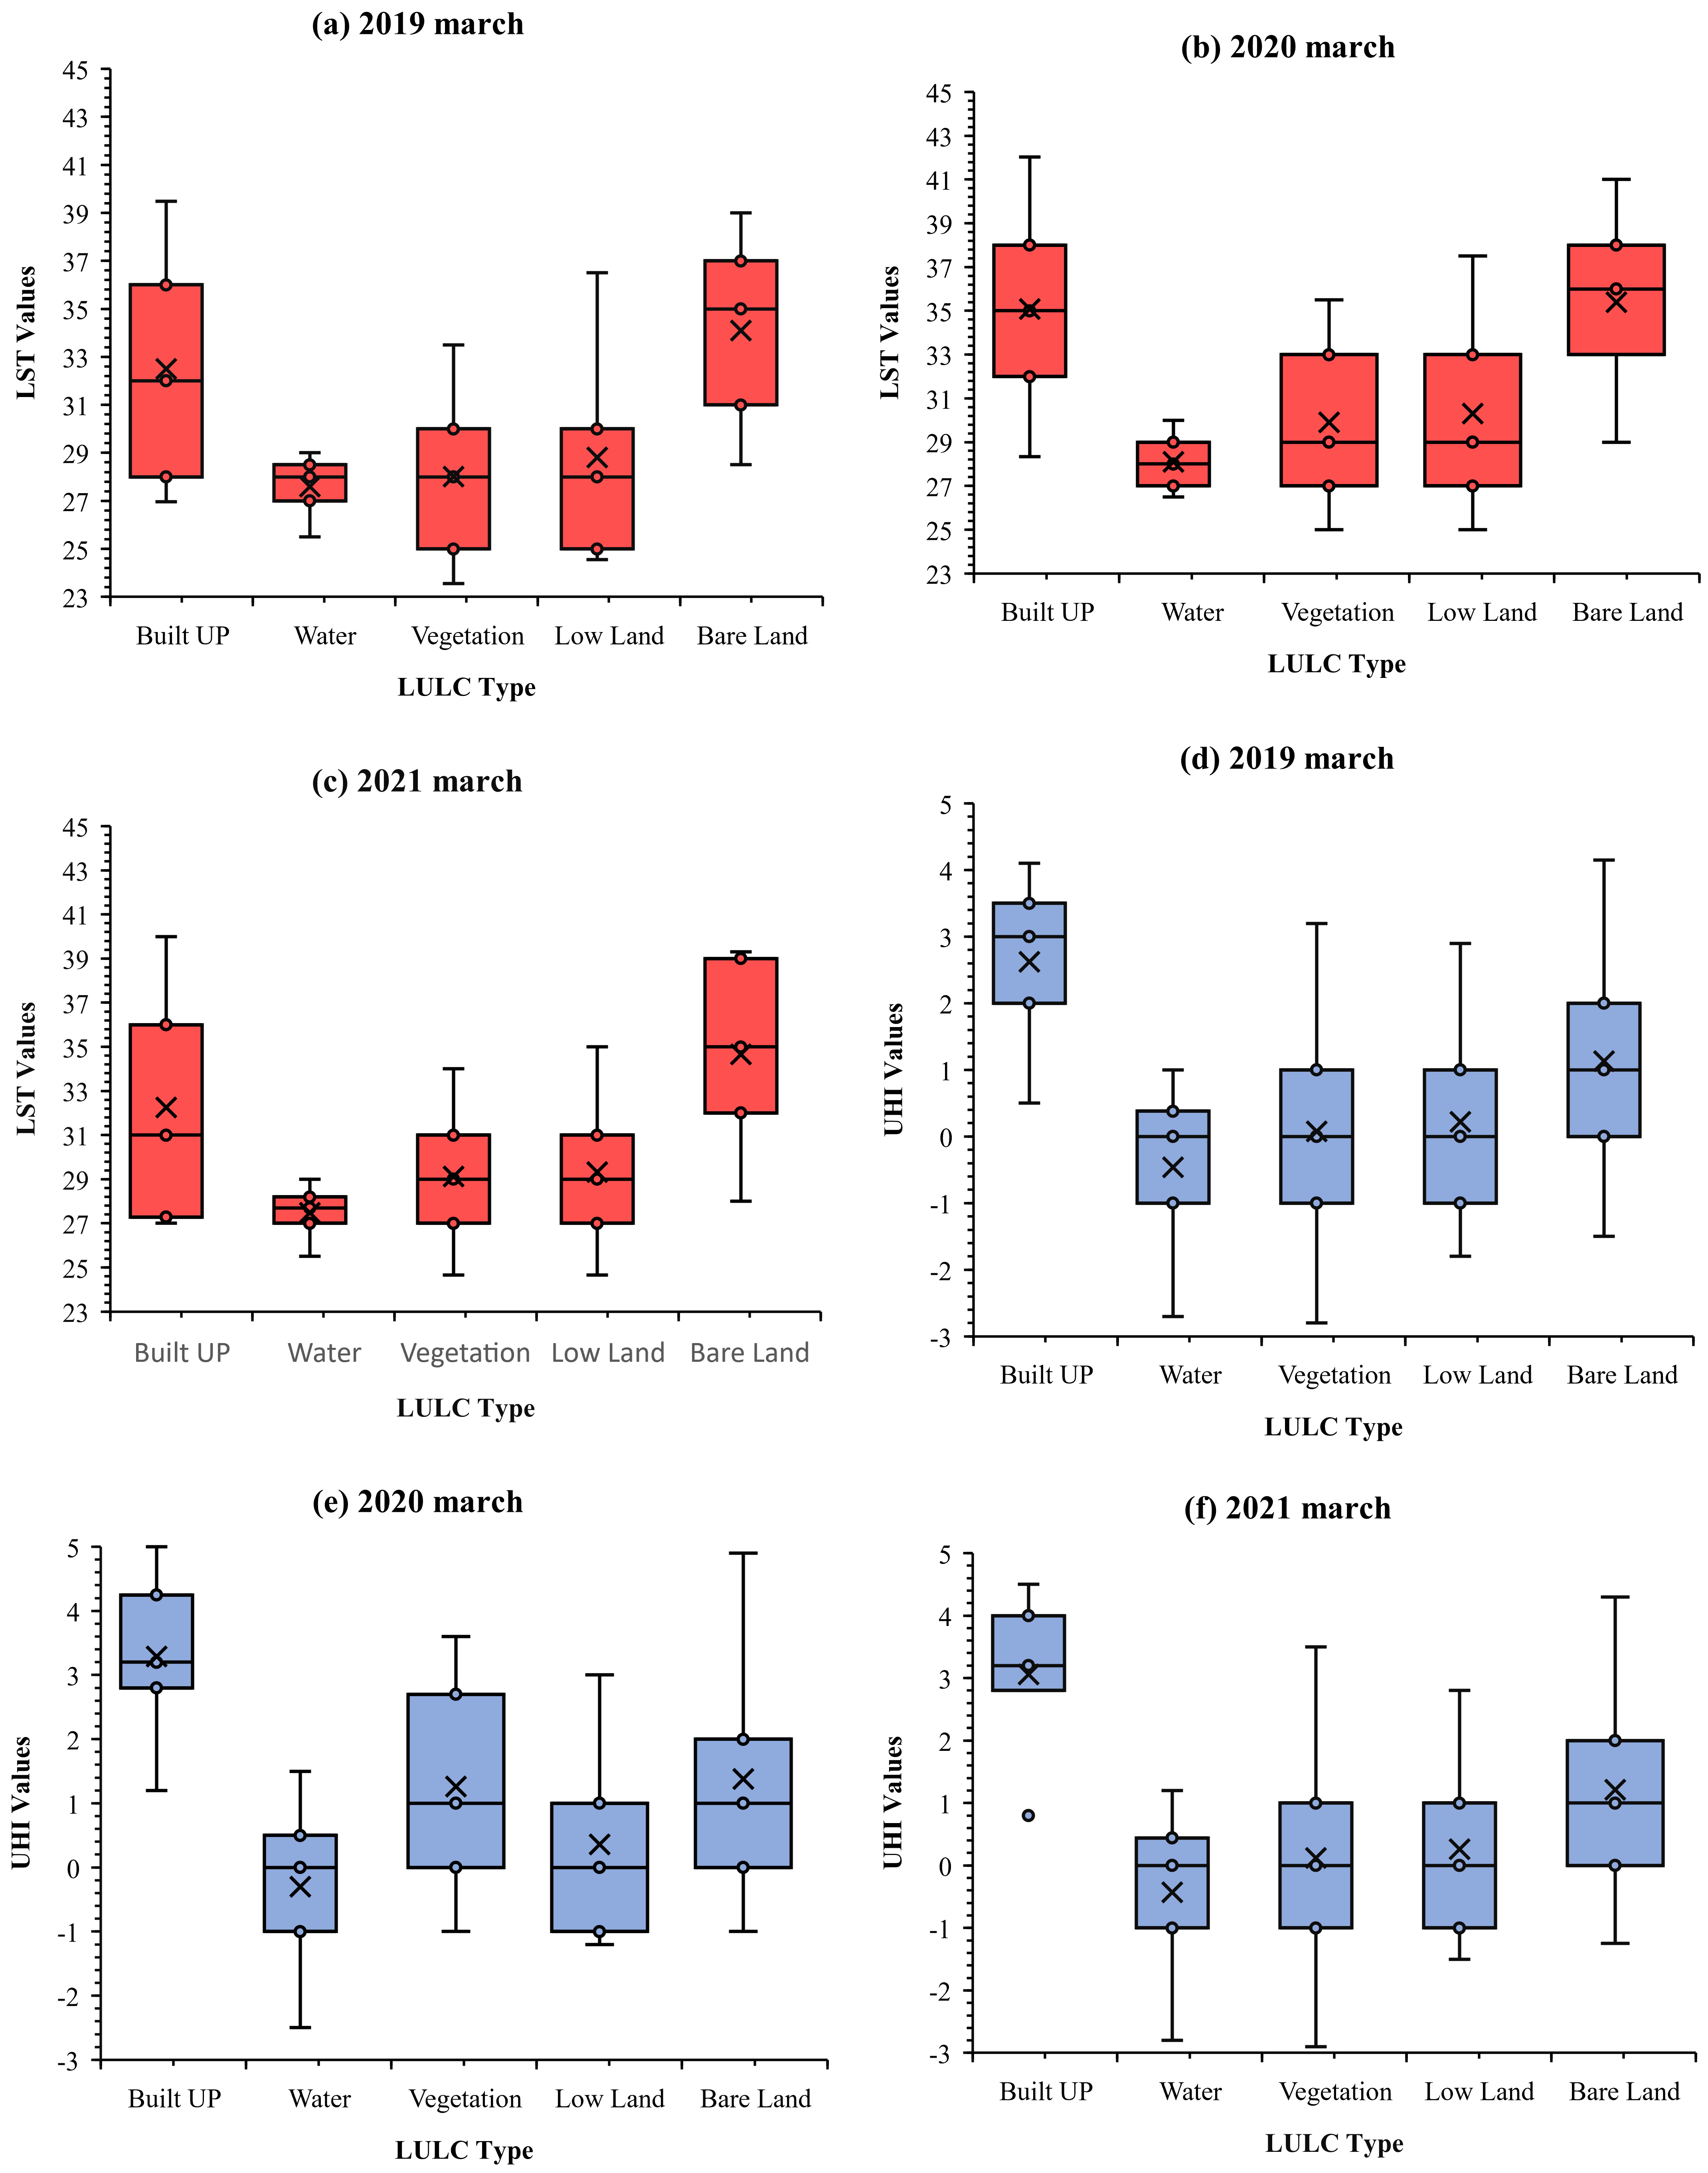
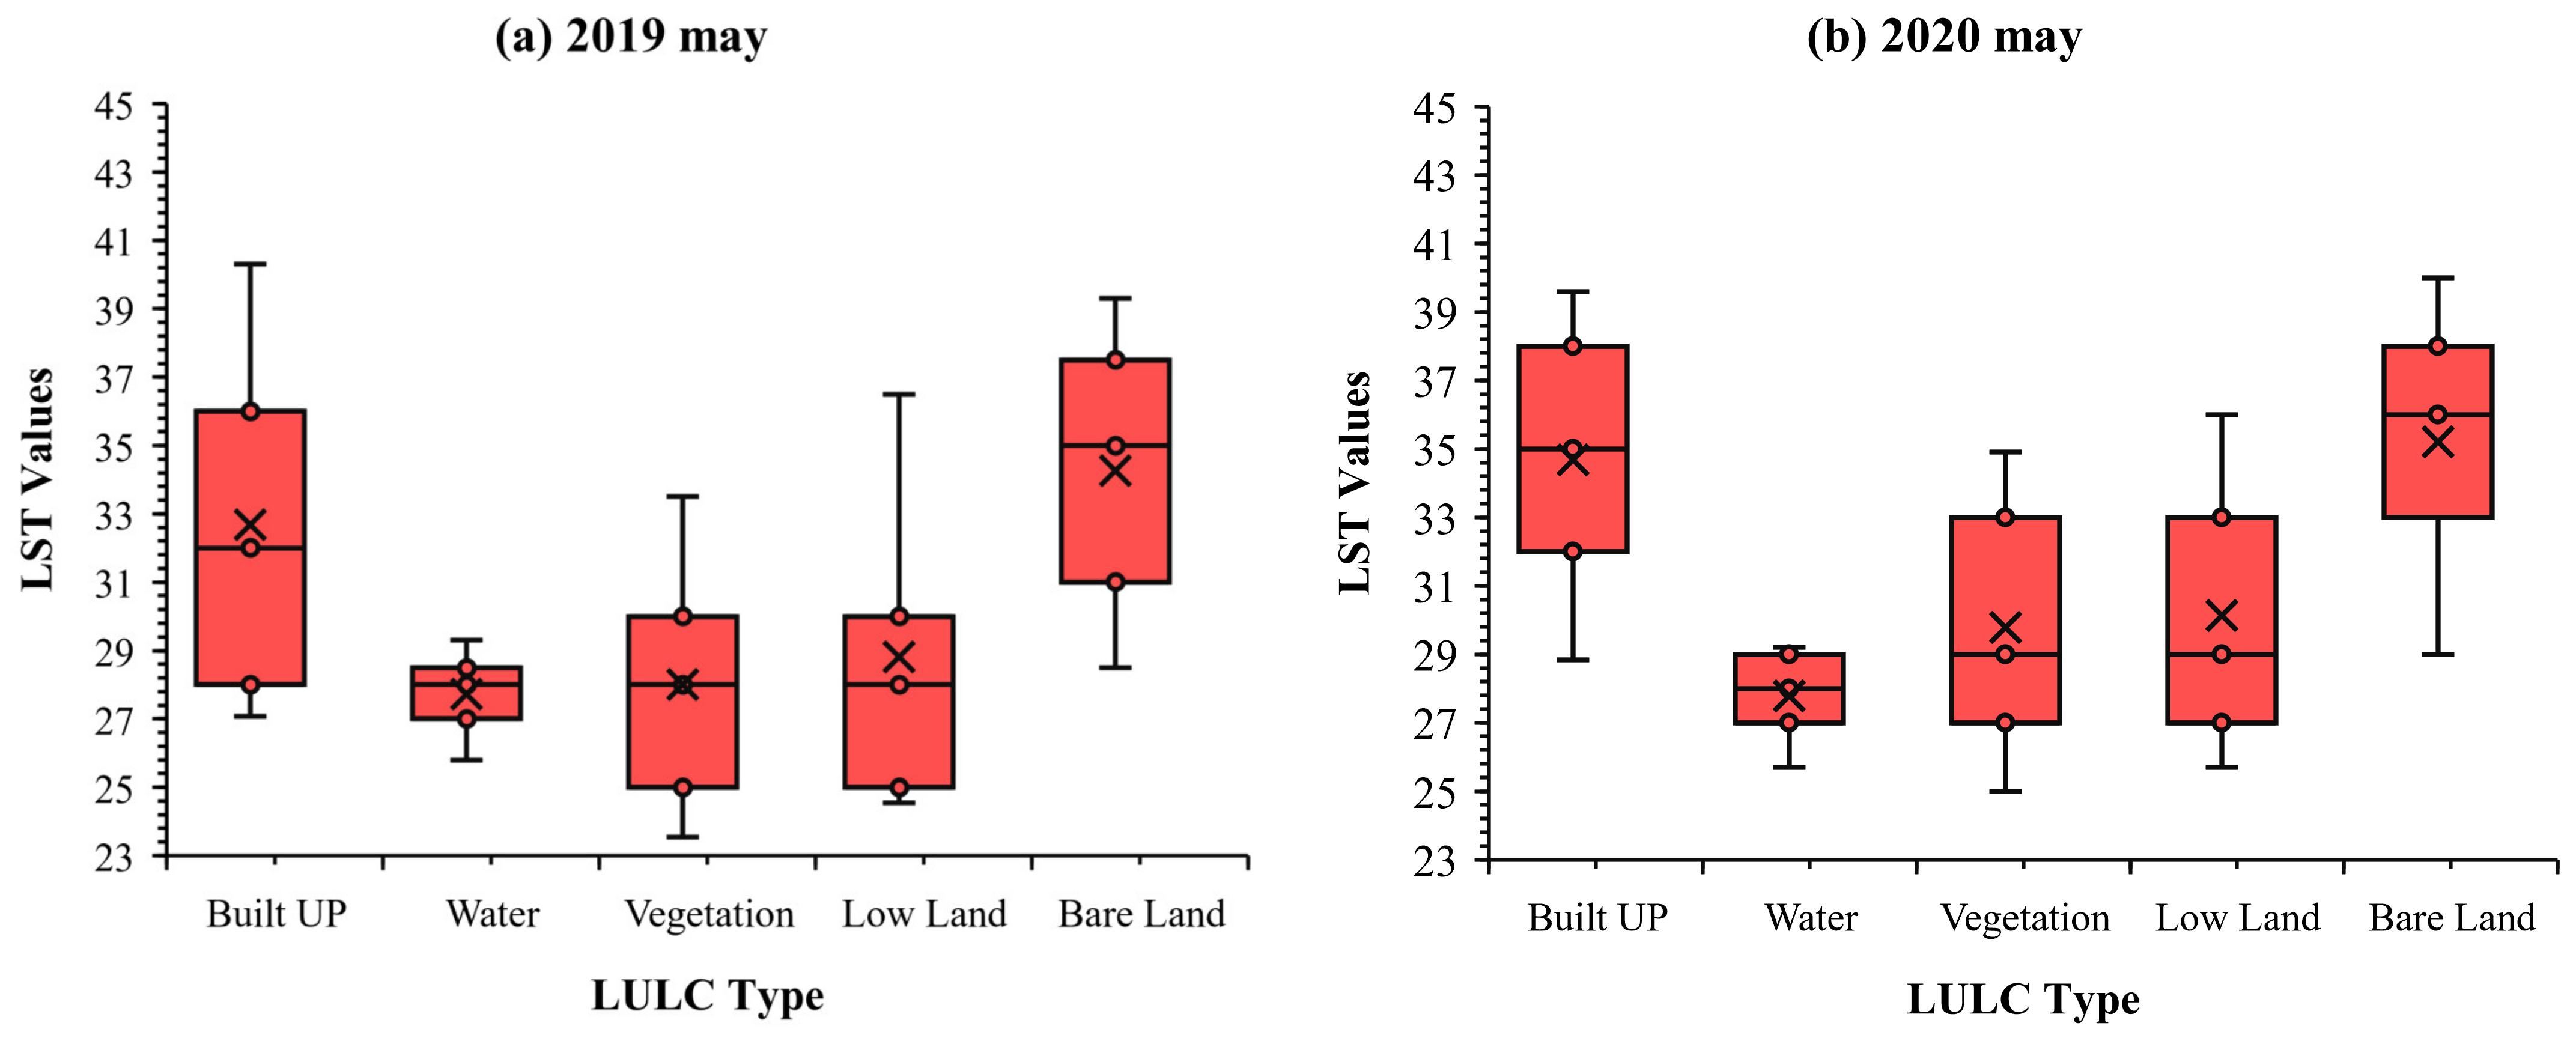
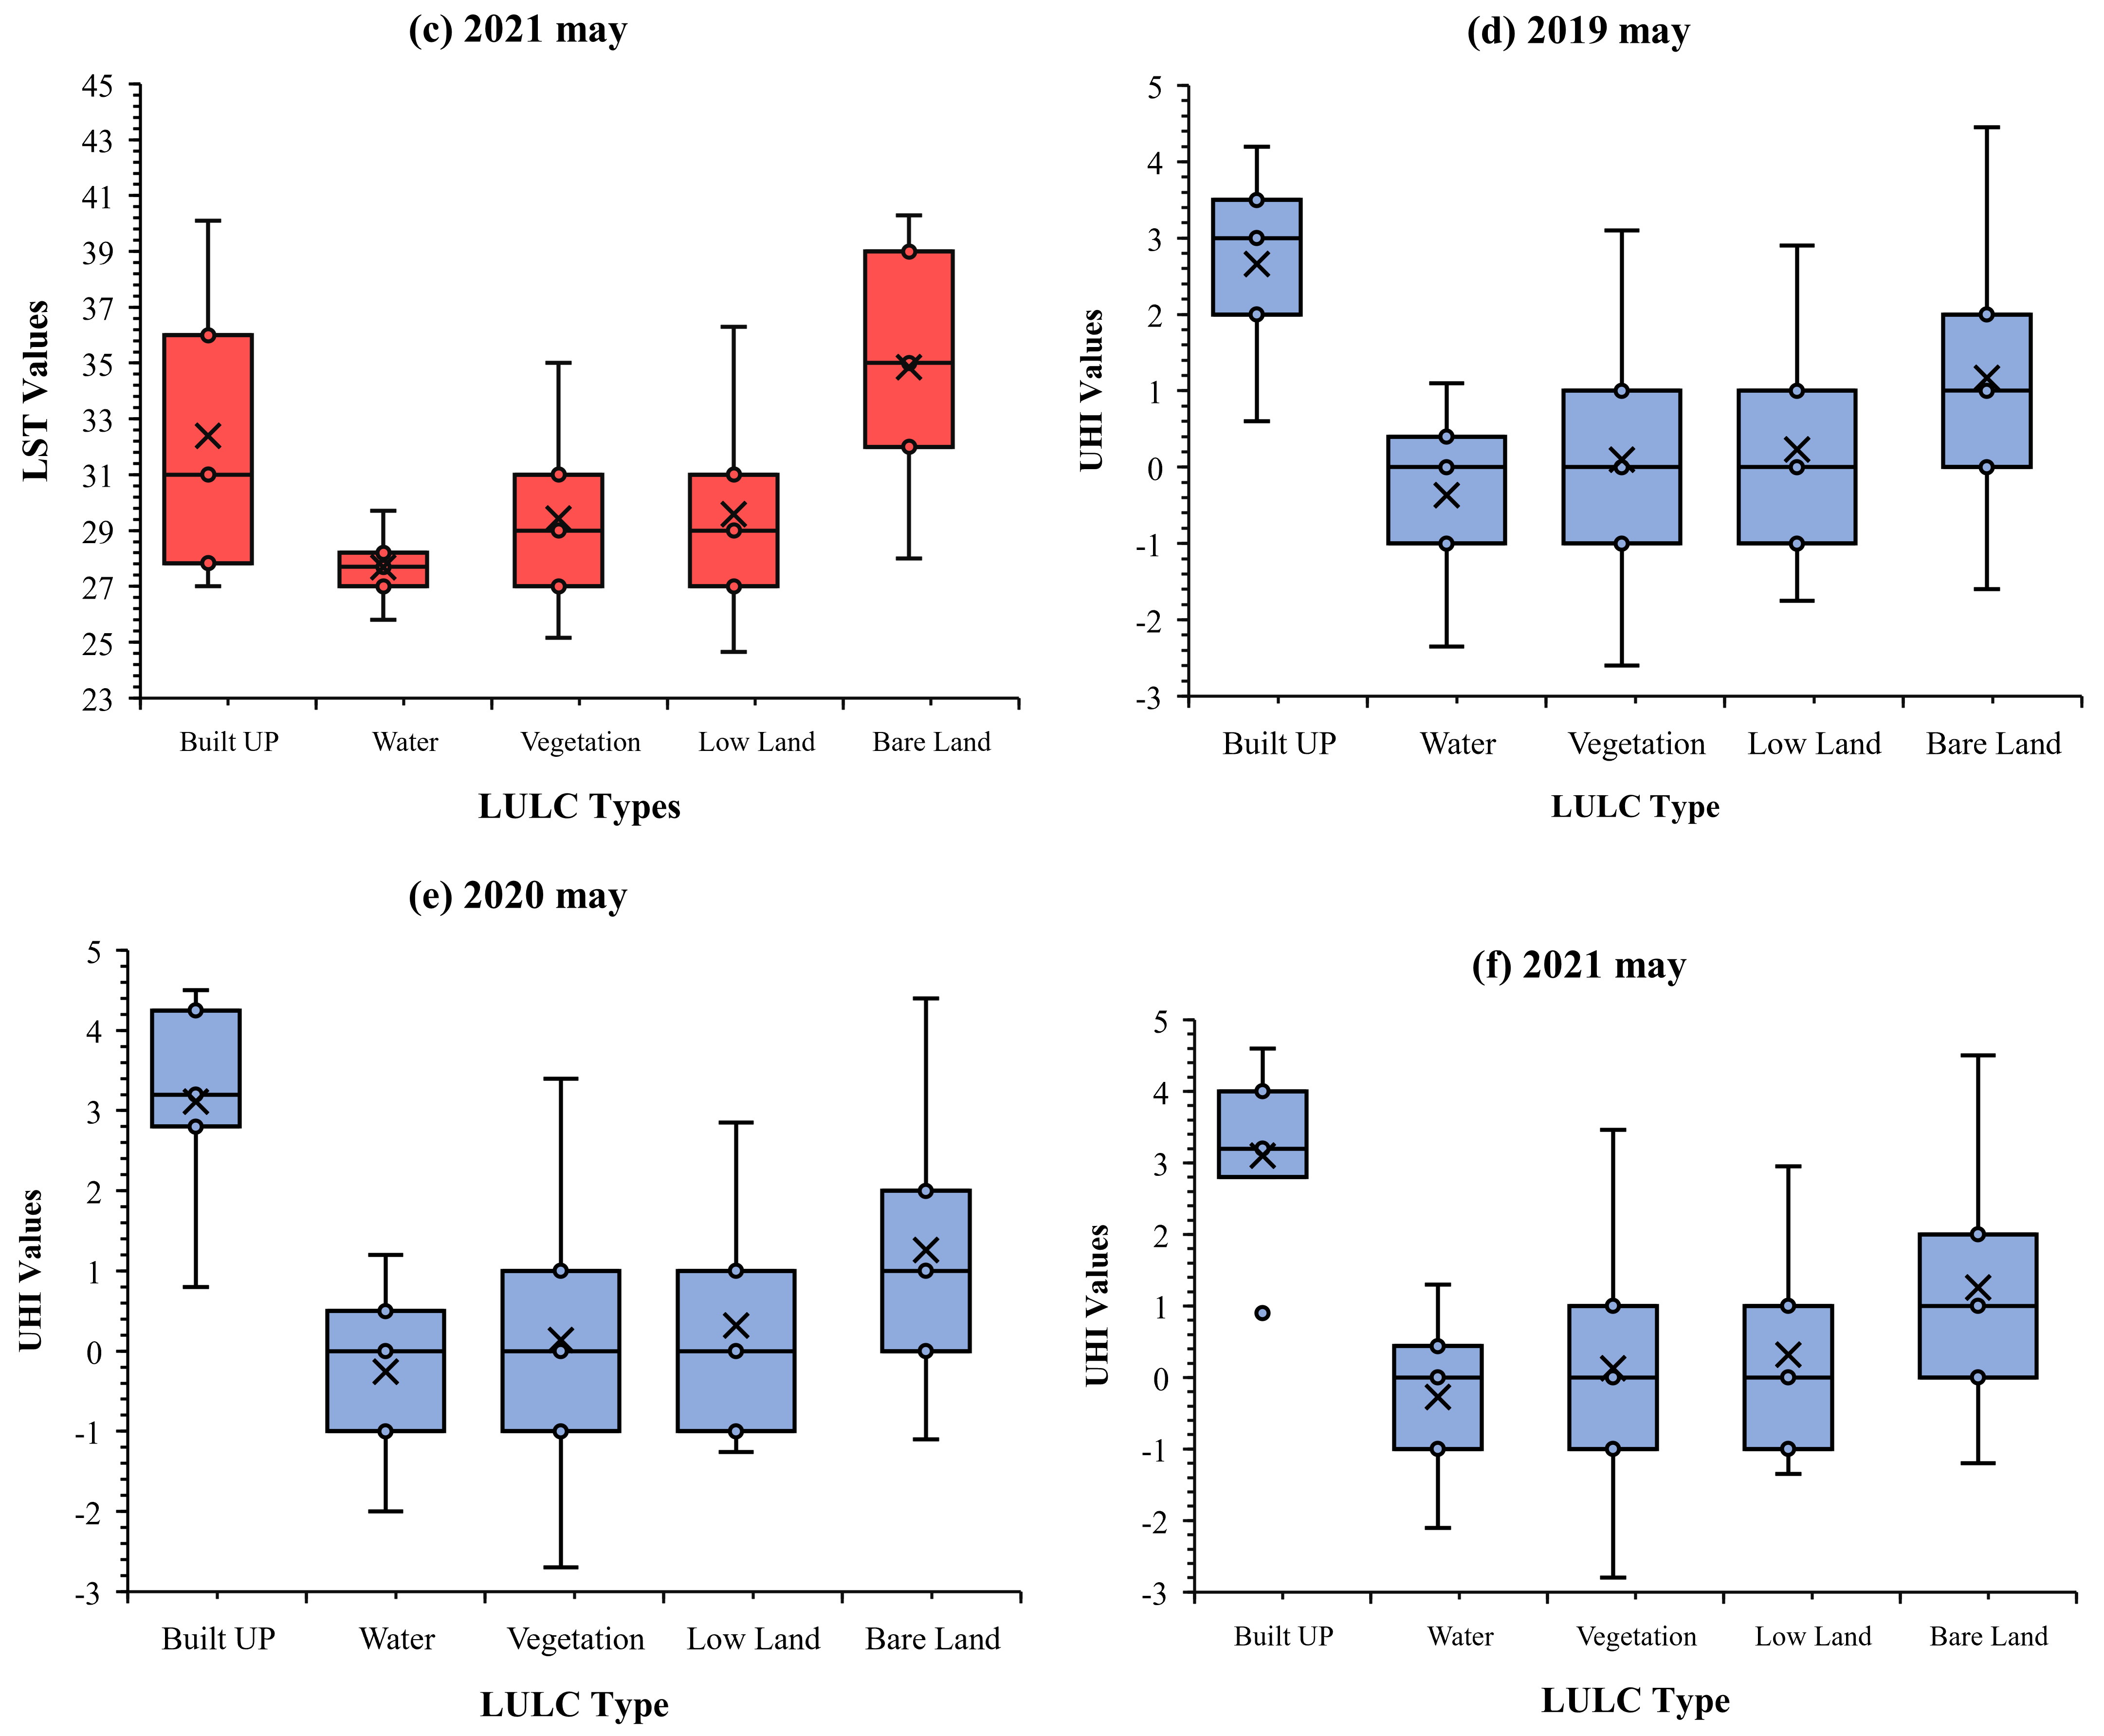
3.4. Land Surface Temperature (LST)

After the COVID-19 lockdown, areas with the highest LST decreased noticeably over the study area. The 2019 (March), 2020 (March), and 2021 (March) calculated maximum LST were 39.48 degrees Celsius, 42 degrees Celsius, and 40.5 degrees Celsius, respectively. The 2019 (May), 2020 (May), and 2021 (May) maximum LST were calculated as 40.25 degrees Celsius, 39.50 degrees Celsius, and 40.4 degrees Celsius, respectively. On 23 March 2020, during the COVID-19 epidemic, a national lockdown was implemented. At the beginning of lockdown, the calculated LST for March 2020 was higher than March 2019 and March 2021. However, after one and a half months of lockdown, the LST reduced (in May 2020).
Educational institutions remained closed after a year of COVID-19 circulation, but office, economic, and industrial activity continued. In March 2019 to 2021, the lowest (good) LST values (23 to 26 degrees Celsius) covered 22.5 percent, 4.85 percent, and 6.52 percent, respectively. In May of 2019, 2020, and 2021, the lowest LST values covered 23.15 percent, 5.95 percent, and 6.66 percent of the area, respectively. In March of 2019, 2020, and 2021, the amount of highest LST (35 to 42 degrees Celsius) was 11.7 percent, 26.6 percent, and 20.09 percent, respectively. In May 2019, 2020, and 2021, the highest LST values were 21.3 percent, 25.6 percent, and 26.4 percent, respectively. After May 2020, the moderately higher and highest LST values ranging from (30-degree c. to 35-degree c. and 35-degree c. to 42-degree c.) covered smaller land cover areas (decreased from 36.5 percent to 25.5 percent and from 26.6 percent to 25.6 percent) (Figure 7 and Figure 8 and Table 5).

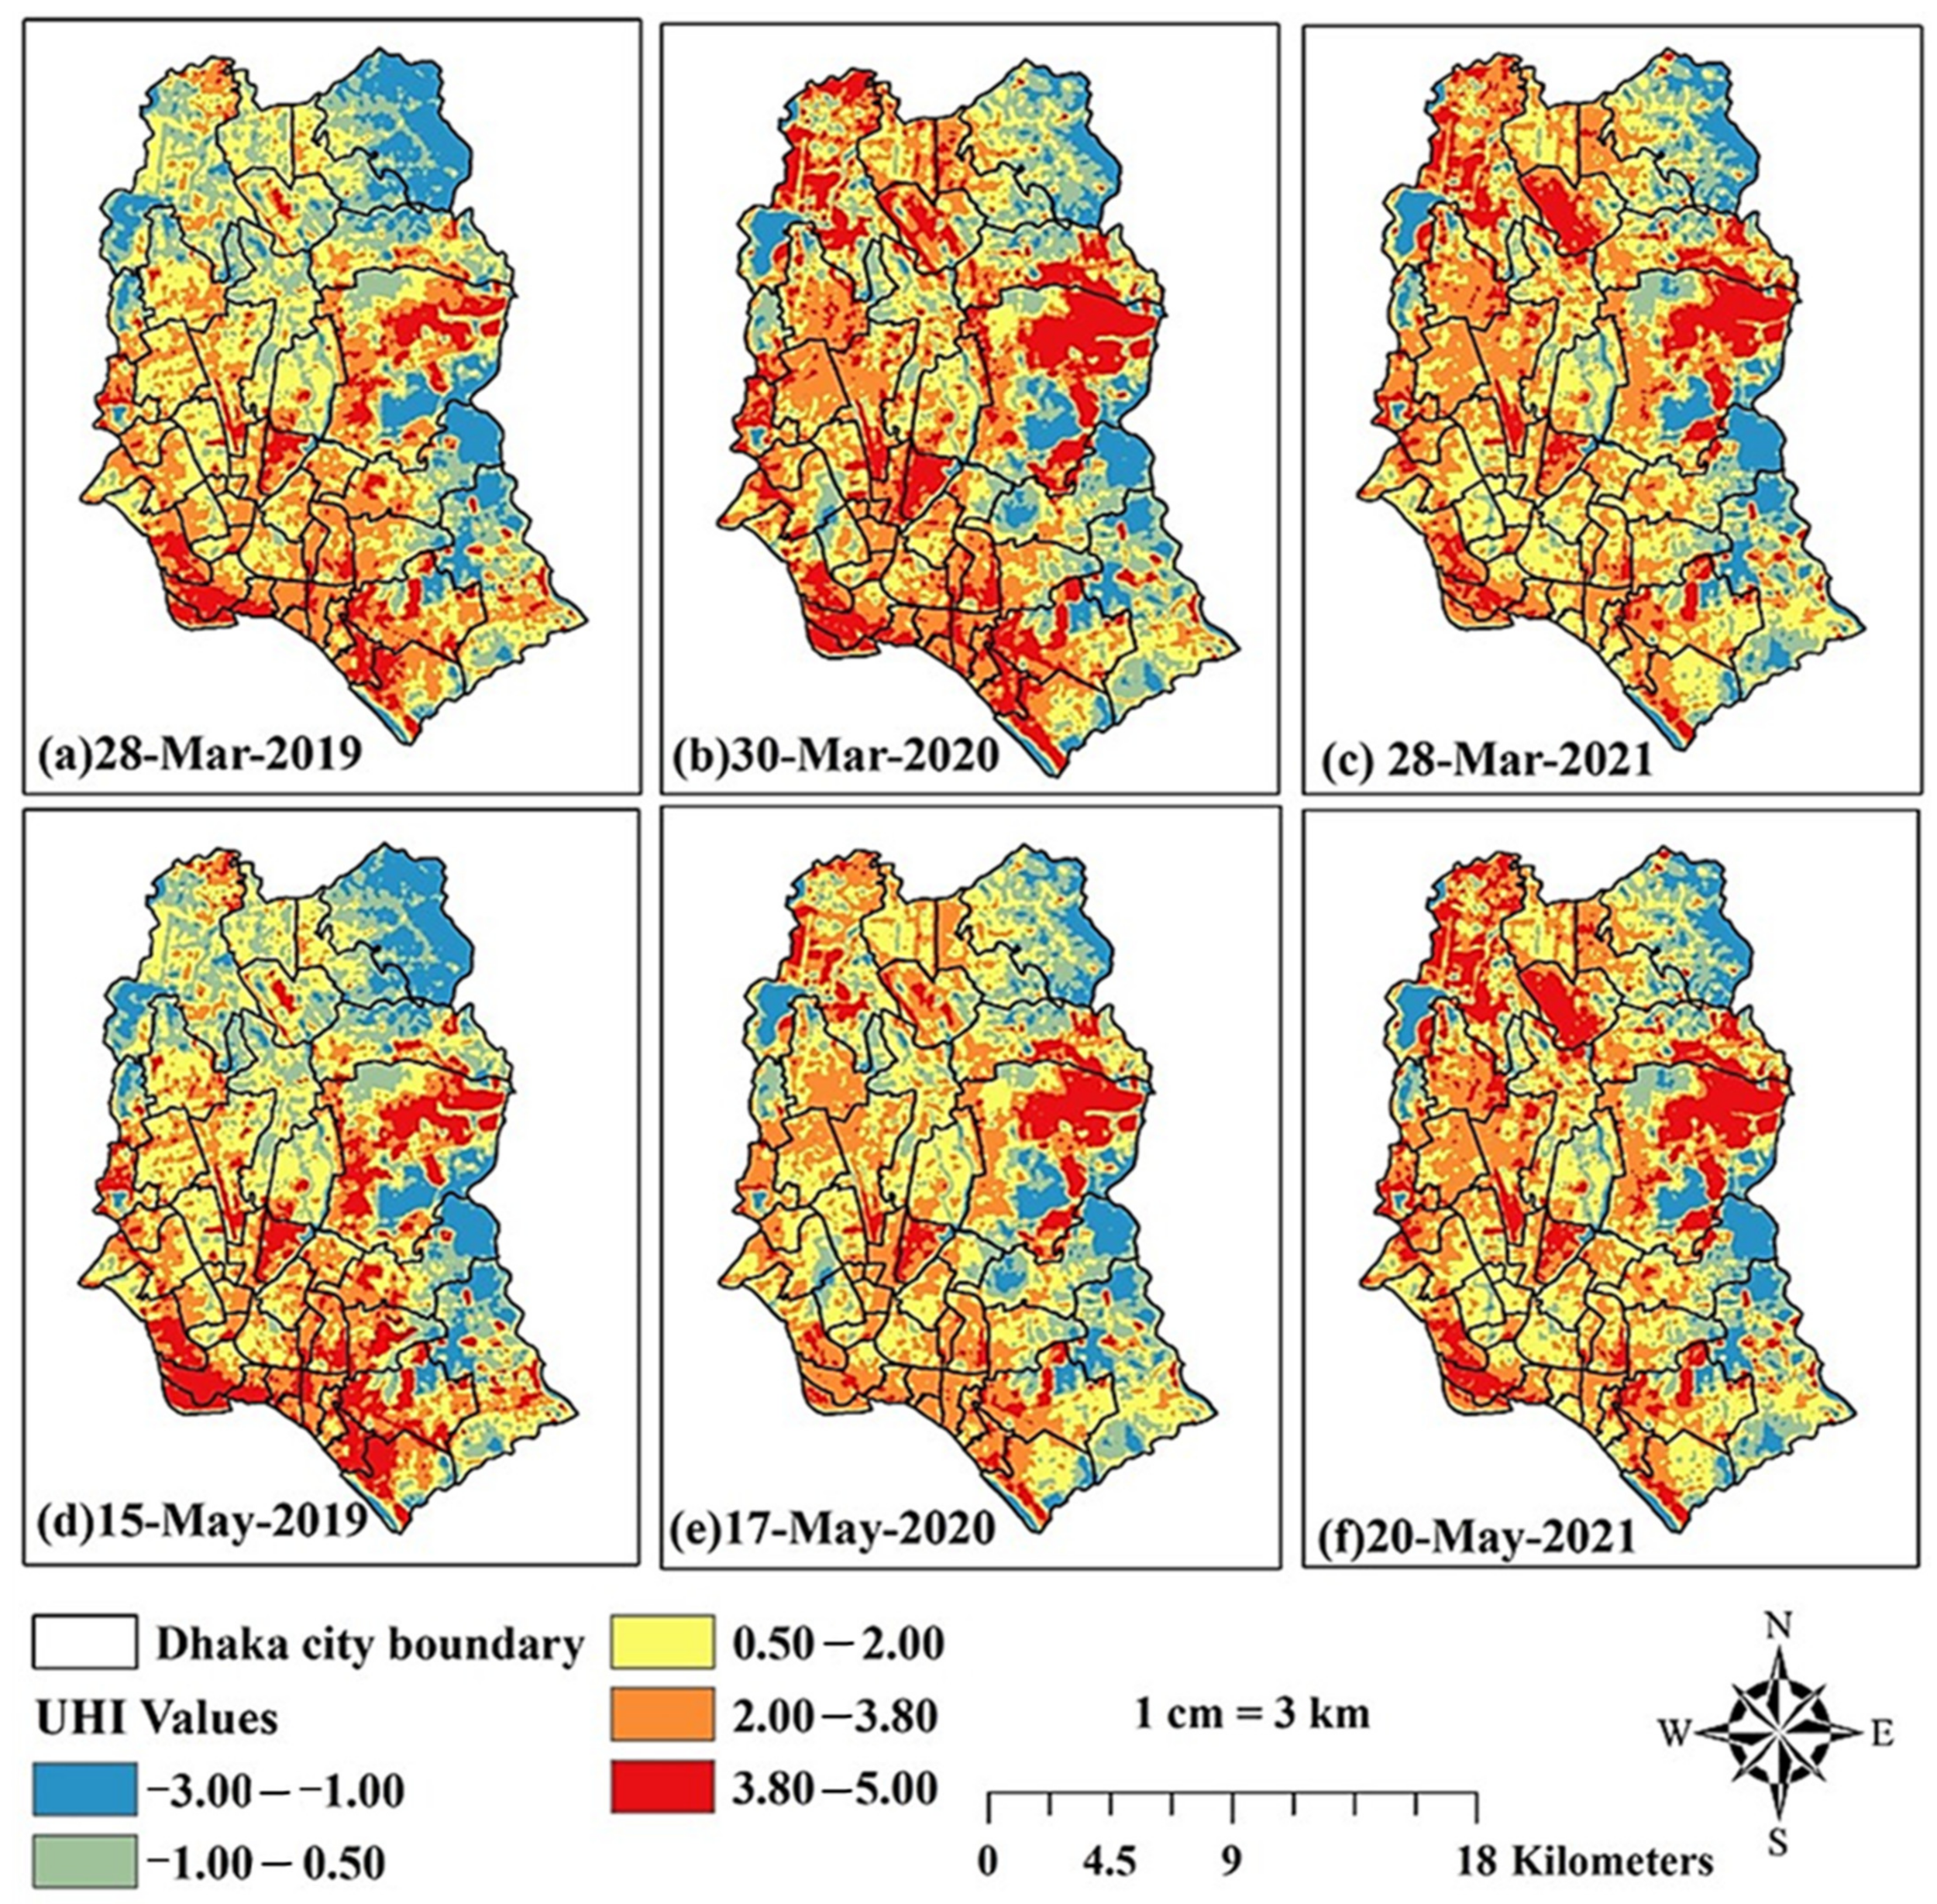
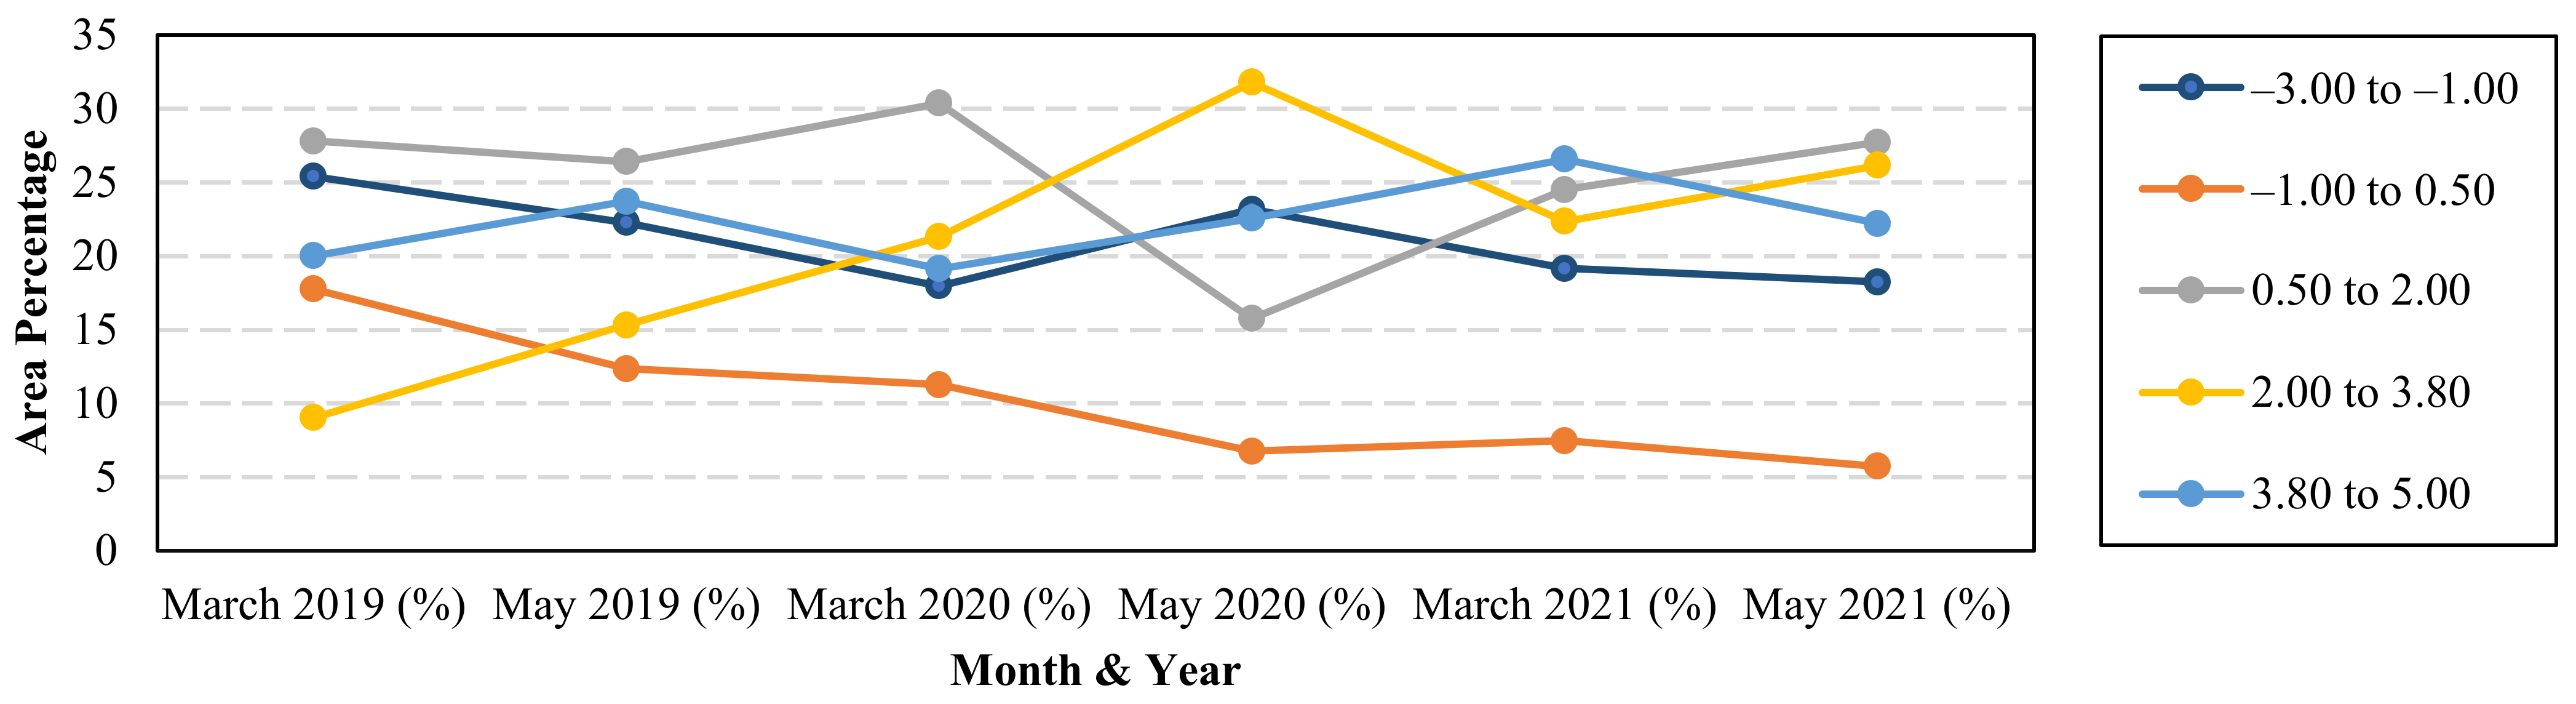
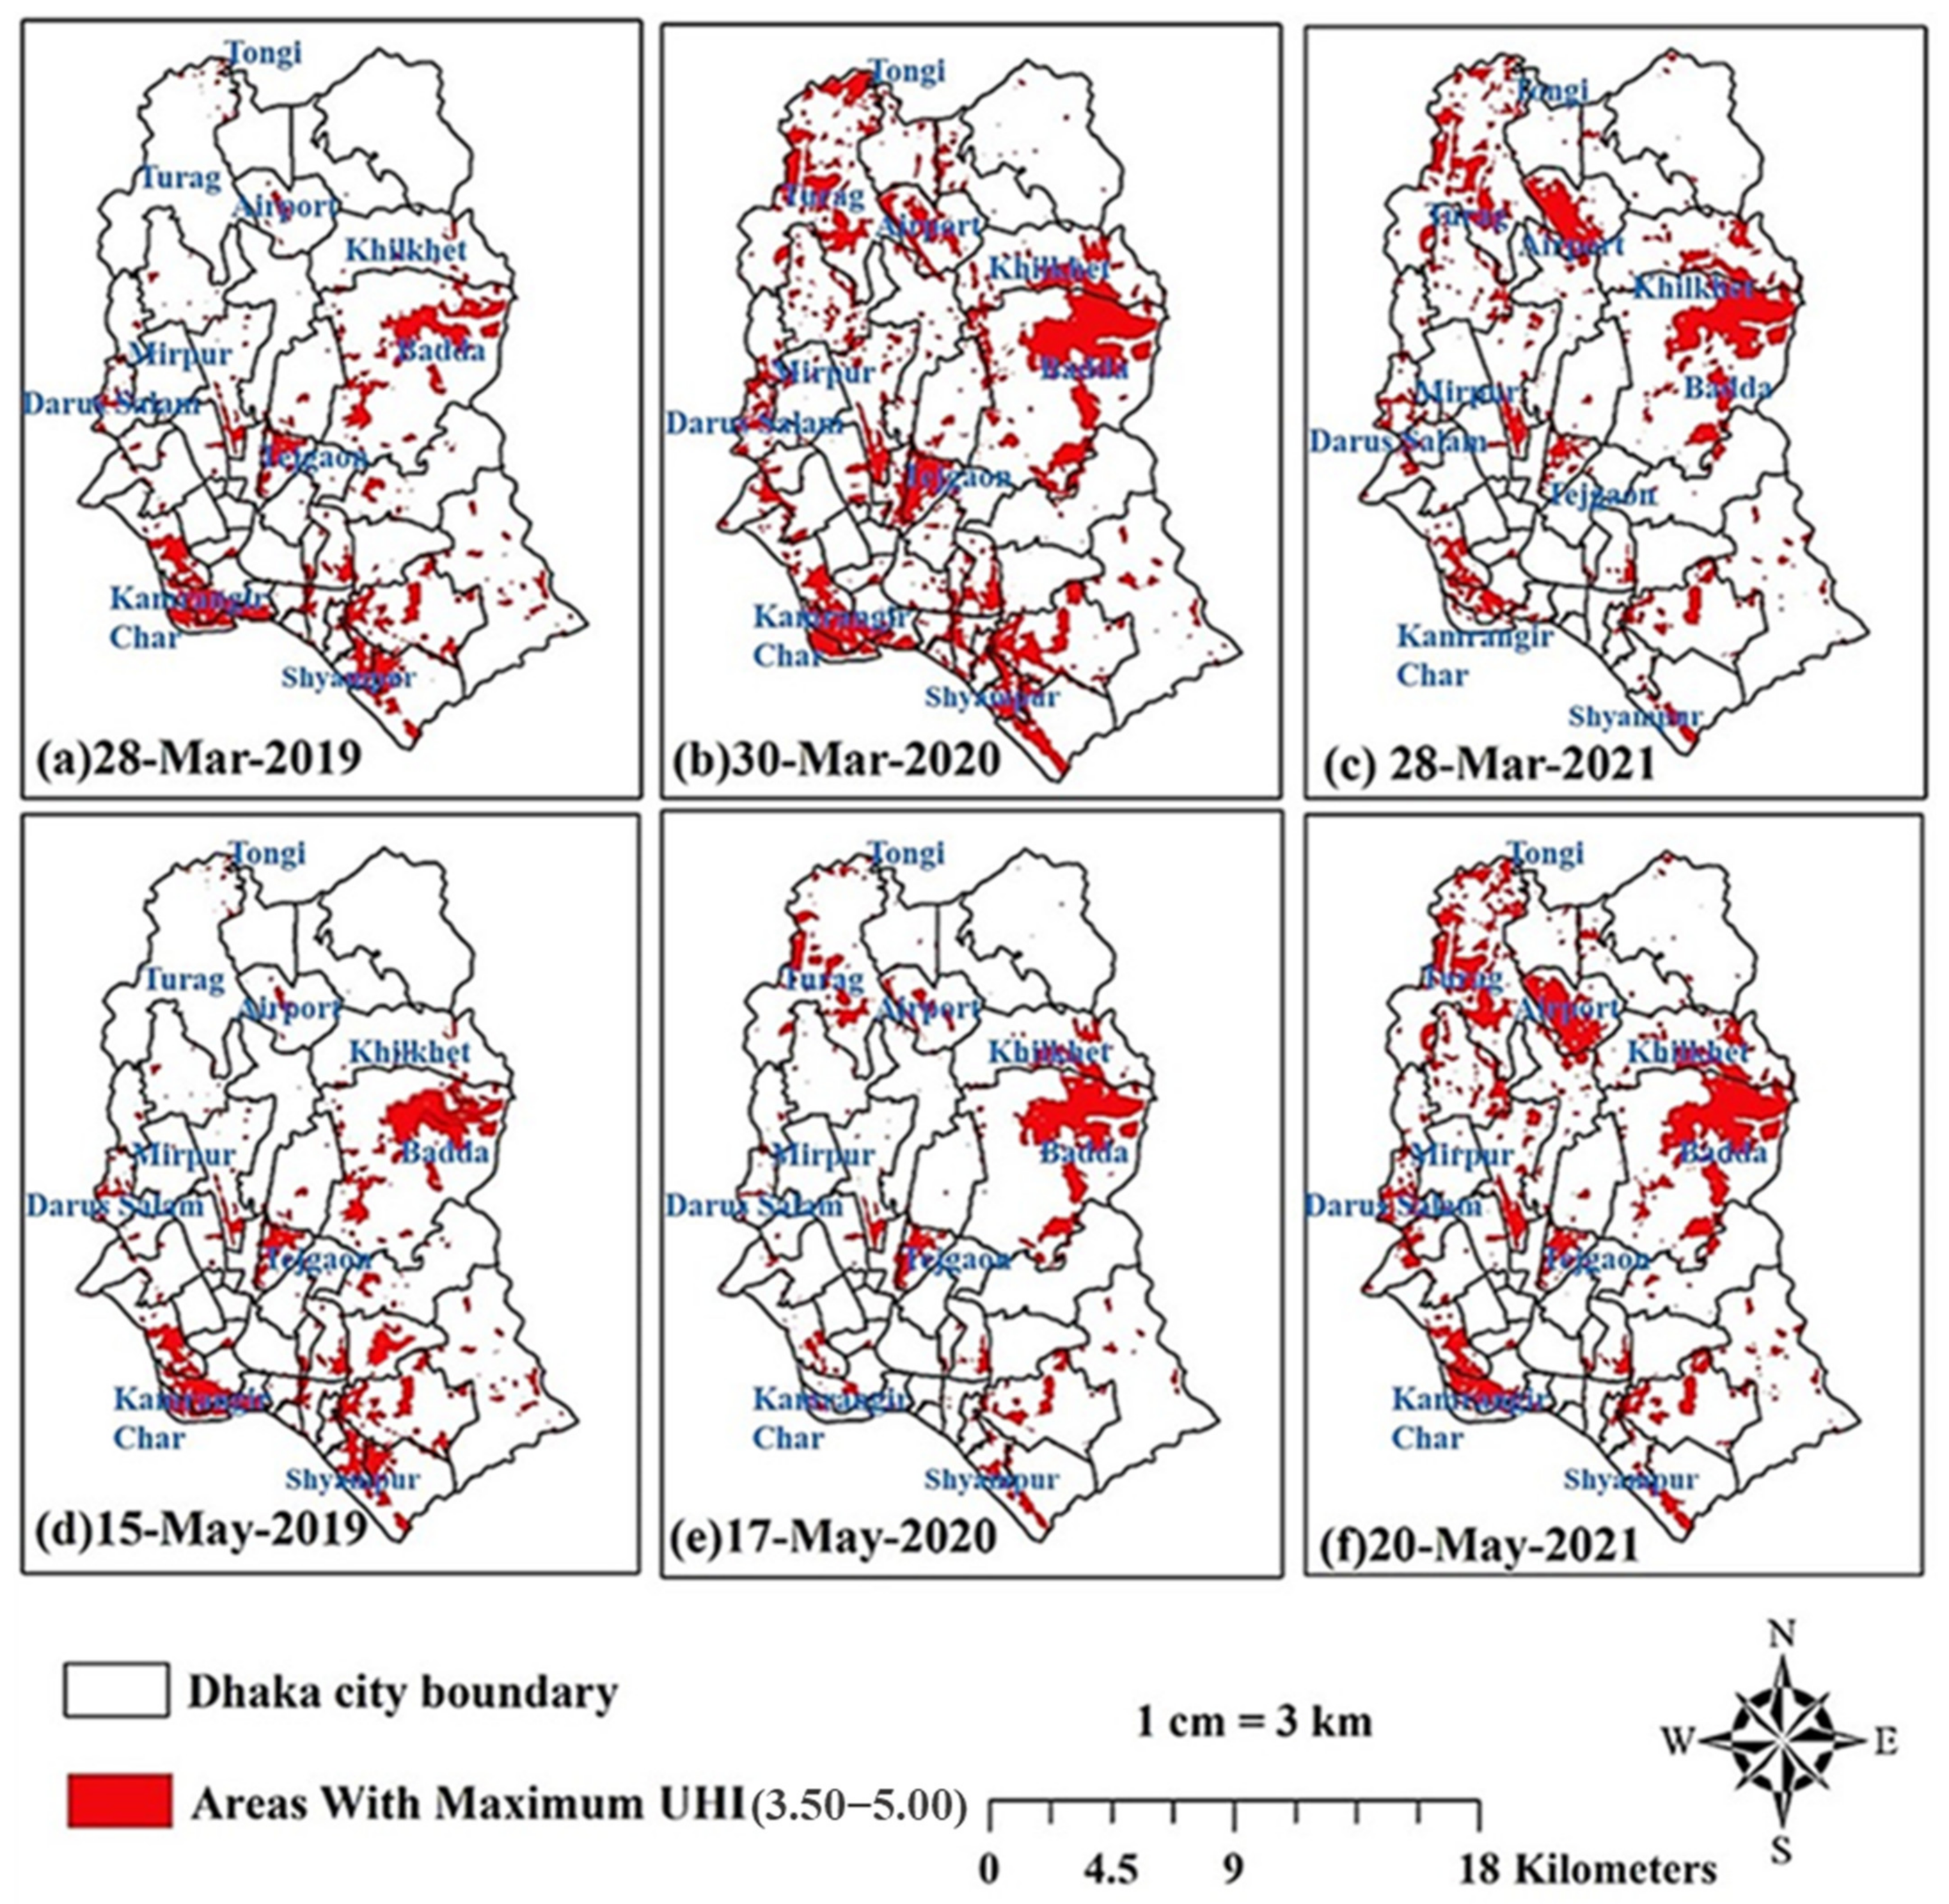
3.5. Surface Urban Heat Island (SUHI)

At the beginning of lockdown in March 2020, the calculated UHI zones were at their peak. However, after one and a half months of lockdown, the UHI zones diminished (in May 2020). In March 2019 to 2021, the area with the lowest UHI value (−3.00 to −1.00) comprised 22.25 percent, 23.15 percent, and 18.22 percent of the total land area, respectively. In May of 2019, 2020, and 2021, the lowest UHI values covered 25.4, 17.96, and 19.15 percent of the area, respectively. This indicates that following the lockdown, locations with the lowest UHI values (−3.00 to −1.00) rise by more than 5 percent.
In March of 2019, 2020 and 2021, the highest UHI (3.80 to 5) accounted for 23.7 percent, 22.55 percent, and 22.19 percent, respectively. In May of 2019, 2020, and 2021, the greatest UHI readings were 20 percent, 19.13 percent, and 26.55 percent, respectively. After May 2020, somewhat higher and highest UHI values ranging from (2.00 to 3.80 and 3.80 to 5.00) covered a smaller proportion of land cover (from 31.8 percent to 21.3% and 22.5% to 19.13%). This indicates that following the lockdown, about 10 square kilometers had decreased UHI values (Figure 9 and Figure 10 and Table 6).

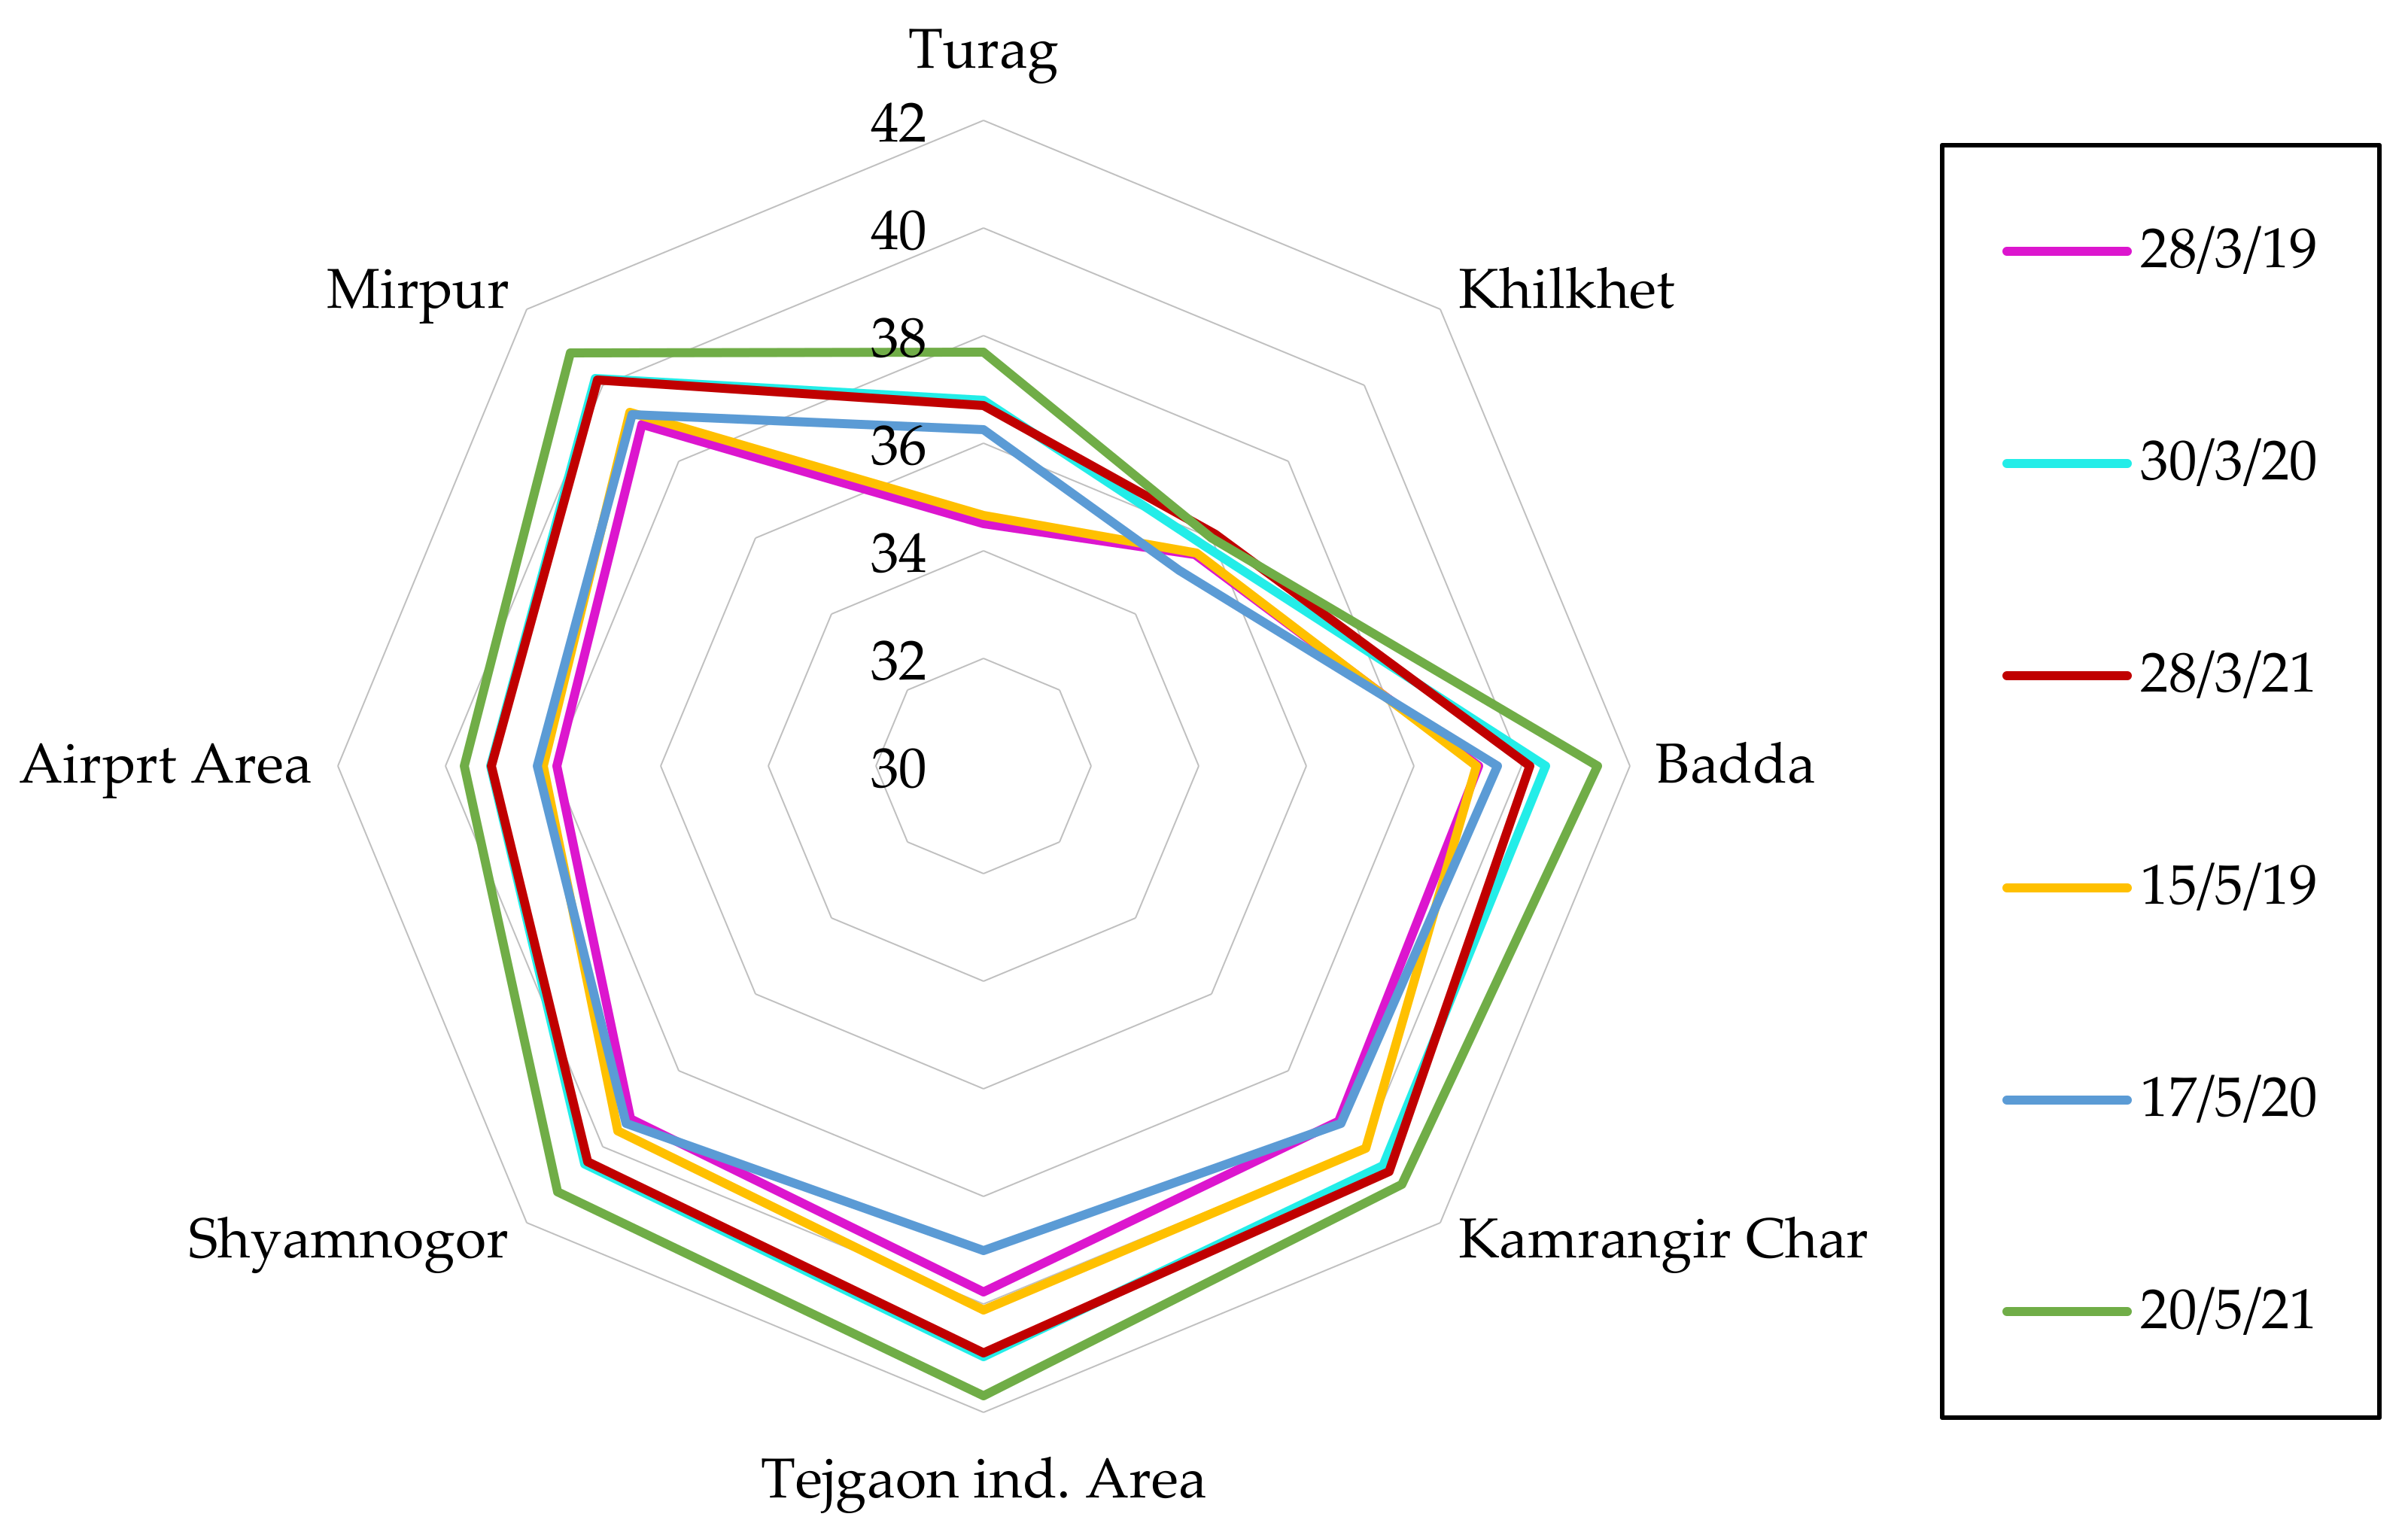
3.6. Evaluation of LST and UHI Profile over the Study Area

Figure 11, Figure 12 and Figure 13 and Table 7 illustrate the LST profile of the research region for the months of March and May 2019 to 2021. Figure 12 and Table 7 illustrate the variance of the LST in different regions with the greatest heat island intensity. The data indicate that the LST decreased dramatically in a few cases following the lockdown period. Particularly, the LST in the industrial region of Tejgaon fell by around 2 degrees Celsius. After the end of the lockdown, however, industrial and commercial activities resumed, once again accelerating the intensity of the heat island.
The minimum LST value for built-up area in March 2019 is 26.96, the mean value is 32.48, and the maximum LST value is 39.5, as shown in Figure 14a. This was prior to the pandemic status of COVID-19. In March of 2020, the minimum LST value for built-up area is 28.33, the mean value is 35.07, and the maximum value is 42.02 (Figure 14b). This indicates that the LST value has risen over time. Again, a considerable change is noticed in the lowest, mean, and maximum values in March 2021. The minimum value decreased to 27.28, the mean value decreased to 32.25, and the maximum value decreased to 40 (Figure 14c). This shift is a result of the COVID-19 lockdown in the city, which resulted in the closure of polluting and heat-generating companies. In addition, reductions in human activity and transportation contributed to this change. Similarly, the values of waterbodies, vegetation low land, and bare land climbed initially (in March 2020) before beginning to decrease in March 2021.
In comparison to these statistics, the minimum LST value of built-up area from March 2020 to May 2020 exhibits a decreasing tendency. Due to the COVID-19 lockdown, the mean value decreased from 35.07 to 34.68 (Figure 15b). This negative trend persisted until March of 2021. Beginning in March 2021, the LST value began to rise (Figure 15c). This effect was caused by the removal of strict lockdown regulations and the increase in human activities and industrial work. Similar changes are observed in waterbodies, vegetation, low land, and bare land, which exhibit an increase in the LST values before and after the pandemic and a significant decrease during the pandemic.
The minimum UHI value for built-up area in March 2019 is 0.5, the mean value is 2.62, and the maximum UHI value is 4.1, as shown in Figure 14d. This was prior to the pandemic status of COVID-19. The minimum UHI value for built-up area raised to 1.2 in March 2020, while the maximum value is assessed to be 5 (Figure 14e). This scenario occurs at the onset of the COVID-19 pandemic; therefore, lockdown had not yet been implemented. In March 2021, however, the minimum value decreased to 0.8, the mean value decreased to 3.06, and the maximum value decreased from 4.5 to 0.8 (Figure 14f). This shift was a result of the COVID-19 lockdown in the city, which resulted in the closure of polluting and heat-generating companies. In addition, reductions in human activity and transportation contributed to this change. Similarly, the value of waterbodies, vegetation low land, and bare land climbed initially (in March 2020) before beginning to decrease in March 2021.
Again, the built-up area’s mean UHI value from March 2020 (Figure 14e) to May 2020 (Figure 15e) was shown to decrease from 3.29 to 3.11, and this pattern persisted until 2021 (Figure 14f). It is noticed that the minimum value for May 2021 is 0.9, the mean value is 3.1, and the maximum value is 4.6 (Figure 15f). It explains a significant gain in value between March and May of 2021. This effect is generated by the removal of severe lockdown regulations and the expansion of human activity and industrial operations. Similar changes are evident in waterbodies, vegetation, lowlands, and bare lands, which exhibit an increase in UHI value prior to the pandemic and a considerable decrease in UHI value after the pandemic.

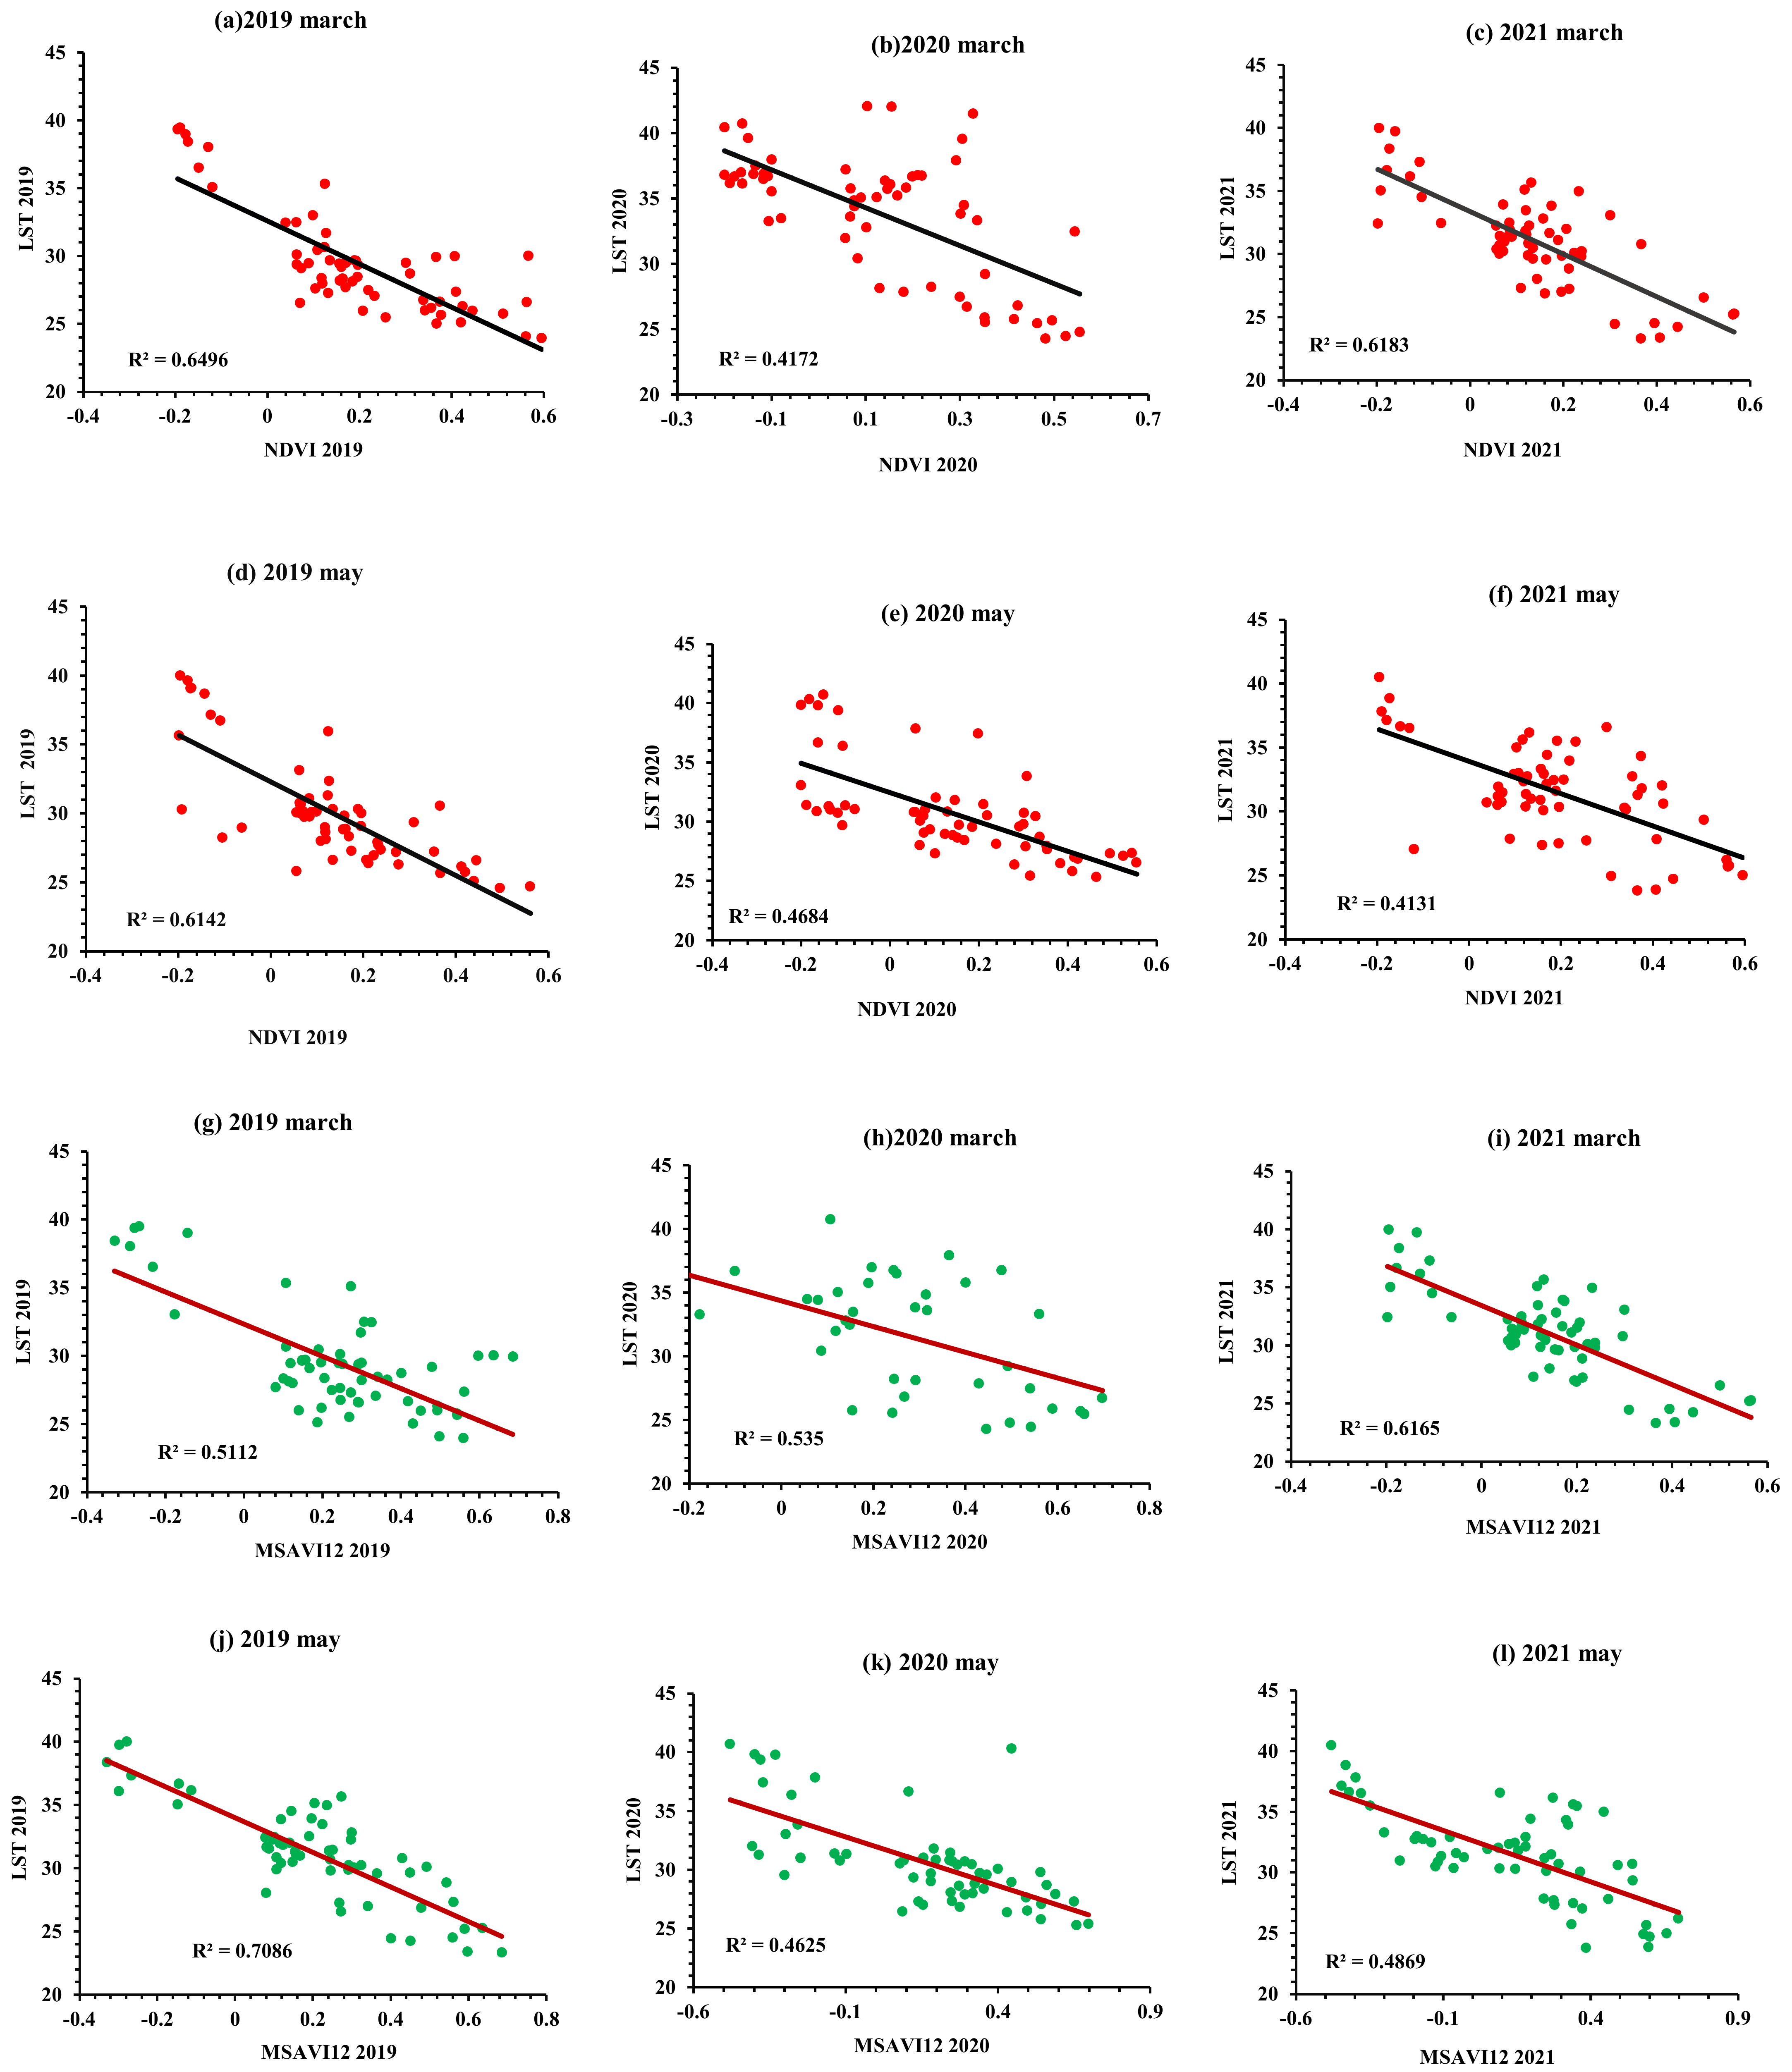
3.7. Correlation of LST with Respect to NDVI and MSAVI12

The March and May correlation results indicate a significant negative relationship between the LST and the NDVI (2019 to 2021). Figure 16 displays the correlation coefficients (a) 0.64; (b) 0.41; (c) 0.61; (d) 0.61; (e) 0.46; and (f) 0.41, respectively. In contrast, Figure 16 displays a negative correlation between the MSAVI12 and the LST. The respective correlation coefficients are (g) 0.51; (h) 0.53; (i) 0.61; (j) 0.70; (k) 0.46; and (l) 0.48. (Figure 16).

4. Discussion

Governments across the globe have taken measures to prevent the spread of COVID-19, resulting in a major decrease in the usage of motorized vehicles. It is anticipated that the consequent reduction in traffic-related heat and pollution will have a range of environmental effects, particularly in urban areas with a higher concentration of traffic. Historically, research on the thermal environment has focused mostly on the average land surface temperature or the mean magnitude of the UHI. According to Bikash Ranjan Parida, implementing a lockdown policy decreased the land surface temperature by 1 to 2 degrees Celsius across Europe and North America. During the lockdown period, the average daily SUHI intensity throughout the Middle East decreased, particularly in small urban locations (such as Jeddah, Beirut, Muscat, and Makkah) [3]. In Gauteng Province, South Africa, the LST and surface urban heat island intensity were much lower than the previous year [72].
This study focused on detecting the change in plant pattern and heat island effect zones in Dhaka, Bangladesh, before and after the COVID-19 lockdown, in relation to different forms of land use land cover. Before and after lockdown, Landsat-8 images were gathered to determine the vegetation pattern and pinpoint the heat island zones. In this study, the normalized difference vegetation index (NDVI) and the modified soil-adjusted vegetation index (MSAVI12) were derived for analyzing vegetation pattern. According to the NDVI and MSAVI12 data, after one month of lockdown, the health of the vegetation improved. In the context of the MSAVI12, the highest MSAVI12 coverage in March of 2019, 2020, and 2021 (0.45 to 0.70) is 22.15 percent, 21.8 percent, and 20.4 percent, respectively. In May 2019, 2020, and 2021, the dense MSAVI12 values accounted for 23.8 percent, 25.5 percent, and 18,4 percent, respectively. The MSAVI12 and NDVI results are comparable to those of Guha and Govil (2021). Similar to Guha and Govil (2021) and Kafy et al., the NDVI and the MSAVI12 demonstrated a substantial negative connection with the LST (2021). In March 2019 to 2021, the lowest UHI value (−3.00 to −1.00) covered 22.25 percent, 23.15 percent, and 18.22 percent of the total land area, respectively, according to the current study.
In May of 2019, 2020, and 2021, the lowest UHI values covered 25.4, 17.96, and 19.15 percent of the area, respectively. At the start of lockdown in March 2020, the calculated UHI zones were at their peak, as opposed to 2019 and 2021. However, the LST and UHI zones decreased after one month of closure (in May 2020). Transportation, industrial, and commercial activities slowed as a result of the COVID-19 lockdown, which reduced the LST, along with the intensity of heat island. The findings of this study are comparable to those of Liu et al., (2022) and Guha and Govil (2001).
The intensity of UHI varies depending on the time of day, the season, synoptic conditions, and the dynamics that are associated with local ecologies, such as the influence of plant foliage and evapotranspiration [17]. Similarly, the LST varies during the day and has a specific profile with respect to different land surfaces [73]. UHIs are caused by the dense accumulation of artificial materials and surfaces with low albedo, which alter the local microclimate and airflow. Concrete, asphalt, metals, and impermeable materials can modify air flow, evapotranspiration rate, and latent heat based on their particular absorption and the emission of solar radiation and heat energy [69,74].
It should be noted that the study quantified the variation of vegetation indices, LST and UHI before and after one year of COVID-19 lockdown. Moreover, it assessed the difference between 2 months just before (March 2020) and just after (May 2020) the lockdown. However, for a better understanding of the vegetation pattern change, LST change and UHI intensity, a longitudinal study would be more sophisticated. Further, short term lockdown (one or two weeks) should be considered while conducting this type of study, rather than only long-term lockdowns. However, this study fulfills the limitations and recommendations of some other studies. For example, Wai et al., (2022) recommended that investigating the ongoing pandemic situation by specifically observing the LST variation from a satellite image analysis between the years 2020 and 2021 would provide a better representation on the effects of human movement restrictions towards the UHI intensity [28]. Lastly, there are numerous different methods for assessing heat island zones and mapping heat island intensity. Therefore, high-resolution images and other metrics should be evaluated to gain a deeper knowledge of heat islands.

5. Conclusions

The COVID-19 lockdown has positive impacts on vegetation health, and a consequent outcome is reduced urban heat islands. In this paper, we examined the impact of COVID-19 lockdown on vegetation through the NDVI and MSAVI12 indices using GIS and remote sensing techniques. The finding is that the health of the vegetation (NDVI) in May 2020 improved after one-month of COVID-19 lockdown during March 2020. Secondly, the highest MSAVI12 coverage was observed in March of 2019, 2020, and 2021 (0.45 to 0.70), which was 22.15 percent, 21.8 percent, and 20.4 percent, respectively. In May 2019, 2020, and 2021, the dense MSAVI12 values accounted for 23.8 percent, 25.5 percent, and 18.4 percent, respectively. There was a substantial negative association between the NDVI and the LST, and between the MSAVI12 and the LST. Finally, at the start of the lockdown in March 2020, the calculated UHI zones were at their peak, as opposed to the same months of 2019 and 2021. However, the UHI zones in May 2020 decreased after one month of closure during March 2020. From March 2020 to May 2020, the minimum LST value of built-up area followed a declining trend. This downward trend continued until March 2021. In March of 2021, the LST began to appreciate in value due to the surge in human activities and industrial operations. The methodology of this study offers a cost-effective and efficient continuous measuring and monitoring technique for the LST and UHI with an acceptable level of accuracy. Additionally, the GIS and remote sensing techniques identify spatial distribution and present a visual map for UHI hotspots. Therefore, the methodological approach of this study can help planners and policy makers to locate spatial countermeasures against UHI. One of the biggest limitations of the study is the non-inclusion of the lag-time effect of the COVID-19 lockdown; rather, the study solely focuses on the LST of three consecutive years. A longitudinal study by integrating climatic and meteorological factors would be more comprehensive for a deeper understanding on the variation of the vegetation pattern, LST, and UHI intensity. In addition, rather than only considering the long-term effects of lockdowns, short-term lockdowns (one or two weeks) should be included while performing this type of study in future. Secondly, the accuracy of the LST calculation, as well as the estimation of the NDVI and MSAVI12 indices, are compromised due to the low image resolutions. The inclusion of high-resolution images can certainly improve the LST estimation and UHIs.

Author Contributions

Conceptualization, M.M.M. and M.A.S.; methodology, M.A.S.; software, M.A.S.; validation, M.A.S., S.S. and M.M.M.; formal analysis, M.A.S.; investigation, S.S.; resources, S.S.; data curation, M.A.S.; writing—original draft preparation, M.A.S. and S.S.; writing—review and editing, M.M.M., M.A.-M. and H.A.; visualization, H.A.; supervision, M.M.M. and H.G.A.; project administration, M.A.-M. and H.A.; funding acquisition, H.A., M.A.-M. and H.G.A. All authors have read and agreed to the published version of the manuscript.

Funding

This project was funded by Princess Nourah bint Abdulrahman University Research Supporting Project Number PNURSP2022R241, Princess Nourah bint Abdulrahman University, Riyadh, Saudi Arabia. The article processing charge was funded by the Deanship of Scientific Research, Qassim University.

Institutional Review Board Statement

Not applicable.

Informed Consent Statement

Not applicable.

Data Availability Statement

The data used in this paper can be obtained from Earth Explorer- United States Geological Survey (USGS): https://earthexplorer.usgs.gov/ (accessed on 10 April 2021).

Acknowledgments

The authors would like to thank Princess Nourah bint Abdulrahman University for supporting the project and the Deanship of Scientific Research, Qassim University, for funding the publication of this project.

Conflicts of Interest

The authors declare no conflict of interest.

References

  1. Liu, Z.; Lai, J.; Zhan, W.; Bechtel, B.; Voogt, J.; Quan, J.; Hu, L.; Fu, P.; Huang, F.; Li, L.; et al. Urban heat islands significantly reduced by COVID-19 lockdown. Geo. Res. Lett. 2022, 49, e2021GL096842. [Google Scholar] [CrossRef]
  2. WHO. Coronavirus Disease (COVID-19): Weekly Epidemiological Update; WHO: Geneva, Switzerland, 2021. [Google Scholar]
  3. El Kenawy, A.M.; Lopez-Moreno, J.I.; McCabe, M.F.; Domínguez-Castro, F.; Peña-Angulo, D.; Gaber, I.M.; Alqasemi, A.S.; Al Kindi, K.M.; Al-Awadhi, T.; Hereher, M.E.; et al. The impact of COVID-19 lockdowns on surface urban heat island changes and air-quality improvements across 21 major cities in the Middle East. Environ. Pollut. 2021, 288, 117802. [Google Scholar] [CrossRef]
  4. Teufel, B.; Sushama, L.; Poitras, V.; Dukhan, T.; Bélair, S.; Miranda-Moreno, L.; Sun, L.; Sasmito, A.P.; Bitsuamlak, G. Impact of COVID-19-Related Traffic Slowdown on Urban Heat Characteristics. Atmosphere 2021, 12, 243. [Google Scholar] [CrossRef]
  5. Alqasemi, A.S.; Hereher, M.E.; Kaplan, G.; Al-Quraishi, A.; Saibi, H. Impact of COVID-19 lockdown upon the air quality and surface urban heat island intensity over the United Arab Emirates. Sci. Total Environ. 2021, 767, 144330. [Google Scholar] [CrossRef]
  6. Bauwens, M.; Compernolle, S.; Stavrakou, T.; Müller, J.-F.; Van Gent, J.; Eskes, H.; Levelt, P.F.; Van Der A, R.; Veefkind, J.P.; Vlietinck, J.; et al. Impact of coronavirus outbreak on NO2 pollution assessed using TROPOMI and OMI observations. Geo. Res. Lett. 2020, 47, e2020GL087978. [Google Scholar] [CrossRef]
  7. Le Quéré, C.; Jackson, R.B.; Jones, M.W.; Smith, A.J.; Abernethy, S.; Andrew, R.M. Temporary reduction in daily global CO2 emissions during the COVID-19 forced confinement. Nat. Climate Chang. 2020, 10, 647–653. [Google Scholar] [CrossRef]
  8. Oke, T.R.; Mills, G.; Christen, A.; Voogt, J.A. Urban Climate; Cambridge University Press: Cambridge, UK, 2017. [Google Scholar]
  9. Nicola, M.; Alsafi, Z.; Sohrabi, C.; Kerwan, A.; Al-Jabir, A.; Iosifidis, C. The socio-economic implications of the coronavirus pandemic (COVID-19): A review. Int. J. Surg. 2020, 78, 185–193. [Google Scholar] [CrossRef]
  10. Geng, D.C.; Innes, J.; Wu, W.; Wang, G. Impacts of COVID-19 pandemic on urban park visitation: A global analysis. J. For. Res. 2021, 32, 553–567. [Google Scholar] [CrossRef] [PubMed]
  11. Shi, P.; Dong, Y.; Yan, H.; Zhao, C.; Li, X.; Liu, W.; He, M.; Tang, S.; Xi, S. Impact of temperature on the dynamics of the COVID-19 outbreak in China. Sci. Total Environ. 2020, 728, 138890. [Google Scholar] [CrossRef] [PubMed]
  12. Yunus, A.P.; Masago, Y.; Hijioka, Y. COVID-19 and surface water quality: Improved lake water quality during the lockdown. Sci. Total Environ. 2020, 731, 139012. [Google Scholar] [CrossRef] [PubMed]
  13. Mohajerani, A.; Bakaric, J.; Jeffrey-Bailey, T. The urban heat island effect, its causes, and mitigation, with reference to the thermal properties of asphalt concrete. J. Environ. Manag. 2017, 197, 522–538. [Google Scholar] [CrossRef]
  14. Alahmad, B.; Tomasso, L.P.; Al-Hemoud, A.; James, P.; Koutrakis, P. Spatial Distribution of Land Surface Temperatures in Kuwait: Urban Heat and Cool Islands. Int. J. Environ. Res. Public Health 2020, 17, 2993. [Google Scholar] [CrossRef]
  15. Choudhury, D.; Das, K.; Das, A. Assessment of land use land cover changes and its impact on variations of land surface temperature in Asansol-Durgapur Development Region. Egyptian J. Remote Sens. Space Sci. 2019, 22, 203–218. [Google Scholar] [CrossRef]
  16. Al-Ruzouq, R.; Shanableh, A.; Khalil, M.A.; Zeiada, W.; Hamad, K.; Abu Dabous, S.; Gibril, M.B.A.; Al-Khayyat, G.; Kaloush, K.E.; Al-Mansoori, S.; et al. Spatial and Temporal Inversion of Land Surface Temperature along Coastal Cities in Arid Regions. Remote Sens. 2022, 14, 1893. [Google Scholar] [CrossRef]
  17. Manoli, G.; Fatichi, S.; Schläpfer, M.; Yu, K.; Crowther, T.W.; Meili, N. Magnitude of urban heat islands largely explained by climate and population. Nature 2019, 573, 55–60. [Google Scholar] [CrossRef]
  18. Peng, S.; Piao, S.; Ciais, P.; Friedlingstein, P.; Ottle, C.; Breon, F. Surface urban heat island across 419 global big cities. Environ. Sci. Technol. 2012, 46, 696–703. [Google Scholar] [CrossRef]
  19. Yang, X.; Ruby Leung, L.; Zhao, N.; Zhao, C.; Qian, Y.; Hu, K. Contribution of urbanization to the increase of extreme heat events in an urban agglomeration in east China. Geophys. Res. Lett. 2017, 44, 6940–6950. [Google Scholar] [CrossRef]
  20. Yang, X.; Hou, Y.; Chen, B. Observed surface warming induced by urbanization in east China. J. Geophys. Res. 2011, 116, 10. [Google Scholar] [CrossRef]
  21. Boumans, R.J.M.; Phillips, D.L.; Victery, W.; Fontaine, T.D. Developing a model for effects of climate change on human health and health–environment interactions: Heat stress in Austin, Texas. Urban Clim. 2014, 8, 78–99. [Google Scholar] [CrossRef]
  22. Katsouyanni, K.; Pantazopoulou, A.; Touloumi, G.; Tselepidaki, I.; Moustris, K.; Asimakopoulos, D.; Poulopoulou, G.; Trichopoulos, D. Evidence for Interaction between Air Pollution and High Temperature in the Causation of Excess Mortality. Arch. Environ. Health Int. J. 1993, 48, 235–242. [Google Scholar] [CrossRef]
  23. Cao, C.; Lee, X.; Liu, S.; Schultz, N.; Xiao, W.; Zhang, M. Urban heat islands in China enhanced by haze pollution. Nat. Comm. 2016, 7, 12509. [Google Scholar] [CrossRef] [PubMed]
  24. Lazzarini, M.; Marpu, P.R.; Ghedira, H. Temperature-land cover interactions: The inversion of urban heat island phenomenon in desert city areas. Remote Sen. Environ. 2013, 130, 136–152. [Google Scholar] [CrossRef]
  25. Lazzarini, M.; Molini, A.; Marpu, P.R.; Ouarda, T.B.; Ghedira, H. Urban climate modifications in hot desert cities: The role of land cover, local climate, and seasonality. Geophys. Res. Lett. 2015, 42, 9980–9989. [Google Scholar] [CrossRef] [Green Version]
  26. Logan, T.M.; Zaitchik, B.; Guikema, S.; Nisbet, A. Night and day: The influence and relative importance of urban characteristics on remotely sensed land surface temperature. Remote Sens. Environ. 2020, 247, 111861. [Google Scholar] [CrossRef]
  27. Stewart, I.D.; Oke, T.R. Local climate zones for urban temperature studies. Bull. Am. Meteorol. Soc. 2012, 93, 1879–1900. [Google Scholar] [CrossRef]
  28. Wai, C.Y.; Muttil, N.; Tariq, M.A.U.R.; Paresi, P.; Nnachi, R.C.; Ng, A.W.M. Investigating the Relationship between Human Activity and the Urban Heat Island Effect in Melbourne and Four Other International Cities Impacted by COVID-19. Sustainability 2022, 14, 378. [Google Scholar] [CrossRef]
  29. Oke, T.R. The urban energy balances. Prog. Phys. Geogr. Earth Environ. 1988, 12, 471–508. [Google Scholar] [CrossRef]
  30. Oke, T.R. The energetic basis of the urban heat island. Q. J. R. Meteorol. Soc. 1982, 108, 1–24. [Google Scholar] [CrossRef]
  31. Imhoff, M.L.; Zhang, P.; Wolfe, R.E.; Bounoua, L. Remote sensing of the urban heat island effect across biomes in the continental USA. Remote Sens. Environ. 2010, 114, 504–513. [Google Scholar] [CrossRef] [Green Version]
  32. Wu, J.; Wang, D.; Bauer, M.E. Assessing broadband vegetation indices and QuickBird data in estimating leaf area index of corn and potato canopies. Field Crop. Res. 2007, 102, 33–42. [Google Scholar] [CrossRef]
  33. Cleugh, H.; Smith, M.S.; Battaglia, M.; Graham, P. Climate Change: Science and Solutions for Australia; CSIRO: Canberra, Australia, 2011. [Google Scholar]
  34. Zhang, Y.; Jungang, G.; Linshan, L.; Zhaofeng, W.; Minjung, D.; Xuchao, Y. NDVI-based vegetation changes and their responses to climate change from 1982 to 2011: A case study in the Koshi River Basin in the middle Himalayas. Glob. Planet. Change 2013, 108, 139–148. [Google Scholar] [CrossRef]
  35. Gaffar, A.; Sawaid, A.; Faisal, M.Q.; Man, S.W. Environmental impacts of shifts in energy, emissions, and urban heat island during the COVID-19 lockdown across Pakistan. J. Clean. Prod. 2021, 291, 125806. [Google Scholar] [CrossRef]
  36. Guha, S.; Govil, H. COVID-19 lockdown effect on land surface temperature and normalized difference vegetation index. Geomat. Nat. Hazards Risk 2021, 12, 1082–1100. [Google Scholar] [CrossRef]
  37. Zambrano-Monserrate, M.A.; Ruano, M.A.; Sanchez-Alcalde, L. Indirect effects of COVID-19 on the environment. Sci. Total Environ. 2020, 728, 138813. [Google Scholar] [CrossRef]
  38. Guojun, H.; Yuhang., P.; Takano, T. The short-term impacts of COVID-19 lockdown on urban air pollution in China, Tanaka. Nat. Sustain. 2020, 3, 1005–1011. [Google Scholar] [CrossRef]
  39. Chakraborty, T.C.; Sarangi, C.; Lee, X. Reduction in human activity can enhance the urban heat island: Insights from the COVID-19 lockdown. Environ. Res. Lett. 2021, 16, 5. [Google Scholar] [CrossRef]
  40. Zhang, M.; Zhang, C.; Kafy, A.-A.; Tan, S. Simulating the Relationship between Land Use/Cover Change and Urban Thermal Environment Using Machine Learning Algorithms in Wuhan City, China. Land 2022, 11, 14. [Google Scholar] [CrossRef]
  41. Kafy, A.A.; Faisal, A.-A.; Shuvo, R.M.; Naim, N.H.; Sikdar, S.; Chowdhury, R.R.; Islam, A.; Sarker, H.S.; Khan, H.H.; Kona, M.A. Remote sensing approach to simulate the land use/land cover and seasonal land surface temperature change using machine learning algorithms in a fastest-growing megacity of Bangladesh. Remote Sens. Appl. Soc. Environ. 2020, 21, 100463. [Google Scholar] [CrossRef]
  42. Qi, J.; Chehbouni, A.; Huete, A.; Kerr, A.R.; Sorooshian, Y.H.S. A Modified Soil Adjusted Vegetation Index. Remote Sen. Environ. 1994, 48, 119–126. [Google Scholar] [CrossRef]
  43. Wang, Z.; Guo, P.; Wan, H.; Tian, F.; Wang, L. Integration of Microwave and Optical/Infrared Derived Datasets from Multi-Satellite Products for Drought Monitoring. Water 2020, 12, 1504. [Google Scholar] [CrossRef]
  44. Adeyeri, O.E.; Akinsanola, A.A.; Ishola, K.A. Investigating Surface Urban Heat Island Characteristics over Abuja, Nigeria: Relationship between land surface temperature and multiple vegetation indices. Remote Sens. Appl. Soc. Environ. 2017, 7, 57–68. [Google Scholar] [CrossRef]
  45. Sneha, G.; Shamsunnahar, S.; Mohd Golam, Q.K.; Md, B.K. Analysis of the health, economic and environmental impacts of COVID-19: The Bangladesh perspective. Geosyst. Geo-Environ. 2021, 1, 100011. [Google Scholar]
  46. Ibrahim, S.; Landa, M.; Pešek, O.; Pavelka, K.; Halounova, L. Space-Time Machine Learning Models to Analyze COVID-19 Pandemic Lockdown Effects on Aerosol Optical Depth over Europe. Remote Sens. 2021, 13, 3027. [Google Scholar] [CrossRef]
  47. Islam, M.S.; Tusher, T.R.; Roy, S. Impacts of nationwide lockdown due to COVID-19 outbreak on air quality in Bangladesh: A spatiotemporal analysis. Air Qual. Atmos. Health 2021, 14, 351–363. [Google Scholar] [CrossRef]
  48. Kafy, A.A.; Dey, N.N.; Rakib, A.A.; Rahaman, Z.A.; Rafat-Naser, N.M.; Bhatt, A. Modeling the relationship between land use/land cover and land surface temperature in Dhaka, Bangladesh using CA-ANN algorithm. Environ. Challenges 2021, 4, 100190. [Google Scholar] [CrossRef]
  49. Ahmed, B.; Kamruzzaman, M.; Zhu, X.; Rahman, M.S.; Choi, K. Simulating Land Cover Changes and Their Impacts on Land Surface Temperature in Dhaka, Bangladesh. Remote Sens. 2013, 5, 5969–5998. [Google Scholar] [CrossRef] [Green Version]
  50. Faisal, A.A.; Kafy, A.A.; Rakib, A.A. Assessing and predicting land use/land cover, land surface temperature and urban thermal field variance index using Landsat imagery for Dhaka Metropolitan area. Environ. Challenges 2021, 4, 100192. [Google Scholar] [CrossRef]
  51. Gogoi, P.P. Land use and land cover change effect on surface temperature over Eastern India. Sci. Rep. 2019, 9, 8859. [Google Scholar] [CrossRef] [PubMed] [Green Version]
  52. Saha, S. Analyzing spatial relationship between land use/land cover (LULC) and land surface temperature (LST) of three urban agglomerations (UAs) of Eastern India. Remote Sens. Appl. Soc. Environ. 2021, 22, 100507. [Google Scholar] [CrossRef]
  53. Morshed, M.M.; Sarkar, S.K.; Zaman, M.R.U. Application of remote sensing for salinity based coastal land use zoning in Bangladesh. Spat. Inf. Res. 2020, 29, 353–364. [Google Scholar] [CrossRef]
  54. Xu, J.; Ge, X.; Zhang, X.; Zhao, W.; Zhang, R.; Zhang, Y. COVID-19 impact on the concentration and composition of submicron particulate matter in a typical city of Northwest China. Geo. Res. Lett. 2020, 47, 19. [Google Scholar] [CrossRef]
  55. Georgiana, G.; Bogdan, U. Land Use/Land Cover changes dynamics and their effects on Surface Urban Heat Island in Bucharest, Romania. Int. J. Appl. Earth Obs. Geoinf. 2019, 80, 115–126. [Google Scholar] [CrossRef]
  56. Hashim, B.M.; Al Maliki, A.; Sultan, M.A. Effect of land use land cover changes on land surface temperature during 1984–2020: A case study of Baghdad city using landsat image. Nat. Hazards 2022, 112, 1223–1246. [Google Scholar] [CrossRef]
  57. Debbage, N.; Shepherd, J.M. The urban heat island effect and city contiguity. Comput. Environ. Urban Syst. 2015, 54, 181–194. [Google Scholar] [CrossRef]
  58. Dash, P.; Gottsche, F.M.; Olesen, F.S.; Fischer, H. Land Surface Temperature and Emissivity Estimation from Passive Sensor Data: Theory and Practice-Current Trends. Int. J. Remote Sen. 2002, 23, 2563–2594. [Google Scholar] [CrossRef]
  59. Binte Mostafiz, R.; Noguchi, R.; Ahamed, T. Agricultural Land Suitability Assessment Using Satellite Remote Sensing-Derived Soil-Vegetation Indices. Land 2021, 10, 223. [Google Scholar] [CrossRef]
  60. Li, J.; Pang, G.; Wang, X.; Liu, F.; Zhang, Y. Spatiotemporal Dynamics of Land Surface Albedo and Its Influencing Factors in the Qilian Mountains, Northeastern Tibetan Plateau. Remote Sens. 2022, 14, 1922. [Google Scholar] [CrossRef]
  61. Abdo, H.G. Impacts of war in Syria on vegetation dynamics and erosion risks in Safita area, Tartous, Syria. Reg. Environ. Chang. 2018, 18, 1707–1719. [Google Scholar] [CrossRef]
  62. Hou, Y.; Chen, Y.; Ding, J.; Li, Z.; Li, Y.; Sun, F. Ecological Impacts of Land Use Change in the Arid Tarim River Basin of China. Remote Sens. 2022, 14, 1894. [Google Scholar] [CrossRef]
  63. Kim, S.W.; Brown, R.D. Urban heat island (UHI) intensity and magnitude estimations: A systematic literature review. Sci. Total Environ. 2021, 779, 146389. [Google Scholar] [CrossRef]
  64. Hu, Y.; Jia, G. Influence of land use change on urban heat island derived from multi-sensor data. Int. J. Climatol. 2011, 30, 1382–1395. [Google Scholar] [CrossRef]
  65. Bokaie, M.; Shamsipour, A.; Khatibi, P.; Hosseini, A. Seasonal monitoring of urban heat island using multi-temporal Landsat and MODIS images in Tehran. Int. J. Urban Sci. 2019, 23, 269–285. [Google Scholar] [CrossRef]
  66. El-Hattab, M.; Amany, S.M.; Lamia, G.E. Monitoring and assessment of urban heat islands over the Southern region of Cairo Governorate, Egypt. J. Remote Sens. Space Sci. 2018, 21, 311–323. [Google Scholar] [CrossRef]
  67. Khamchiangta, D.; Dhakal, S. Time series analysis of land use and land cover changes related to urban heat island intensity: Case of Bangkok Metropolitan Area in Thailand. J. Urban Manag. 2020, 9, 383–395. [Google Scholar] [CrossRef]
  68. Pramanik, S.; Punia, M. Land use/land cover change and surface urban heat island intensity: Source–sink landscape-based study in Delhi. India. Environ. Dev. Sustain. 2020, 22, 7331–7356. [Google Scholar] [CrossRef]
  69. Parlow, E. Regarding Some Pitfalls in Urban Heat Island Studies Using Remote Sensing Technology. Remote Sens. 2021, 13, 3598. [Google Scholar] [CrossRef]
  70. Keeratikasikorn, C.; Bonafoni, S. Urban heat island analysis over the land use zoning plan of Bangkok by means of Landsat 8 imagery. Remote Sens. 2018, 10, 440. [Google Scholar] [CrossRef]
  71. Naserikia, M.; Shamsabadi, E.A.; Rafieian, M.; Filho, W.L. The urban heat island in an urban context: A case study of Mashhad, Iran. Int. J. Environ. Res. Public Health 2019, 16, 313. [Google Scholar] [CrossRef] [Green Version]
  72. Shikwambana, L.; Kganyago, M.; Mhangara, P. Temporal Analysis of Changes in Anthropogenic Emissions and Urban Heat Islands during COVID-19 Restrictions in Gauteng Province, South Africa. Aerosol Air Qual. Res. 2021, 21, 200437. [Google Scholar] [CrossRef]
  73. Aneesh, M.; Sarwesh, P.; Sumit, K. Investigating the contrast diurnal relationship of land surface temperatures with various surface parameters represent vegetation, soil, water, and urbanization over Ahmedabad city in India. Energy Nexus 2022, 5, 100044. [Google Scholar] [CrossRef]
  74. Nasir, M.J.; Ahmad, W.; Iqbal, J.; Ahmad, B.; Abdo, H.G.; Hamdi, R.; Bateni, S.M. Effect of the Urban Land Use Dynamics on Land Surface Temperature: A Case Study of Kohat City in Pakistan for the Period 1998–2018. Environ. Earth Sci. 2022, 6, 237–248. [Google Scholar] [CrossRef]
Figure 1. Location of the study area (Dhaka city, Bangladesh).
Sustainability 14 07922 g001
Figure 2. Land use land cover of Dhaka.
Sustainability 14 07922 g002
Figure 3. NDVI of Dhaka during the study period.
Sustainability 14 07922 g003
Figure 4. NDVI area percentage change before and after COVID-19.
Sustainability 14 07922 g004
Figure 5. MSAVI12 of Dhaka during the study period.
Sustainability 14 07922 g005
Figure 6. MSAVI12 area percentage change before and after COVID-19.
Sustainability 14 07922 g006
Figure 7. LST of Dhaka during the study period.
Sustainability 14 07922 g007
Figure 8. LST area percentage change before and after COVID-19.
Sustainability 14 07922 g008
Figure 9. UHI of Dhaka during the study period.
Sustainability 14 07922 g009
Figure 10. UHI area percentage change before and after COVID-19.
Sustainability 14 07922 g010
Figure 11. LST profile over the study area for 2019, 2020, and 2021 (a) March and (b) May month.
Sustainability 14 07922 g011
Figure 12. LST variation before and after lockdown in major UHI zones.
Sustainability 14 07922 g012
Figure 13. Variation of maximum UHI before and after lockdown.
Sustainability 14 07922 g013
Figure 14. (ac) shows the variation (min. to max.) of LST and (df) shows the variation (min. to max.) of UHI on different land use types for May 2019, May 2020 and May 2021.
Sustainability 14 07922 g014
Figure 15. (ac) shows the variation (min. to max.) of LST and (df) shows the variation (min. to max.) of UHI on different land use types for May 2019, May 2020 and May 2021.
Sustainability 14 07922 g015aSustainability 14 07922 g015b
Figure 16. Correlation results for March and May 2019 to 2021 between LST with respect to NDVI (af); correlation between LST with respect to MSAVI12 (gl).
Sustainability 14 07922 g016
Table 1. Image types and acquisition date.
YearsAcquisition DateSatelliteSensorPath/RowCloud Coverage
2019 Summer2019-3-28
(Before COVID-19)
Landsat 8OLI-30m137/44<10%
2020 Summer2020-3-30
(Beginning of lockdown)
Landsat 8OLI-30m137/44<10%
2021 Summer2021-3-28
(After one year of COVID-19 arrival)
Landsat 8OLI-30m137/44<10%
2019 Summer2019-5-15
(Before COVID-19)
Landsat 8OLI-30m137/44<10%
2020 Summer2020-5-17
(After 1 month locked down)
Landsat 8OLI-30m137/44<10%
2021 Summer2021-5-20
(After one year of COVID-19 arrival)
Landsat 8OLI-30m 137/44<10%
Table 2. Land use land cover types and amount of area.
Land Use TypeArea km2Area (%)
Bare soil76.5804525.02629
Built-up161.170252.67
Low land47.9846315.68125
Vegetation10.84743.544902
Water9.41733.077549
Total:306100
Table 3. NDVI Matrix for March and May (2019 to 2021).
March (Area km2)May (Area km2)
NDVI Values201920202021201920202021
−0.20 to 0.0564.71972.52278.886865.7971.665278.03
0.00 to 0.1595.16684.915102.265294.55483.844101.1024
0.15 to 0.3096.23791.874.81796.08492.044874.205
0.30 to 0.4022.18518.97222.9521.57319.8924.786
0.40 to 0.60 27.69337.79127.08127.99938.55627.8766
Total:306306306306306306
Table 4. MSAVI12 Matrix of the study area for March and May.
March (Area km2)May (Area km2)
MSAVI12 Values201920202021201920202021
−0.50 to 0.0013.61712.08711.32213.46410.7115.606
0.00 to 0.1572.98168.697108.6368.8580.17299.756
0.15 to 0.3090.27111.6990.2794.09565.79108.63
0.30 to 0.4561.35346.81833.35456.76371.29825.704
0.45 to 0.7067.77966.70862.42472.82878.0356.304
Total Area306306306306306306
Table 5. LST Matrix of the study area for March and May.
March (Area km2)May (Area km2)
LST Values201920202021201920202021
23.00 to 26.0068.8514.84119.951270.83918.20720.3796
26.00 to 28.0034.73119.8924.602422.18531.67122.644
28.00 to 30.0071.60478.18371.14565.94384.45660.435
30.00 to 35.0095.013111.69128.82681.85578.03122.706
35.00 to 42.0035.80281.39661.475465.17893.63679.8354
Total Area306306306306306306
Table 6. UHI Matrix of the study area for March and May.
March (Area km2)May (Area km2)
UHI Values201920202021201920202021
−3.00 to −1.0077.72454.957658.59968.08570.8455.7532
−1.00 to 0.5054.31534.42522.79737.79120.65517.5644
0.50 to 2.0085.37492.901674.9780.78448.19584.762
2.00 to 3.8027.69365.17868.39146.81897.30880.019
3.80 to 5.0060.89458.537881.24372.5226967.9014
Total Area306306306306306306
Table 7. Changes in LST before and after lockdown in areas containing maximum UHI value.
Area with Max UHIChanges in LST before and after Locked Down
28/3/1930/3/2028/3/2115/5/1917/5/2020/5/21
Turag34.536.836.734.6536.2537.7
Khilkhet35.5535.836.135.635.1536
Badda39.240.4440.1539.1539.5441.4
Kamrangir Char39.3340.540.6540.0539.441
Tejgaon industrial area39.76540.9740.940.139.0041.7
Shyamnagar39.26540.4740.439.639.441.2
Airport area37.93539.1639.1538.1938.29639.66
Mirpur38.9840.240.1539.339.2440.85
Publisher’s Note: MDPI stays neutral with regard to jurisdictional claims in published maps and institutional affiliations.

