
Physiological Comparison of Wheat and Maize Seedlings Responses to Water Stresses


Polish Academy of Sciences, The Franciszek Górski Institute of Plant Physiology, Niezapominajek 21, 30-239 Kraków, Poland
*
Author to whom correspondence should be addressed.
Sustainability 2022, 14(13), 7932; https://0-doi-org.brum.beds.ac.uk/10.3390/su14137932
Submission received: 20 April 2022
/
Revised: 22 June 2022
/
Accepted: 25 June 2022
/
Published: 29 June 2022
(This article belongs to the Special Issue Sustainable Agriculture and Climate Resilience)
Abstract
:The aim of the study was to investigate specific responses of spring wheat (C3 photosynthesis) and maize (C4 photosynthesis) to drought and flooding stress. Analyses of water content, gas exchange intensity, photosynthetic apparatus activity, chlorophyll content, plant height and biological membrane integrity were performed on the 10th day of drought and flooding in both species at the third leaf stage. A specific response of wheat under both drought and flooding conditions involved an increase in ETo/RC ratio, describing electron transport flux converted into a single reaction center in PSII. Correlations between electrolyte leakage and the probability of electron transport beyond the plastoquinone QA, and the amount of energy used for the electron transport were also found. A specific response of maize during flooding was the increase of stomatal conductance. Additionally, a significant correlation between PN/Ci and relative water content was exhibited. Furthermore, the parameters differentiating the studied species only under stressful conditions were rendered. The application of such parameters can be widely used, e.g., for studying the reaction of a potential cultivars to drought and flooding. Providing such information to potential farmers can help better select cultivars for their environmental conditions.
1. Introduction
Most forecasts on climate changes predict increasing water shortages in the areas of cereal cultivation as well as weather anomalies such as periodic flooding, larger floods, or whirlwinds [1,2]. This is why the demand for species and cultivars with enhanced tolerance to these environmental stresses is on the rise [3].
Soil drought is a serious risk to plant productivity. A decrease in the quantity and quality of yields is the final result of soil drought, as a consequence of many physiological disturbances, such as increasing the degree of cell membrane damage and chlorophyll degradation or reducing the photochemical activity of PSII by disordering the energy flow in PSII [4]. The occurrence of too heavy a rainfall after a long drought is also not favorable. Too much rain results in excess soil water, limited oxygen and nutrient availability and therefore reduced plant growth. Finally, agricultural lands can be subject to the inundation of water over-spilling from ditches, rivers, and streams during periods of intense rainfall [5,6]. Our previous research shows that plant aging induced by soil drought can be continued and even intensified by too rapid irrigation in the rehydration phase [7]. Water availability is critical for wheat production, and drought is the major cause of yield losses [8,9]. This is a serious problem, because wheat is one of the most important foods and is a major source of energy and nutrition for many people, for example, bread wheat is the staple food for about 35% of the world’s population [10,11,12]. Maize is also of great importance for human and animal nutrition, and has been reported to be very sensitive to drought stress. Although maize is perceived as preferring warm areas, such as the Mediterranean, which would suggest its low water requirements, in fact its cultivation in these areas often has to be supported by additional irrigation. There is a group of current studies that focuses on modeling the actual needs of maize to reduce unnecessary water losses [13,14]. This is another proof that plants are very often subjected to opposing effects, such as lack and excess of water.
Therefore, our research focused on two opposing stresses to investigate the specific responses of spring wheat (C3 photosynthesis) and maize plants (C4 photosynthesis) to drought and flooding stress at early stages of growth. As the species differ in their type of photosynthesis, we assumed they would also react in different ways to these two stress factors. To verify this hypothesis, we investigated and compared their gas exchange, photosynthetic apparatus activity, chlorophyll content, growth dynamics, water ratios, and damage to biological membranes.
The studied species differ not only in the type of photosynthesis, but also in height and development of the plant. For this reason, comparing their stress response, without specifying the control groups, is virtually impossible. Therefore, the aim of the study was also to select the parameters differentiating both species under stressful conditions and with insignificant differences under control conditions. The knowledge of such parameters may be useful for comparative studies of species in natural conditions. We suppose that the parameters of the chlorophyll fluorescence may be the most useful. As compared with measuring gas exchange, chlorophyll fluorescence measurement is quick, inexpensive and simple to perform. Its huge advantage is its high sensitivity that allows for detecting early stress-related changes prior to the visible symptoms.
The novelty of these studies will be the selection of parameters for the evaluation of the reactions of morphologically different species with a different type of photosynthesis, based on the same level of these parameters under optimal conditions and showing differences only under water stresses. Then, it will be possible to conclude that these differences do not result from differences between these species, but from their sensitivity to the stress tested.
Currently, the registration of new cultivars in Poland does not require providing information on a detailed response to drought and flooding. The changing climate becoming more unpredictable may suggest that the inclusion of such information in the characteristics of cultivars is highly justified. The potential selection of such quick and reliable indicators of plant conditions after stress would facilitate this process, especially in field conditions.
2. Materials and Methods
2.1. Plants Material, Growth Conditions, Treatments
In the experiment, spring wheat (Triticum aestivum L.) cv. ‘Nimfa’ and maize (Zea mays L.) cv. ‘Kosmo230’ were used as plant material. The wheat cv. ‘Nimfa’ (Plant Breeding Strzelce Station) is a mid–early cultivar, with perfect baking quality and a large mass of a thousand grain, as compared with other Polish cultivars. The producer describe the Nimfa as a very good facultative spring wheat cultivar (for late autumn sowing). In addition to possible better winter hardiness, it may be combined with a better use of water from winter rainfall and a greater tolerance to flooding. A mid–early cv. ‘Kosmo 230’ (Małopolska Plant Breeding Station Ltd., Kraków, Poland) was intended for both silage and grain yield. Additionally, it is a high yield cultivar with a good yield structure. The producer describes cv. ‘Kosmo230’ as repetitively and stably yielding in various environments. At the same time, it was mentioned that it is a cultivar suitable for cultivation on weaker soils, but rich in water, which suggests its greater demand for water.
The plants were grown in a growth chamber in 4 L pots (8 pots per treatment, 12 plants per pot), filled with a mixture of commercial peat soil and sand (1:1, v/v). The base of the substrate was soil with highly milled peat deacidified with chalk and supplemented with a starting dose of 0.6 kg m−3 of NPK+Mg compound fertilizer. The pH of the substrate was 5.5–6.5, and the salinity was below 1.9 NaCl dm3. Vegetation was maintained at a 15 h photoperiod, an irradiance of 450 μmol (photon) m−2 s−1 (provided by high pressure sodium lamps, 400 W; Philips SON-T AGRO, Belgium), a temperature of 23/18 °C (day/night), and 40% air humidity. The plants were irrigated with full-strength Hoagland’s nutrient solution once a week. Soil moisture was controlled every day to maintain 70% of field water capacity (FWC) by weighing the pots and adding enough water to achieve weight corresponding to 70% FWC. The weights assigned to specific FWC levels were calculated from a proportion based on a previous determination of the maximum and minimum water capacity. Additionally, soil humidity was measured with a HydroSense Soil Water Content Measurement System (Campbell Scientific Australia, Inc., Garbutt, QLD, Australia) at different points of the pot to check the homogeneity of water content.
Water stress was initiated from the third leaf stage of wheat and maize. For plants exposed to drought stress, water level in the pots was maintained at 30–35% FWC for 10 days. The FWC level was maintained by weight by adding water, as necessary. The flooded plants and water level (pH 7.5, dGH = 273 mg/dm3) of 0.5 cm above the soil surface was maintained for 10 days. Analyses of water content, gas exchange intensity, photosynthetic apparatus activity, chlorophyll content, plant height, and biological membrane integrity were performed on the tenth day of the stress treatment. For all measurements, one replicate means one plant.
2.2. Relative Water Content (RWC)
The measurements involved one 6 cm middle fragment from the second fully developed leaf from the top. RWC was determined according to the Barrs and Weatherley [15] formula:
where FW represents fresh weight, DW dry weight and TW turgid weight. First, a leaf fragment was weighed to determine the fresh weight (FW). Then, this fragment was placed in darkness for 24 h in vials containing water to allow complete rehydration. After that time the TW was determined. Next, the leaf fragment was dried at 85 °C for 48 h and then DW was measured. The measurements were taken in 7 replicates.
RWC = [(FW − DW)/(TW − DW)] × 100%
2.3. Photochemical Efficiency
Measurements involved the central part of the first fully expanded leaf and were performed with a Handy PEA (Hansatech Ltd., King’s Lynn, UK). They were taken after 30 min of leaf adaptation to darkness. The excitation irradiance was 3000 μmol (quantum) m−2 s−1 (peak at 650 nm). Changes in fluorescence were registered automatically by the fluorimeter during irradiation between 10 μs and 1 s. During the initial 2 ms, data were collected every 10 μs with a 12-bit resolution. After this period, the frequency of the automatic data set was dropped. The collected data were analyzed with a JIP test, based on the theory of energy flow in PSII [16,17,18,19]. The following parameters were calculated: absorbed energy flux (ABS), trapped energy flux (TRo), electron transport flux (ETo), and dissipated energy flux (DIo), as well as the area of the photosynthetic sample (RC/CSm). The parameters are classified as specific, i.e., expressed as calculated per a reactive center (RC), and phenomenological, i.e., expressed in terms of the excited photosynthetic surface (cross section, CS) of the sample. Finally, we calculated the following yield ratios: the probability (at t = 0) of electron transport beyond the plastoquinone QA (ψo), the quantum yield of electron transport (at t = 0) (φEo), the maximum quantum yield of PSII photochemistry (at t = 0) (Fv/Fm). PI (overall performance index of PSII photochemistry) was also determined. Measurements involved 16 replicates.
2.4. Gas Exchange
Gas exchange was measured using an infrared gas analyzer LCpro-SD (ADC BioScientific Ltd., Hoddesdon, UK) automatically controlling the measurement conditions. The following parameters were measured: photosynthetic rate (PN), transpiration (E), stomatal conductance (gs), as well as the intercellular concentration of CO2 (Ci). The instantaneous water use efficiency index (WUE) was determined based on the quotient of photosynthetic rate and transpiration (PN/E). Apparent carboxylation efficiency (PN/Ci) was also calculated. The conditions in the measurement chamber were as follows: carbon dioxide concentration 360 µmol mol−1 air, air humidity equal to ambient humidity, temperature 23 °C, PAR intensity 600 µmol photons m−2 s−1. The measurements were carried out between 10:00 a.m. and 12:30 p.m. and involved the first fully expanded leaf in 7 replicates.
2.5. Chlorophyll Content
Measurements based on the leaf greenness index were performed in the first fully developed leaf from the top with a hand-held chlorophyll meter, SPAD-502 (Konica-Minolta, Inc., Tokyo, Japan). Light absorption at 650 nm (absorbed by Chl) and 940 nm (absorbed by the other structures) was determined. The readings were converted using a microprocessor and presented in contractual units, called SPAD readings (with maximum at 60 units). SPAD readings are directly proportional to Chl content. The measurements were taken in 18 replicates.
2.6. Plant Height Analysis
Plant height was determined by measuring the entire aboveground part (from the ground level to the end of the longest leaf).
2.7. Electrolyte Leakage (EL)
For each cultivar, three 3 cm middle leaf fragments were excised from the first fully developed leaf from the top. The samples were washed twice in deionized water and immersed in 25 cm3 of deionized water. After 24 h (t1) of shaking at room temperature, the samples were frozen at −35 °C for 24 h, then heated and shaken again (24 h, room temperature, t2). EL was calculated as follows:
where EL1 and EL2 represent the specific electrical conductance at t1 and t2, respectively. Measurements of electrical conductance were performed with a microcomputer conductivity meter CC-317 (Elmetron, Zabrze, Poland). They were taken with 6 replicates.
EL = (EL1/EL2) × 100%,
2.8. Statistical Analysis
A two-way analysis (stress/control and species) of variance using the Duncan’s test at p < 0.05 was performed in order to determine the significance of differences within treatment (drought, waterlogging), measured separately for each parameter. All data were checked for normality before analysis using the Shapiro–Wilk test. All data were analyzed using Statistica 13.1 software (Statsoft, Inc., Tulsa, OK, USA).
3. Results and Discussion
3.1. Plant Height, Relative Water Content (RWC) and Electrolyte Leakage (EL)
Table 1 shows the results on plant height, relative water content (RWC) and electrolyte leakage (EL). Only in maize did both soil drought and flooding significantly decrease plant height (Table 1). Plant growth inhibition is a visible effect of environmental stresses, including drought and flooding [20,21,22]. A significant positive correlation between net photosynthesis of winter wheat and its height difference was noted by the authors, indicating that the height was affected by photosynthesis. However, the impact of drought on both these parameters depends on the development phase of wheat. Bread wheat research has shown that plant height also has a significant positive correlation with grain yield [23,24]. However, in maize, both stressors resulted in a significant drop in leaf water content (RWC) (Table 1), and we found it more likely that plant growth under both stresses was reduced as a result of changes in photosynthesis and photosynthetic apparatus activity. It has been shown that photosynthesis and photosynthetic apparatus activity are negatively affected by changes in RWC [25].
The results on relative water content (RWC) indicated a similar level of leaf hydration in both species experiencing drought and flooding (Table 1). According to Hsiao [26], this level of RWC drop corresponds to mild or moderate water stress. Soil drought-induced decrease in water content in wheat and maize was also reported by other authors [27,28]. Azizi, et al. [29] explained a significantly lower leaf RWC in flooded Populus euphratica by limited water uptake by the plant root system. A similar decline in leaf water content during flooding stress was seen in sorghum and soybean [30,31].
Drought stress was also associated with increased damage to the biological membranes (higher EL) observed in both investigated species (Table 1). The same response of wheat and maize to drought was witnessed in other studies [4,32].
The integrity of biological membranes was particularly sensitive to flooding in maize, as manifested by the highest value of EL (35.4 %) (Table 1). Similar disturbances to the biological membrane integrity in flooded maize plants were also observed by other authors [33,34,35]. Yordanova and Popova [36] proved that the increase in electrolyte leakage under flooding stress was linked to root oxygen deficiency that induced photooxidative damage in maize leaves. Additionally, ROS accumulation induced by flooding was another destructive factor for cell membranes [37].
Significant correlations between electrolyte leakage (EL) and the probability (at t = 0) of electron transport beyond the plastoquinone QA (ψo) (Figure 1A), and the amount of energy used for the electron transport (ETo/CSm) were found (Figure 1B). The results point to the fact that flooding conditions disturb electron transport between PSII and PSI in maize.
3.2. Leaf Gas Exchange and Water Use Efficiency (WUE)
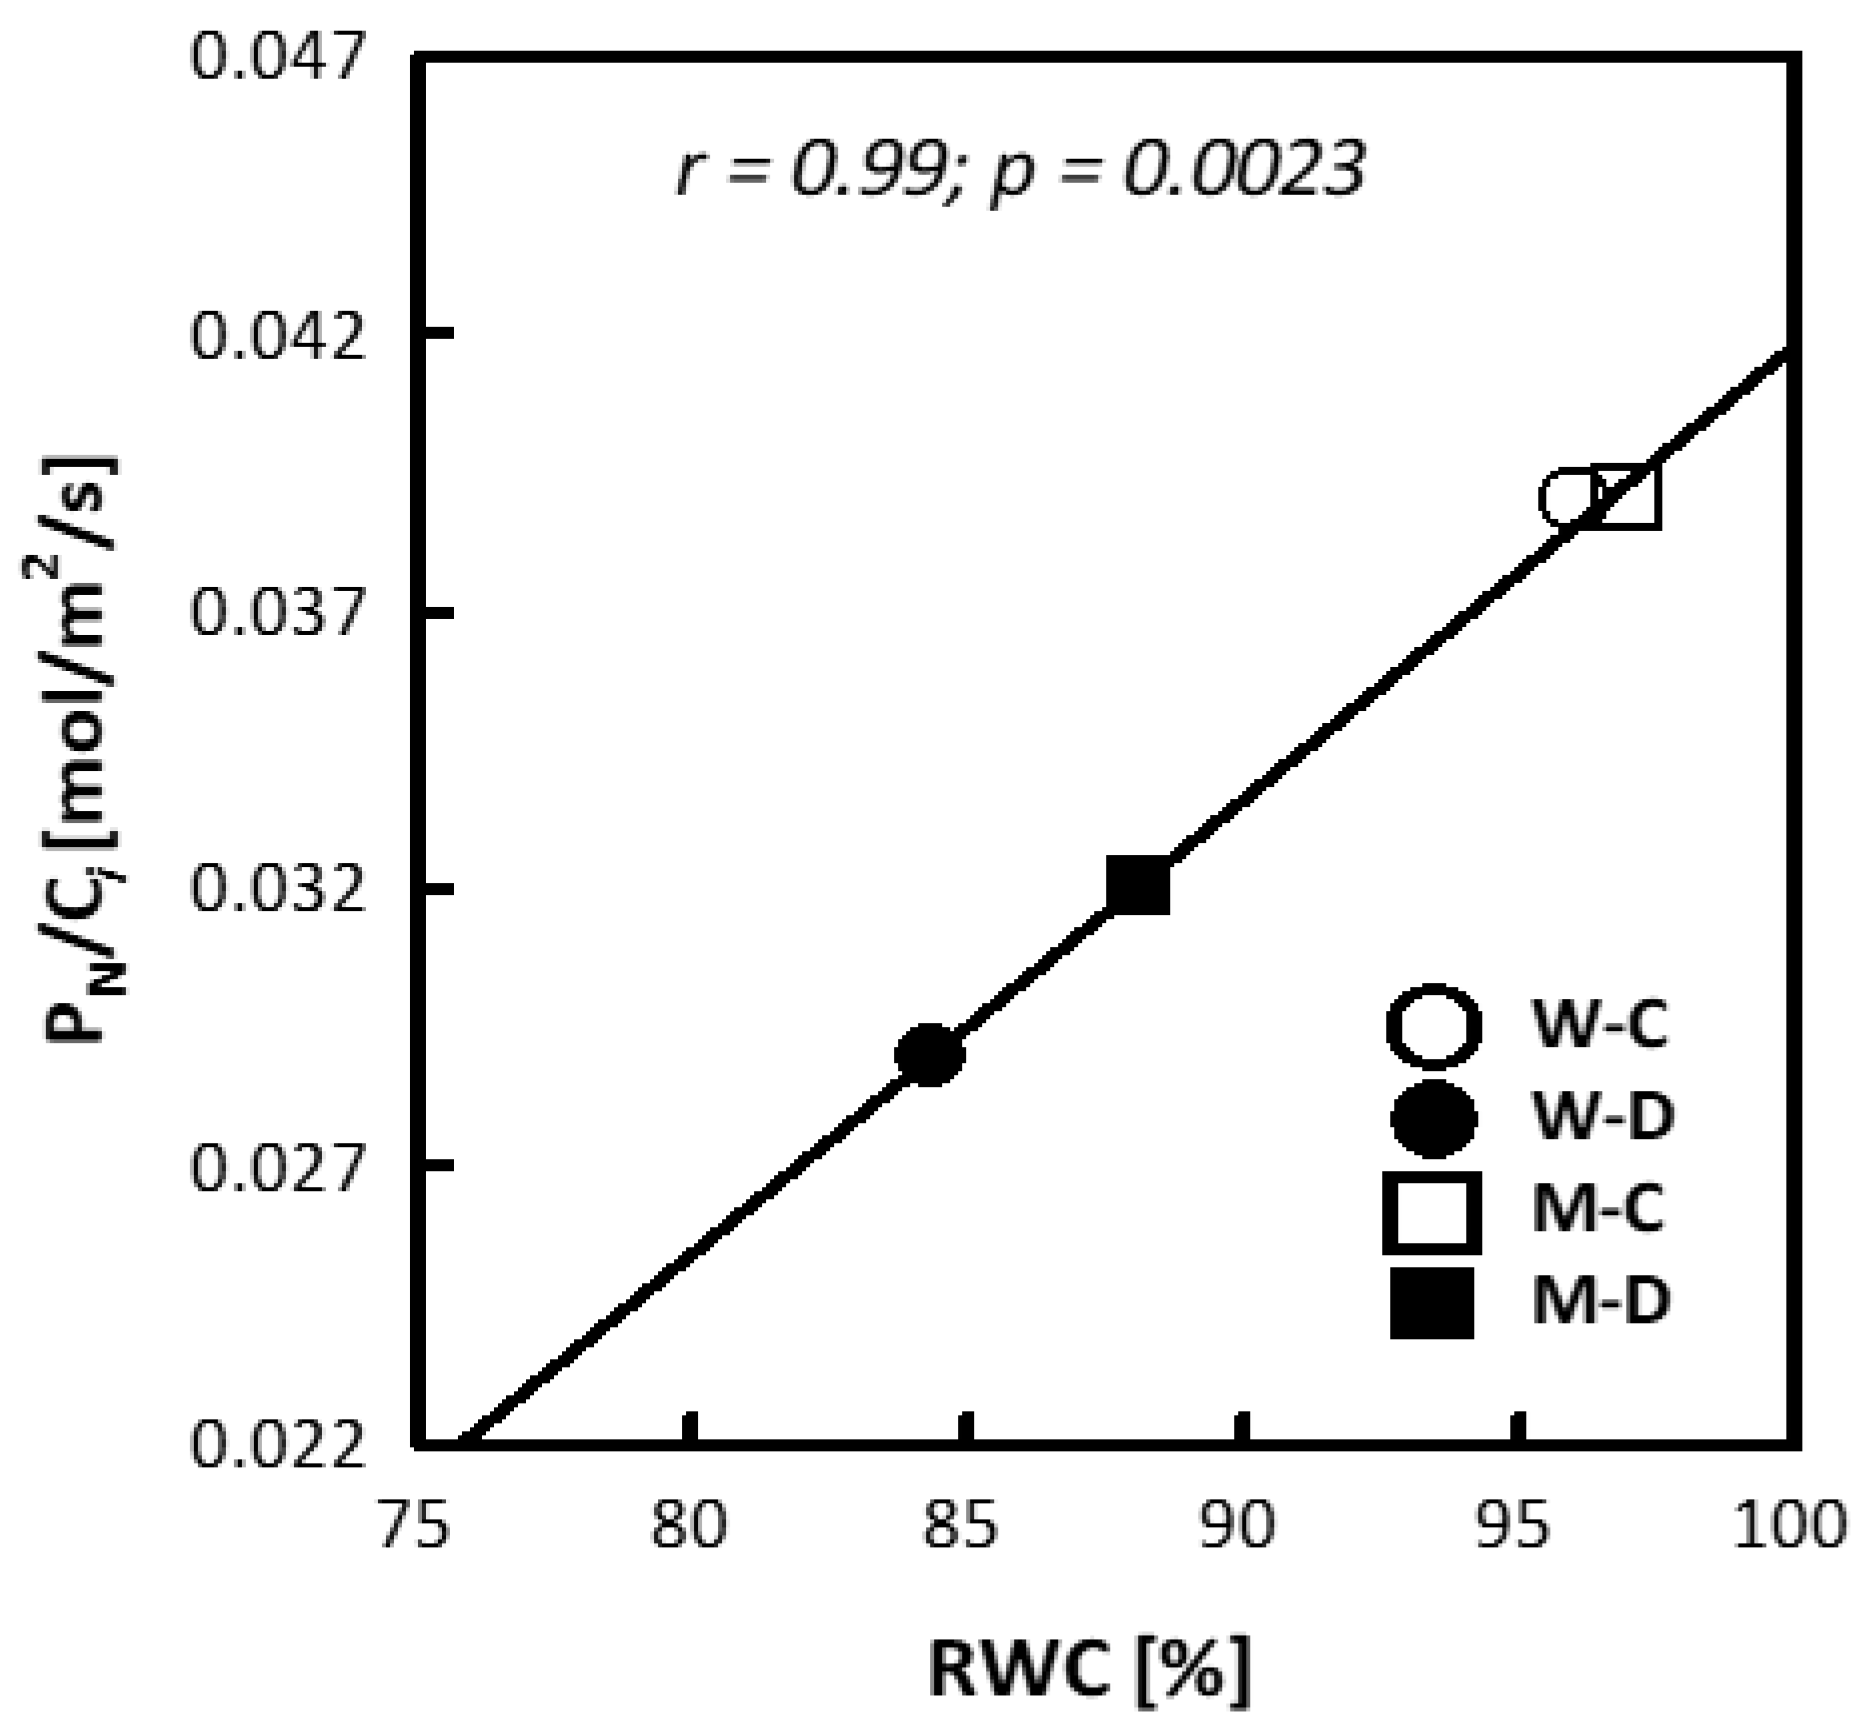
During drought, both wheat and maize experienced a significant decrease in net photosynthesis (PN), transpiration intensity (E), and stomatal conductance (gs) (Table 2). No major changes were found in the intercellular concentration of CO2 (Ci) or water use efficiency (WUE). Drought stress induced alterations in apparent carboxylation efficiency (PN/Ci) only in wheat (Table 2). However, a significant correlation between PN/Ci and RWC for both species was found (Figure 2).
A drought-induced drop in the photosynthetic activity of wheat and maize leaves was also reported in other studies [32,38]. In both species exposed to drought and experiencing reduced photosynthetic activity, the water use efficiency was maintained at the control level, which may be associated with the partial closure of stomata and limited transpiration. It has been shown that WUE may differ depending not only between species, but also on the intensity of the drought [39].
Flooding caused a significant reduction in stomatal conductivity (gs) in wheat and a significant decrease in the intercellular concentration of carbon dioxide (Ci) in maize. The other parameters of gas exchange and WUE were similar in both species (Table 2). Stomatal closure under flooding stress has been already explained by negative hydraulic message and a negative ABA message from oxygen-deficient roots. Both effects result from limited water conductance into the roots and an inhibition of the oxygen-depending ABA biosynthetic pathway. The consequence of the negative hydraulic message was a loss of leaf turgor that induced stomata to close [40,41].
3.3. Photosynthetic Apparatus Activity and Chlorophyll Content
Changes in chlorophyll fluorescence parameters indicated a clear reduction in the activity of the photosynthetic apparatus in both species exposed to soil drought (Table 3). Out of 13 chlorophyll fluorescence parameters, 11 changed significantly in response to wheat leaf dehydration (except for ABS/CSm and ψo). In maize, the changes were significant for 12 parameters, except for the quantum yield of electron transport φEo (Table 3). Flooding resulted in significant alterations in all chlorophyll fluorescence parameters in maize (Table 3), and 10 parameters in wheat (except for ABS/CSm, ψo and φEo). The parameter that differentiated the species under both stresses was ETo/RC, as it significantly increased in stressed wheat but decreased in drought- and flooding-exposed maize.
Chlorophyll fluorescence measurements revealed substantial disturbances in the performance of the photosynthetic apparatus in stressed wheat and maize plants. The parameter is currently commonly used to compare intraspecific responses of the photosynthetic apparatus to environmental stresses and it serves as a quick and reliable tool for the selection of plants with improved tolerance to abiotic stresses [4,42,43].
Although chlorophyll fluorescence is often used to assess the condition of plants under stress, there are no studies using this interspecies comparison tool that were used in our research. Despite the many changes in the response of both species, we chose ETo/RC, ψo, φEo as the ones that differentiate the response of wheat and maize to both water stresses. In addition, under the stress of drought, the differentiating parameter was DIo/RC and under flooding conditions they were Fv/Fm and RC/CSm. We discarded all those parameters that differed under stress conditions, and also those that differed under control conditions, because they are due to interspecies differences. The ETo/RC parameter turned out to be the reason why it was possible to observe the specific response of the studied species in the stress condition (increase in wheat and decrease in maize). Environmental stresses, including drought and flooding, limit the photosynthetic metabolism of carbon and reduce the utilization of light-phase products (NADPH2, ATP), which is why some of the absorbed light energy may damage PSII [44,45]. Most changes in chlorophyll fluorescence parameters, especially those expressed per excited surface (CS) of the photosynthetic sample, corroborated those reported in other studies [3,4,46,47].
A specific response involving a significant spike in ETo/RC was observed in drought- and flooding-exposed wheat, while maize responded to the stresses with a drop in this parameter (Table 3). In drought-stressed leaves, the increase of ETo/RC may indicate that other sinks for electrons from PSII, such as photorespiration and/or Mehler peroxidase reactions, were sustaining the electron flow [48,49]. Another, more probable explanation for the ETo/RC spike under soil drought may be not so much increased energy supply to the reaction centers as the reduced number of the active reaction centers (RC/CSm) [50]. The drop in energy flow through thylakoid membranes accompanied by a reduction in RC/CSm observed in drought- and flooding-exposed maize was also reported by Golebiowska-Pikania, et al. [51]. PSII reaction centers are inactivated following the degradation of D1 protein [52]. This inhibits the electron transport per active reaction center (ETo/RC) and limits the probability of electron transport beyond QA (ψo). Overall, these effects disturb the transfer of the excitation energy, a parameter that is connected with the increase in non-photochemical dissipation energy (DIo/RC) and the reduction in the quantum yield of PSII photochemistry (Fv/Fm) (Table 3). Similar changes in the quantum yield of PSII photochemistry and energy dissipation under stress conditions were described in other studies [53,54,55]. Still, Antonkiewicz and Rapacz [56] claimed that Fv/Fm should not be treated as an indicator of damage to a photosynthetic apparatus but rather as a symptom of its adaptive changes under stress conditions.
A significant drop in Chl content was found only in flooding-exposed maize (Table 3). A decrease in this pigment levels during drought and flooding was probably another factor limiting the intensity of photosynthesis (Table 2) and the activity of the photosynthetic apparatus (Table 3). Apart from non-photochemical dissipation of energy (DIo/RC), lowering chlorophyll content may be a defense response that allows for limiting light absorption (lower values of ABS/CSm in drought- and flooding-exposed maize) and diminishing photoinhibition damage to the photosynthetic apparatus [46,57,58]. Plant responses in the form of chlorophyll content drop under drought and flooding was reported in other studies [3,33,47]. However, it has been shown that plants tolerant to flooding do not exhibit a decrease in chlorophyll content or that the decrease is smaller than in susceptible plants [29]. Despite the widespread use of chlorophyll content to assess plant responses to stress, our research indicates that it should not be used for interspecies comparisons, as these differences may be due to factors other than stress factors.
4. Conclusions
Our experimental system involving a 10-day long exposure of wheat and maize plants at three-leaf stage to drought or flooding allowed us to observe some specific responses to these stress factors. A specific response of wheat, both under drought and flooding, was the increase in ETo/RC reflecting electron transport flux per single reaction center in PSII. Additionally, the parameters differentiating the studied species only under stressful conditions were rendered. During a drought, these were EL, PN, ETo/RC, DIo/RC, ψo, φEo and during flooding conditions, these were gs, RC/CSm, ETo/RC, Fv/Fm, ψo, φEo. For most of these parameters, the direction of these changes between the control and stress plants is the same in both species, and the differences are due to the level of these differences. A specific response of maize during flooding was the increase in the level of stomatal conductance which was not observed in the second species.
Further studies with more advanced methodologies and measurements are necessary to prove the potential role of these findings. However, the experimental design presented here and the specific responses of wheat and maize to drought and flooding seem to be promising tools for assessing a large pool of plants for the selection of genotypes with an improved tolerance to both stress factors at early stages of growth. To this end, follow-up large-scale experiments with high number of genotypes, lines, or strains are needed.
Selected indicators of plant responses to drought and flooding in the future may help in a more complete characterization of the registered cultivars.
Author Contributions
Conceptualization, A.O.; Methodology, A.O. and T.H.; Software, T.H.; Validation, A.O. and T.H.; Formal Analysis, A.O. and T.H.; Investigation, A.O. and T.H.; Resources, A.O. and T.H.; Writing—Original Draft Preparation, A.O.; Writing—Review & Editing, A.O. and T.H.; Visualization, T.H.; Supervision, A.O. All authors have read and agreed to the published version of the manuscript.
Funding
This research received no external funding.
Institutional Review Board Statement
Not applicable.
Informed Consent Statement
Not applicable.
Data Availability Statement
Not applicable.
Conflicts of Interest
The authors declare no conflict of interest.
References
- Borowski, P.F. Nexus between water, energy, food and climate change as challenges facing the modern global, European and Polish economy. AIMS Geosci. 2020, 6, 397–421. [Google Scholar] [CrossRef]
- Eckstein, D.; Künzel, V.; Schäfer, L.; Winges, M. Global climate risk index 2020—Briefing Paper. Germanwatche. V Bonn. 2019. Available online: https://germanwatch.org/sites/default/files/20-2-01e%20Global%20Climate%20Risk%20Index%202020_15.pdf (accessed on 11 March 2022).
- Hura, T.; Tyrka, M.; Hura, K.; Ostrowska, A.; Dziurka, K. QTLs for cell wall-bound phenolics in relation to the photosynthetic apparatus activity and leaf water status under drought stress at different growth stages of triticale. Mol. Genet. Genom. 2017, 292, 415–433. [Google Scholar] [CrossRef]
- Ostrowska, A.; Biesaga-Koscielniak, J.; Grzesiak, M.T.; Hura, T. Physiological responses of spring wheat to 5-aminolevulinic acid under water stress applied at seedling stage. Cereal Res. Commun. 2019, 47, 32–41. [Google Scholar] [CrossRef] [Green Version]
- Hess, T.; Knox, J.; Holman, I.; Sutcliffe, C. Resilience of Primary Food Production to a Changing Climate: On-Farm Responses to Water-Related Risks. Water 2020, 12, 2155. [Google Scholar] [CrossRef]
- Li, Y.; Guan, K.; Schnitkey, G.D.; DeLucia, E.; Peng, B. Excessive rainfall leads to maize yield loss of a comparable magnitude to extreme drought in the United States. Glob. Change Biol. 2019, 25, 2325–2337. [Google Scholar] [CrossRef] [PubMed] [Green Version]
- Hura, T.; Hura, K.; Ostrowska, A.; Gadzinowska, J.; Fiust, A. Water stress-induced flag leaf senescence may be accelerated by rehydration. J. Plant Physiol. 2019, 236, 109–116. [Google Scholar] [CrossRef] [PubMed]
- Daryanto, S.; Wang, L.; Jacinthe, P.A. Global synthesis of drought effects on cereal, legume, tuber and root crops production: A review. Agric. Water Manag. 2017, 179, 18–33. [Google Scholar] [CrossRef] [Green Version]
- Ding, J.; Huang, Z.; Zhu, M.; Li, C.; Zhu, X.; Guo, W. Does cyclic water stress damage wheat yield more than a single stress? PLoS ONE 2018, 13, e0195535. [Google Scholar] [CrossRef] [Green Version]
- Soares, J.C.; Santos, C.S.; Carvalho, S.M.; Pintado, M.M.; Vasconcelos, M.W. Preserving the nutritional quality of crop plants under a changing climate: Importance and strategies. Plant Soil 2019, 443, 1–26. [Google Scholar] [CrossRef] [Green Version]
- Tadesse, W.; Sanchez-Garcia, M.; Assefa, S.G.; Amri, A.; Bishaw, Z.; Ogbonnaya, F.C.; Baum, M. Genetic gains in wheat breeding and its role in feeding the world. Crop. Breed. Genet. Genom. 2019, 1, e190005. [Google Scholar] [CrossRef] [Green Version]
- Jat, M.L.; Stirling, C.M.; Jat, H.S.; Tetarwal, J.P.; Jat, R.K.; Singh, R.; Lopez-Ridaura, S.; Shirsath, P.B. Soil processes and wheat cropping under emerging climate change scenarios in South Asia. Adv. Agron. 2018, 148, 111–171. [Google Scholar] [CrossRef]
- Djaman, K.; O’Neill, M.; Owen, C.K.; Smeal, D.; Koudahe, K.; West, M.; Allen, S.; Lombard, K.; Irmak, S. Crop evapotranspiration, irrigation water requirement and water productivity of maize from meteorological data under semiarid climate. Water 2018, 10, 405. [Google Scholar] [CrossRef] [Green Version]
- Durodola, O.S.; Mourad, K.A. Modelling maize yield and water requirements under different climate change scenarios. Climate 2020, 8, 127. [Google Scholar] [CrossRef]
- Barrs, H.D.; Weatherley, P.E. A re-examination of the relative turgidity techniques for estimating water deficits in leaves. Aust. J. Biol. Sci. 1962, 15, 413–428. [Google Scholar] [CrossRef] [Green Version]
- Srivastava, A.; Strasser, R.J. Constructive and destructive actions of light on the photosynthetic apparatus. J. Sci. Ind. Res. 1997, 56, 133–148. [Google Scholar]
- Lazar, D. Chlorophyll a fluorescence induction. Biochim. Biophys. Acta 1999, 1412, 1–28. [Google Scholar] [CrossRef] [Green Version]
- Strasser, R.J.; Srivastava, A.; Tsimilli-Michael, M. The fluorescence transient as a tool to characterize and screen photosynthetic samples. In Probing Photosynthesis: Mechanisms, Regulation and Adaptation; Yunus, M., Pathre, U., Mohanty, P., Eds.; Taylor and Francis: London, UK, 2000; pp. 445–483. [Google Scholar]
- Appenroth, K.J.; Stockel, J.; Srivastava, A.; Strasser, R.J. Multiple effects of chromate on the photosynthetic apparatus of Spirodelapolyrhiza as probed by OJIP chlorophyll a fluorescence measurements. Environ. Pollut. 2001, 115, 49–64. [Google Scholar] [CrossRef]
- Khalid, M.F.; Hussain, S.; Ahmad, S.; Ejaz, S.; Zakir, I.; Ali, M.A.; Ahmed, N.; Anjum, M.A. Impacts of abiotic stresses on growth and development of plants. In Plant Tolerance to Environmental Stress; CRC Press: Boca Raton, FL, USA, 2019; pp. 1–8. [Google Scholar]
- Masoumi, Z.; Haghighi, M.; Jalali, S.A.H. Flooding or drought which one is more offensive on pepper physiology and growth? Mol. Biol. Rep. 2021, 48, 4233–4245. [Google Scholar] [CrossRef]
- Feng, Z.; Ding, C.; Li, W.; Wang, D.; Cui, D. Applications of metabolomics in the research of soybean plant under abiotic stress. Food Chem. 2020, 310, 125914. [Google Scholar] [CrossRef]
- Baye, A.; Berihun, B.; Bantayehu, M.; Derebe, B. Genotypic and phenotypic correlation and path coefficient analysis for yield and yield-related traits in advanced bread wheat (Triticum aestivum L.) lines. Cogent Food Agric. 2020, 6, 1752603. [Google Scholar] [CrossRef]
- Zhao, W.; Liu, L.; Shen, Q.; Yang, J.; Han, X.; Tian, F.; Wu, J. Effects of water stress on photosynthesis, yield, and water use efficiency in winter wheat. Water 2020, 12, 2127. [Google Scholar] [CrossRef]
- Mutava, R.N.; Prince, K.S.J.; Syed, N.H.; Song, L.; Babu, V.; Chen, W.; Nguyen, H.T. Understanding abiotic stress tolerance mechanisms in soybean: A comparative evaluation of soybean response to drought and flooding stress. Plant Physiol. Biochem. 2015, 86, 109–120. [Google Scholar] [CrossRef] [PubMed]
- Hsiao, T.C. Plant responses to water stress. Annu. Rev. Plant Physiol. Plant Mol. Biol. 1973, 24, 519–570. [Google Scholar] [CrossRef]
- Karimpour, M. Effect of drought stress on RWC and chlorophyll content on wheat (Triticum durum L.) genotypes. World. Ess. J. 2019, 7, 52–56. [Google Scholar]
- Azizi, S.; Tabari, M.; Striker, G.G. Growth, physiology, and leaf ion concentration responses to long-term flooding with fresh or saline water of Populus euphratica. S. Afr. J. Bot. 2017, 108, 229–236. [Google Scholar] [CrossRef]
- Garcia-Sanchez, F.; Syvertsen, J.P.; Gimeno, V.; Botia, P.; Perez-Perez, J.G. Responses to flooding and drought stress by two citrus rootstock seedlings with different water-use efficiency. Physiol. Plant. 2007, 130, 532–542. [Google Scholar] [CrossRef]
- Zhang, R.; Zhou, Y.; Yue, Z.; Chen, X.; Cao, X.; Ai, X.; Jiang, B.; Xing, Y. The leaf-air temperature difference reflects the variation in water status and photosynthesis of sorghum under waterlogged conditions. PLoS ONE 2005, 14, e0219209. [Google Scholar] [CrossRef] [Green Version]
- Sathi, K.S.; Masud, A.A.C.; Falguni, M.R.; Ahmed, N.; Rahman, K.; Hasanuzzaman, M. Screening of soybean genotypes for waterlogging stress tolerance and understanding the physiological mechanisms. Adv. Agric. 2022, 2022, 5544665. [Google Scholar] [CrossRef]
- Grzesiak, M.T.; Janowiak, F.; Szczyrek, P.; Kaczanowska, K.; Ostrowska, A.; Rut, G.; Hura, T.; Rzepka, A.; Grzesiak, S. Impact of soil compaction stress combined with drought or waterlogging on physiological and biochemical markers in two maize hybrids. Acta Physiol. Plant 2016, 38, 109. [Google Scholar] [CrossRef] [Green Version]
- Lama, R.; Jaishee, N.; Chakraborty, U.; Roy, A. Responses of seven maize genotypes during flooding stress and identification of cultivars most tolerant to flooding conditions. Plant Arch. 2020, 20, 3244–3249. [Google Scholar]
- Tian, L.; Bi, W.; Liu, X.; Sun, L.; Li, J. Effects of waterlogging stress on the physiological response and grain-filling characteristics of spring maize (Zea mays L.) under field conditions. Acta Physiol. Plant. 2019, 41, 1–14. [Google Scholar] [CrossRef]
- Xiong, R.; Sang, L.; Liu, R.; Cheng, R.; Li, P.; Huang, L.; Cao, G. Effects of waterlogging on maize seedling growth during seed germination. In IOP Conference Series: Earth and Environmental Science; IOP Publishing: Bristol, UK, 2020; Volume 598, p. 012075. [Google Scholar]
- Paradiso, A.; Caretto, S.; Leone, A.; Bove, A.; Nisi, R.; De Gara, L. ROS production and scavenging under anoxia and re-oxygenation in Arabidopsis cells: A balance between redox signalling and impairment. Front. Plant Sci. 2016, 7, 1803. [Google Scholar] [CrossRef] [PubMed] [Green Version]
- Perdomo, J.A.; Capo-Bauca, S.; Carmo-Silva, E.; Galmes, J. Rubisco and Rubisco activase play an important role in the biochemical limitations of photosynthesis in rice, wheat, and maize under high temperature and water deficit. Front. Plant Sci. 2017, 8, 490. [Google Scholar] [CrossRef] [Green Version]
- Todorova, D.; Aleksandrov, V.; Anev, S.; Sergiev, I. Photosynthesis alterations in wheat plants induced by herbicide, soil drought or flooding. Agronomy 2022, 12, 390. [Google Scholar] [CrossRef]
- Zhang, J.; Jiang, H.; Song, X.; Jin, J.; Zhang, X. The responses of plant leaf CO2/H2O exchange and water use efficiency to drought: A meta-analysis. Sustainability 2018, 10, 551. [Google Scholar] [CrossRef] [Green Version]
- Else, M.A.; Coupland, D.; Dutton, L.; Jackson, M.B. Decreased root hydraulic conductivity reduces leaf water potential, initiates stomatal closure and slows leaf expansion in flooded plants of castor oil (Ricinus communis) despite diminished delivery of ABA from the roots to shoots in xylem sap. Physiol. Plant. 2001, 111, 46–54. [Google Scholar] [CrossRef]
- Tong, C.; Hill, C.B.; Zhou, G.; Zhang, X.Q.; Jia, Y.; Li, C. Opportunities for improving waterlogging tolerance in cereal crops—physiological traits and genetic mechanisms. Plants 2021, 10, 1560. [Google Scholar] [CrossRef]
- Bussotti, F.; Gerosa, G.; Digrado, A.; Pollastrini, M. Selection of chlorophyll fluorescence parameters as indicators of photosynthetic efficiency in large scale plant ecological studies. Ecol. Indic. 2020, 108, 105686. [Google Scholar] [CrossRef]
- Kalaji, H.M.; Rastogi, A.; Živčák, M.; Brestic, M.; Daszkowska-Golec, A.; Sitko, K.; Alsharafa, K.Y.; Lotfi, R.; Stypiński, P.; Samborska, I.A.; et al. Prompt chlorophyll fluorescence as a tool for crop phenotyping: An example of barley landraces exposed to various abiotic stress factors. Photosynthetica 2018, 56, 953–961. [Google Scholar] [CrossRef] [Green Version]
- Yin, C.Y.; Berninger, F.; Li, C.Y. Photosynthetic responses of Populus przewalski subjected to drought stress. Photosynthetica 2006, 44, 62–68. [Google Scholar] [CrossRef]
- Gadzinowska, J.; Ostrowska, A.; Hura, K.; Dziurka, M.; Pawlowska, B.; Hura, T. Physiological traits determining high adaptation potential of sweet briar (Rosa rubiginosa L.) at early stage of growth to dry lands. Sci. Rep. 2019, 9, 19390. [Google Scholar] [CrossRef] [PubMed] [Green Version]
- Hura, T.; Hura, K.; Ostrowska, A.; Dziurka, K. Rapid plant rehydration initiates permanent and adverse changes in the photosynthetic apparatus of triticale. Plant Soil 2015, 397, 127–145. [Google Scholar] [CrossRef] [Green Version]
- Biehler, K.; Fock, H. Evidence for the contribution of the Mehler-peroxidase reaction in dissipating excess electrons in drought-stressed wheat. Plant Physiol. 1996, 112, 265–272. [Google Scholar] [CrossRef] [Green Version]
- Foyer, C.H.; Noctor, G. Oxygen processing in photosynthesis: Regulation and signalling. New Phytol. 2000, 146, 359–388. [Google Scholar] [CrossRef] [Green Version]
- Fghire, R.; Anaya, F.; Ali, O.I.; Benlhabib, O.; Ragab, R.; Wahbi, S. Physiological and photosynthetic response of quinoa to drought stress. Chil. J. Agric. Res. 2015, 75, 174–183. [Google Scholar] [CrossRef] [Green Version]
- Golebiowska-Pikania, G.; Kopec, P.; Surowka, E.; Janowiak, F.; Krzewska, M.; Dubas, E.; Nowicka, A.; Kasprzyk, J.; Ostrowska, A.; Malaga, S.; et al. Changes in protein abundance and activity induced by drought during generative development of winter barley (Hordeum vulgare L.). J. Proteom. 2017, 169, 73–86. [Google Scholar] [CrossRef]
- Liu, M.; Li, J.; Niu, J.; Wang, R.; Song, J.; Lv, J.; Zong, X.; Wang, S. Interaction of drought and 5-aminolevulinic acid on growth and drought resistance of Leymuschinensis seedlings. Acta Ecol. Sin. 2016, 36, 180–188. [Google Scholar] [CrossRef]
- Dernetriou, G.; Neonaki, C.; Navakoudis, E.; Kotzabasis, K. Salt stress impact on the molecular structure and function of the photosynthetic apparatus: The protective role of polyamines. Biochim. Biophys. Acta 2007, 1767, 272–280. [Google Scholar] [CrossRef] [Green Version]
- Kalaji, H.M.; Govindjee; Bosa, K.; Koscielniak, J.; Zuk-Golaszewska, K. Effects of salt stress on photosystem II efficiency and CO2 assimilation of two Syrian barley landraces. Environ. Exp. Bot. 2011, 73, 64–72. [Google Scholar] [CrossRef]
- Lu, C.; Vonshak, A. Effects of salinity stress on photosystem II function in cyanobacterial Spirulina platensis cells. Physiol. Plant. 2002, 114, 405–413. [Google Scholar] [CrossRef] [Green Version]
- Antonkiewicz, J.; Rapacz, M. Assessment of photosynthetic activity of plants grown on stubble sediments and furnaceash. Zesz. Probl. Post. NaukRol. 2006, 509, 187–196. (In Polish) [Google Scholar]
- Kudoh, H.; Sonoike, K. Irreversible damage to photosystem I by chilling in the light: Cause of the degradation of chlorophyll after returning to normal growth temperature. Planta 2002, 215, 541–548. [Google Scholar] [CrossRef] [PubMed]
- Lu, C.M.; Zhang, J.H. Photosynthetic CO2 assimilation, chlorophyll fluorescence and photoinhibition as affected by nitrogen deficiency in maize plants. Plant Sci. 2000, 151, 135–143. [Google Scholar] [CrossRef]
- Park, S.U.; Lee, C.J.; Kim, S.E.; Lim, Y.H.; Lee, H.U.; Nam, S.S.; Kim, H.S.; Kwak, S.S. Selection of flooding stress tolerant sweetpotato cultivars based on biochemical and phenotypic characterization. Plant Physiol. Biochem. 2020, 155, 243–251. [Google Scholar] [CrossRef]
Figure 1.
Correlation between electrolyte leakage (EL) and the probability (at t = 0) of electron transport beyond plastoquinone QA (ψo) (A), and the amount of energy used for the electron transport (ETo/CSm) (B) for wheat (W) and maize (M) under control (C) and flooding (F) conditions. Correlation between measured parameters was tested at a probability of p < 0.05.

Figure 2.
Correlation between apparent carboxylation efficiency (PN/Ci) and relative water content (RWC) for wheat (W) and maize (M) under control (C) and drought (D) conditions. The correlation between the measured parameters was tested at a probability of p < 0.05.
Figure 2.
Correlation between apparent carboxylation efficiency (PN/Ci) and relative water content (RWC) for wheat (W) and maize (M) under control (C) and drought (D) conditions. The correlation between the measured parameters was tested at a probability of p < 0.05.


Table 1.
Effects of 10-day drought and root flooding on plant height [cm] (n = 20), relative water content (RWC) [%] (n = 7) and electrolyte leakage (EL) [%] (n = 6) of wheat and maize leaves. Means indicated with the same letters within drought or flooding treatment for each parameter are not significantly different at p < 0.05. The grey areas point to differences between species within each parameter under stress conditions with no differences under control conditions.
| Parameter | Treatment | Drought | Flooding | ||
|---|---|---|---|---|---|
| Wheat | Maize | Wheat | Maize | ||
| Plant height | Control | 46.9 ± 0.90 bc | 64.1 ± 1.63 a | 46.9 ±0.90 c | 64.1 ± 1.63 a |
| Stress | 43.6 ± 0.85 c | 49.3 ± 1.66 b | 44.5 ± 0.85 c | 59.0 ± 1.78 b | |
| RWC | Control | 96.0 ± 1.11 a | 97.0 ± 1.09 a | 96.0 ± 1.11 a | 97.0 ± 1.09 a |
| Stress | 84.3 ± 2.09 b | 88.1 ± 1.41 b | 90.7 ± 2.08 b | 90.9 ± 1.15 b | |
| EL | Control | 6.2 ± 0.28 c | 8.7 ± 0.45 bc | 6.2 ± 0.28 c | 8.7 ± 0.45 b |
| Stress | 9.0 ± 0.38 b | 11.6 ± 1.68 a | 6.6 ± 0.54 bc | 35.4 ± 1.46 a | |
Table 2.
Effects of 10-day drought and flooding of roots on leaf gas exchange (n = 7) in wheat and maize. PN—net photosynthesis intensity (µmol(CO2) m−2 s−1), E—transpiration intensity (mmol(H2O) m−2 s−1), gs—stomatal conductance [mol(H2O) m−2 s−1], Ci—intracellular concentration of CO2—(µmol(CO2) mol(air)−1), WUE—photosynthetic ratio of water use (µmol(CO2)mmol−1(H2O)), PN/Ci—apparent carboxylation efficiency (mol(air) m−2 s−1). Means indicated with the same letters within drought or flooding treatment, for each parameter are not significantly different at p < 0.05. The grey areas point to differences between species within each parameter under stress conditions with no differences under control conditions.
| Parameters | Treatments | Drought | Flooding | ||
|---|---|---|---|---|---|
| Wheat | Maize | Wheat | Maize | ||
| PN | Control | 14.25 ± 2.09 ab | 17.85 ± 1.58 a | 14.25 ± 2.09 b | 17.85 ± 1.58 a |
| Stress | 10.47 ± 1.79 c | 12.64 ± 1.20 b | 13.46 ± 1.91 b | 16.59 ± 1.85 a | |
| E | Control | 4.95 ± 0.75 b | 5.67 ± 0.83 a | 4.95 ± 0.75 ab | 5.67 ± 0.83 a |
| Stress | 3.17 ± 0.43 c | 3.12 ± 0.54 c | 4.34 ± 0.28 b | 4.93 ± 0.40 ab | |
| gs | Control | 0.046 ± 0.0036 b | 0.064 ± 0.0042 a | 0.046 ± 0.0036 b | 0.064 ± 0.0042 ab |
| Stress | 0.025 ± 0.0045 c | 0.036 ± 0.0021 b | 0.039 ± 0.0021c | 0.075 ± 0.0062 a | |
| Ci | Control | 371.3 ± 23.12 bc | 468.3 ± 31.43 a | 371.3 ± 23.12 c | 468.3 ± 31.43 a |
| Stress | 369.2 ± 19.51 c | 406.3 ± 25.18 ab | 382.2 ± 31.65 c | 411.2 ± 27.78 b | |
| WUE | Control | 2.88 ± 0.47 b | 3.15 ± 0.27 ab | 2.88 ± 0.47 b | 3.15 ± 0.27 ab |
| Stress | 3.30 ± 0.39 ab | 4.05 ± 0.62 a | 3.10 ± 0.31 ab | 3.37 ± 0.19a | |
| PN/Ci | Control | 0.038 ± 0.0051 a | 0.039 ± 0.0047 a | 0.038 ± 0.0051 a | 0.039 ± 0.0047 a |
| Stress | 0.029 ± 0.0039 b | 0.032 ± 0.0035 ab | 0.036 ± 0.0029 a | 0.041 ± 0.0040 a | |
Table 3.
Effects of 10-day drought and flooding of wheat and maize roots on chlorophyll fluorescence parameters (n = 16) and chlorophyll content (n = 18). Means indicated with the same letters within drought or flooding treatment for each parameter are not significantly different at p < 0.05. The grey areas point to differences between species within each parameter under stress conditions and with no differences under control conditions.
| Parameters | Treatments | Drought | Flooding | ||
|---|---|---|---|---|---|
| Wheat | Maize | Wheat | Maize | ||
| ABS/CSm | Control | 2409 ± 61.3 a | 1945 ± 52.0 b | 2409 ± 61.3 a | 1945 ± 52.0 b |
| Stress | 2187 ± 116.9 a | 1481 ± 71.3 c | 2248 ± 68.5 a | 1426 ± 69.9 c | |
| TRo/CSm | Control | 1914 ± 52.9 a | 1553 ± 44.8 b | 1914 ± 52.9 a | 1553 ± 44.8 b |
| Stress | 1453 ± 85.4 b | 959 ± 72.7 c | 1606 ± 56.9 b | 940 ± 67.7 c | |
| ETo/CSm | Control | 857 ± 38.6 a | 731 ± 28.5 b | 857 ± 38.6 a | 731 ± 28.5 b |
| Stress | 619 ± 46.6 c | 304 ± 41.2 d | 729 ± 29.8 b | 310 ± 34.2 c | |
| DIo/CSm | Control | 496 ± 15.1 b | 393 ± 17.9 c | 496 ± 15.1 b | 393 ± 17.9 c |
| Stress | 734 ± 49.9 a | 522 ± 14.1 b | 642 ± 26.6 a | 487 ± 30.1 b | |
| RC/CSm | Control | 687 ± 27.0 a | 650 ± 17.4 a | 687 ± 27.0 a | 650± 17.4 a |
| Stress | 425 ± 29.9 b | 383 ± 23.9 b | 514 ± 25.4 b | 368 ± 27.7 c | |
| ABS/RC | Control | 3.54 ± 0.076 c | 3.00 ± 0.044 d | 3.54 ± 0.076 c | 3.00 ± 0.044 d |
| Stress | 5.30 ± 0.230 a | 3.92 ± 0.083 b | 4.45 ± 0.141 a | 3.98 ± 0.128 b | |
| TRo/RC | Control | 2.81 ± 0.047 b | 2.39 ± 0.035 c | 2.81 ± 0.047 b | 2.39 ± 0.035 d |
| Stress | 3.47 ± 0.076 a | 2.48 ± 0.052 c | 3.16 ± 0.059 a | 2.56 ± 0.055 c | |
| ETo/RC | Control | 1.24 ± 0.020 b | 1.12 ± 0.022 b | 1.24 ± 0.020 b | 1.12 ± 0.022 b |
| Stress | 1.47 ± 0.083 a | 0.79 ± 0.049 c | 1.45 ± 0.087 a | 0.78 ± 0.057 c | |
| DIo/RC | Control | 0.73 ± 0.030 c | 0.61 ± 0.011 c | 0.73 ± 0.030 b | 0.61 ± 0.011 b |
| Stress | 1.83 ± 0.158 a | 1.44 ± 0.105 b | 1.29 ± 0.088 a | 1.41 ± 0.143 a | |
| Fv/Fm | Control | 0.79 ± 0.005 a | 0.80 ± 0.002 a | 0.79 ± 0.005 a | 0.80 ± 0.002 a |
| Stress | 0.66 ± 0.016 b | 0.64 ± 0.020 b | 0.71 ± 0.010 b | 0.63 ± 0.024 c | |
| ψo | Control | 0.45 ± 0.012 ab | 0.47 ± 0.011 a | 0.45 ± 0.012 ab | 0.47 ± 0.011 a |
| Stress | 0.42 ± 0.019 b | 0.30 ± 0.018 c | 0.46 ± 0.021 a | 0.31 ± 0.025 b | |
| φEo | Control | 0.35 ± 0.010 a | 0.38 ± 0.009 a | 0.35 ± 0.010 ab | 0.38 ± 0.019 a |
| Stress | 0.28 ± 0.013 b | 0.20 ± 0.015 c | 0.32 ± 0.012 b | 0.20 ± 0.020 c | |
| PI | Control | 0.92 ± 0.083 b | 1.19 ± 0.062 a | 0.92 ± 0.083 b | 1.19 ± 0.062 a |
| Stress | 0.31 ± 0.040 c | 0.24 ± 0.039 c | 0.50 ± 0.039 c | 0.27 ± 0.055 d | |
| Chl | Control | 32.1 ± 0.37 bc | 38.0 ± 0.79 a | 32.1 ± 0.37 c | 38.0 ± 0.79 a |
| Stress | 31.1 ± 0.79 c | 34.2 ± 0.98 b | 30.3 ± 0.95 c | 35.4 ± 0.32 b | |
Publisher’s Note: MDPI stays neutral with regard to jurisdictional claims in published maps and institutional affiliations. |
© 2022 by the authors. Licensee MDPI, Basel, Switzerland. This article is an open access article distributed under the terms and conditions of the Creative Commons Attribution (CC BY) license (https://creativecommons.org/licenses/by/4.0/).
Share and Cite
MDPI and ACS Style
Ostrowska, A.; Hura, T. Physiological Comparison of Wheat and Maize Seedlings Responses to Water Stresses. Sustainability 2022, 14, 7932. https://0-doi-org.brum.beds.ac.uk/10.3390/su14137932
AMA Style
Ostrowska A, Hura T. Physiological Comparison of Wheat and Maize Seedlings Responses to Water Stresses. Sustainability. 2022; 14(13):7932. https://0-doi-org.brum.beds.ac.uk/10.3390/su14137932
Chicago/Turabian StyleOstrowska, Agnieszka, and Tomasz Hura. 2022. "Physiological Comparison of Wheat and Maize Seedlings Responses to Water Stresses" Sustainability 14, no. 13: 7932. https://0-doi-org.brum.beds.ac.uk/10.3390/su14137932
Note that from the first issue of 2016, this journal uses article numbers instead of page numbers. See further details here.