
Clustering Analysis of the Spatio-Temporal On-Street Parking Occupancy Data: A Case Study in Hong Kong


1
Department of Civil and Environmental Engineering, The Hong Kong Polytechnic University, Hong Kong, China
2
Research Institute for Sustainable Urban Development, The Hong Kong Polytechnic University, Hong Kong, China
*
Author to whom correspondence should be addressed.
Sustainability 2022, 14(13), 7957; https://0-doi-org.brum.beds.ac.uk/10.3390/su14137957
Submission received: 30 May 2022
/
Revised: 19 June 2022
/
Accepted: 21 June 2022
/
Published: 29 June 2022
(This article belongs to the Special Issue Smart Cities—the Role of Transportation, Artificial Intelligence, and Big Data)
Abstract
:Parking plays an essential role in urban mobility systems across the globe, especially in metropolises. Hong Kong is a global financial center, international shipping hub, fast-growing tourism city, and major aviation hub, and it thus has a high demand for parking. As one of the initiatives for smart city development, the Hong Kong government has already taken action to install new on-street parking meters and release real-time parking occupancy information to the public. The data have been released for months, yet, to the best of our knowledge, there has been no study analyzing the data and identifying their unique characteristics for Hong Kong. In view of this, we examined the spatio-temporal patterns of on-street parking in Hong Kong using the data from the new meters. We integrate the t-SNE and k-means methods to simultaneously visualize and cluster the parking occupancy data. We found that the average on-street parking occupancy in Hong Kong is over 80% throughout the day, and three parking patterns are consistently identified by direct data visualization and clustering results. Additionally, the parking patterns in Hong Kong can be explained using land-use factors. Overall, this study can help the government better understand the unique characteristics of on-street parking and develop smart management strategies for Hong Kong.
1. Introduction
Hong Kong, as one of the busiest cities in the world, accommodates numerous vehicles on the roads every day. The transportation system plays an important role in relieving the traffic pressure and improving the system’s efficiency. On-street parking is regarded as one of the major issues on urban roads. In the past, the shortage of affordable parking made it challenging for drivers to find satisfactory parking spaces. Now, drivers struggle to find any parking spots. More importantly, on-street parking contributes to traffic congestion due to cruising behaviors. To reduce congestion and facilitate public access, the Hong Kong government has started building new parking meters with real-time vacancy sensors. Based on the sensor, spatio-temporal parking vacancy data can be obtained. These data facilitate our analysis of the on-street parking patterns in Hong Kong.
This section presents the background of the study, reviews the congestion and parking issues in cities, introduces on-street parking, and makes a comparison with other studies.
1.1. On-Street Parking Issues
Parking, as one of the major contributors to urban congestion, brings great challenges to public agencies [1,2,3,4,5,6]. A study by Axhausen et al. [7] points out that the time spent cruising for parking can account for 40% of total travel time. A parking cruise occurs when there are insufficient parking spaces available in a given area. The crowded cruising motorcades move at a creeping pace and, consequently, vehicles driving at normal speeds have to slow down, and thus cause more delays [1,2]. In the past, a driver would cruise to find a free or cheap parking space [8], whereas nowadays, drivers cruise to find any available parking spots. Therefore, it is important to understand the occupancy patterns of parking spots.
In Hong Kong, parking started to attract public attention several decades ago. Thus, a series of road parking regulations [9] were initiated, including general restrictions on parking, parking meters, car parks, and disabled parking permits. Scholars [10,11,12] have also analyzed the historical parking patterns in Hong Kong. The passing of the years has witnessed changes in the supply and demand for parking in Hong Kong. In September 2003, the parking system in Hong Kong served a total of 522,700 licensed vehicles, with 338,187 (64.7%) private cars [13]. In October 2021, the total number of licensed vehicles was 813,607, of which 578,683 (71.1%) were private cars [14]. In recent years, the rapidly increasing demand for parking has pushed the parking system in Hong Kong to the limit.
The occupancy patterns of the parking spots are largely affected by drivers’ parking behaviors. Some drivers prefer a free or cheap parking spot, even though that demands more cruising time and costs more. An experiment conducted by Chaniotakis and Pel [15] examined the parking choices made by drivers staying for two to three hours in a shopping area with uncertain parking conditions. They found that drivers tended to look for parking spaces when they arrived at or near their destination. According to another study, drivers have a habitual behavior of selecting the same parking space when their destination is a business area [16]. Yang and Qian [17] also examined the on-street parking and parking payment behaviors in two zones within San Francisco’s Parking System (SFPark). Overall, modeling the parking occupancy pattern is also the key to understanding drivers’ parking behaviors.
Parking at different times of the day also contributes to different parking patterns. Arnott, de Palma, and Lindsey [6] incorporated both the spatial aspects of parking and the peak time for travel demand and proposed that an idealistic time-varying toll could eliminate the cruising queues. Based on home-based working travel, Zhang et al. [18] studied the morning–evening commuting patterns and their different pricing regimes to manage traffic, including time-varying road tolls and a location-dependent parking fee regimen. In addition, with the development of some advanced technologies in autonomous vehicles, Zhang et al. [19] studied the morning and evening parking patterns for autonomous vehicles in the future.
On-street parking spots are mainly used for short-term parking. Generally, on-street parking is closer to the final destination as it is distributed everywhere in a city, while the locations of off-street parking are more fixed, and drivers may need to park further away from, and walk to, their final destination. Moreover, an off-street parking lot is generally a more stable location as it is usually rented on a monthly basis [3]. By contrast, on-street parking is largely affected by stochastic parking demands, especially due to non-recurrent events (e.g., concerts and sports events). In this paper, we focus on on-street parking, as it is more stochastic and better reflects the parking dynamics in a city.
On-street parking patterns have been studied by many scholars [1,4,8,20,21]. In a symmetrical spatial city that is homogeneous, in terms of parking spatially and temporally, Arnott and Rowse [22] developed a bottleneck model. Instead of assuming that parking spaces are uniformly distributed, Levy et al. [23] considered the spatial impacts of on-street parking and concluded that drivers should consider cruising time if the average occupied percentage of the parking spaces is above 85%. Additionally, Arnott [4] examined the optimal parking occupancy rate for maximizing the social surplus in terms of time and place. Millard-Ball, Weinberger, and Hampshire [20] pointed out that there is no linear relationship between average occupancy and the probability of finding an available parking space, and that this relationship also varies depending on the time of day.
To better manage the on-street parking, pricing is proved to be an efficient approach. The first paper to consider parking issues from an economic perspective comes from Arnott and Inci [2]. Through conducting a series of parking experiments, Gu et al. [24] found that occupancy information can mitigate aggregate cruising delays and a suitable price strategy can assist in vehicle management. Zheng and Geroliminis [25] developed an aggregated macroscopic method in a multimodal system with parking limitations and cruise for park flow, and they further examined the dynamic pricing adjustment policy. Based on the macroscopic fundamental diagram, an analytical network-level dynamic model of parking cruising that could be integrated into a real-time traffic management framework was approached by Geroliminis [26]. Overall, current management strategies require precise knowledge regarding on-street parking patterns, while related studies are still lacking, especially in Hong Kong.
1.2. Smart Parking Systems in Hong Kong
In 2017, the Hong Kong government proposed the Smart City Blueprint [27,28,29], which envisions a safe, informative, green, mobile, and accessible transport system with a smart parking system included. Based on the outline of the Smart City Blueprint, more and more transportation companies are sharing their real-time data with the public. This allows travelers to choose convenient traffic methods, and the government can also better operate and manage the traffic. Smart parking as a sub-sector of smart mobility promotes the efficiency of the parking system in Hong Kong. Studies have shown that providing real-time parking information to drivers can reduce parking congestion, and Cao and Menendez [30] also found that 17% of cruising time can be saved on workdays with smart parking services.
To better monitor on-street parking patterns, parking meters have gone through many versions of updates over the years in Hong Kong. In 1999, two types of parking meters [31], the electronic parking meter (EPM) and the pay-and-display machine (PDM), were installed. However, PDM is not convenient for the public who must wait in a queue and the owners who must pour labor into coin collection. During that period, the Octopus card (a multi-functional value-added card widely used in Hong Kong) had not yet been popular. By contrast, e-park cards and coins were the main methods to pay for on-street parking. After the popularization of the Octopus card, the old PDM and EPM were replaced by Octopus card-only meters in 2003/2004 [32]. This type of parking meter can record its transactions by a portable data retrieval device and staff members can collect the parking data regularly.
In 2021/2022, as the Octopus-based parking meters have been in service for almost 20 years, new parking meters have been set up to satisfy the public demand for short-term on-street parking spaces [32]. The installation of new parking meters commenced on 20 January 2021, and a total of 12,000 new parking meters are expected to be put into service [33]. Compared to the previous parking meters, the new parking meters boast a set of improvements. The new parking meter (Figure 1a,b) uses millimeter-wave radar to simultaneously detect the occupancy of two parking spaces (one on the right and one on the left) and it offers real-time information to the public [32]. To promote smart parking, a multi-platform application called “HKeMeter” was developed, which facilitates drivers to purchase parking time, extend parking time, find available parking meters, and navigate to parking destinations [34]. In addition, both remote payments and on-site payments are accepted. For example, value-added cards, QR code payment methods, and the Faster Payment System (FPS) are now available for payment. In terms of operating hours, most parking meters are operated between 8:00 and 20:00 or 8:00 and 24:00 from Monday to Saturday, and between 8:00 and 20:00 or 10:00 and 22:00 on Sundays and holidays. The rest of the time is free of charge. Regardless of whether the parking fees are paid or not, the sensor on the new meter can always detect if the parking lots are occupied or not.
Many other cities also have applied emerging technology in smart parking, such as San Francisco Park and Los Angeles Park. A study by Lin et al. [35] provided a comprehensive introduction to smart parking around the globe, which consists of various networked sensors, intelligent parking service systems, and how to spread information. As for parking sensors detectives, they include inductive loops, cameras, infrared sensors, ultrasonic sensors, optical sensors, magnetometers, acoustic sensors, piezoelectric sensors, and radio frequency identification (RFID). All types of parking meters can collect considerable parking data for analysis.
The on-street meter-level parking data are meaningful and essential to understand the smart parking system. Since parking meters are widely distributed throughout the city, we can analyze parking patterns throughout every district, and even on every street. As Millard-Ball, Weinberger, and Hampshire [20] have found, an average percentage of occupied parking spaces in an area ignores a driver’s actual situation in a particular street or block; however, precise occupancy conditions within a block can provide a more accurate picture of parking. Compared with the data that are collected in an aggregate manner, the meter-level data allow researchers to be more flexible in how they analyze datasets, as such data can not only be analyzed at any given time point, but also be aggregated to the appropriate timescale for systematic analysis.
1.3. Data-Driven Clustering Methods
Data mining methods have been adopted to analyze the spatio-temporal on-street parking patterns around the globe. Yang and Qian [17] researched the estimation of on-street occupancy within the SFPark system by time using transaction data in two areas. Some papers use parking data from surveys [36], video [37], GPS traces [38], and transaction data [17,39], while this project uses collected real-time sensor data directly. Parking demand in Hong Kong has been thoroughly studied [10,12], but those data are based on previous parking patterns, and the collected data come from manual calculations and survey data. Therefore, associated with new technology and real-time data, the results of this project can be more accurate than before, when the data had to be collected and aggregated at a specific time. Compared with real-time data, survey data may result in some estimated errors during the estimation of the specific data and observation limitations in data collection. Since on-street parking data from Hong Kong have not been studied, this study will also be a relatively instant evaluation of the new parking meters.
In particular, the clustering method is a common method to analyze various traffic patterns. In view of parking, methods including Gaussian mixture, k-means, DBSCAN, and so on are applied in understanding the spatial and temporal correlations within the data. Using the Gaussian mixture model (GMM), Fiez and Ratliff [40] studied the parking patterns of the Belltown neighborhood in Seattle. The study from Gomari et al. [41] used parking events to model the parking behaviors in Munich. Different clustering methods can be applied to the smart parking data, and a comparative analysis is conducted by Piovesan et al. [42]. By contrast, this study focuses on new parking meter data in Hong Kong, rarely studied in the existing literature.
The dimension reduction methods are oftentimes coupled with the clustering methods to demonstrate a better visualization of clustering results. Dimension reduction methods aim to project high-dimension datasets into low-dimension datasets, which facilitate the visualization of big traffic data on 2D or 3D figures. For example, the t-SNE method achieves great performance in dimension reduction for various applications, such as traffic speed [43], geographical location data [44], traffic flow [45,46], and driving behaviors [47]. It would be interesting to investigate the use of t-SNE in parking data analysis.
1.4. Contributions
We examine here the spatio-temporal patterns of on-street parking in Hong Kong using the data from on-street parking meters. Variation in the patterns of on-street parking depends on the time of day and the location of parking meters. The 18 districts in Hong Kong are studied in this work and the on-street parking patterns are represented by occupancy rates. We integrate the two unsupervised learning methods, t-SNE and k-means, to simultaneously visualize and cluster the spatio-temporal parking occupancy data and present interesting findings for policy implications in Hong Kong. The contributions of this paper are summarized as follows:
- To the best of our knowledge, this is the first study to utilize the new parking meter data and analyze the spatio-temporal patterns of the on-street parking occupancy data in Hong Kong.
- We integrate the t-SNE and k-means methods to simultaneously visualize and cluster on-street parking occupancy data.
- We study the three regions and 18 districts in Hong Kong and find that a large portion of parking lots are fully occupied throughout the day, and three different on-street parking patterns are identified for different districts.
The remainder of this paper is structured as follows: a description of on-street parking occupancy data is presented in Section 2; the developed method is presented in Section 3; and the analysis of the parking data in Hong Kong is presented in Section 4; policy implications are discussed in Section 5; and finally, conclusions are drawn in Section 6.
2. Data Description
In this section, we describe and process the parking occupancy data in Hong Kong. We first present the raw data and then discuss how the data are imputed and aligned. Throughout this work, all data processing and modeling were conducted with Python 3.9 and QGIS 3.20.3.
2.1. Raw Data
We focused on the on-street parking data for July 2021 in Hong Kong. The data were obtained from DATA.GOV.HK (https://data.gov.hk/en/, accessed on 7 February 2022), which provides the real-time occupancy information of all the new parking meters, as shown in Table 1. These data are updated in real time and provide the parking meter ID, parking meter status, occupancy status, and the latest occupancy change time. The spatial distribution of the new parking meters is also provided in Table 2, which includes parking meters’ unique ID, located area, and the geographical coordinates. In this study, the meters’ occupancy information is collected every five minutes in CSV format.
2.2. Data Processing
As the parking data are collected every 5 min, we will have a total of 288 (288 = (24 h × 60 min/h)/5 min) data points per day. We use various data alignment techniques to correct the data. For example, in the raw dataset, some region information is replaced with district information, and some information has spelling errors. The district of “Sha Tin” is sometimes incorrectly spelled as “Sha Ting”. As a result, these errors should be automatically identified and then corrected manually.
The raw data contain missingness; hence, data imputation is needed. We first use the interpolation for the missing data of each meter if the nearby occupancy data are available. If the data missingness persists for a long period of a meter, we will drop this meter when calculating the occupancy rate.
The occupancy rate, which represents the percentage of occupied parking meters in a district, is presented in Equation (1). A conditional probability Pr is used to calculate the occupied parking meters percentage under the operation of parking meters.
To analyze the spatio-temporal patterns of on-street parking, we process the raw parking data for the whole territory of Hong Kong, including three regions (Hong Kong Island, Kowloon, and New Territories) and their 18 districts (e.g., Eastern, Kowloon City, and Islands). Based on the processed data, we calculate the occupancy rates for every five minutes each day in July 2021, including both weekdays and weekends, for further analysis.
3. Methodology
To understand different parking patterns, the t-distributed stochastic neighbor embedding (t-SNE) method [48] is adopted for data visualization and the k-means method [49] is adopted to cluster the parking data. Details of the two methods are presented in the following sections.
3.1. Dimension Reduction
The t-distributed stochastic neighbor embedding (t-SNE) is proposed by Van Der Maaten and Hinton [48], having demonstrated great performance in visualizing real-world high-dimensional data. Different from the classical method of Principal Component Analysis (PCA), which uses linear mapping, t-SNE is more flexible and aims to separate dissimilar data points. To this end, t-SNE uses the Gaussian distribution to compute the probability of the high-dimensional data and Student’s t-distribution to compute the probability of the low-dimensional data. The computational procedures of t-SNE are briefly illustrated as follows.
Assuming and are two high-dimensional data points, we can compute their joint probability , which represents the pairwise similarities in the high-dimensional space and can be calculated as follows:
Similarly, we assume and are two dimension-reduced data points for and , respectively. Their joint probability, , which represents the pairwise similarities in the low-dimensional space, can be represented as follows:
Additionally, and are set to zero.
The t-SNE minimizes the Kullback–Leibler (KL) divergence between the two joint probability distributions P () in the high-dimensional space and Q () in the low-dimensional space as defined below:
Objective function:
The gradient of the KL divergence is calculated as:
Using the stochastic gradient descent (SGD), the objective function of t-SNE can be minimized efficiently, and we can obtain , which is a low-dimensional representation of , while preserves the important distributional information for visualization.
3.2. k-Means Clustering
After applying t-SNE for dimension reduction, we cluster the low-dimensional data points by the k-means method. k-means was proposed by McQueen (1967) [49] and is an unsupervised learning method to identify cohesive clusters of data. The k-means algorithm is briefly outlined as shown below.
Assuming the dataset , where , we use the k-means method to assign the data into () clusters. To run k-means, we initialize the cluster center , where , by randomly picking points. Let , where , and represents the assignment results of different data points. The objective function of k-means is calculated as the weighted sum of Euclidean distances between data and cluster centers, as shown below.
Objective function:
Because the decision variable is binary, directly minimizing can be challenging. Instead, we iterate the following two steps until convergence:
(i) Assign data points to the closest cluster center .
For in the dataset, we set:
(ii) Change each cluster center to the mean of all the points in the cluster.
For in the dataset, the center is updated as:
By iteratively running the above two steps, k-means is guaranteed to converge. The final cluster centers as well as the data point assignments will be used for further analysis.
4. Data Analytics for On-Street Parking in Hong Kong
In this section, we analyze the spatio-temporal on-street parking patterns in Hong Kong. The case study uses data from July 2021, when over 6000 parking meters were put into service. In terms of spatial patterns, the analysis includes all three regions and 18 districts in Hong Kong. Each region contains different districts. The location of parking meters in 18 districts is shown in Figure 2, where each parking meter is denoted as a green dot. To give readers a better idea of Hong Kong, the population distribution by each district is shown in Figure 3. One can see that a large population and more parking meters coincide in many districts, such as Sha Tin, Kwun Tong, and Eastern. As the temporal parking pattern is also concerned, we analyze the occupancy changes on each day, including weekdays and weekends. The detailed analysis is presented in the following sections.
4.1. On-Street Parking Patterns of the Whole Hong Kong
We first inspect the average occupancy rates for all the on-street parking meters across Hong Kong, as shown in Figure 4. One can see that the average occupancy rate ranges from 80% to 90% throughout the day, with the lowest peak at around 8:15 and the highest peak at around 20:00. In addition, a trend of decrease followed by an increase is observed between 6:00 and 20:00, and a decrease is observed between 20:00 and 23:00. A low peak of 79% occurs around 8:15, after which parking demand gradually increases to 88% at 20:00, then rapidly decreases to 82% at 23:00 and remains almost at that figure until 6:00 the next day.
Comparing weekdays with weekends, on-street parking demand is higher on weekends than that on weekdays between 5:00 and 21:00, and the largest gap is observed between 8:00 and 9:00. Moreover, the highest peak period is higher, longer, and occurs earlier on weekends than on weekdays. It makes sense that more short-term parking demand occurs on weekends rather than on weekdays since most drivers should work on weekdays and relax on weekends. Moreover, on weekdays, most people have similar off-duty time, and as a result, on-street parking occupancy rates reach a peak around 20:00. On weekends, it also seems to be more popular to drive in the afternoon than in the morning.
4.2. Spatio-Temporal Distributions of On-Street Parking Patterns by Region
The average occupancy rates in the three regions show different parking patterns, as illustrated in Figure 5. In general, three regions have similar short-term parking pattern trends for weekdays and weekends. To compare these three regions’ on-street demand on weekdays and weekends, their average occupancy rates are depicted in Figure 6.
Compared to the other two regions, Hong Kong Island has a more pronounced change in parking patterns and a more pronounced peak period. The comparison of weekday and weekend occupancy rates on Hong Kong Island is shown in Figure 6a. Generally, both weekdays and weekends have two parking peaks at around 11:00 and 17:00, separately, while the weekend has a relatively higher on-street parking demand. For Kowloon (Figure 6b), occupancy rates are stable between 80% and 95% on both weekdays and weekends, with no significant variation throughout the day. Over the weekend, occupancy rates are higher than during the weekdays. For New Territories (Figure 6c), the weekend has a higher and more steady occupancy rate than weekdays. However, during the daytime on weekdays, the parking lot is less occupied. The occupancy rates demonstrate a 10% rapid decrease from 85% at 6:00 to 75% at 8:15 and gradually increase to around 90% at 20:00.
To summarize, among the three regions, higher parking occupancy rates are observed on weekends than on weekdays. A low-peak time can be found in Kowloon and New Territories at 8:15 on weekdays, and a high-peak time can be found at 20:00 on weekdays and weekends in all three regions. Meanwhile, in comparison with the other two regions, the occupancy rate in Hong Kong Island has a wide range of variations from 65% to 90%.
4.3. Spatio-Temporal Distribution of On-Street Parking Patterns by District
In this section, we analyze the spatio-temporal distributions of on-street parking patterns by district. Figure 7 shows the average on-street parking occupancy rates for each region and its districts, with the three solid bold red lines representing the three regions and the other lines representing their 18 districts. In this figure, weekday patterns are shown in Figure 7a and weekend patterns are shown in Figure 7b. Generally, the parking patterns in different districts vary significantly for both weekdays and weekends.
We further plot a heatmap for the average point-in-time occupancy rates every 5 min for each district, as shown in Figure 8. Different colors represent different parking occupancy rates. In certain districts, such as Central and Western and Southern, the occupancy rates are higher during the daytime than at night. Conversely, in some districts, including Tsuen Wan and Sha Tin, the occupancy rates are higher in the evening than during the daytime. Additionally, districts such as Eastern and Tai Po maintain high occupancy rates throughout the day.
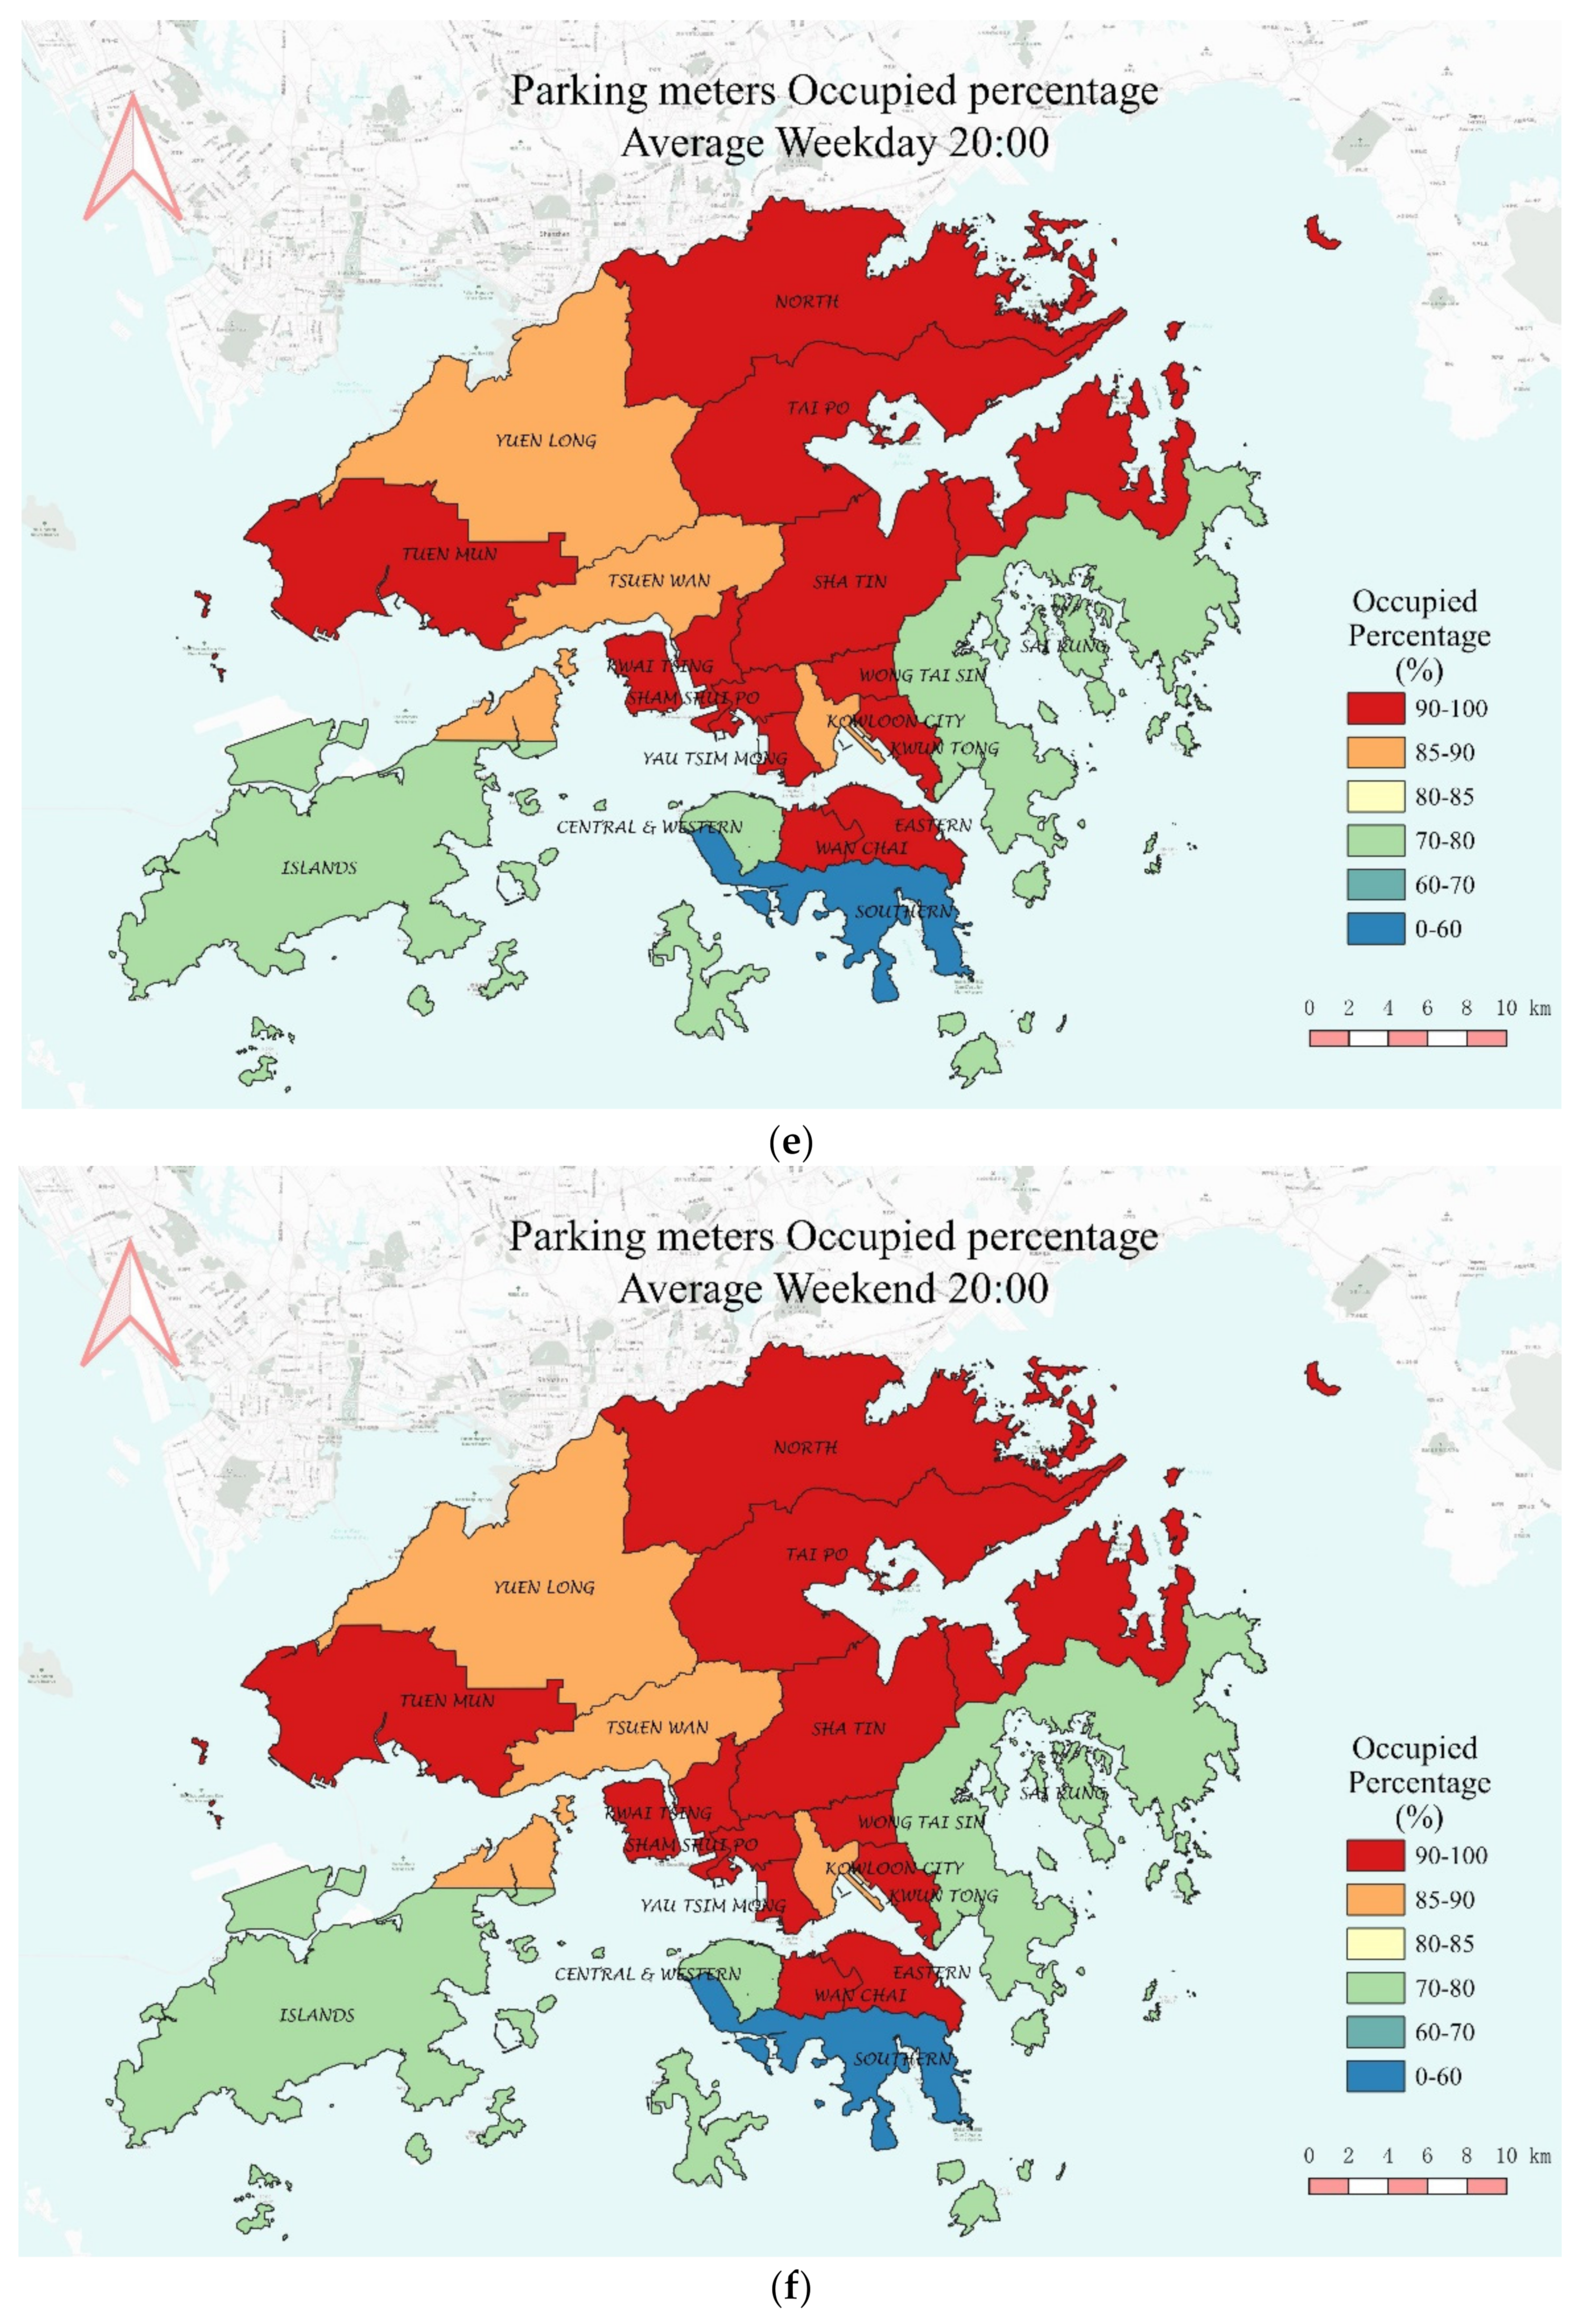
Figure 9 lists the average occupancy rates of on-street parking meters at three time points in each district: stable mean percentage time (00:00), mean percentage at low peak (08:15), and mean percentage at high peak (20:00). Figure 9a,b represents the occupancy rates at 00:00, which are used as a reference since the occupancy data are relatively constant between 00:00 and 6:00. In addition, as described in Section 4.1, there is a high peak at 20:00 and a low peak at 8:15. The distribution maps by district on weekdays and weekends are shown in Figure 9c–f. In general, there are small differences between occupancy patterns on weekdays and weekends at 00:00. Even at midnight, 11 districts on weekdays and 12 districts on weekends have occupancy rates over 85%. There is on-street parking on weekdays during the low peak period (8:15), with only five districts being red and yellow. Peak periods (20:00) have the highest parking demand on either weekdays or weekends, with percentages exceeding 85% in as many as 14 districts.
Significant decreases in weekday on-street parking demand can be observed in Sha Tin, Tuen Mun, Islands, and Kwun Tong, where the color of each district changes from red at 00:00 to green at 8:15. Simultaneously, a slight decrease in parking demand can be seen in Yuen Long, Tsuen Wan, and Kuai Tsing. In contrast, the Central and Western, Wan Chai, Eastern, Sai Kung, and North districts have increases in on-street parking. Compared with weekdays, districts except for North, Tai Po, and Sham Shui Po have lower on-street parking occupancies at 8:15 on weekends. On weekends, almost all districts have an increase in parking demand at 8:15.
Figure 10 depicts the on-street parking patterns of 18 districts, with bolded blue and orange lines representing the average weekend and weekday parking patterns, respectively. The light gray lines represent each separate day. Generally speaking, there are three types of parking patterns out of the 36 patterns (18 districts with weekdays/weekends) in Figure 10. The first type has higher parking occupancy rates during the day than the night (e.g., Central and Western, Southern), the second one has higher parking demand during the night than the day (e.g., Islands), and the third type’s parking demand does not vary much throughout the day (e.g., Kwai Tsing and Tai Po). These three typical patterns align with the observation in Figure 8, and they also correspond to the spatial clustering results in Section 4.4.
Based on Figure 10, four typical districts are selected for further discussion. Their average weekday and weekend occupancy patterns for on-street parking meters are displayed in Figure 11. As illustrated in Figure 11a, the Southern district has two obvious peaks (11:00 and 16:30) on weekdays and three obvious peaks (7:00, 11:00, and 16:45) on weekends. Generally, on-street parking occupancy is higher on weekends than on weekdays, with a difference of up to 10–20% between 8:00 and 20:00. Moreover, occupancy rates on weekends are roughly symmetrical around 13:30, while the occupancy rates are over 85% only between 15:00 and 18:00. As depicted in Figure 11b, the Central and Western district has similar parking patterns on weekdays and weekends, with two peaks occurring at 11:00 and 16:00. The common point between the Southern district and the Central and Western district is that they have higher parking demand during the daytime.
Conversely, the Islands (Figure 11c) and Tsuen Wan (Figure 11d) districts have higher parking demand at night than during the daytime. For the Islands district, it has two lower peaks with about 45% occupancy rates at 11:00 and 18:00 and one higher peak at around 12:30. The parking demand is higher during the day on weekends than on weekdays, except from 12:00 to 13:30. For the Tsuen Wan district, the occupancy rate has a relatively small range from 70% to 90% on weekdays and from 80% to 90% on weekends. Similar to other districts, parking occupancy rates in the Tsuen Wan district are higher on weekdays than on weekends. The low peak on weekdays is at 8:00 and the insignificant low peak on weekends is at noon.
In summary, the spatio-temporal parking patterns of 18 districts on weekdays and weekends are examined and three typical parking patterns are identified in this section. Given this, four districts are discussed extensively.
4.4. Dimension Reduction and Clustering
This section discusses the results of dimension reduction and clustering, and the corresponding methodology is presented in Section 3. In the analysis of temporal parking patterns, we project a total of 31 days of occupancy data to data, and in terms of spatial parking patterns, we reduce 18 districts’ data to data, where 288 represents the number of 5-minute intervals in a day. Using the scikit-learn package in Python, we process the t-SNE and k-means methods.
Some parameters in t-SNE are set as follows: (i) daily pattern: perplexity 10, learning rate 300, early exaggeration 12, random state 30; (ii) district pattern: perplexity 7, learning rate 350, early exaggeration 30, random state 45.
The visualization results of dimension reduction are illustrated in Figure 12, where each day of a week is marked as a different color and annotated with its specific date in (a), and each district is marked with different colors and shapes in (b).
After running t-SNE, we obtain the district patterns in the dimension-reduced space and daily patterns in the dimension-reduced space . To select the optimal k-cluster in the k-means algorithm, we adopt the elbow method, as shown in Figure 13. Based on the sudden change in slopes, a two-cluster in the daily pattern and a four-cluster in the district pattern are chosen.
For temporal parking patterns, two parking patterns are clustered after using the k-means method, and the results are shown in Figure 14a, where cluster 0 contains weekend and holiday patterns, and cluster 1 contains weekday patterns. For spatial parking patterns in Figure 14b, cluster 0 contains Islands, Tsuen Wan, Sha Tin, Yuen Long, and Kowloon City; cluster 1 contains Eastern, Kwai Tsing, Tai Po, Northern, Sham Shui Po, Wong Tai Sin, Tuen Mun, and Kwun Tong; cluster 2 contains Southern, Central and Western, and Sai Kung; and cluster 3 contains Wan Chai and Yau Tsim Mong. Almost all districts in cluster 0 have higher parking demand at night. Parking patterns in districts of cluster 1 remain stable throughout the day. In clusters 2 and 3, districts have higher parking occupancy during the day rather than during the night, and this phenomenon is more obvious in cluster 2 than cluster 3. Comparing these four clusters to the analytics in Section 4.3 and Figure 10, we can conclude that the two analytics results are consistent.
Using clustering methods, spatio-temporal parking patterns can also be found in other cities such as Seattle [50], Munich [41], and Beijing [51]. Even multiple parking behaviors around the globe can be identified through social media [52]. In general, these studies’ results are consistent with our results. In terms of spatial factors, parking patterns vary by area. From the perspective of temporal factors, different parking patterns depend on the day of the week, seasons, and daily time [53]. However, these studies limit their analysis to a small area or use biased data. In view of this, we analyze the whole city from a relatively comprehensive perspective.
4.5. Explanation of On-Street Parking Patterns by District
Previous analysis reveals the average occupancy rates across Hong Kong in three regions and 18 districts. One can see that the on-street parking patterns vary drastically, which is actually attributed to a combination of factors, including population composition, economic development, weather, infrastructure development, public travel modes, and so on. In this section, we use the number of entertainment venues as an example.
Considering the peak parking demand during different periods, we can find that the land use patterns correspond to the parking patterns, as shown in Figure 15. For example, people may be attracted to entertainment places, such as sports venues (e.g., fitness rooms, swimming pools, basketball courts, and tennis courts), shopping places (e.g., shopping centers and markets), and outdoor recreation places (e.g., barbecue areas, parks, zoos, and beaches) to relax on weekends and after work hours on weekdays. The distribution map of entertainment venues (Figure 15) shows that Kwai Tsing, Sham Shui Po, Yau Tsim Mong, Wong Tai Sin, Kowloon City, Wan Chai, and Eastern have a high density of recreation places; correspondingly, these districts also have high occupancy at 20:00 (Figure 9) on weekdays and weekends.
5. Policy Implications
In the previous sections, we have emphasized the importance of on-street parking issues and analyzed unique conditions in Hong Kong. In light of the previous data analysis and the current situation in Hong Kong, some existing management strategies can be employed.
A flexible office schedule might be implemented in the future. Hong Kong’s normal working hours are from 9:00 to 18:00; this fixed office time contributes to the morning and afternoon commute peak. Most districts see higher parking demand during the day than at night, a gradual increase in parking demand after 6:00, and a gradual decrease after 17:00 during the week. Thus, adjusting working hours may mitigate the parking peaks.
Adjusting on-street parking fees by specific location and time of day is considered another useful tool to improve congestion. Currently, the parking meter still charges HKD 2 per 15 min all over the city. Considering spatially and temporally varying parking patterns in Hong Kong, a dynamic parking policy can be implemented in the future.
More parking meters should be installed in congested locations. Districts such as Tai Po and North without a higher population and limited space have high parking occupancy throughout the day. As a result, allocating parking spaces in a reasonable manner may alleviate congestion.
6. Conclusions
In this study, we examined the spatio-temporal patterns of on-street parking in Hong Kong. To the best of our knowledge, this is the first analysis using the data from the new parking meters in Hong Kong. We present the characteristics of the raw data and discuss the data processing steps to calculate parking occupancy rates. The t-SNE and k-means methods are integrated to simultaneously visualize and cluster the parking occupancy data. In the case study, we first analyzed on-street parking patterns of the whole city, where the average parking percentage ranges from 80% to 90%. Then, we analyzed the patterns of three regions and 18 districts in Hong Kong. Three types of on-street parking patterns can be identified. The first pattern has a higher parking occupancy during the day, the second pattern has a higher parking occupancy at night, and the parking occupancy remains stable during the day in the last pattern. The second pattern is quite unique in Hong Kong, probably due to the limited land supply. These three patterns are consistent with the clustering results. Additionally, we also provide examples to link the on-street parking patterns with land-use factors.
Overall, the method proposed in this paper is generalized in the sense that it has a clear and convenient computational process. We believe the method can be applied around the global as long as the on-street parking occupancy data are available, Thus, the proposed method is also applicable to cities equipped with smart parking systems, including Los Angeles, San Francisco, Penang, and Nice.
This study also has some limitations. We used only one month’s data in this paper, as the new parking meters have not yet been completely installed, so future studies are required for analysis over a longer time horizon and on more new parking meters. The data used in this paper are subdivided into regions and districts, and higher granular studies of block or road level analysis can be more insightful. It is possible to use low-dimensional data to improve policies, while high-resolution data can be used to develop specific operating management strategies in the future (Supplementary Materials). Additionally, the sensor failure issues have not been thoroughly studied, so it would be essential to conduct on-site inspection and validation to ensure the correctness of the collected data. This paper mainly focuses on the data-driven perspective to understand the on-street parking patterns in Hong Kong; it would also be interesting to develop theoretical models to depict the complicated interactions among different parking spots.
Supplementary Materials
The high-resolution images shown in this paper are available at the link (https://drive.google.com/drive/folders/1Zx60lFaqngBa9b0TVYZmfavtDAYs2Trc?usp=sharing, accessed on 29 May 2022).
Author Contributions
Conceptualization, F.W. and W.M.; methodology F.W. and W.M.; validation, F.W. and W.M.; formal analysis, F.W.; resources, W.M.; data curation, F.W.; writing—original draft preparation, F.W.; writing—review and editing, F.W. and W.M.; visualization, F.W.; supervision, W.M.; project administration, W.M.; funding acquisition, W.M. All authors have read and agreed to the published version of the manuscript.
Funding
The research described in this study was supported by the Smart Traffic Fund of the Transport Department of the Hong Kong Special Administrative Region, China (ref. no.: PSRI/07/2108/PR) and a grant from the Research Institute for Sustainable Urban Development (RISUD) at the Hong Kong Polytechnic University (project no. P0038288).
Institutional Review Board Statement
Not applicable.
Informed Consent Statement
Not applicable.
Data Availability Statement
The data processing is implemented in Python and open-sourced on GitHub (https://github.com/WFFAN/parking-meter, accessed on 29 May 2022).
Acknowledgments
The authors thank the Transport Department of the Government of the Hong Kong Special Administrative Region for providing the on-street parking data from the new meters. The contents of this paper reflect the views of the authors, who are responsible for the facts and the accuracy of the information presented herein.
Conflicts of Interest
The authors declare no conflict of interest.
References
- Shoup, D.C. Cruising for parking. Transp. Policy 2006, 13, 479–486. [Google Scholar] [CrossRef]
- Arnott, R.; Inci, E. An integrated model of downtown parking and traffic congestion. J. Urban Econ. 2006, 60, 418–442. [Google Scholar] [CrossRef] [Green Version]
- Arnott, R. Spatial competition between parking garages and downtown parking policy. Transp. Policy 2006, 13, 458–469. [Google Scholar] [CrossRef] [Green Version]
- Arnott, R. On the optimal target curbside parking occupancy rate. Econ. Transp. 2014, 3, 133–144. [Google Scholar] [CrossRef] [Green Version]
- Vickrey, W.S. The economizing of curb parking space. Traffic Eng. 1954, 29, 62–67. [Google Scholar]
- Arnott, R.; de Palma, A.; Lindsey, R. A temporal and spatial equilibrium analysis of commuter parking. J. Public Econ. 1991, 45, 301–335. [Google Scholar] [CrossRef] [Green Version]
- Axhausen, K.W.; Polak, J.W.; Boltze, M.; Puzicha, J. Effectiveness of the parking guidance information system in Frankfurt am Main. Traffic Eng. Control 1994, 35, 304–309. [Google Scholar] [CrossRef]
- Shoup, D.C. The trouble with minimum parking requirements. Transp. Res. Part A Policy Pract. 1999, 33, 549–574. [Google Scholar] [CrossRef] [Green Version]
- Legislative Council of Hong Kong. Cap. 374C Road Traffic (Parking) Regulations. Available online: https://www.elegislation.gov.hk/hk/cap374C@1997-06-30T00:00:00?xpid=ID_1438403121854_001 (accessed on 15 March 2022).
- Lam, W.C.H.; Fung, R.Y.C.; Wong, S.C.; Tong, C.O. The Hong Kong parking demand study. Proc. Inst. Civ. Eng. Transp. 1998, 129, 218–227. [Google Scholar] [CrossRef] [Green Version]
- Wong, S.C.; Tong, C.O.; Lam, W.C.H.; Fung, R.Y.C. Development of Parking Demand Models in Hong Kong. J. Urban Plan. Dev. 2000, 126, 55–74. [Google Scholar] [CrossRef]
- Lau, W.W.T.; Poon, P.S.T.; Tong, C.O.; Wong, S.C. The Hong Kong second parking demand study. Proc. Inst. Civ. Eng. Transp. 2005, 158, 53–59. [Google Scholar] [CrossRef]
- Legislative Council Panel on Transport. Report on Parking Demand and Supply and Progress of Improvement Measures. Available online: https://www.legco.gov.hk/yr03-04/english/panels/tp/papers/tpcb1-2314-1e.pdf (accessed on 15 March 2022).
- Transport Department of the Government of the Hong Kong Special Administrantive Region. Monthly Traffic and Transport Digest: October 2021. Available online: https://www.td.gov.hk/filemanager/en/content_5050/2110.pdf (accessed on 15 October 2021).
- Chaniotakis, E.; Pel, A.J. Drivers’ parking location choice under uncertain parking availability and search times: A stated preference experiment. Transp. Res. Part A Policy Pract. 2015, 82, 228–239. [Google Scholar] [CrossRef]
- Van der Waerden, P.; Timmermans, H.; da Silva, A.N.R. The influence of personal and trip characteristics on habitual parking behavior. Case Stud. Transp. Policy 2015, 3, 33–36. [Google Scholar] [CrossRef]
- Yang, S.; Qian, Z. Turning meter transactions data into occupancy and payment behavioral information for on-street parking. Transp. Res. Part C Emerg. Technol. 2017, 78, 165–182. [Google Scholar] [CrossRef] [Green Version]
- Zhang, X.; Huang, H.-J.; Zhang, H.M. Integrated daily commuting patterns and optimal road tolls and parking fees in a linear city. Transp. Res. Part B Methodol. 2008, 42, 38–56. [Google Scholar] [CrossRef]
- Zhang, X.; Liu, W.; Waller, S.T.; Yin, Y. Modelling and managing the integrated morning-evening commuting and parking patterns under the fully autonomous vehicle environment. Transp. Res. Part B Methodol. 2019, 128, 380–407. [Google Scholar] [CrossRef]
- Millard-Ball, A.; Weinberger, R.R.; Hampshire, R.C. Is the curb 80% full or 20% empty? Assessing the impacts of San Francisco’s parking pricing experiment. Transp. Res. Part A Policy Pract. 2014, 63, 76–92. [Google Scholar] [CrossRef]
- Qian, Z.S.; Xiao, F.E.; Zhang, H.M. Managing morning commute traffic with parking. Transp. Res. Part B Methodol. 2012, 46, 894–916. [Google Scholar] [CrossRef]
- Arnott, R.; Rowse, J. Modeling Parking. J. Urban Econ. 1999, 45, 97–124. [Google Scholar] [CrossRef]
- Levy, N.; Martens, K.; Benenson, I. Exploring cruising using agent-based and analytical models of parking. Transp. A Transp. Sci. 2013, 9, 773–797. [Google Scholar] [CrossRef]
- Gu, Z.; Najmi, A.; Saberi, M.; Liu, W.; Rashidi, T.H. Macroscopic parking dynamics modeling and optimal real-time pricing considering cruising-for-parking. Transp. Res. Part C Emerg. Technol. 2020, 118, 102714. [Google Scholar] [CrossRef]
- Zheng, N.; Geroliminis, N. Modeling and optimization of multimodal urban networks with limited parking and dynamic pricing. Transp. Res. Part B Methodol. 2016, 83, 36–58. [Google Scholar] [CrossRef] [Green Version]
- Geroliminis, N. Cruising-for-parking in congested cities with an MFD representation. Econ. Transp. 2015, 4, 156–165. [Google Scholar] [CrossRef]
- Innovation and Technology Bureau. Hong Kong Smart City Blueprint. Available online: https://www.td.gov.hk/mini_site/erpgovhk/download/HongKongSmartCityBlueprint_EN.pdf (accessed on 10 March 2022).
- Innovation and Technology Bureau. Hong Kong Smart City Blueprint 2.0. Available online: https://www.smartcity.gov.hk/modules/custom/custom_global_js_css/assets/files/HKSmartCityBlueprint(ENG)v2.pdf (accessed on 10 March 2022).
- Office of the Government Chief Information Officer. Smart city development in Hong Kong. IET Smart Cities 2019, 1, 23–27. [Google Scholar] [CrossRef]
- Cao, J.; Menendez, M. Quantification of potential cruising time savings through intelligent parking services. Transp. Res. Part A Policy Pract. 2018, 116, 151–165. [Google Scholar] [CrossRef]
- Audit Commission, Transport Department Hong Kong. Management of On-Street Parking Spaces and Parking Facilities; The Government of the Hong Kong Special Administrative Region: Hong Kong, China, 1999.
- Legislative Council Panel on Transport. New Parking Meter Trial Scheme. Available online: https://legco.gov.hk/yr11-12/english/panels/tp/papers/tp0710cb1-2322-1-e.pdf (accessed on 15 March 2022).
- Transport Department. New Parking Meters. Available online: https://www.td.gov.hk/en/transport_in_hong_kong/parking/parking_meters/npm/index.html (accessed on 10 March 2022).
- Transport Department. Handy Tips For Using the New Generation Parking Meters. Available online: https://www.td.gov.hk/en/transport_in_hong_kong/parking/parking_meters/npm/parking_meters_tips/index.html (accessed on 15 April 2022).
- Lin, T.; Rivano, H.; Le Mouel, F. A Survey of Smart Parking Solutions. IEEE Trans. Intell. Transp. Syst. 2017, 18, 3229–3253. [Google Scholar] [CrossRef] [Green Version]
- Tong, C.O.; Wong, S.C.; Leung, B.S.Y. Estimation of parking accumulation profiles from survey data. Transportation 2004, 31, 183–202. [Google Scholar] [CrossRef]
- Hampshire, R.C.; Jordon, D.; Akinbola, O.; Richardson, K.; Weinberger, R.; Millard-Ball, A.; Karlin-Resnik, J. Analysis of Parking Search Behavior with Video from Naturalistic Driving. Transp. Res. Rec. 2016, 2543, 152–158. [Google Scholar] [CrossRef]
- Weinberger, R.R.; Millard-Ball, A.; Hampshire, R.C. Parking search caused congestion: Where’s all the fuss? Transp. Res. Part C Emerg. Technol. 2020, 120, 102781. [Google Scholar] [CrossRef]
- Ottosson, D.B.; Chen, C.; Wang, T.; Lin, H. The sensitivity of on-street parking demand in response to price changes: A case study in Seattle, WA. Transp. Policy 2013, 25, 222–232. [Google Scholar] [CrossRef]
- Fiez, T.; Ratliff, L.J. Gaussian Mixture Models for Parking Demand Data. IEEE Trans. Intell. Transp. Syst. 2020, 21, 3571–3580. [Google Scholar] [CrossRef]
- Gomari, S.; Knoth, C.; Antoniou, C. Cluster analysis of parking behaviour: A case study in Munich. Transp. Res. Procedia 2021, 52, 485–492. [Google Scholar] [CrossRef]
- Piovesan, N.; Turi, L.; Toigo, E.; Martinez, B.; Rossi, M. Data analytics for smart parking applications. Sensors 2016, 16, 1575. [Google Scholar] [CrossRef]
- Ma, W.; Qian, Z. Estimating multi-year 24/7 origin-destination demand using high-granular multi-source traffic data. Transp. Res. Part C Emerg. Technol. 2018, 96, 96–121. [Google Scholar] [CrossRef] [Green Version]
- Ruan, Z.; Miao, Y.; Pan, L.; Xiang, Y.; Zhang, J. Big network traffic data visualization. Multimed. Tools Appl. 2018, 77, 11459–11487. [Google Scholar] [CrossRef]
- Wang, B.; Shaaban, K.; Kim, I. Reveal the hidden layer via entity embedding in traffic prediction. Procedia Comput. Sci. 2019, 151, 163–170. [Google Scholar] [CrossRef]
- Hardegen, C.; Pfulb, B.; Rieger, S.; Gepperth, A. Predicting Network Flow Characteristics Using Deep Learning and Real-World Network Traffic. IEEE Trans. Netw. Serv. Manag. 2020, 17, 2662–2676. [Google Scholar] [CrossRef]
- He, X.; Xu, L.; Zhang, Z. Driving behaviour characterisation by using phase-space reconstruction and pre-trained convolutional neural network. IET Intell. Transp. Syst. 2019, 13, 1173–1180. [Google Scholar] [CrossRef]
- Van Der Maaten, L.; Hinton, G. Visualizing data using t-SNE. J. Mach. Learn. Res. 2008, 9, 2579–2625. [Google Scholar]
- Mac Queen, J. Classification and analysis of multivariate observations. In Proceedings of the 5th Berkeley Symposium on Mathematical Statistics and Probability, Berkeley, CA, USA, 21 June–18 July 1965; pp. 281–297. [Google Scholar]
- Fiez, T.; Ratliff, L. Data-Driven Spatio-Temporal Analysis of Curbside Parking Demand: A Case-Study in Seattle. arXiv 2017, arXiv:1712.01263. [Google Scholar]
- Qin, H.; Pang, Q.; Yu, B.; Wang, Z. Analysis on cruising process for on-street parking using an spectral clustering method. IET Intell. Transp. Syst. 2020, 14, 2113–2121. [Google Scholar] [CrossRef]
- Arhab, N.; Oussalah, M.; Jahan, M.S. Social media analysis of car parking behavior using similarity based clustering. J. Big Data 2022, 9, 74. [Google Scholar] [CrossRef]
- Tamrazian, A.; Qian, Z.S.; Rajagopal, R. Where is my parking spot? Online and offline prediction of time-varying parking occupancy. Transp. Res. Rec. 2015, 2489, 77–85. [Google Scholar] [CrossRef]
Figure 1.
New parking meters in service. (a) Front of the new parking meter; (b) radar detector on one side of the parking meter.
Figure 1.
New parking meters in service. (a) Front of the new parking meter; (b) radar detector on one side of the parking meter.

Figure 2.
Distribution of parking meters in 18 districts in Hong Kong.

Figure 3.
Total population distribution of 18 districts in Hong Kong.

Figure 4.
The average occupancy rate of all on-street parking meters in Hong Kong.

Figure 5.
Average occupancy rates in three regions across Hong Kong. (a) Average occupancy rates on weekdays; (b) average occupancy rates on weekends.
Figure 5.
Average occupancy rates in three regions across Hong Kong. (a) Average occupancy rates on weekdays; (b) average occupancy rates on weekends.

Figure 6.
The comparison of weekday and weekend occupancy rates in three regions. (a) Hong Kong Island; (b) Kowloon; (c) New Territories.
Figure 6.
The comparison of weekday and weekend occupancy rates in three regions. (a) Hong Kong Island; (b) Kowloon; (c) New Territories.


Figure 7.
On-street parking occupancy rates by district on weekdays and weekends. (a) Weekdays: (i) New Territories region with its nine districts (left); (ii) Kowloon region with its five districts (center); (iii) Hong Kong Island region with its four districts (right). (b) Weekends: (i) New Territories region with its nine districts (left); (ii) Kowloon region with its five districts (center); (iii) Hong Kong Island region with its four districts (right).

Figure 8.
Heatmap of the average on-street parking occupancy rate for all districts.

Figure 9.
Average occupancy rates at three time points by district: (a) 00:00 on weekdays; (b) 00:00 on weekends; (c) low peak (8:15) on weekdays; (d) low peak (8:15) on weekends; (e) high peak (20:00) on weekdays; (f) high peak (20:00) on weekends.
Figure 9.
Average occupancy rates at three time points by district: (a) 00:00 on weekdays; (b) 00:00 on weekends; (c) low peak (8:15) on weekdays; (d) low peak (8:15) on weekends; (e) high peak (20:00) on weekdays; (f) high peak (20:00) on weekends.


Figure 10.
Parking occupancy rates of each district on weekends and weekdays.

Figure 11.
Average parking occupancy rates on weekdays and weekends in four districts. (a) Southern district; (b) Central and Western district; (c) Islands district; (d) Tsuen Wan district.
Figure 11.
Average parking occupancy rates on weekdays and weekends in four districts. (a) Southern district; (b) Central and Western district; (c) Islands district; (d) Tsuen Wan district.

Figure 12.
t-SNE results for daily and district patterns. (a) Daily patterns; (b) district patterns.
Figure 12.
t-SNE results for daily and district patterns. (a) Daily patterns; (b) district patterns.

Figure 13.
Elbow method for optimal k in k-means. (a) Daily patterns; (b) district patterns.

Figure 14.
k-means result for daily and district patterns. (a) Clustering results for daily patterns; (b) clustering results for district patterns.
Figure 14.
k-means result for daily and district patterns. (a) Clustering results for daily patterns; (b) clustering results for district patterns.

Figure 15.
Distribution of entertainment venues in Hong Kong by district.


Table 1.
An overview of the raw data on real-time occupancy of parking meters.
| A Sample of the Raw Parking Occupancy Data | |||
|---|---|---|---|
| Parking Space ID | Parking Meter Status * | Occupancy Status * | Occupancy Date Changed |
| 1001A | O | O | 15 July 2021 11:58:32 a.m. |
| … | … | … | … |
| 11040A | NA | V | 28 April 2021 11:59:26 a.m. |
| … | … | … | … |
| 11609B | O | V | 15 July 2021 11:56:21 a.m. |
| … | … | … | … |
| 12606A | NA | O | 6 July 2021 17:41:21 p.m. |
| … | … | … | … |
* In the Parking Meter Status column, O is operating parking meters; NA is unavailable parking meters. In the Occupancy Status column, V is vacant parking meters; O is occupied parking meters. (The original data dictionary is available at: https://www.td.gov.hk/datagovhk_td/metered-parking-spaces-data/resources/en/dataspec/metered_parking_spaces_data_dataspec.pdf, accessed on 7 February 2022).
Table 2.
An overview of the raw data on the distribution of parking meters.
| A Data Sample for the Parking Meter Distribution | |||||||||||||
|---|---|---|---|---|---|---|---|---|---|---|---|---|---|
| Pole ID | Parking Space ID | Region | District | Sub District | Street | Section of Street | Latitude | Longitude | Vehicle Type | LPP | Operating Period | Time Unit | Pay Unit |
| 1 | 1A | Hong Kong | Southern | Bays Areas | ISLAND ROAD | The Hong Kong Golf Club | 22.24591 | 114.1862 | A | 30 | D | 15 | 2 |
| … | … | … | … | … | … | … | … | … | … | … | … | … | … |
| 27612 | 27612B | New Territories | Sha Tin | Sha tin Town Centre | MAN LAM ROAD | Man Lai Road | 22.3773 | 114.1834 | A | 120 | Q | 15 | 2 |
| … | … | … | … | … | … | … | … | … | … | … | … | … | … |
| 5301 | 5301B | Kowloon | Yau Tsim Mong | East Tsim Sha Tsui and King’s Park | TUNG FONG STREET | Waterloo Road | 22.31335 | 114.1712 | A | 120 | D | 15 | 2 |
| … | … | … | … | … | … | … | … | … | … | … | … | … | … |
Publisher’s Note: MDPI stays neutral with regard to jurisdictional claims in published maps and institutional affiliations. |
© 2022 by the authors. Licensee MDPI, Basel, Switzerland. This article is an open access article distributed under the terms and conditions of the Creative Commons Attribution (CC BY) license (https://creativecommons.org/licenses/by/4.0/).
Share and Cite
MDPI and ACS Style
Wu, F.; Ma, W. Clustering Analysis of the Spatio-Temporal On-Street Parking Occupancy Data: A Case Study in Hong Kong. Sustainability 2022, 14, 7957. https://0-doi-org.brum.beds.ac.uk/10.3390/su14137957
AMA Style
Wu F, Ma W. Clustering Analysis of the Spatio-Temporal On-Street Parking Occupancy Data: A Case Study in Hong Kong. Sustainability. 2022; 14(13):7957. https://0-doi-org.brum.beds.ac.uk/10.3390/su14137957
Chicago/Turabian StyleWu, Fan, and Wei Ma. 2022. "Clustering Analysis of the Spatio-Temporal On-Street Parking Occupancy Data: A Case Study in Hong Kong" Sustainability 14, no. 13: 7957. https://0-doi-org.brum.beds.ac.uk/10.3390/su14137957
Note that from the first issue of 2016, this journal uses article numbers instead of page numbers. See further details here.