Article

Agricultural Structures Management Based on Nonpoint Source Pollution Control in Typical Fuel Ethanol Raw Material Planting Area

1
School of Ecology and Environment, Beijing Technology and Business University, Beijing 100048, China
2
State Environmental Protection Key Laboratory of Food Chain Pollution Control, Beijing Technology and Business University, Beijing 100048, China
3
Key Laboratory of Cleaner Production and Integrated Resource Utilization of China National Light Industry, Beijing Technology and Business University, Beijing 100048, China
4
National Engineering Laboratory for Lake Pollution Control and Ecological Restoration, State Environment Protection Key Laboratory for Lake Pollution Control, Chinese Research Academy of Environmental Sciences, Beijing 100012, China
*
Author to whom correspondence should be addressed.
Sustainability 2022, 14(13), 7995; https://0-doi-org.brum.beds.ac.uk/10.3390/su14137995
Submission received: 29 May 2022 / Revised: 18 June 2022 / Accepted: 25 June 2022 / Published: 30 June 2022
(This article belongs to the Special Issue Future Directions for Soil Remediation and Environmental Management)

Abstract

:
Increasing the promotion and application of biofuel ethanol has been a national strategy in China, which in turn has affected changes in the raw material planting structure. This study analyzed the effects of agricultural land-use changes on water quality in a typical maize fuel ethanol raw material planting area. The results revealed that an increase in cultivated land and construction land would also increase the load of TN (total nitrogen) and TP (total phosphorus), while an expansion in forest land would reduce the load. As for crop structures, maize might have a remarkable positive effect on TN and TP, while rice and soybean performed in no significant manner. Furthermore, scenarios under the carbon neutralization policy and water pollution control were carried out to forecast the nonpoint source pollutants based on the quantitative relations coefficients. It was proven that maize planting was not suitable for vigorous fuel ethanol development. Reducing maize area in the Hulan River Basin was beneficial to reducing nonpoint source pollution. However, the area of maize should not be less than 187 km2, otherwise, the food security of the population in the basin would be threatened. Under the change in fuel ethanol policy, this study could provide scientific support for local agriculture land-use management in realizing the carbon neutralization vision and set a good example for the development of the fuel ethanol industry in other maize planting countries.

1. Introduction

With the development of the economy, the global demand for energy has been becoming higher and higher. However, traditional fossil energy has caused serious environmental pollution. In order to alleviate the pollution of the environment, sustainable development has become an urgent problem [1]. China has pledged to achieve a carbon peak by 2030 and become carbon neutral by 2060. As a clean energy source, biofuel ethanol could emit fewer greenhouse gases [2]. To some extent, bioethanol could replace traditional fossil energy, which would be conducive to sustainable development. In recent years, many countries have introduced a series of policies to support the development of biofuels [3]. Developing biofuel ethanol is considered one way to achieve carbon neutrality. By 2030, carbon dioxide emissions per unit of GDP would be reduced by 60–65% compared with 2005, and non-fossil energy would account for 20% of primary energy consumption. As the world’s largest energy consumer and importer, China’s share of global energy demands would be expected to increase from 23% in 2015 to 26% in 2035, accounting for 35% of global net growth [4]. China would continue to increase its share of non-fossil energy in the future [5]. Therefore, biofuel ethanol has broad development prospects [6].
Because the policy proposed to increase fuel ethanol, the development of fuel ethanol would affect the change of ethanol raw materials which would lead to changes in soil management and land utilization [7]. People influenced land-use change by field management methods such as changing planting structure and fertilization. Land-use change would widely affect the water quantity and quality of the basin through the underlying surface [8]. Land-use change was the main cause of hydrological change in the basin in the short term [9] as well as nonpoint source pollution in the basin, and its results would guide land-use planning and soil management [10,11]. Fan [12] studied the impact of land-use change on nitrogen and phosphorus in the Teshio River Basin in Japan. It was found that nitrogen, phosphorus, and sediment load mainly came from agricultural land. Camara found that cultivated land change had a great impact on water quality change [13]. Fertilization contributed 82% to water pollution in Malaysia. In recent years, with the development and maturity of computer technology, the study of hydrological response to land-use change has shifted to a more detailed classification and smaller scale. Gu studied the impact of two biofuel crops on pollution sources in the United States, and the results showed that planting switchgrass instead of maize could greatly improve water quality in the watershed [14]. Wu [15] studied the impact of increased biofuel raw material production on regional water resources and water quality in the Mississippi River Basin. The results demonstrated that when land use was changed to switchgrass, surface runoff in the basin would be reduced and water quality would be improved. At present, the impacts of land-use change on nonpoint source pollution mainly focus on first-level classification, and that of specific crop changes on nonpoint source pollution were absent. Moreover, the impacts of energy crop changes on nonpoint source pollution were also lacking. The international research trend was more refined land-use division [16], but there was less study in this respect in China. In the future, studies on the response of different crop changes to water and water quality in predicted ethanol growing areas in China could be carried out. This would help to look for the best land management practices in the basin research scale.
In China, the production technology of biofuel ethanol using maize as raw materials was mature and has good economic benefits [17]. Maize ethanol production capacity accounted for about 57% of China’s total ethanol production capacity [18]. Heilongjiang Province had the largest area of maize cultivation in China, maize acreage accounted for 14% of China’s maize acreage [19]. It was also the first region to develop the maize ethanol industry in China. Nevertheless, the soil management and land use for food crops such as maize had a close connection with food security [20]. Maize ethanol suffered the problem of competing with grain for land. Therefore, the Department of Agriculture issued the policy to reduce maize acreage in Heilongjiang Province. The Harbin government stipulated that the area of maize should be reduced in the future, and the area of cash crops such as vegetables should be increased. Land-use management would change. This would affect nonpoint source pollution in Northeast China. It was suitable for exploring the response mechanism of water quality on agriculture land-use and management changes in Heilongjiang Province.
In this study, a typical fuel ethanol raw material planting area was selected: the maize planting area in the Harbin section of the Hulan River Basin in Heilongjiang Province. The research content was mainly divided into the following three tasks:
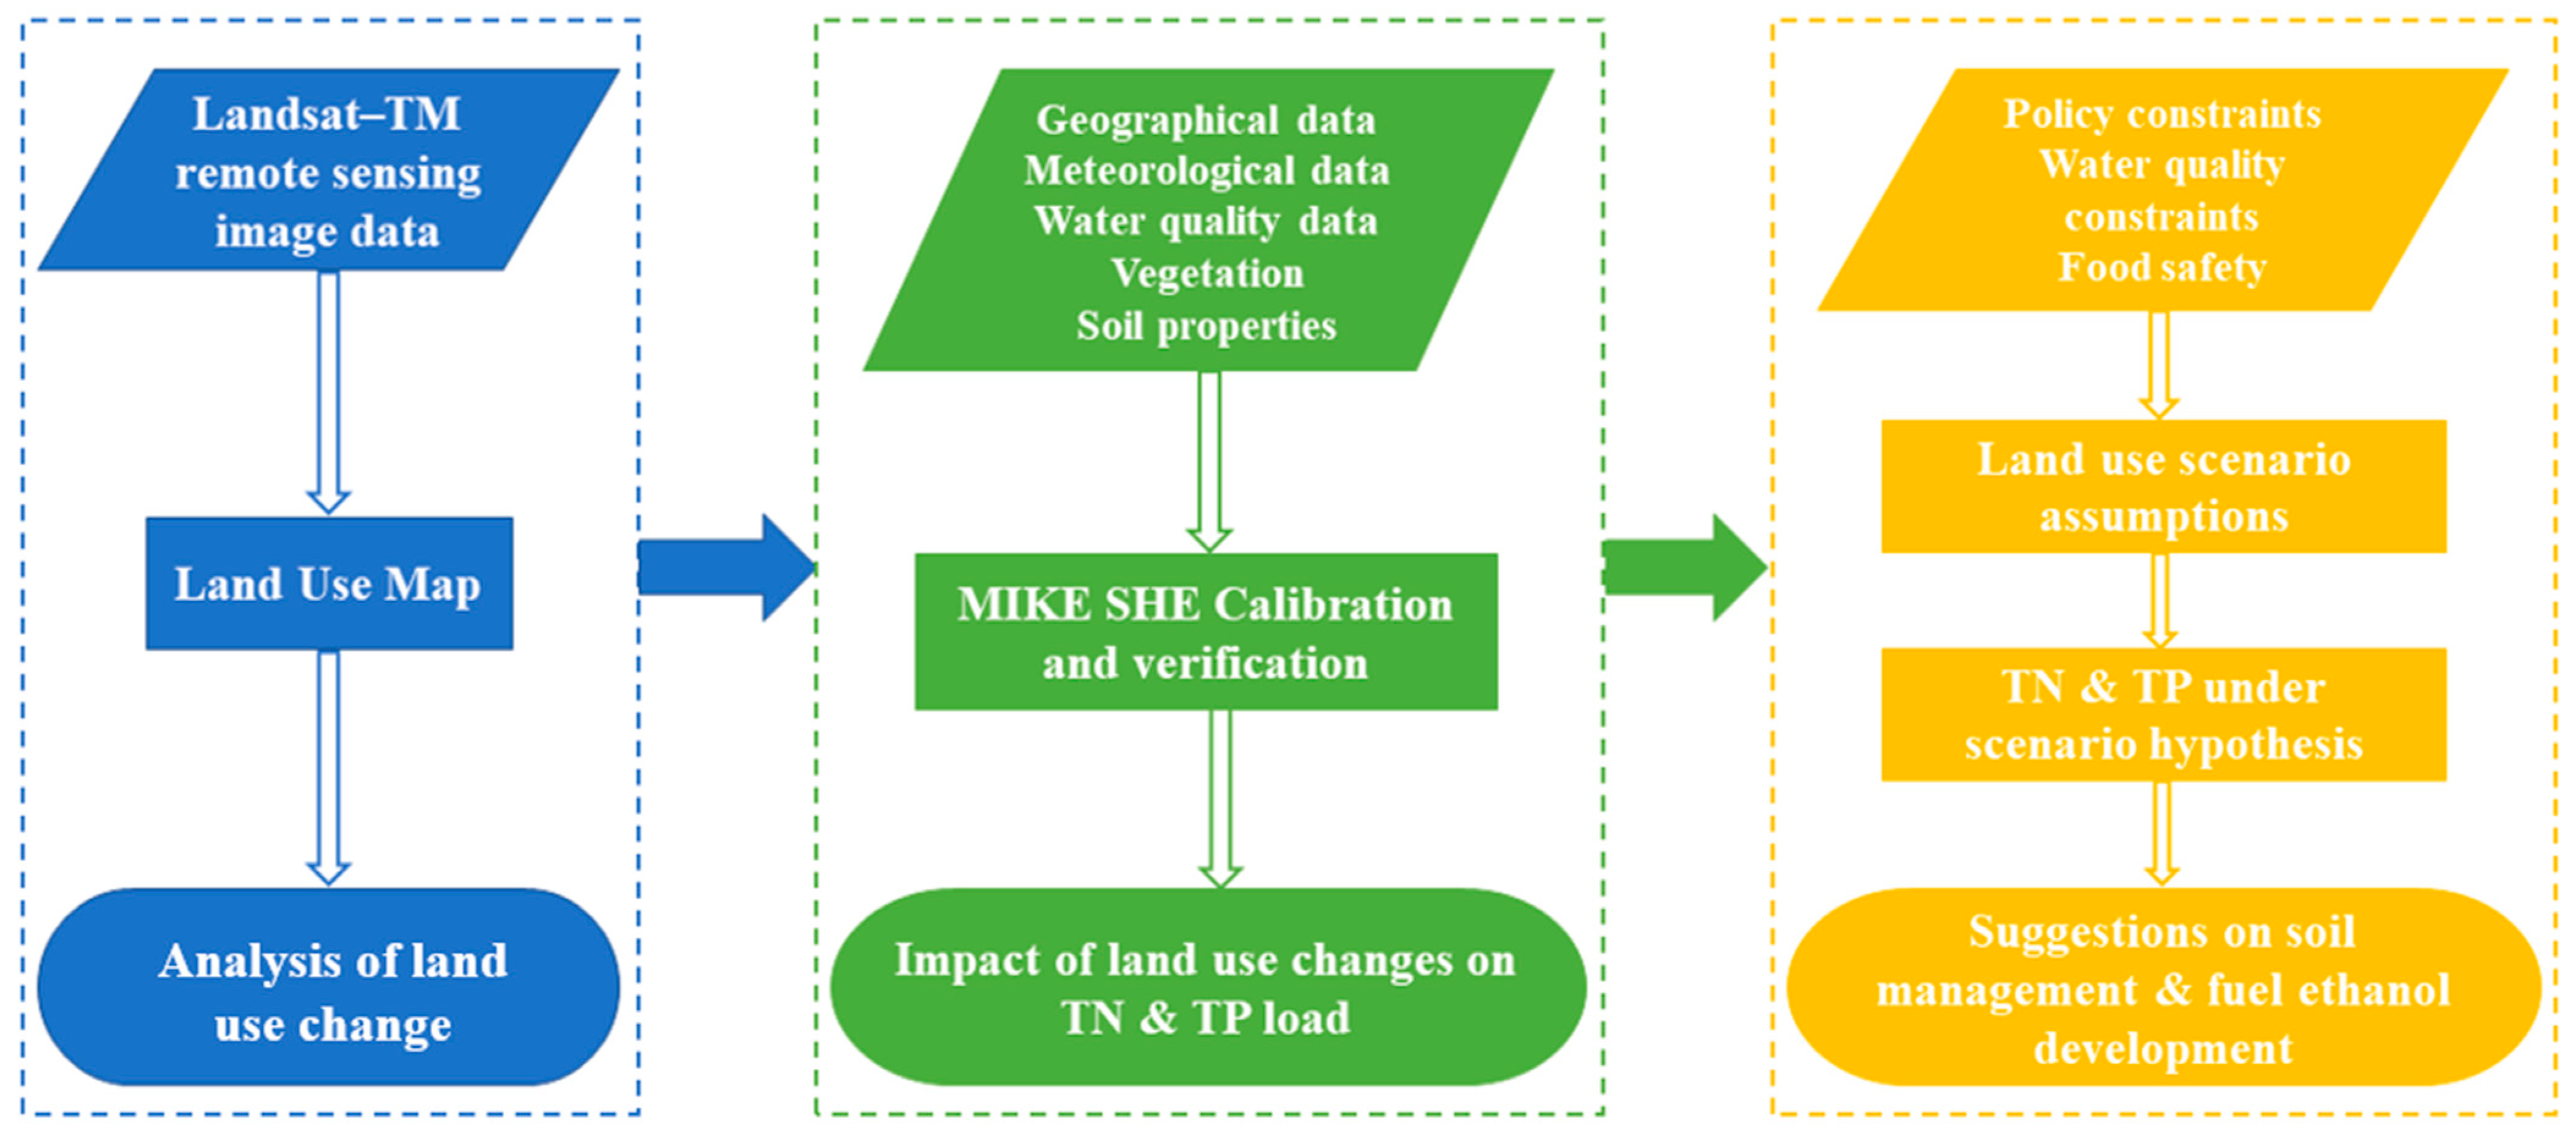
  • Reveal the law of land-use change through the interpretation of three remote sensing images;
  • Establish a nonpoint source pollution model after verification of the MIKE-SHE distributed hydrological model. The influence of land-use change on nonpoint source pollution was obtained by multiple linear regression;
  • Based on the results of the second step, the ethanol crop planting scenario hypothesis was established to guide the spatial planning and soil management of fuel ethanol planting areas.
This study divided cultivated land into crop levels to provide a scientific basis and more detailed management suggestions for local agricultural land planning and soil management.

2. Materials and Methods

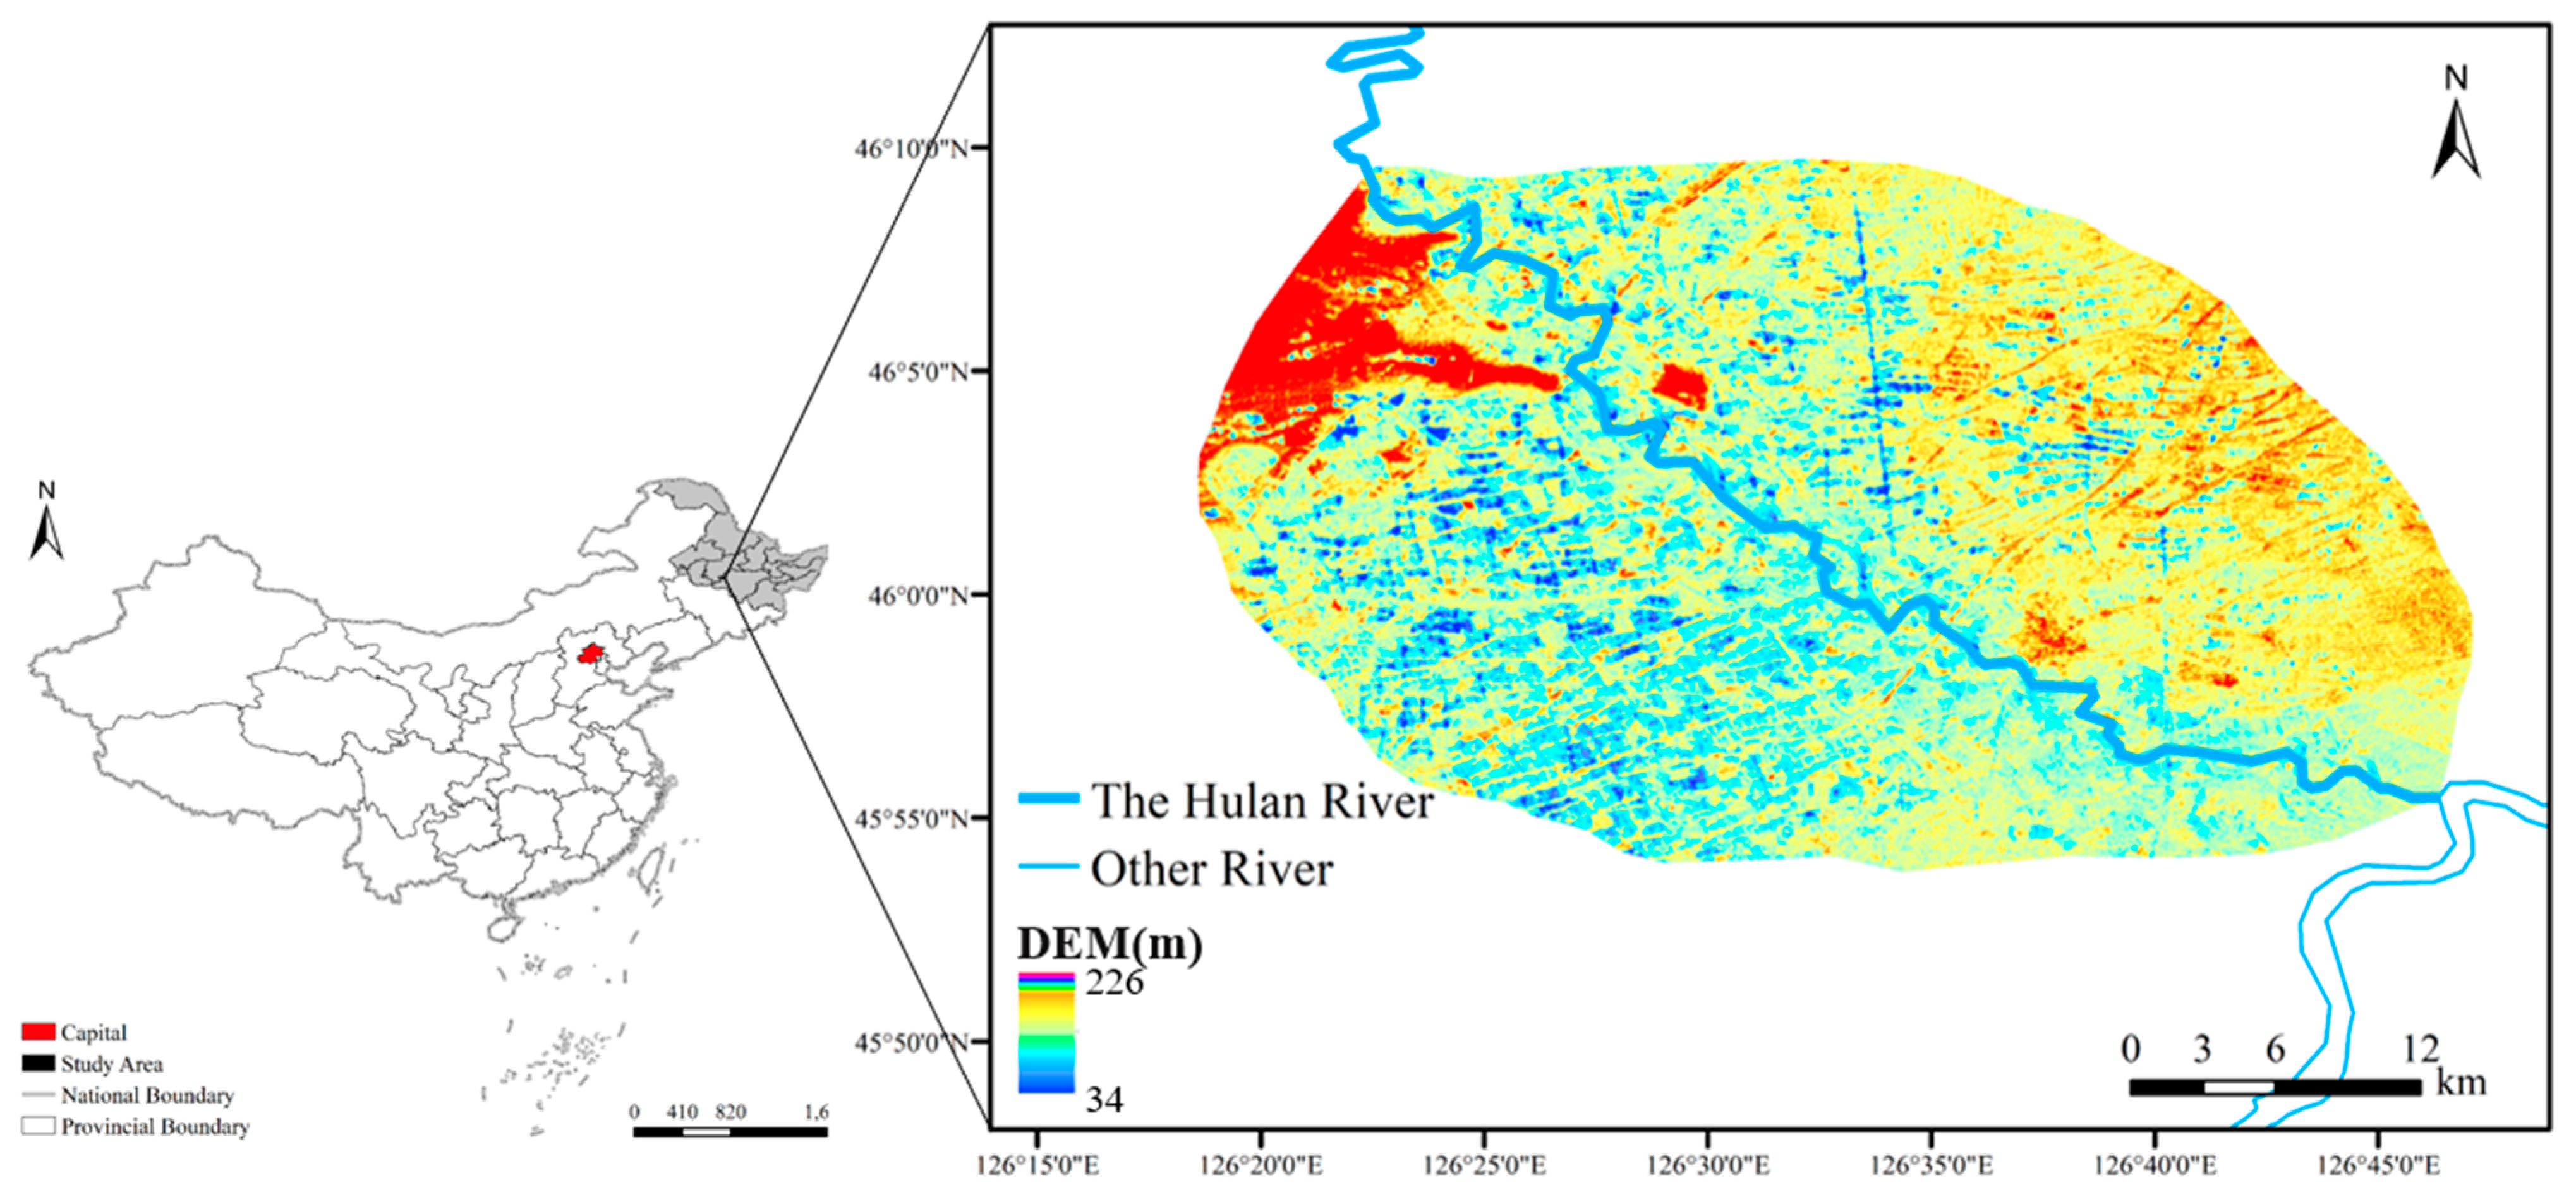
2.1. Overview of the Study Area

The Harbin section of the Hulan River Basin is located in the middle of Heilongjiang Province, covering an area of 856 km2. The Hulan River is a tributary of the Songhua River and it flows from northwest to southeast in the study area, with a total length of about 35 km (Figure 1). The selected area is a typical maize growing area. The average annual temperature in the area is about 4.5 °C, and the annual rainfall is about 770 mm. The average slope is between 0 and 6%. The wet season in Heilongjiang is from June to September. Due to the cold climate in Northeast China, rivers are frozen in winter, and precipitation decreases. It makes the dry season from November to March the next year. Another period of the year is the mean flow season [21].
The mainland use of the Hulan River Basin was cultivated land. The percentage area of cultivated land was 75.6% and the irrigated farmland was 3.8%. The occupied areas of construction lands and river lands were 7.9% and 5.6%, respectively. The topography of the study area was plain and the soil fertility was higher. The main soil types in China include red soil, brown soil, brown soil, black soil, chestnut soil, desert soil, tidal soil, irrigation and siltation soil, paddy soil, wet soil (meadow and marsh soil), saline-alkaline soil, lithologic soil, alpine soil, etc. The main soil types in the maize growing area were black soil and meadow soil. There were several maize alcohol producers in the study area.

2.2. Interpretation of Land Use

Landsat-TM remote sensing image data with cloud volume ≤5% from 2010 to 2020 were downloaded from the official website of NASA. The downloaded remote sensing image data were preprocessed by radiometric calibration, atmospheric correction, band synthesis, and image clipping. Land-use differences were differentiated according to different crop phenology information. We used the normalized differential vegetation index (NDVI) to determine land-use differences. The supervised classification method was used to distinguish Landsat image pixels. According to the land-use classification system of the CAS (Chinese Academy of Sciences), the land use in the basin was divided into forest, grassland, water area, construction land, unused land, and depression land. Because of the different crop phenology information, the cultivated land in Hulan River Basin was further divided into maize, soybeans, and rice. The visualized spatial distribution maps of land-use types were realized by Arc GIS.
The transfer matrix model was adopted to reveal the law of land-use transfer:
A ij = [ A 11 A 12 A 21 A 22         A 1 n A 2 n A n 1 A n 2         A n n ]
where Aij was a matrix with n columns and n lines; i and j were the land-use type of the previous period and the later period; Aij was the area transformed from type i to j; n was the number of all the land-use types.

2.3. Hydrological Model Construction

Compared with point source pollution, nonpoint source pollution has a complex mechanism and significant spatial difference in pollutant load [22]. Nonpoint source pollution was more difficult to monitor and treat than point source pollution. Because of the hidden and random nature of nonpoint source pollution, it was difficult to monitor and treat. Nonpoint source pollution was often estimated by hydrological models in current studies [23]. Hydrological modeling was an important method to study the hydrological response process of land-use change [24]. At present, the commonly used hydrological models included the SWAT model [25], HSPF model [26], AGNPS model [27], MIKE model [28], and so on. Among them, the MIKE-SHE model can simulate the hydrological response process of land-use change, which has great advantages in small and medium-sized basins [29]. In this study, the MIKE-SHE model was selected as the simulation tool for water quality analysis. The MIKE 11 module was selected to simulate the hydrodynamics and water quality of the Hulan River. Based on the MIKE ZERO platform, MIKE-SHE and MIKE 11 were coupled to simulate the flow process in the basin.
The input data required for the MIKE-SHE model simulation is listed in Table 1. The concentrations of TN and TP in the Hulan River were measured by automatic water quality monitoring sensors.
The overall technical route of the study is shown in Figure 2.

3. Results and Discussion

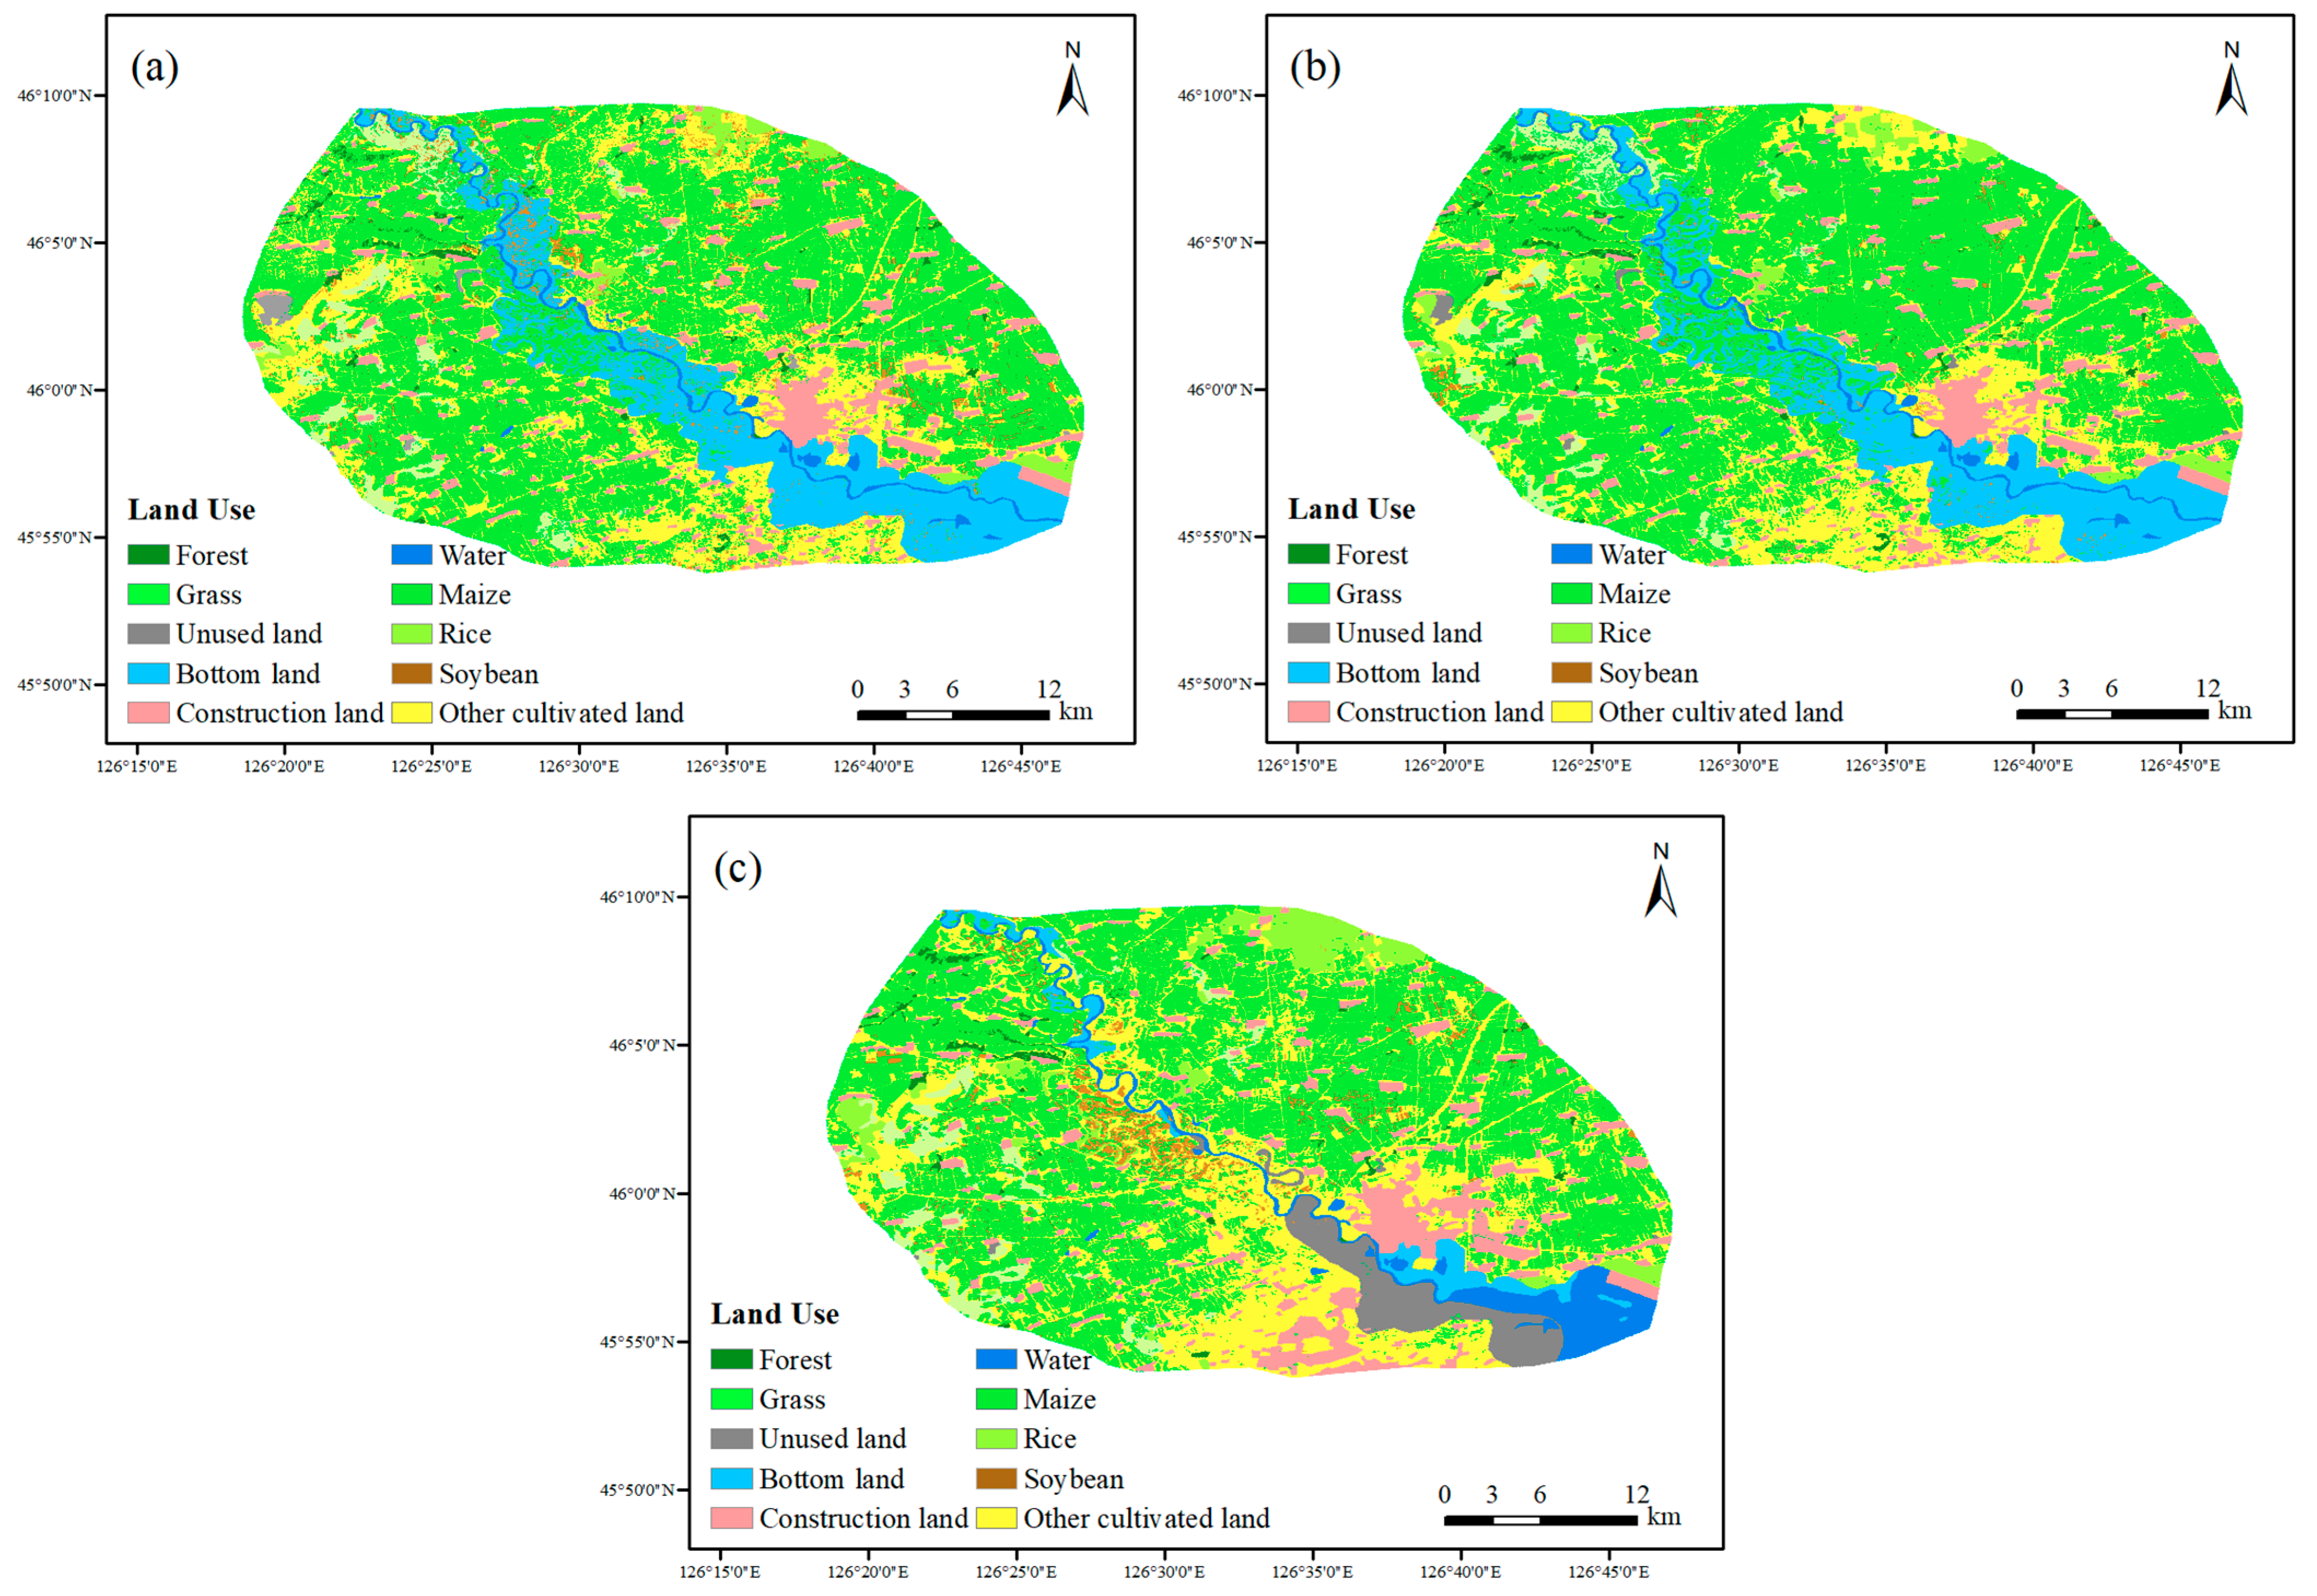
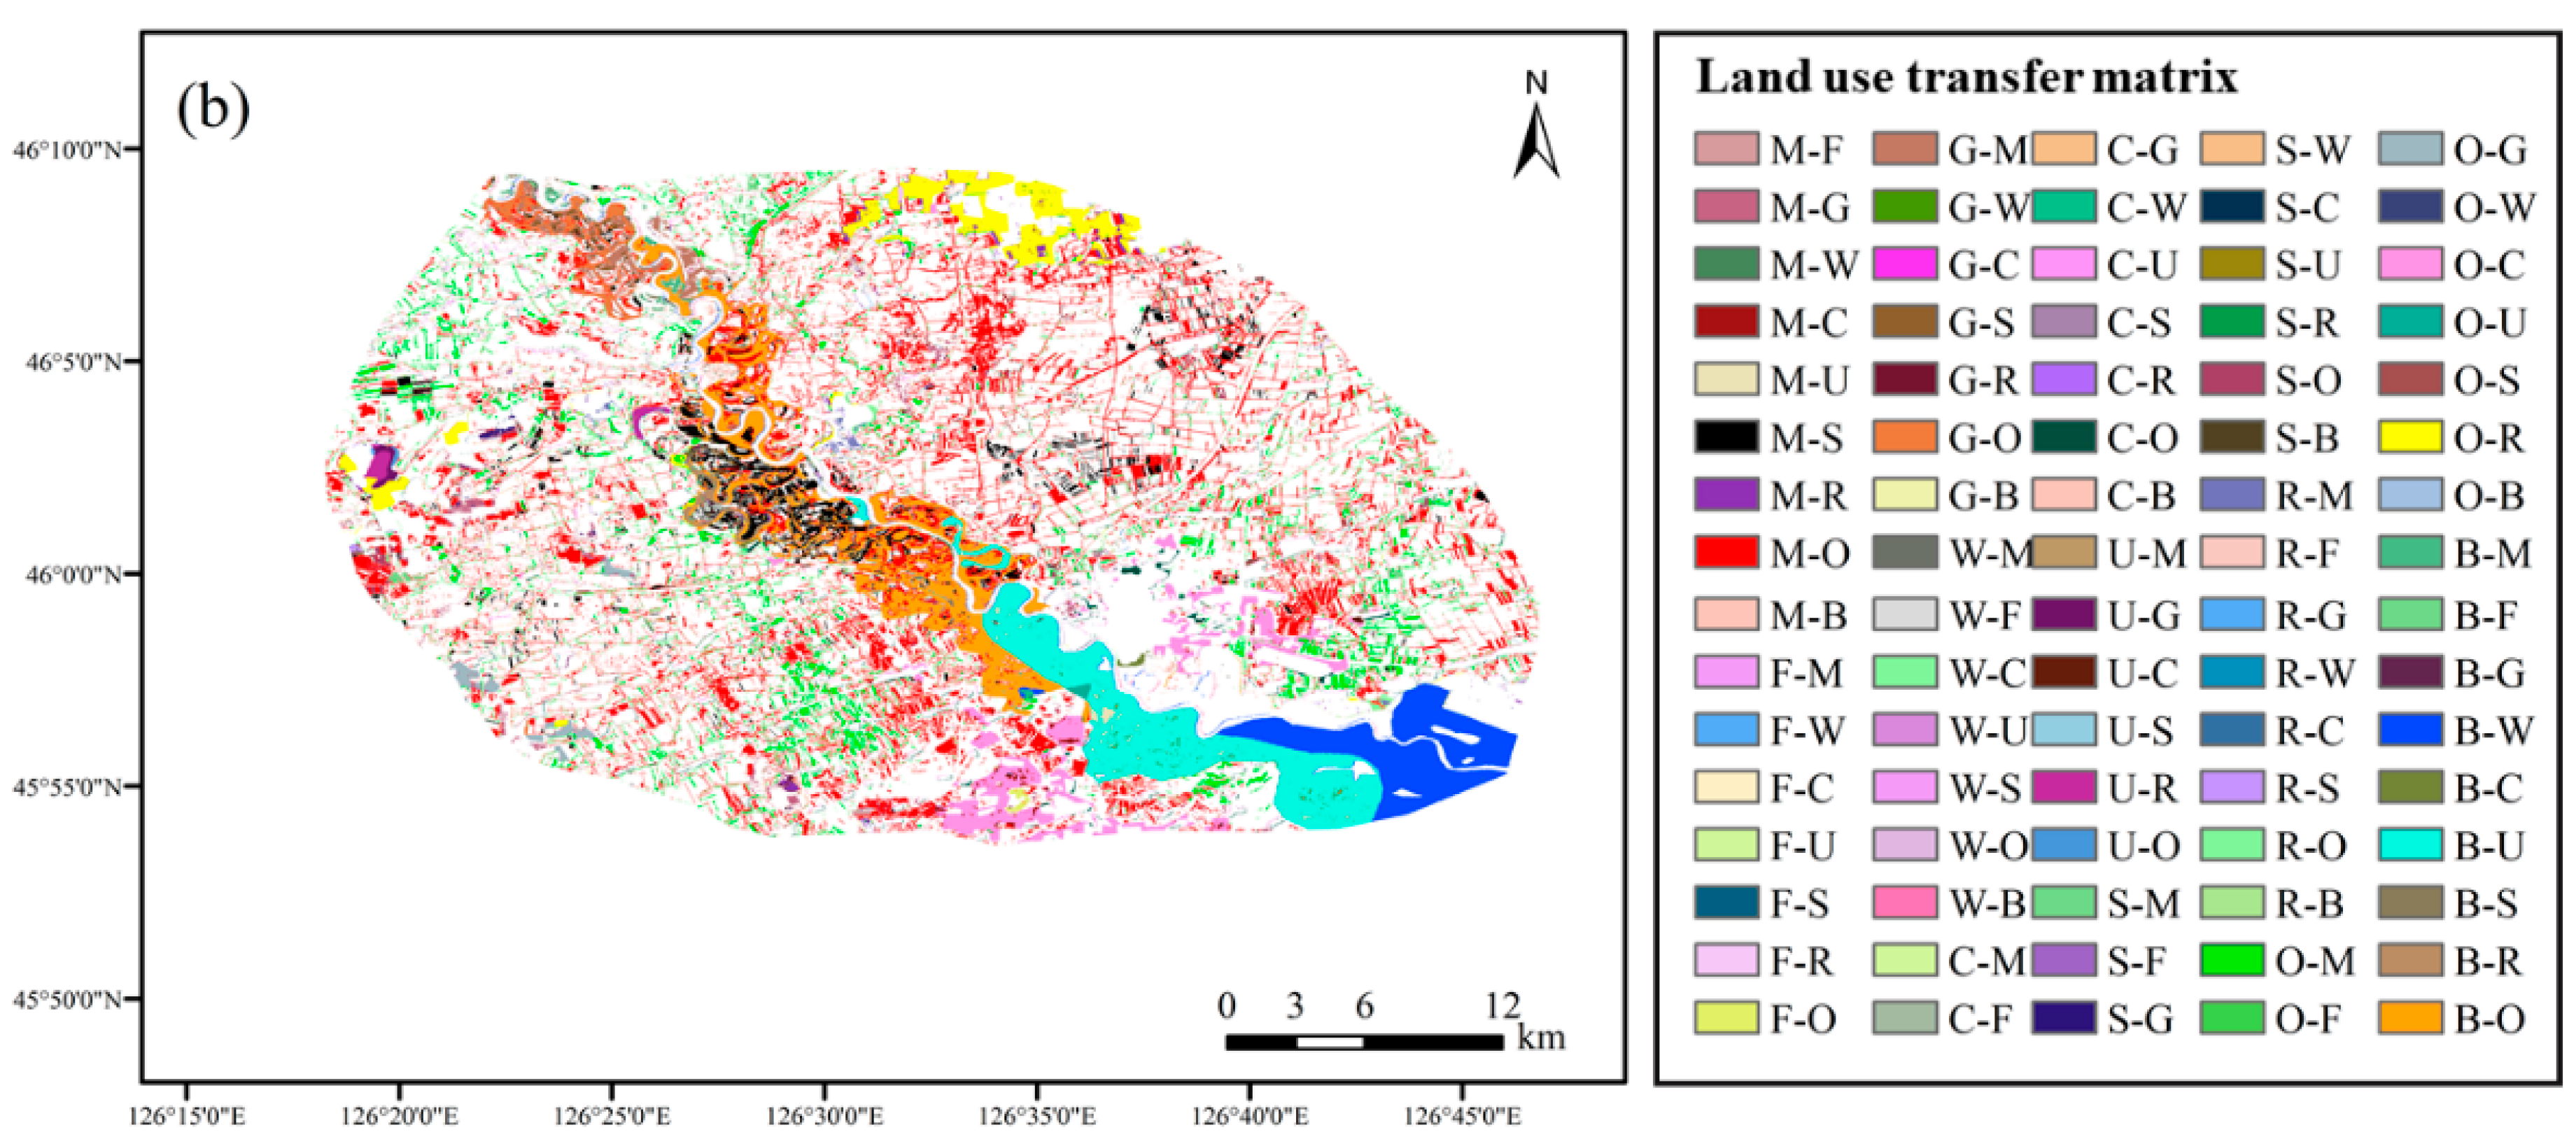
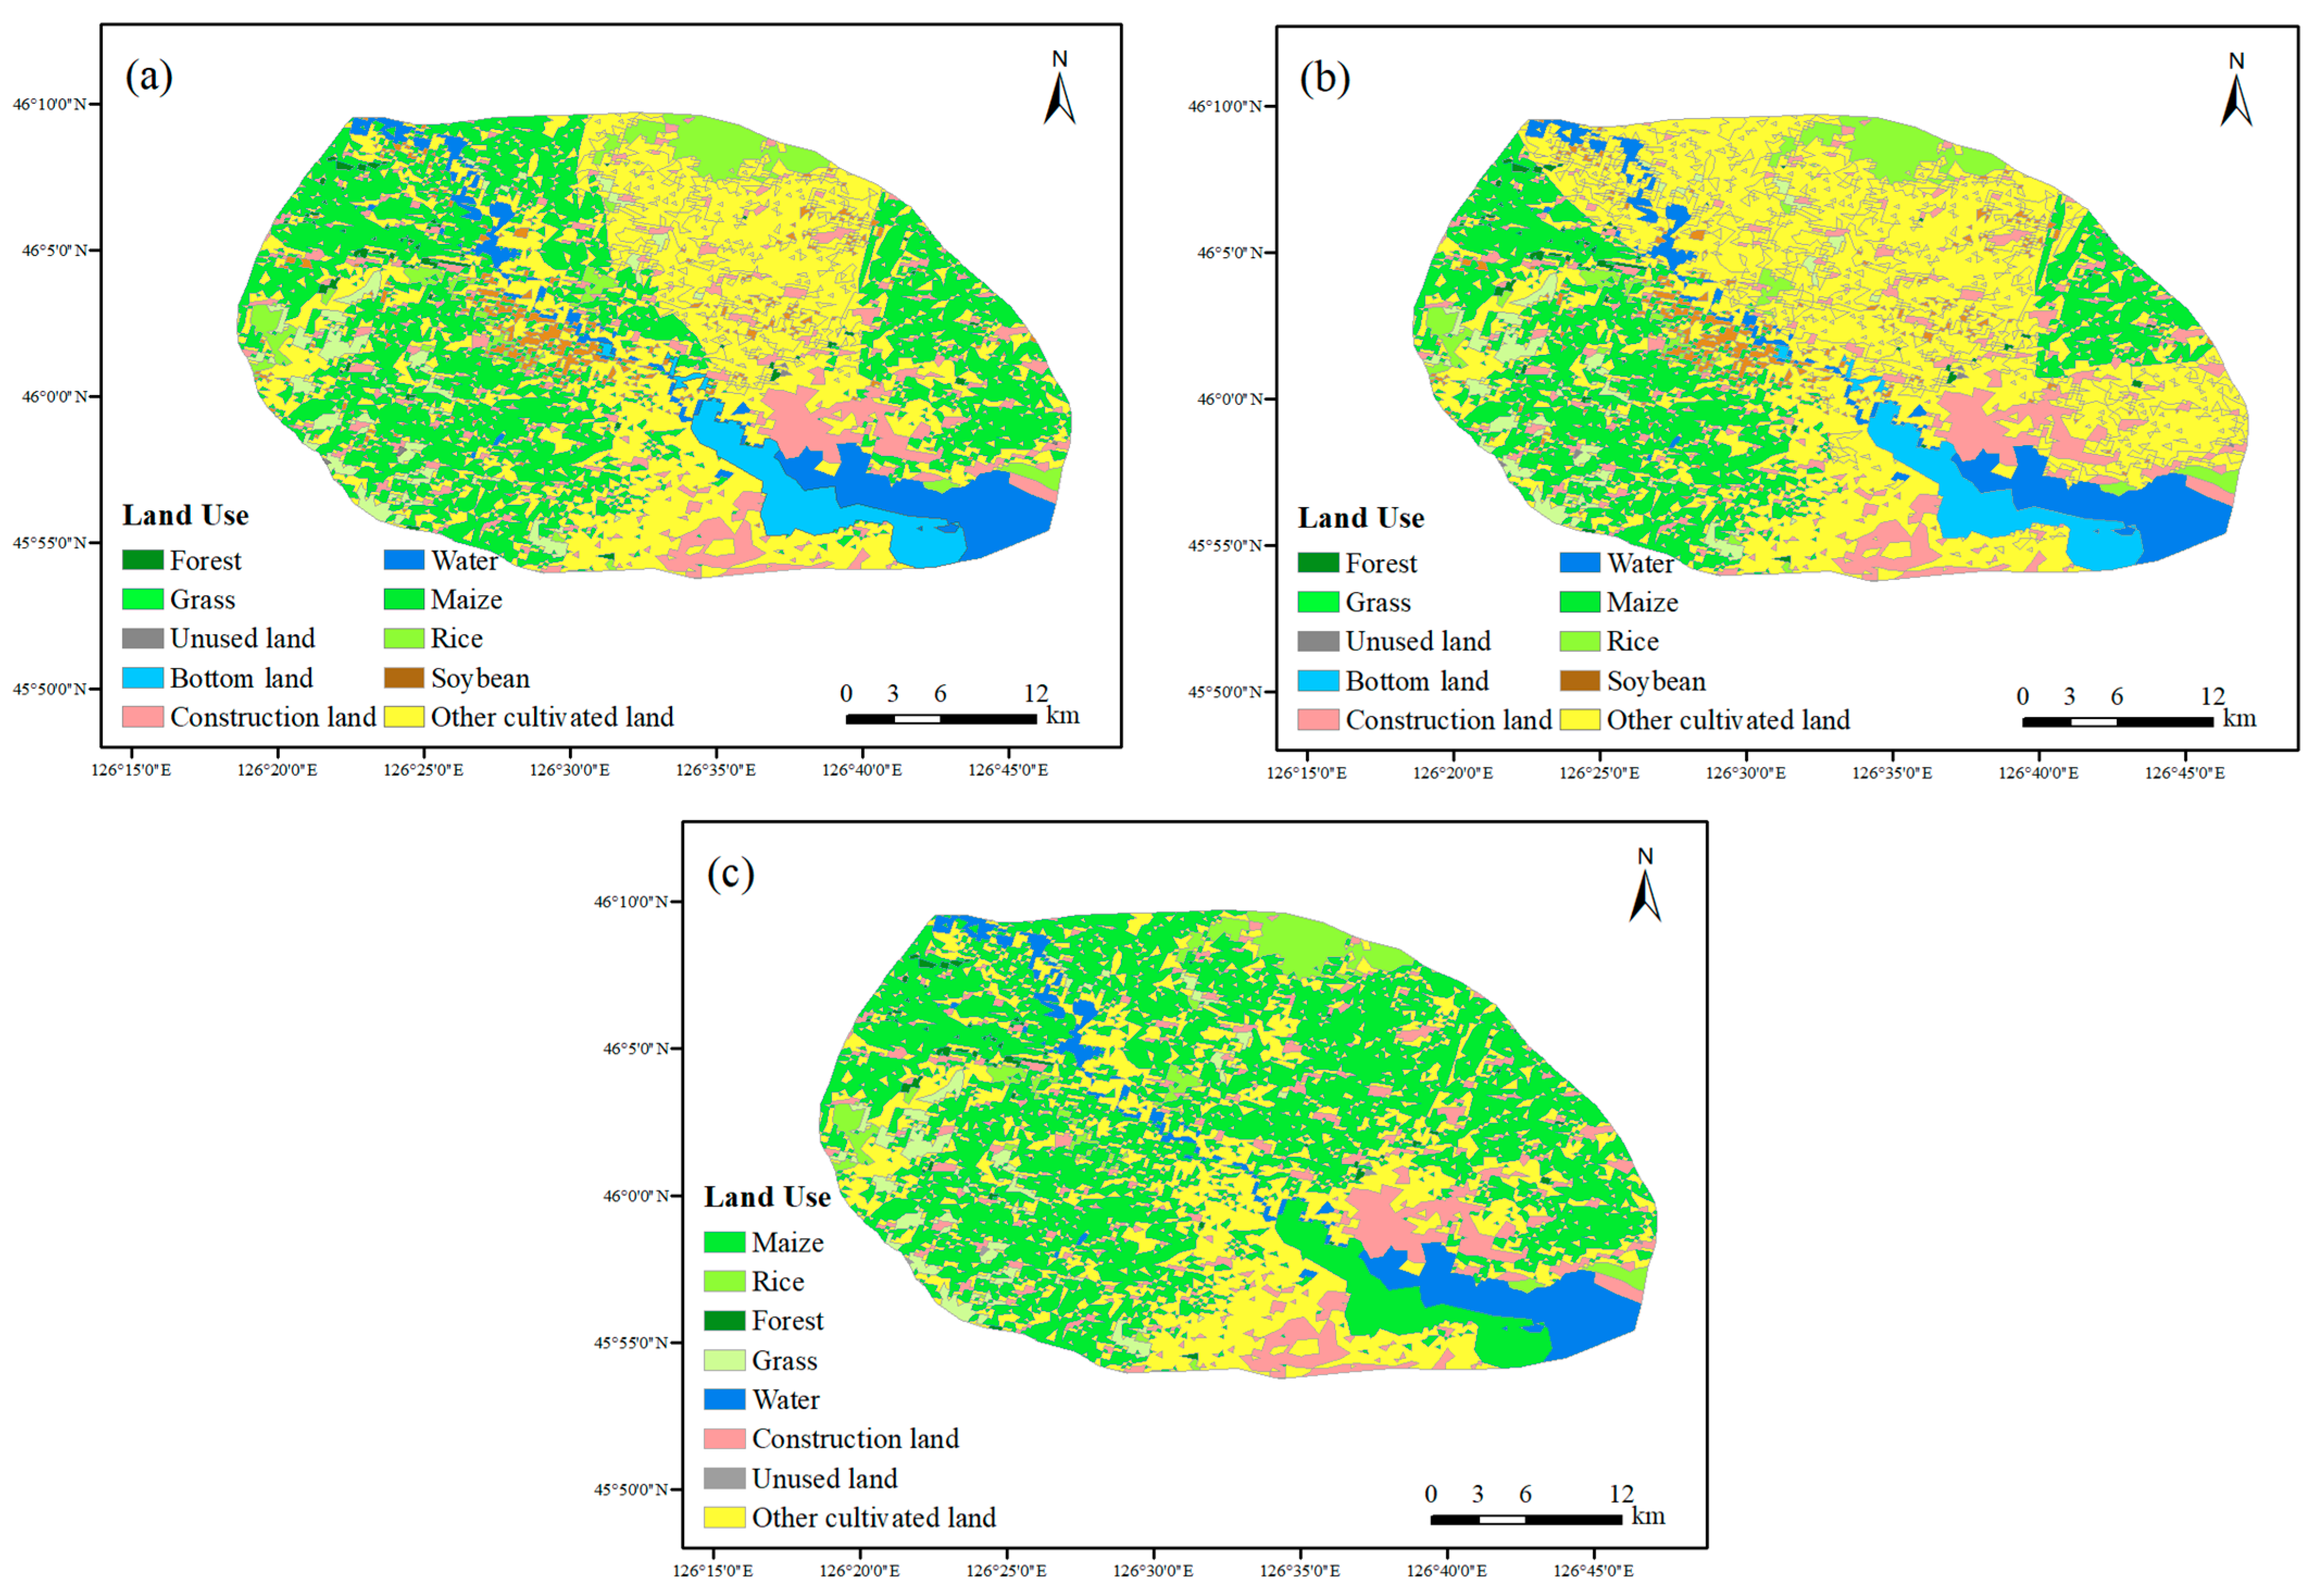
3.1. Land-Use Interpretation Results

The land-use types of the Hulan River Basin included cultivated land, forest, grassland, water area, construction land, unused land, and bottomland. Among them, the unused land was mainly a swamp. According to the actual crop structures, cultivated land was subdivided into maize, rice, soybeans, and other cultivated land. The interpretation results of three terms are displayed in Figure 3. The river channel at the outlet into the Songhua River was gentle and rich in water. From 2010 to 2015, construction land was mostly distributed on the north bank. After 2015, the area of construction land increased across the river.
Table 2 demonstrates the land-use area and proportion in the Hulan River Basin from 2010 to 2020. The main land-use type was maize, with an average proportion of 47.5%, while 2015 emerged victorious with a proportion of 50.9%. Other cultivated land ranked the next accounting for an average of 26.0%. The average proportion of rice and soybean was less than 3% in the study period. As for forest, grassland, water area, construction land, unused land, and beach land, the average took up less than 10% over the ten years. The area of water area and construction land experienced an increasing trend, while the unused land and beach land showed the opposite.
Table 3 demonstrates the dynamic degree of land-use changes in the Hulan River Basin from 2010 to 2020 indicating the speed of the changes. In the first phase, soybean varied with the fastest degree of −11.4%. Maize and other cultivated land ascended by nearly 2% while rice descended by 1.8%. Concerning the phase 2015 to 2020, unused land increased remarkably to 242%. Water area, other cultivated land, and soybeans went up by more than 20% with the compromise of beach land decreasing. On the other hand, maize changed by −3.6% degree because of the policy “Structural Adjustment of Maize in the Sickle Bend Area” by the Ministry of Agriculture.
According to the land-use transfer matrix from 2010 to 2015 (Figure 4a), the largest transfer land-use type was other cultivated land with a total area of 66.6 km2, of which 91% was transferred to maize. Maize contributed mainly to other cultivated land for 41.5 km2, with the following land-use types, soybeans, grassland, and beach land. The largest transferred area was maize, with a total area of 90.8 km2, of which 66% came from other cultivated land. From 2015 to 2020 (Figure 4b), other cultivated land received a new 161.1 km2 of which 69% came from maize. Maize transferred out a total of 106.2 km2, of which 75% was transferred to other cultivated land. This indicates that the conversion between maize and other cultivated land was relatively easier than other types. Therefore, priority to the conversion between other cultivated land and maize could be considered in future scenario assumptions.
To sum up, the transfer matrix results could provide a theoretical basis for the subsequent scenario assumptions. Other cultivated land could be the first choice to become maize with soybean and beach land following closely in the Hulan River Basin.

3.2. Response Mechanism of Water Hydrology and Quality to Land-Use Changes

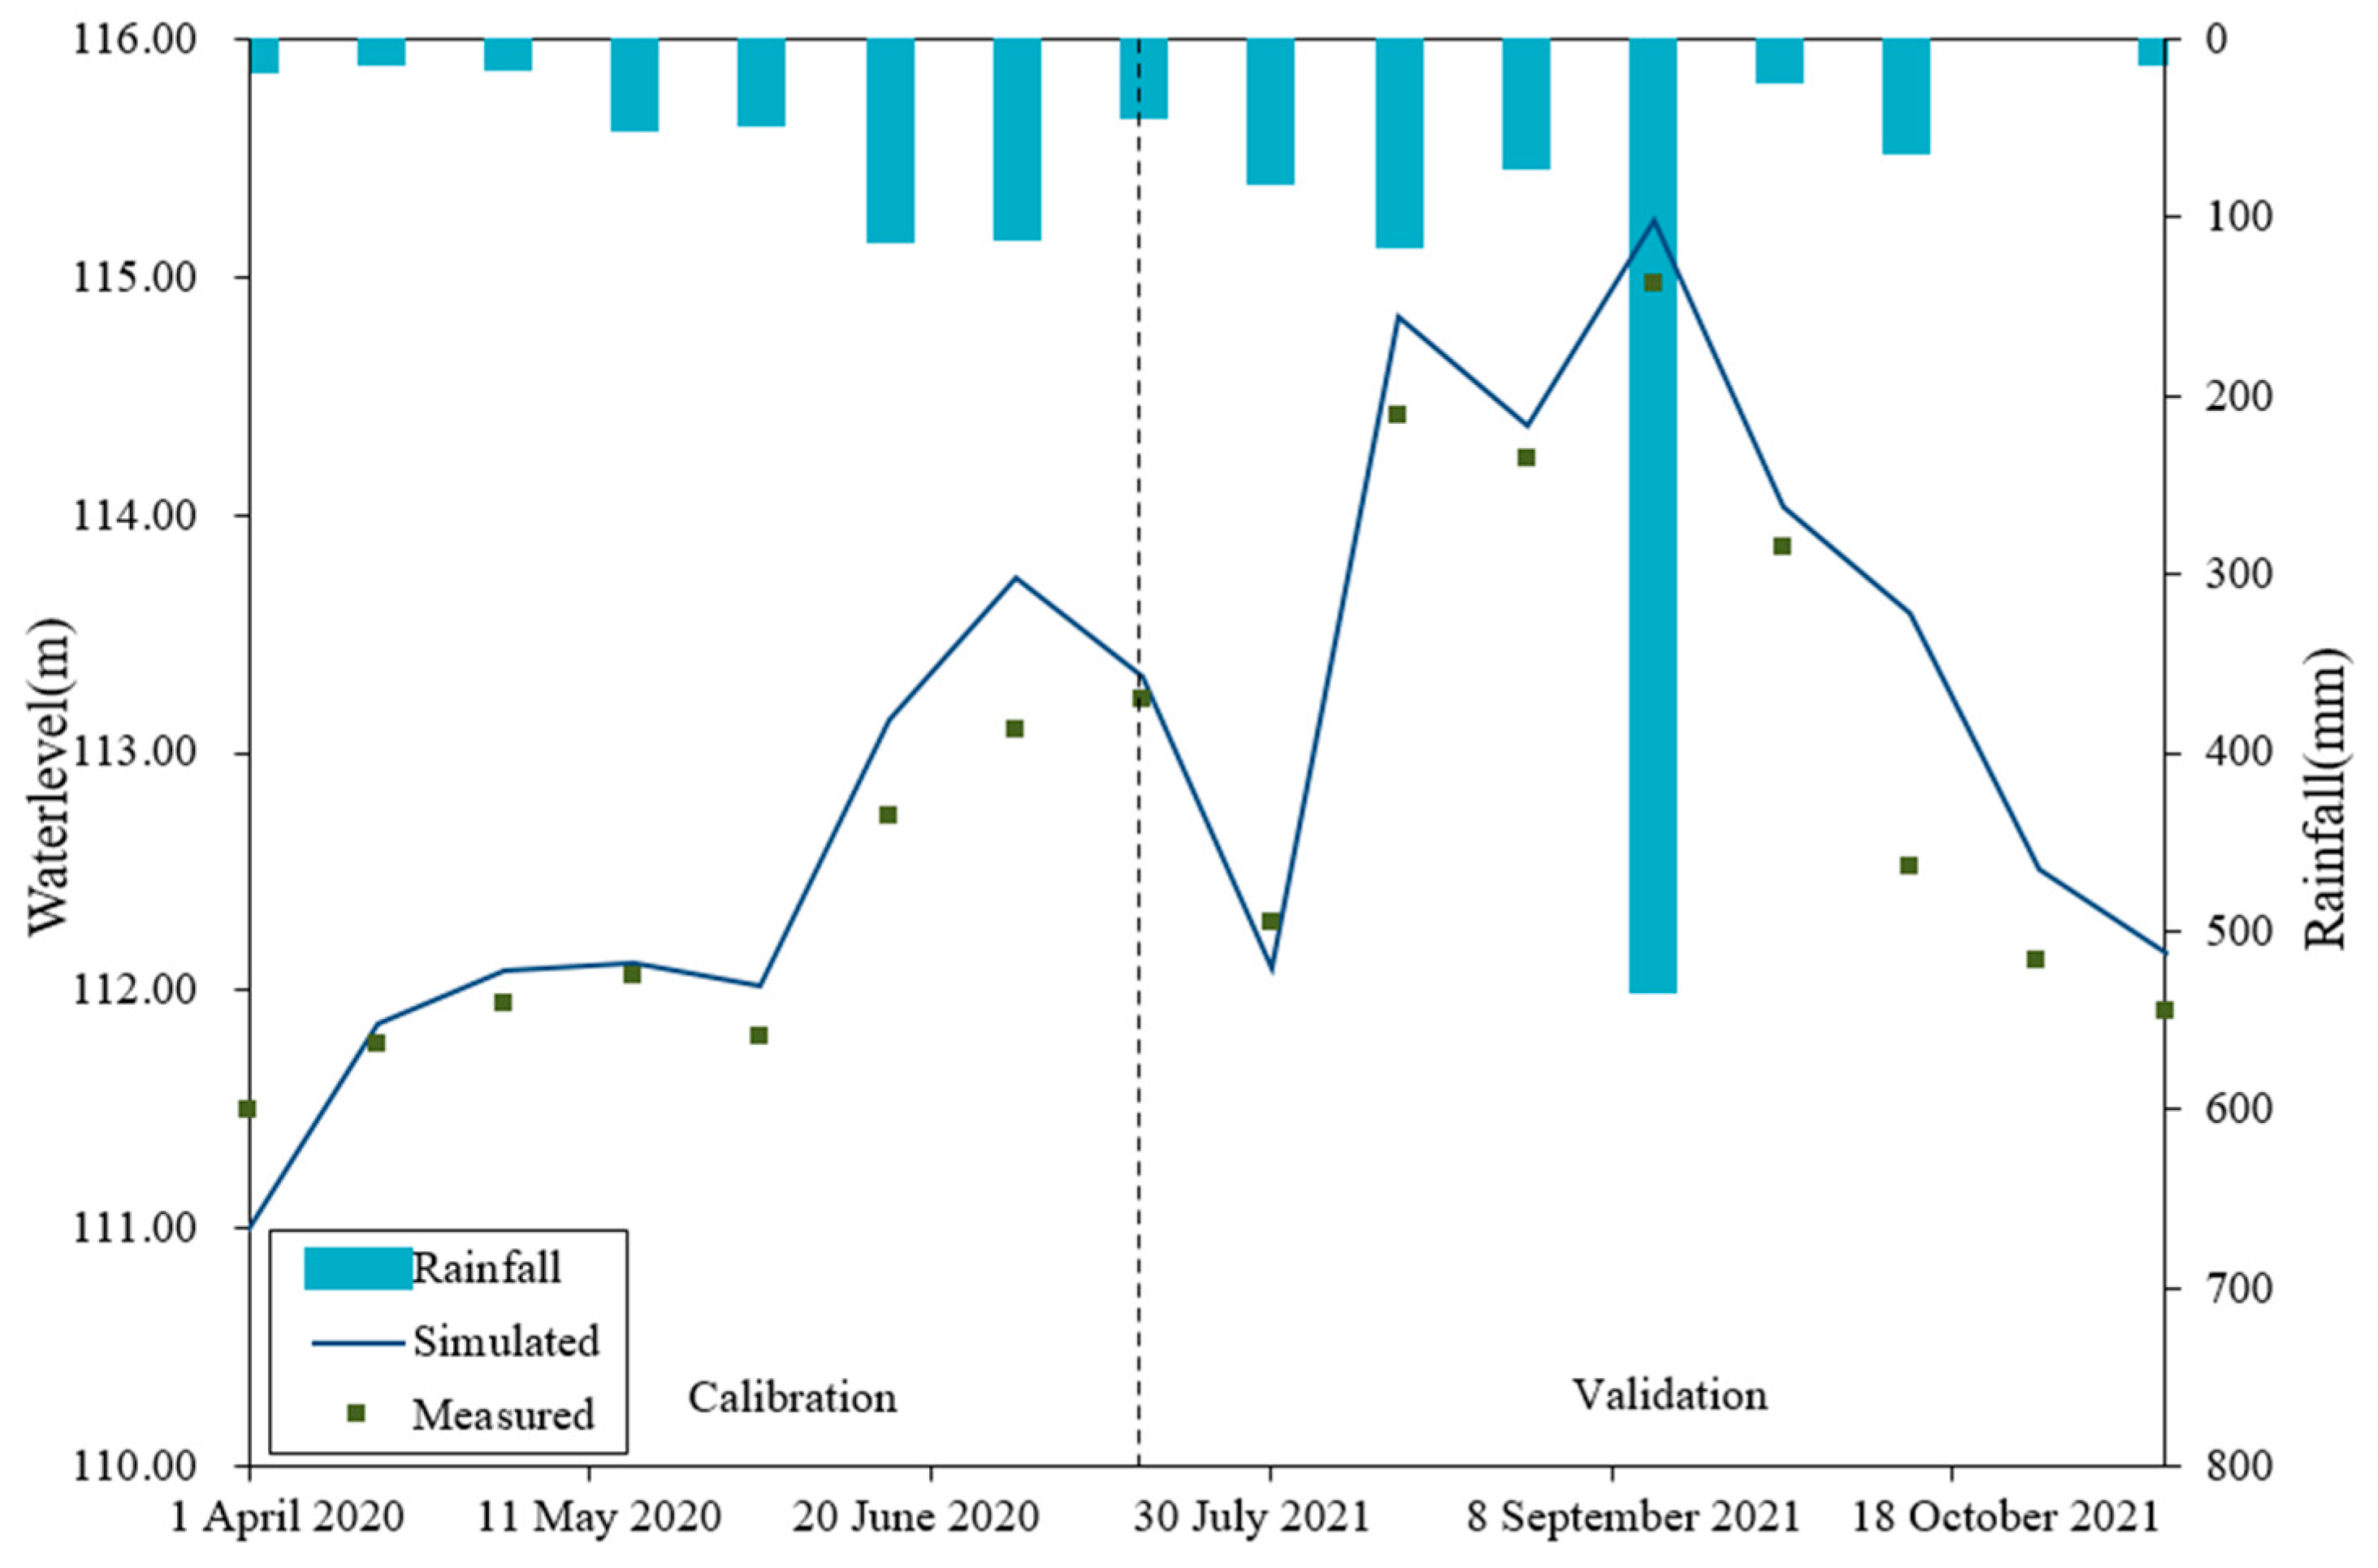
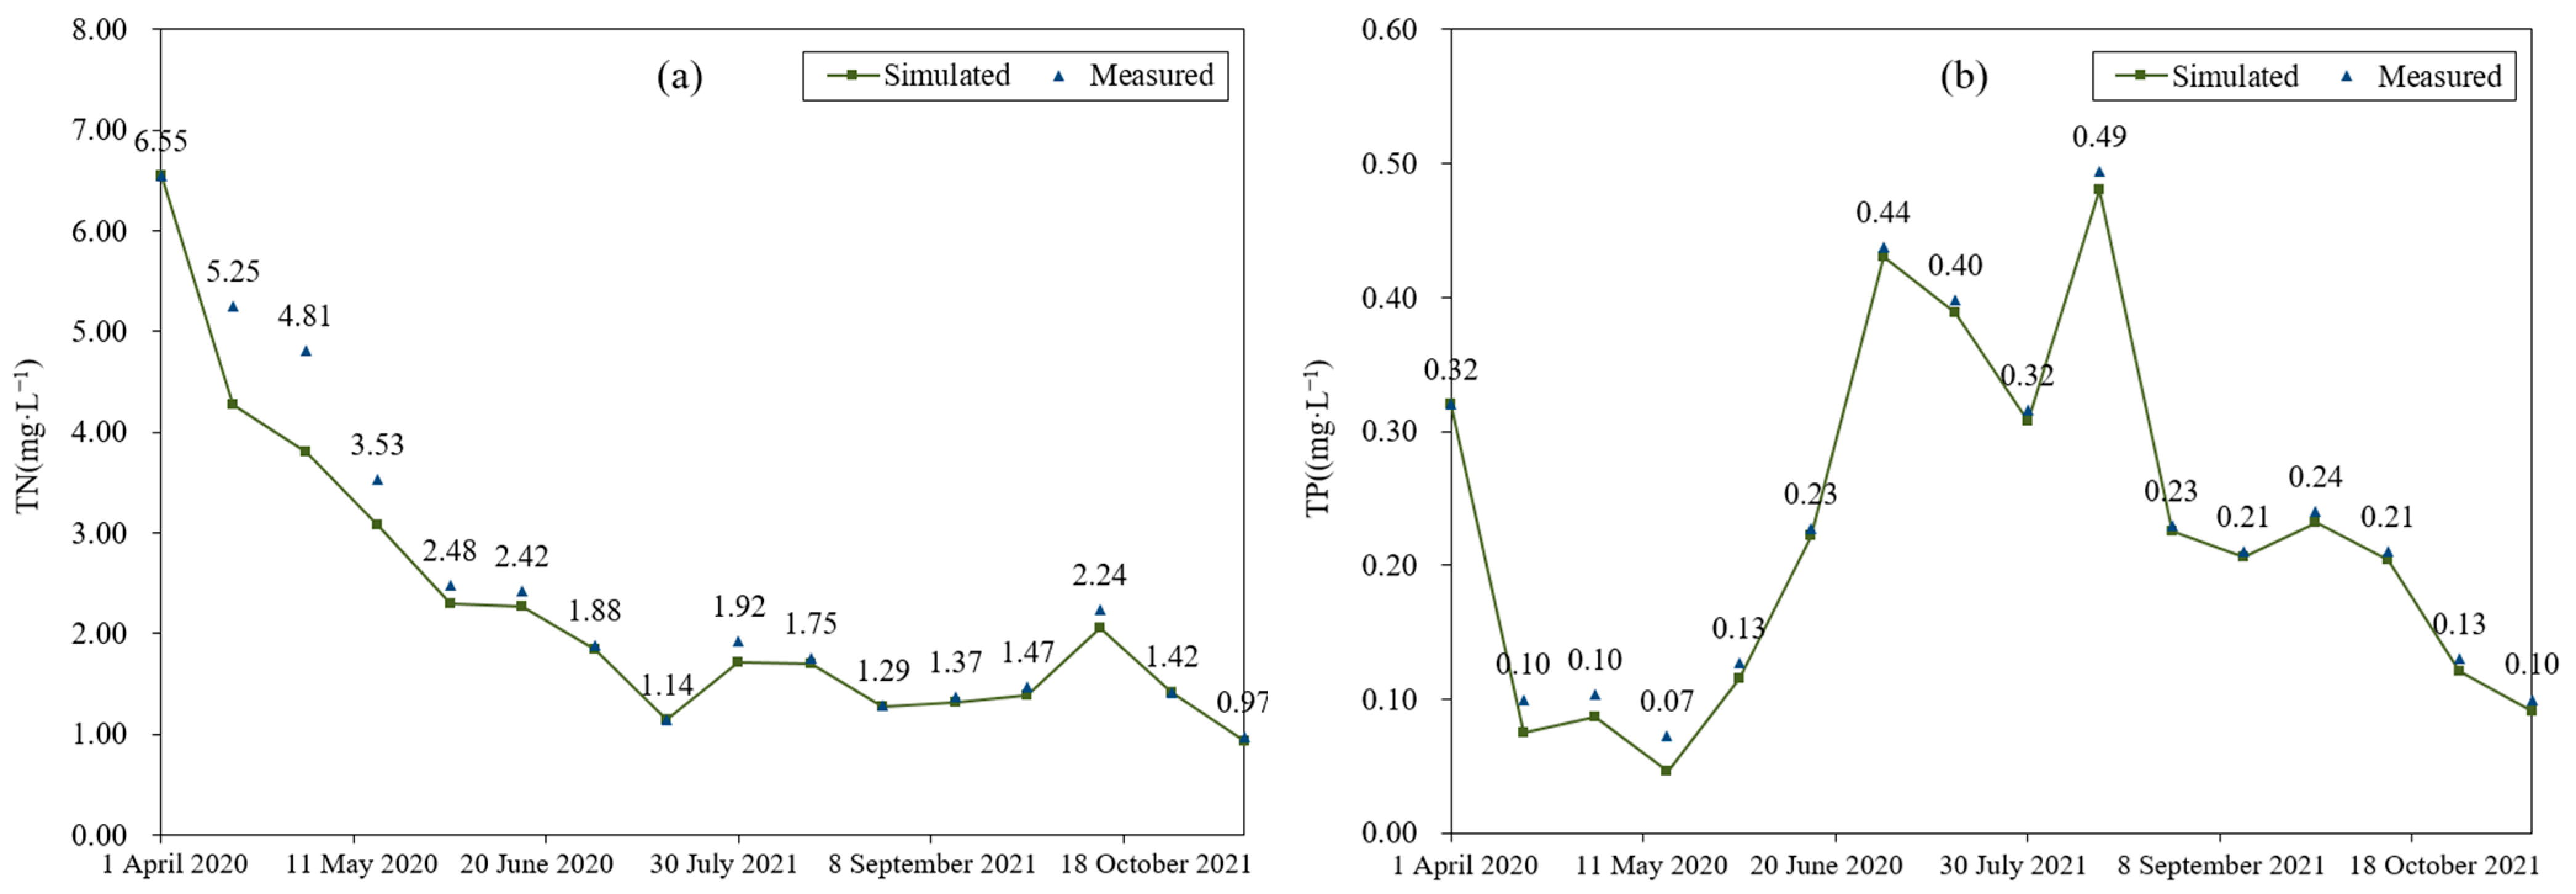
3.2.1. Water Hydrology and Quality Simulation

Calibration period data of the Hulan hydrological station was selected from 1 April 2020 to 15 July 2020, and the verification period was set from 16 July 2020 to 12 November 2020 in the Hulan River Basin. Through parameter adjustment, the final simulated and measured water level values are shown in Figure 5.
The Nash coefficient of the Hulan hydrodynamic model was 0.79 and R2 was 0.93 in the calibration period. Those of the validation period were 0.90 and 0.92 respectively. Nash coefficients were >0.5 and R2 > 0.6, which indicated that the hydrodynamic model of the Hulan River was credible and could reflect the real hydrodynamic situation.
As for the water quality, the simulation was based on the hydrodynamic results. The reliability was evaluated by PBIAS (position bias) evaluation index. The smaller the PBIAS was, the smaller the deviation between the measured value and the simulated value existed. The water quality model could reflect the actual results if PBIAS is less than 25% [30].
Figure 6 showed the comparison between the simulated and measured values of TN and TP at the outlet of the Hulan River. The PBIAS index of TN and TP were calculated to be 11.03% and 5.90%, respectively, indicating that the simulation effect was good and could accurately reflect the actual water quality change.
In the simulation period, the TN content exceeded the V. class of surface water quality standard. As the ice cover period of the Hulan River ended in April, the river flow increased resulting in the TN content decreasing rapidly due to acceleration of pollutants attenuation and diffusion. The content began to decrease slightly when it came to August because the water flow increased during the wet season. After October, the dry season caused the TN content to grow up which was not conducive to self-purification of the water body. Referring to the TP content, it performed better than the class IV water quality of surface water. The TP content presented the contrary trend compared to TN. The content of phosphorus in the water body mainly came from the bottom sediment release, affected obviously by temperature. The higher the temperature was, the faster the release speed appeared. The temperature plummeted after November in the study area leading to a decrease in the phosphorus content.

3.2.2. Impact of Land-Use Changes on TN and TP Load

Based on the MIKE-SHE model simulation results in the Hulan River Basin in 2010, 2015, and 2020, the Pearson correlation analysis between land-use changes and TN as well as TP load was obtained (Table 4).
There was a very significant positive correlation between cultivated land change and TN and TP load (p = 0.805 **, 0.865 **), the same principle appeared in construction land type. There was a very significant negative correlation between forest land change and the pollutants (p = −0.860 **, −0.855 **). There was no significant correlation regarding the rest land-use types.
In conclusion, the increase of cultivated land and construction land would lead to the TN and TP loads rising. While the forest land area expanding would reduce the TN and TP loads in the watershed.
Further effort was made to the extent of crop structures. The Pearson correlation analysis was illustrated in Table 5. There was a very significant positive correlation between the changes in maize area and TN and TP loads (p = 0.861 **, 0.914 **). The other kind of cultivated land area exerted no significant correlation.
Multiple linear regression analysis was conducted to reveal the quantitative relations between crop structures and the pollutants load. The main indexes are shown in Table 6.
The results stated clearly that maize would have a significant positive impact on TN and TP, while rice and soybean would not have a significant impact. The area of maize in the Hulan River Basin accounted for the largest proportion. Planting maize requires a large amount of fertilization and topdressing of nitrogen fertilizer. Nitrogen fertilizer emission in Northeast China increased the risk of nonpoint source pollution of surface water and groundwater [31]. Other cultivated land in the Hulan River Basin was mainly cabbage and potato, and the average amount of fertilization usage was relatively small. The research results of the impact of crop structure changes on nonpoint source pollution would provide a theoretical basis for subsequent land-use scenario hypotheses.

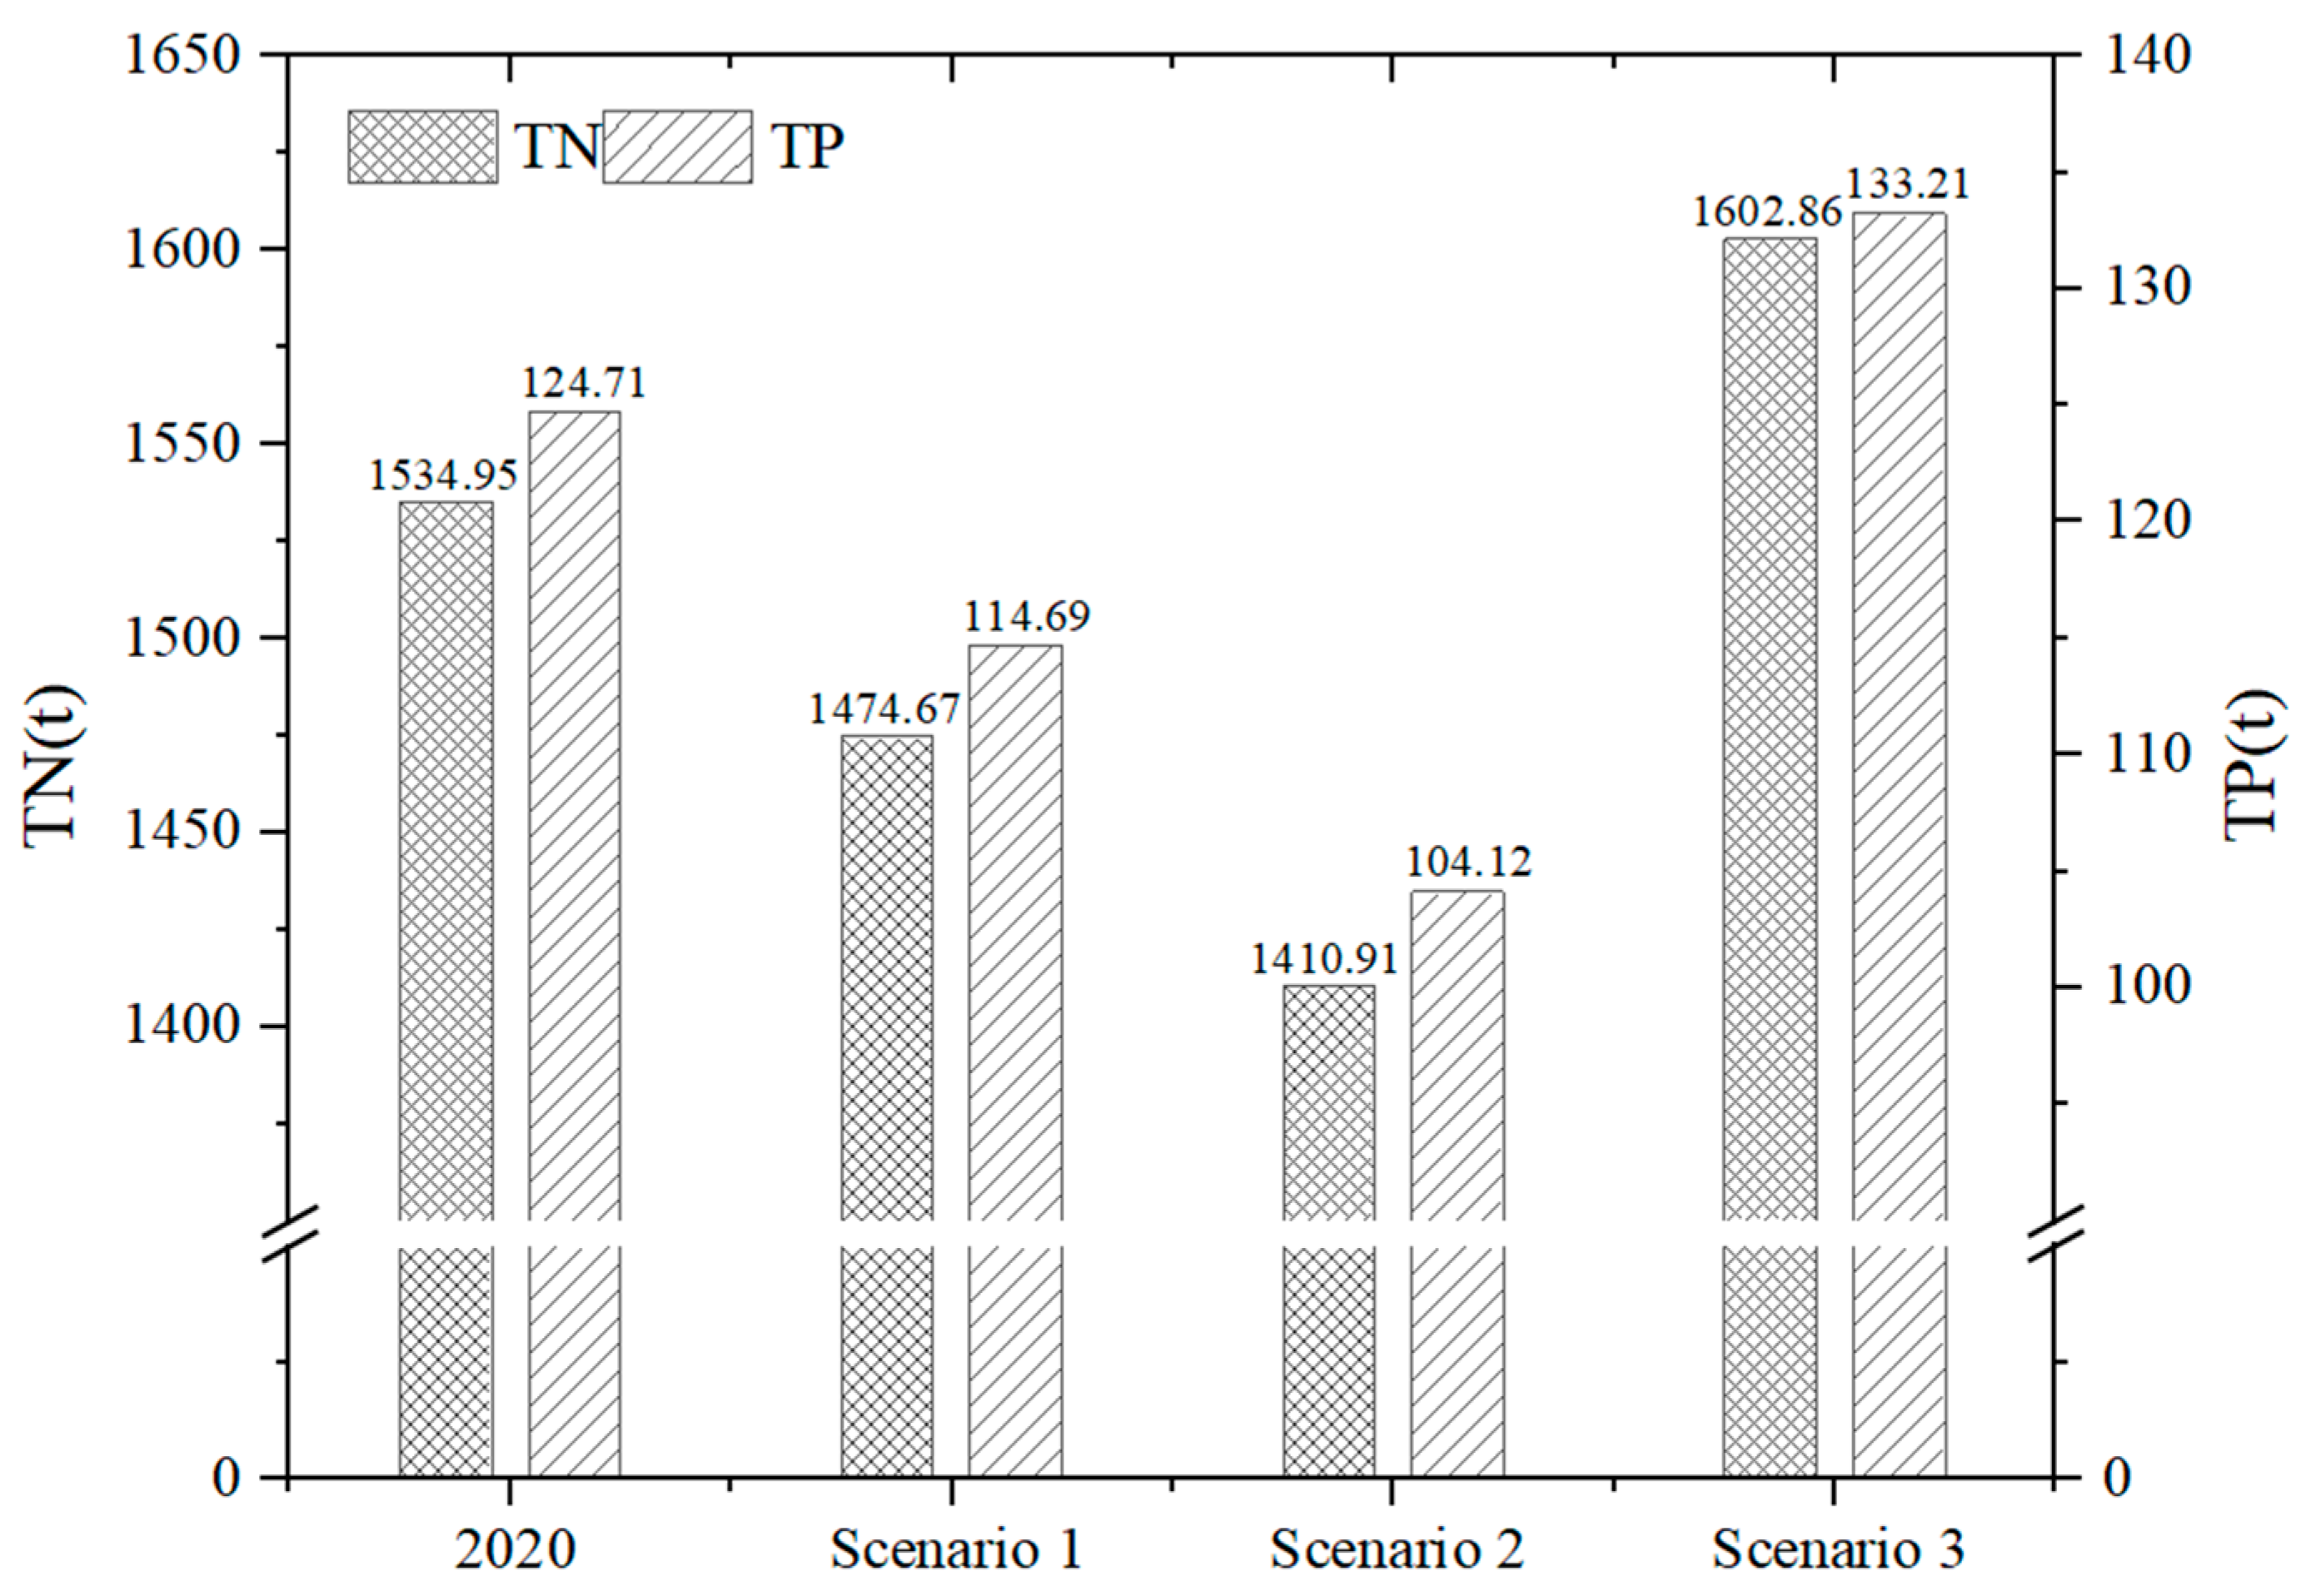
3.3. Land-Use Scenario Assumptions in the Hulan River Basin

In order to reasonably speculate the impact of land-use changes on ethanol raw material planting area in the future, three scenarios were set up in the Hulan River Basin. Land-use scenario assumption patterns mainly considered policy constraints, water quality constraints, and economic benefit constraints, among which water quality constraints are referred to as the relation coefficients in Section 3.2.2.
In accordance with the provisions of the Ministry of Agriculture on appropriately reducing the maize planting proportion in the “sickle bend area”, the Harbin government proposed in 2017 to cut down food crops and adjust the agricultural planting structure with increasing vegetable cash crops. Maize needed to be transferred to other types under the policy frame. Since the increase of maize area had a negative impact on the water quality, while the increase of other cultivated land had no significant impact, the scenario hypothesis of replacing maize with other cultivated land could be set under the water quality constraints. According to the results of a previous loss risk assessment of the Hulan River Basin [30], the maize area located in a high-risk loss area of nitrogen and phosphorus was set to be converted to other cultivated land. Scenario 1 is displayed in Figure 7a.
The lower limit value of reducing the area of maize based on Scenario 1 must be determined to ensure food security. Heilongjiang Province was one of the main grain-producing areas in China. The remaining maize field should guarantee the grain share per capita. The total population was 154 thousand in the basin. The FAO stipulated that the red line of food security share per capita was 400 kg/person, assuming that maize accounted for 1/3, which was 133 kg/person. Combined with the maize yield per unit area (7316 kg/hm2) in 2020, the lowest threshold of maize area could be calculated as 186.80 km2. For the spatial aspect, maize areas in medium and high-risk loss areas of nitrogen and phosphorus were selected to be converted to other cultivated land. Scenario 2 is exhibited in Figure 7b.
Maize was the main raw material for the production of fuel ethanol in the Hulan River Basin. Another scenario was set for the preparation of vigorous development in the future. The maize planting area may further increase by the exchange of soybean and beach land. In order to reduce the impact of land-use change on water quality, the extreme scenario of all soybeans and beach land transformed into maize land was chosen. Scenario 3 is explored in Figure 7c.
Table 7 shows the land-use changes under the three scenarios.
Taking the land-use distribution under the three scenarios into the validated hydrological model, the TN loads at the basin outlet were 1474.67 tons, 1410.91 tons, and 1602.86 tons, respectively. Meanwhile, the TP loads were 114.69 tons, 104.12 tons, and 133.21 tons (Figure 8). The results revealed when the maize area was cut off by 24%, the TN and TP loads diminished by 3.93% and 8.04%. When the lowest threshold appeared, the pollution load sustained went down by 8.67% and 16.51%. For the last scenario, the development of maize fuel ethanol could be companied with the compromise of the quality of the water environment. The nonpoint source pollution in the basin was mainly nitrogen, and the TN load was much higher than TP. Maize occupied the largest area in the dry land of Northeast China, and its demand for nitrogen is higher than that of rice and other food crops. In addition, the utilization rate of the chemical fertilizer of northeast maize was low, which exacerbated the risk of nitrogen and phosphorus loss. This conclusion was similar to the research results of Li et al. [32]. At present, there are few studies on the response mechanism of water quality to agricultural land-use change in typical maize fuel ethanol raw material planting areas. Cui studied the response mechanism of water quality in cassava ethanol raw material planting area to agricultural land-use change in the south of China [33]. The results showed that the change in cassava planting structure had no significant effect on the water quality in the planting area. Jiang found that the nonpoint source load of the watershed where sweet potatoes were planted was less than that of the basin where maize was planted [34]. The nonpoint source pollution load of maize ethanol raw material planting area in Northeast China is greater than that of cassava ethanol raw material planting area in South China because the demand for fertilizer of maize is much greater than that of cassava. The results are similar to those of Wang. Wang found that the higher the amount of fertilizer, the higher the risk of nonpoint source pollution in Northeast China, and the higher the risk of nonpoint source pollution in South China [35]. The application amount of nitrogen fertilizer in Northeast China is 1.2 times that of the south, and the application amount of phosphorus fertilizer is 3.7 times that of the south, resulting in a much higher nitrogen and phosphorus load in Northeast China than in the south [36].
To sum up, on the premise of ensuring food security and environmental benefits, appropriately reduce of the maize planting area should be carried out in Northeast China. Agricultural policies were required to weaken the nonpoint source pollution influence like reasonable reclamation of marginal land, improvement of fertilizer utilization, or adoption of rotation and intercropping. With regard to the fuel ethanol development, it was eager to improve the conversion efficiency and look for cheaper non-grain ethanol raw materials. Therefore, the state should offer more aid to provide agricultural and energy incentives for fuel ethanol production.

4. Conclusions

This study selected a typical fuel ethanol planting area in Northeast China to explore the land-use changes in recent years. Combined with the typical crop structure changes in the local area, the response mechanism of water quality was revealed using the distributed hydrological model. Based on the quantitative relation coefficients, scenarios with the carbon neutralization vision were carried out to forecast the nonpoint source pollutants of the river.
(1)
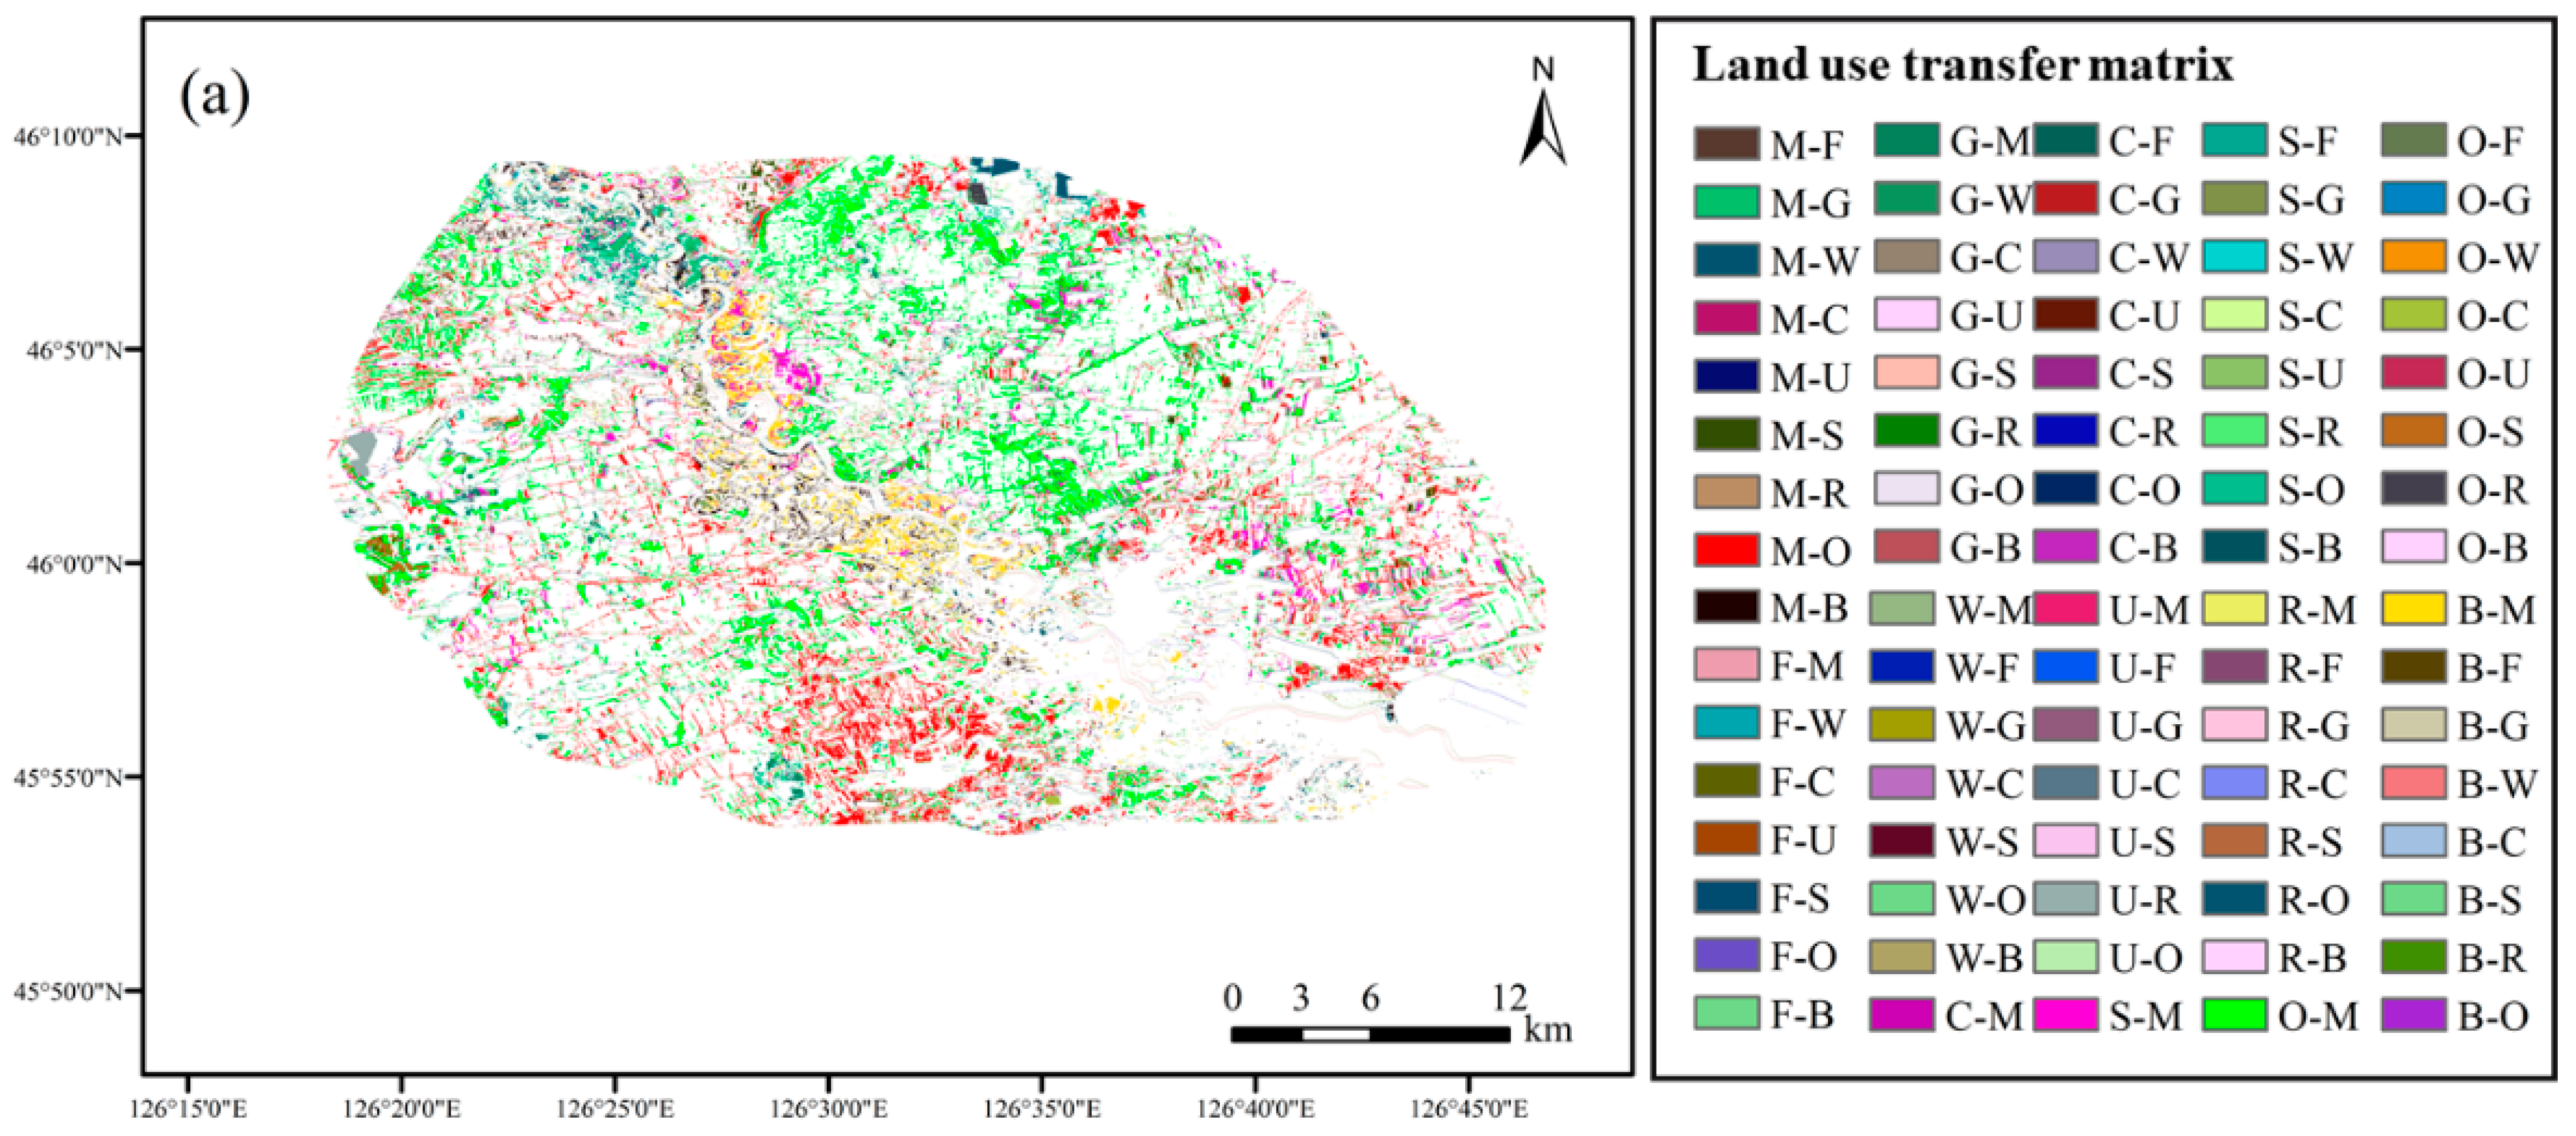
The main land-use type in the Hulan River Basin was maize but it had decreasing trend due to policy regulation. From the land-use transition matrix, the conversion between maize and other cultivated land was the easiest which gave a case principle for the scenario’s assumption setting.
(2)
The increase of cultivated land and construction land would lead to the TN and TP loads rising. While the forest land expending would reduce TN and TP load in the watershed. As for the crop structures, maize would have a significant positive impact on TN and TP, while rice and soybean would not have a significant impact.
(3)
The decrease of maize area in the Hulan River Basin was beneficial to reduce the nonpoint source pollution. The maximum decrease area should be 187 km2. If it continued to decline, it could put a negative impact on food safety problems.
In summary, the maize planting area had an important influence on NPS pollution in the Hulan River Basin, which was not suitable for the vigorous expansion of fuel ethanol. The threshold for maize extension was suggested after the scenario analysis. To realize the carbon neutralization goal, research on the second- and third-generation fuel ethanol should be pushed instead of maize. This study could provide a scientific basis for the land management of agricultural land in Northeast China, and could also guide the planning and layout of raw material planting in other fuel ethanol raw material planting areas.

Author Contributions

Conceptualization, G.C. and L.D.; Funding acquisition, L.D.; Investigation, G.C., X.B. and H.W.; Methodology, G.C., P.W. and L.D.; Software, X.B.; Supervision, P.W.; Validation, X.B. and S.W.; Visualization, X.B., H.W. and S.W.; Writing—original draft, G.C.; Writing—review & editing, P.W. and L.D. All authors have read and agreed to the published version of the manuscript.

Funding

This research was financially supported by the National Natural Science Foundation of China (Grant No. 41861124004).

Institutional Review Board Statement

Not applicable.

Informed Consent Statement

Not applicable.

Data Availability Statement

The data presented in this study are available on request from the corresponding author.

Conflicts of Interest

The authors declare no conflict of interest.

References

  1. Perišić, M.; Barceló, E.; Dimic-Misic, K.; Imani, M.; Spasojević, V. The Role of Bioeconomy in the Future Energy Scenario: A State-of-the-Art Review. Sustainability 2022, 14, 560. [Google Scholar] [CrossRef]
  2. Sharma, S.; Kundu, A.; Basu, S.; Shetti, N.P.; Aminabhavi, T. Sustainable environmental management and related biofuel technologies. J. Environ. Manag. 2020, 273, 111096. [Google Scholar] [CrossRef]
  3. Cabrera-Jiménez, R.; Mateo-Sanz, J.M.; Gavaldà, J.; Jiménez, L.; Pozo, C. Comparing biofuels through the lens of sustainability: A data envelopment analysis approach. Appl. Energy 2022, 307, 118201. [Google Scholar] [CrossRef]
  4. Jiao, J.; Li, J.; Bai, Y. Uncertainty analysis in the life cycle assessment of cassava ethanol in China. J. Clean. Prod. 2019, 206, 438–451. [Google Scholar] [CrossRef]
  5. Ambaye, T.G.; Vaccari, M.; Bonilla-Petriciolet, A.; Prasad, S.; van Hullebusch, E.; Rtimi, S. Emerging technologies for biofuel production: A critical review on recent progress, challenges and perspectives. J. Environ. Manag. 2021, 290, 112627. [Google Scholar] [CrossRef] [PubMed]
  6. Cameron, H.; Qi, Y.; Nicholas, S.; Bob, W.; Xie, C.; Dimitri, Z. Towards carbon neutrality and China’s 14th Five–Year Plan: Clean energy transition, sustainable urban development, and investment priorities. Environ. Sci. Technol. 2021, 8, 100130. [Google Scholar] [CrossRef]
  7. Austin, K.G.; Jones, J.P.H.; Clark, C.M. A review of domestic land use change attributable to U.S. biofuel policy. Renew. Sustain. Energy Rev. 2022, 159, 112181. [Google Scholar] [CrossRef]
  8. Wagner, P.D.; Bhallamudi, S.M.; Narasimhan, B.; Kantakumar, L.N.; Sudheer, K.P.; Kumar, S.; Schneider, K.; Fiener, P. Dynamic integration of land use changes in a hydrologic assessment of a rapidly developing Indian catchment. Sci. Total Environ. 2016, 539, 153–164. [Google Scholar] [CrossRef]
  9. Nguyen, T.T.; Keupers, I.; Willems, P. Conceptual river water quality model with flexible model structure. Environ. Model. Softw. 2018, 104, 102–117. [Google Scholar] [CrossRef]
  10. Cui, G.; Wang, X.; Li, C.; Li, Y.; Yan, S.; Yang, Z. Water use efficiency and TN/TP concentrations as indicators for watershed land-use management: A case study in Miyun District, north China. Ecol. Indic. 2018, 92, 239–253. [Google Scholar] [CrossRef]
  11. Yan, S.; Wang, X.; Cai, Y.; Li, C.; Yan, R.; Cui, G.; Yang, Z. An Integrated Investigation of Spatiotemporal Habitat Quality Dynamics and Driving Forces in the Upper Basin of Miyun Reservoir, North China. Sustainability 2018, 10, 4625. [Google Scholar] [CrossRef] [Green Version]
  12. Fan, M.; Shibata, H. Simulation of watershed hydrology and stream water quality under land use and climate change scenarios in Teshio River watershed, northern Japan. Ecol. Indic. 2015, 50, 79–89. [Google Scholar] [CrossRef]
  13. Camara, M.; Jamil, N.R.; Abdullah, A.F.B. Impact of land uses on water quality in Malaysia: A review. Ecol. Processes 2019, 8, 10. [Google Scholar] [CrossRef]
  14. Gu, R.; Sahu, M.K.; Jha, M.K. Simulating the impacts of bio-fuel crop production on nonpoint source pollution in the Upper Mississippi River Basin. Ecol. Eng. 2015, 74, 223–229. [Google Scholar] [CrossRef]
  15. Wu, M.; Demissie, Y.; Yan, E. Simulated impact of future biofuel production on water quality and water cycle dynamics in the Upper Mississippi river basin. Biomass Bioenergy 2012, 41, 44–56. [Google Scholar] [CrossRef]
  16. Ouyang, W.; Hao, X.; Wang, L.; Xu, Y.; Tysklind, M.; Gao, X.; Lin, C. Watershed diffuse pollution dynamics and response to land development assessment with riverine sediments. Sci. Total Environ. 2019, 659, 283–292. [Google Scholar] [CrossRef]
  17. Mat, S.; Khoo, K.; Chew, K.; Show, P.; Chen, W.; Nguyen, P. Sustainability of the four generations of biofuels—A review. Int. J. Energy Res. 2020, 44, 9266–9282. [Google Scholar] [CrossRef]
  18. Zhang, Z.; Li, G.; Zhang, Y.; Zhang, J.; Song, C.; Zhou, Y. Recommendations for green development of motor biofuel industry in China: A review. Int. J. Agric. Biol. Eng. 2020, 13, 218–225. [Google Scholar] [CrossRef]
  19. Ma, R.; Wang, X.; Li, Z.; Chen, Y.; Sui, Y.; Jiao, X. Analysis of the planting area and yield of major food crops in Heilongjiang Province. Heilongjiang Agric. Sci. 2020, 8, 96–101. Available online: https://kns.cnki.net/kcms/detail/detail.aspx?FileName=HLJN202008024&DbName=CJFQ2020 (accessed on 28 May 2022).
  20. Dai, J.; Liu, S.; Han, J.; Wan, L. Study on river quality response relationship under multi scenario change of pollution load. China Environ. Sci. 2018, 38, 776–783. Available online: https://kns.cnki.net/kcms/detail/detail.aspx?FileName=GXSL202001006&DbName=CJFQ2020 (accessed on 28 May 2022).
  21. Li, D.; Liu, G.; Li, X.; Li, R.; Wang, J.; Zhao, Y. Heavy Metal(loid)s Pollution of Agricultural Soils and Health Risk Assessment of Consuming Soybean and Wheat in a Typical Non-Ferrous Metal Mine Area in Northeast China. Sustainability 2022, 14, 2953. [Google Scholar] [CrossRef]
  22. Wang, A.; Tang, L.; Yang, D. Spatial and temporal variability of nitrogen load from catchment and retention along a river network: A case study in the upper Xin’anjiang catchment of China. Hydrol. Res. 2016, 47, 869–887. [Google Scholar] [CrossRef]
  23. Lian, Y.; Chan, I.C.; Singh, J.; Demissie, M.; Knapp, V.; Xie, H. Coupling of hydrologic and hydraulic models for the Illinois River Basin. Hydrology 2007, 344, 210–222. [Google Scholar] [CrossRef]
  24. Basu, A.; Gill, L.W.; Pilla, F.; Basu, B. Assessment of Variations in Runoff Due to Landcover Changes Using the SWAT Model in an Urban River in Dublin, Ireland. Sustainability 2022, 14, 534. [Google Scholar] [CrossRef]
  25. Yuan, Y.; Koropeckyj-Cox, L. SWAT model application for evaluating agricultural conservation practice effectiveness in reducing phosphorous loss from the Western Lake Erie Basin. Environ. Manag. 2022, 302, 114000. [Google Scholar] [CrossRef]
  26. Yazdi, M.N.; Ketabchy, M.; Sample, D.J.; Scott, D.; Liao, H. An evaluation of HSPF and SWMM for simulating streamflow regimes in an urban watershed. Environ. Model. Softw. 2019, 118, 211–225. [Google Scholar] [CrossRef]
  27. Yasarer, L.M.W.; Lohani, S.; Bingner, R.L.; Locke, M.A.; Baffaut, C.; Thompson, A.L. Index and comparison with AnnAGNPS in two Lower Mississippi River Basin watersheds. J. Soil Water Conserv. 2019, 75, 53–61. [Google Scholar] [CrossRef] [Green Version]
  28. Zhang, J.; Zhang, M.; Song, Y.; Lai, Y. Hydrological simulation of the Jialing River Basin using the MIKE SHE model in changing climate. J. Water Clim. Change 2021, 12, 2495–2514. [Google Scholar] [CrossRef]
  29. Hao, M.; Jiang, D.; Wang, J.; Fu, J.; Huang, Y. Could biofuel development stress China’s water resources. GCB Bioenergy 2017, 9, 1447–1460. [Google Scholar] [CrossRef]
  30. Cui, G.; Liu, Y.; Wang, P.; Wang, P.; Bai, X.; Wang, H.; Xu, Y.; Yang, M.; Dong, L. Distribution Characteristics and Risk Assessment of Agricultural Land Use Non-Point Source Pollution in Typical Biofuel Ethanol Planting Areas. Int. J. Environ. Res. Public Health 2022, 19, 1394. [Google Scholar] [CrossRef]
  31. Sun, C.; Chen, L.; Zhai, L.; Liu, H.; Wang, K.; Jiao, C.; Shen, Z. National assessment of nitrogen fertilizers fate and related environmental impacts of multiple pathways in China. J. Clean. Prod. 2020, 277, 123519. [Google Scholar] [CrossRef]
  32. Li, H.; Zhang, W.; Zhang, F.; Du, F.; Li, L. Chemical fertilizer use and efficiency change of main grain crops in China. J. Plant Nutr. Fertil. 2010, 16, 1136–1143. [Google Scholar]
  33. Cui, G.; Bai, X.; Wang, P.; Wang, H.; Wang, S.; Dong, L. Mechanism of Response of Watershed Water Quality to Agriculture Land-Use Changes in a Typical Fuel Ethanol Raw Material Planting Area—A Case Study on Guangxi Province, China. Int. J. Environ. Res. Public Health 2022, 19, 6499. [Google Scholar] [CrossRef]
  34. Jiang, J.; Li, J.; Wang, Z.; Wu, X.; Lai, C.; Chen, X. Effects of different cropping systems on ammonia nitrogen load in a typical agricultural watershed of South China. J. Contam. Hydrol. 2022, 246, 103963. [Google Scholar] [CrossRef]
  35. Wang, M.; Ma, L.; Strokal, M.; Ma, W.; Liu, X.; Kroeze, C. Hotspots for Nitrogen and Phosphorus Losses from Food Production in China: A County-Scale Analysis. Environ. Sci. Technol. 2018, 52, 5782–5791. [Google Scholar] [CrossRef] [Green Version]
  36. Huang, J.; Xu, C.; Ridoutt, B.G.; Wang, X.; Ren, P. Nitrogen and phosphorus losses and eutrophication potential associated with fertilizer application to cropland in China. J. Clean. Prod. 2017, 159, 171–179. [Google Scholar] [CrossRef]
Figure 1. Overview of maize planting area of Hulan River Basin.
Sustainability 14 07995 g001
Figure 2. The technical route of the study.
Sustainability 14 07995 g002
Figure 3. Land use of the Hulan River Basin ((a) 2010; (b) 2015; (c) 2020).
Sustainability 14 07995 g003
Figure 4. Land-use transfer matrix of the Hulan River Basin ((a) from 2010 to 2015; (b) from 2015 to 2020) (M—maize; F—forest; G—grass; W—water; C—urban land; U—unused land; S—soybean; R—rice; O—other cultivated land; B—bottomland).
Sustainability 14 07995 g004aSustainability 14 07995 g004b
Figure 5. Measured and simulated water levels in the Hulan River Basin.
Sustainability 14 07995 g005
Figure 6. Measured and simulated TN (a) and TP (b) in the Hulan River.
Sustainability 14 07995 g006
Figure 7. The scenarios of land use ((a) Scenario1; (b) Scenario 2; (c) Scenario 3).
Sustainability 14 07995 g007
Figure 8. The TN and TP loads at the basin outlet of different scenarios.
Sustainability 14 07995 g008
Table 1. The data required in the MIKE-SHE model.
Data TypesNameData Source
Geographical dataDEM GS Cloud
Hydrological data
Water quality data
River network
River section
Discharge
Water level
TN and TP concentration
Department of Ecology and Environment of Heilongjiang Province (http://sthj.hlj.gov.cn/szxx/index_2.jhtml) (accessed on 20 July 2021)
Meteorological dataPrecipitation
Reference evapotranspiration
National Meteorological Science Data Center (http://data.cma.cn/) (accessed on 15 August 2021)
FertilizerFertilizing amount2020 National Agricultural Product Cost-benefit Data Corpus (https://www.yearbookchina.com/navibooklist-n3020013195-1.html) (accessed on 15 August 2021)
Vegetation Leaf area index
Root depth
The literature surveys
FAO (https://www.fao.org/land–water/databases–and–software/crop–information/en/) (accessed on 15 September 2021)
Soil propertiesSurface and sectional typeHarmonized World Soil Database
Table 2. Land-use area and proportion of the Hulan River Basin (km2).
TypesMaizeRiceSoybeanOther Cultivated LandForestGrassWaterConstruction LandUnused LandBottomland
2010Area/km2408.214.721.8211.75.224.010.951.63.5105.0
Proportion47.7%1.7%2.5%24.7%0.6%2.8%1.3%6.0%0.4%12.3%
2015Area/km2444.116.09.3194.34.824.611.150.42.499.5
Proportion51.9%1.9%1.1%22.7%0.6%2.9%1.3%5.9%0.3%11.6%
2020Area/km2368.432.619.6259.45.021.748.368.40.432.8
Proportion43.0%3.8%2.3%30.3%0.6%2.5%5.6%8.0%0.0%3.8%
Table 3. Dynamic degree of land-use changes in the Hulan River Basin.
MaizeRiceSoybeanOther Cultivated LandForestGrassWaterConstruction LandUnused LandBottomland
2010–20151.9%−1.8%−11.4%1.7%−0.6%0.2%0.0%−0.2%−5.4%−1.1%
2015–2020−3.6%7.4%21.2%20.7%0.7%−2.9%31.6%5.5%242.0%−16.0%
Table 4. Person correlation analysis between land-use changes and TN/TP load.
Cultivated LandForestGrassWaterConstruction LandUnused LandBottomland
TN0.805 **−0.702 **−0.569−0.3790.667 *−0.6020.382
TP0.865 **−0.664 **−0.599−0.2050.847 **−0.4480.134
** p < 0.01: the correlation was significant at the level of 0.01 (bilateral); * p < 0.05: the correlation was significant at the level of 0.05 (bilateral).
Table 5. Person correlation analysis between crop changes and TN/TP load.
MaizeRiceSoybeanOther Cultivated Land
TN0.861 **−0.458−0.129−0.253
TP0.914 **−0.538−0.098−0.350
** p < 0.01: the correlation was significant at the level of 0.01 (bilateral).
Table 6. Multiple linear regression analysis of TN and TP of different crops.
TNTP
BpBp
Maize1.8670.009 *0.1500.004 *
Rice1.6580.3940.0760.202
Soybean1.1450.2010.1430.239
Other cultivated land1.9830.1820.1230.204
R20.8860.928
FF = 7.735, p = 0.036F = 12.890, p = 0.015
* p < 0.05: the correlation was significant at the level of 0.05 (bilateral).
Table 7. Area of land-use scenarios in the Hulan River Basin (km2).
Types2020Scenario OneScenario TwoScenario Three
AreaAreaChangeAreaChangeAreaChange
Maize368.4280.1−24%187.0−50%420.814%
Rice32.632.6032.6032.60
Soybean19.619.6019.600.0−100%
Other cultivated land259.4347.6+34%440.7+70%259.40
Forest5.05.005.005.00
Grass21.721.7021.7021.70
Water48.348.3048.3048.30
Urban land68.468.4068.4068.40
Unused land0.40.400.400.40
Bottomland32.832.8032.800.0−100%
Publisher’s Note: MDPI stays neutral with regard to jurisdictional claims in published maps and institutional affiliations.

