
How to Measure Inclusion in Higher Education: An Inclusive Rating


Operations and Information Systems Management Department, Kedge Business School, 40 Avenue des Terroirs de France, 75012 Paris, France
Sustainability 2022, 14(14), 8278; https://0-doi-org.brum.beds.ac.uk/10.3390/su14148278
Submission received: 9 May 2022
/
Revised: 22 June 2022
/
Accepted: 1 July 2022
/
Published: 6 July 2022
(This article belongs to the Topic Sustainability and Universities: Their Contribution to Reach the 17th SDGs)
Abstract
:Nowadays, inclusion is a main concern whoever and wherever. Higher education and business schools have been criticized for their non-inclusion for many years. In this context, higher education has a model role to play concerning inclusion. However, there is a lack of tools to measure the inclusivity levels of institutions. Thus, it is difficult to really know if higher education is inclusive or not and in case it is needed, where they must be more inclusive. This paper proposes a new tool. This paper created an inclusivity index that provides an operational answer to assess inclusivity. This tool does not rank institutions as ranking was highly criticized. It rates the levels of inclusivity of all the stakeholders of higher education for different dimensions.
1. Introduction
Inclusivity is quickly becoming one of the most challenging current issues of higher education because of changing demographics, growth of emerging countries, geopolitical issues, new laws, and policies. The United Nations made inclusion in education a human right with article 26 of the Universal Declaration of Human Right in 1948. Moreover, to reach the sustainable development goals, higher education must contribute to goals 3 “well-being”, 5 “gender equality”, and 10 “reducing inequalities”, for example, which are linked to inclusivity. Inclusivity is also having an impact on how successful higher education is at preparing students for the society and work environment of today and tomorrow. Questions, such as: does inclusivity improve student learning [1] and does it promote excellence [2], are emerging in the field.
In addition, some higher education rankings consider inclusive elements, such as parity or internationalization, including the Financial Times (FT) or Economics (ECON) rankings. Accreditations are also looking at the subject. AACSB has published its commitment to diversity, equity, inclusion, and belonging (https://www.aacsb.edu/about-us/advocacy/diversity-and-inclusion (accessed on 30 June 2022)). EFMD has published its Global Focus magazine in partnership with GRLI in June 2022 on the theme of global responsibility (https://www.efmdglobal.org (accessed on 30 June 2022)).
In this context, to be able to track diversity and to evaluate its impact, it is necessary to measure diversity and its evolution. Based on existing work ([3]’s dashboard; [4] questionnaire), the goal is to develop an index to measure inclusivity. The development of the inclusivity index will enable higher education institutions to measure their progress on diversity; to stimulate a supportive and collaborative community of good practice; and to design, implement, and evaluate inclusive practices.
2. Literature Review
Research in this area fluctuates by year but has been increasing since 2014 (Figure 1). Professionals, such as academics, are looking at the measurement of inclusivity. They all use a questionnaire. It can be cited the footprint created by Mixity focused on employees and on different inclusive dimensions, and the barometer created by McKinsey focused on top management and some dimensions. Mozaïk, a recruitment firm, designed a diversity and inclusion barometer for recruitment purposes. None of these tools are adapted to higher education.
Some academic works have analyzed the overall perception of sustainability in firms or schools [5,6,7,8]. Other researches define the concept of inclusivity, present the overall context [9], and study the impacts of an inclusive environment on performance [10,11,12]. These tools address schools for the entire sustainability.
Rezai [13] proposes a systematic literature review to analyze the situation of the research on workplace inclusion. A total of 27 studies were analyzed in depth. Ten were measure development studies. They measure ostracism, exclusion, and inclusion scales.
Inclusivity and practices are also explored. Mahlangu [14], for example, indicates that higher education can compensate economic but not cultural or social backgrounds. Moreover, the impacts of inclusive education are examined [15,16]. Jaiswal et al. [11] study the link between inclusivity perception and well-being; Lubiano [17] studies inclusivity perception and performance increasing. The medical sector is overstudied. The authors examine the attitude of medical students with their patients according to their cultural background [18], the medical students’ perceptions of racial diversity and gender equality [19], and of diversity exposure [20].
Concerning the inclusive dimensions, other researchers have worked on identity. Churchill et al. [21] examine ethnic, linguistic, and religion diversity; Baker and Novak [22] examine race and ethnicity; and McLaughlin [23] examines race. Arman [24] analyzes the perception of minority groups. Wieczorek-Szyman [25] focuses on gender but gender and ethnic/racial discussions can be associated [26,27]. Disability is also studied in school systems or in firms [28,29,30,31,32]. UNESCO organized a conference on special needs education in Salamanca in 1994. All these studies focus on specific inclusive dimensions and do not cover all the dimensions.
The index of inclusion of [4] is the most advanced. It assesses culture, policies, and practices for the stakeholders, staff, parents, and children. It is a self-evaluation tool of learning and participation at school. However, no study assesses all the inclusive dimensions or all the stakeholders in the higher education. It is, therefore, proposed the creation of a tool to fill this gap. This tool is detailed in the following section.
3. A New Inclusive Rating
3.1. Methodology
Inclusivity is understood for all stakeholders of a higher education institution: students, employees, alumni, partners. The overall context is also considered.
The French legal framework defines 25 criteria of discrimination that can be grouped under 4 main dimensions: social openness, identity, gender, and disability.
In addition to considering these four stakeholders and these four dimensions, the notion of perimeter is added (Figure 2). The data used to quantify the index will come from a direct perimeter (the institution itself) and two indirect perimeters (the student associations and the foundation).
Like the PIR [5], the levels of inclusivity are not intended to be a ranking but a rating. It is not about creating competition between institutions but rather about creating a supportive and collaborative community of good practices. This evaluation helps schools in their development and change towards more inclusive practices.
The choice of indicators follows the following approach according to Alkire et al. [33]:
- Defining the set of indicators that will be considered in the multidimensional measure (social openness, gender, identity, disability).
- Setting minimum and maximum target thresholds for each indicator. These thresholds will correspond to levels 1 and 5 of inclusivity. A sensitivity range between 5 and 10% will be applied to these limits in order not to create a threshold effect.
- Setting the scales for each indicator. The scales between these two levels will give the levels to be reached for levels 2, 3, and 4 of inclusivity.
- Selecting the weight for each indicator.
- Creation of the weighted sum of the indicators for an overall score.
- Possible breakdown of the score by dimension or stakeholder.
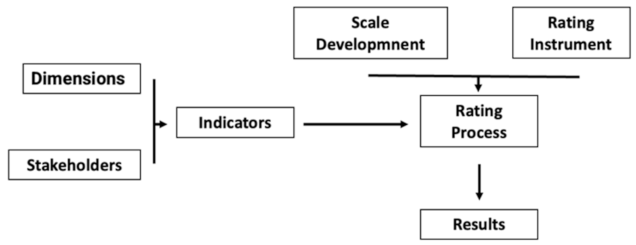
The indicators are detailed by stakeholder and then by dimension. Their scoring is explained. It is based on two main principles. The first is the resemblance to the local population. The second is the principle of diversity reached from a threshold of 30% [34,35]. Each indicator described below is weighted according to the breakdown below. The student–employee–alumni stakeholders each represent 30% of the overall index and the partners 8%. Each dimension has more than one indicator. According to each country and each institution, it could be difficult to find all the data. One dimension can be rated with at least one indicator. Indeed, partners are external stakeholders but do not represent the core stakeholders of the institution. They represent 10%. Each dimension is then weighted in a homogeneous manner, as are the different indicators for each dimension. The overall context corresponds to an overall inclusivity and represents 2%. All the process is synthetized in Figure 3.
3.2. Indicators
3.2.1. Students
- Social openness
The social openness dimension is represented by two complementary indicators. In the case of a calculation for an organization outside France, the first indicator cannot necessarily be calculated. In this case, the second indicator will only be considered. The figures of these indicators must be adapted by country. The first one is the number of scholarship students. This figure is used as an indicator in many rankings. The rate of scholarship holders is adapted according to the country. The rate of high school is taken as reference for level 5. As this rate can vary, a range is applied. A minimum rate of 20% has been defined for level 1. The different levels of inclusivity were then defined linearly. The second one is the number of students according to their parents’ socio-professional category. This information is, at least, known for the main program. This allows us to focus more broadly on the flagship program of a management school. This figure, which is larger than the number of scholarships, provides a better understanding of the student landscape in relation to the societal landscape. The CSP- are the opposite of the CSP+, which are heads of companies, craftsmen and shopkeepers, executives, higher intellectual professions, and intermediate professions. A minimum rate of 50% was defined for level 1 and level 5 is defined according to the country. The different levels were then defined linearly.
- Gender
The parity in the student population is important. This population is also very involved in student associations, which must carry the values of their school. Two indicators are therefore necessary: % male/female and % male/female association president. Parity corresponds to a percentage of 50% distribution between men and women. The target value of 50% is, therefore, expected regardless of the percentage of male or female. A minimum of 30%, corresponding to the gender mix threshold, was chosen for level 1. The other levels were calculated linearly.
- Identity
The schools must both represent their territories but also show an openness to the world. Geographical origin constitutes a discrimination in access to higher education. It is, therefore, important to measure the ratio of isolated territories, i.e., rural territories and isolated cities, to non-isolated territories, i.e., cities and peri-urban areas. The distribution of high schools reflects the distribution of the national population. A minimum rate of 10% was defined for level 1. Level 5 is adapted to the country. The different levels were then defined linearly. Secondly, the percentage of different nationalities is a measure of the international mix. As mentioned in the introduction, the minimum rate defined for a real mix is 30%, the target value. A minimum rate of 10% was defined for level 1. The different levels were then calculated linearly.
- Disability
Just like a company where the percentage of employees declared as having a disability is monitored, the percentage of students declared as having a disability must be monitored. In France, the law No. 2018-771 of 5 September 2018 “for the freedom to choose one’s professional future” reforms the obligation to employ disabled workers (OETH) and sets a target of 6% for companies. This objective is chosen for level 1. The estimated percentage of the population that can be declared as having a disability is 18%, which represents the target value. The different levels are calculated linearly.
3.2.2. Employee
- Social openness
To measure this dimension without using personal and historical data of all staff, two indicators have been selected. Work–study students are students working in a company; by choice but also more often by necessity, as work–study contracts allow them to finance their studies. A total of 500,000 work–study contracts were signed in 2020 in France. France will have 24,892,000 salaried jobs in 2019 according to the French statistical Agency (INSEE). Work–study contracts, therefore, represent about 2% of salaried contracts. A total of 2% is, therefore, the target value with a sensitivity interval. The minimum value is 0. The different levels are calculated linearly. The second indicator is the % of nationalities not corresponding to one of the ten most advanced countries. The 10 most advanced countries are Switzerland, Australia, Belgium, Canada, France, United Kingdom, Spain, Italy, United States, and Germany. There are 197 countries in the world according to the UN. The population of these 10 countries represents about 10% of the world population. A total of 90% of the world’s population lives in the 187 least developed countries. All the collaborators of the institutions must, therefore, follow this representation. To calculate this percentage, the nationality of the country of the institution is removed. This leaves a possible 196 countries, and the percentage is 91%. A minimum threshold of 30%, the threshold of diversity, has been chosen for level 1. The different levels are calculated linearly.
- Gender
The French “Index égalité professionnelle homme femme” allows many facets of parity to be considered. All companies with at least 50 employees must calculate and publish their gender equality index every year on 1 March. If the index is below 75 points, the company must implement corrective measures to reach at least 75 points within 3 years. The maximum index is 100. The level will, therefore, be defined by scores below 80; the level 5 by scores above 96. The different levels are calculated linearly. For the other countries, the wage gap between female and male is considered, which is one of the indicators of the French index. The difference between these two averages must be zero, with a sensitivity interval.
- Identity
Two criteria are highlighted here: geographical origin and age. The percentage of different nationalities is a measure of international diversity. As indicated in the introduction, the minimum rate defined for a real mix is 30%, the target value for level 5. A minimum rate of 10% is defined for level 1. The different levels were then calculated linearly. Moreover, the school must be representative of the active society. The gap between the age pyramid of the school and the country of the school is, therefore, measured. This gap will be compared to the distribution given by the statistics of the country. The target value for level 5 is a gap of 0 with a sensitivity interval. A deviation of more than 0.8 is considered a minimum for level 1. The different levels were then calculated linearly.
- Disability
Companies have a legal obligation to employ disabled employees. As in Section 3.2.1., the objective of 6% is chosen for level 1. The estimated percentage of the population that can be declared as having a disability is 18%, which is the target value. The different levels are calculated linearly.
3.2.3. Alumni
- Social openness
The social openness dimension is covered by the type of companies in which students will work after graduation. In the French system, an SME is a small or medium-sized company with fewer than 250 employees and annual sales of less than EUR 50 million or total assets of less than EUR 43 million. An ETI is an intermediate-sized company that does not belong to the category of SMEs and has fewer than 5000 employees and annual sales of up to EUR 1500 million or total assets of up to EUR 2000 million. A large company is a company that cannot be classified in the previous categories. The French statistical Agency (INSEE) indicates that the split between SMEs and GEs is 50–50. The target value for level 5 is, therefore, 50. The minimum retained for level 1 is 30. The different levels are calculated linearly.
- Gender
Wage gaps between male and female employees exist. The average wages of women and men after leaving school are compared. The difference between these two averages must be zero, with a sensitivity interval. This target value is defined for level 5. The French statistical Agency (INSEE) indicates an average gap of 18% for a minimum of 3 years of higher education without experience. A minimum of 20% for level 1 is, therefore, chosen. The different levels are calculated linearly.
- Identity
To measure international openness, the number of jobs by country is studied. The jobs of the outgoing student population are studied. A minimum of 10% working outside the country of study is expected for level 1. A target value of 30% is set for level 5. The different levels are calculated linearly.
- Disability
A total of 80% of disabilities occur during a lifetime. Former students at a school may have to retrain due to a life accident. They can train in their former school or in another institution. The school must, therefore, welcome students with disabilities for continuing education. It must also offer retraining assistance to its former students whose projects may also involve expertise not taught at the school. Moreover, like the number of students or employees who have declared a disability, the number of back-to-school students who have declared a disability follows the same logic. As in Section 3.2.1, the objective of 6% is chosen for level 1. The estimated percentage of the population that can be declared as having a disability is 18%. A range of 16–20% is defined for level 5. The different levels are calculated linearly. The institution does not offer all the possible training courses for retraining. Therefore, it cannot necessarily welcome all its alumni who have declared a handicap, but it can help them to retrain and to find the right training, whatever it may be, thanks to a retraining aid system.
3.2.4. Partners
The aim here is to consider each dimension as it relates to the school’s partners.
In addition, the links with partners are measured via partnerships and student associations linked to the different dimensions:
- Social openness: partnerships aimed at social diversity, and professional order partnerships, associations aimed at social diversity.
- Gender: partnerships with a gender focus, and associations with an LGBT+ or gender focus.
- Identity: partnerships with diversity label, and association with diversity target,
- Disability: partnerships with companies targeting disability, and associations/projects targeting disability.
All these indicators are binary. The different levels are reached according to the following criteria:
- Level 1: The institution has no associations or partnerships.
- Level 2: The institution has associations or partnerships for at least one dimension.
- Level 3: The institution has associations or partnerships for at least two dimensions.
- Level 4: The institution has associations or partnerships for all dimensions.
- Level 5: The institution has associations and partnerships for all dimensions.
3.2.5. Overall Context
The general context is described by four indicators:
- % of employees aware of inclusivity.
- Internal communication on inclusive topics.
- External communication on inclusive topics.
- Reporting system.
The first indicator varies from 50% to 100% with a target of 100% of employees aware of level 5. The other three indicators are binary. Either the institution communicates and has a reporting mechanism in place, or it does not communicate and has no mechanism. To achieve level 2, the institution must at least communicate internally. To reach level 3, it must at least communicate externally. To reach levels 4 and 5, the institution must have a reporting system.
4. Mathematical Model
In formulating the model for the level of inclusivity, the general equation is determined. The overall level L depends on the level of the four stakeholders and the overall context: Students (S), Employee €, Alumni (A), Partners (P), Overall Context (OC).
The level of inclusivity of each stakeholder is related to the four dimensions: disability (D), gender (G), identity (I), social openness (SO).
The overall context is related with its own sub-factors:
Variables
Parameters
With
,
5. Discussion
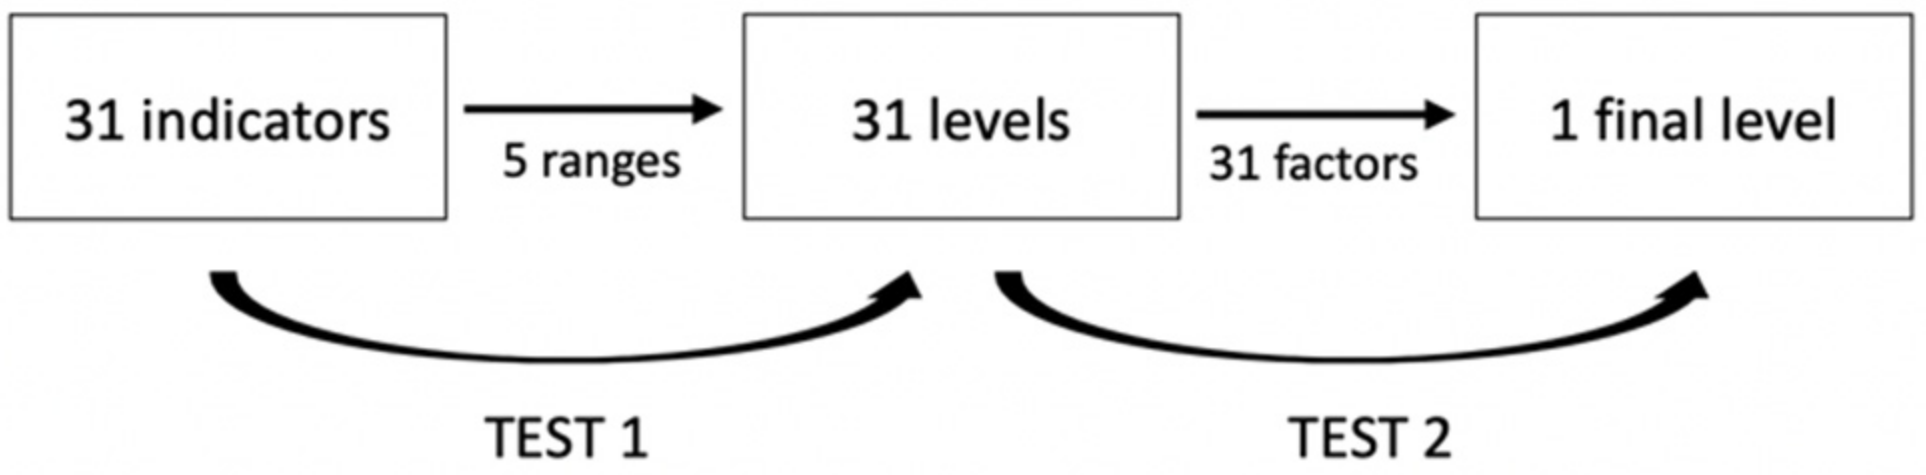
Inclusivity has different dimensions. In the context of higher education, many stakeholders must be involved to ensure an inclusive environment. To measure the level of inclusiveness, the above mathematical model has 31 indicators with 5 levels of inclusiveness and, therefore, 5 associated ranges. These 31 indicators are aggregated by dimension and then by stakeholder to give an overall level of inclusivity. It is, therefore, important to test the sensitivity and robustness of the model to validate the calculated inclusivity levels.
Two tests are necessary to measure the robustness of the model (Figure 4). The first test examines the sensitivity of the inclusivity index compared to changes in the values of the indicators. The second test examines the variation in the level of sub-inclusivity to quote the inclusivity index.
In terms of sensitivity analysis, the binary data have a medium margin of error of 50% (Figure 5). For the quantitative data, the medium margin of error depends on the value and the range.
Figure 5 illustrates the calculation of the average margin of error for a higher or lower level reached. On average, this margin of error is
Table 1 presents this margin of error for all the indicators. Different scenarios are designed to analyze the impact of the uncertainty of the data:
- -
- Scenario 1: 1% margin of error in the indicator values.
- -
- Scenario 2: 2% margin of error in the indicator values.
- -
- Scenario 3: 5% margin of error in the indicator values.
On average, to change the final level it takes a difference of 0.5. According to Table 2, this implies a percentage of error of 5% on all the indicators. A real error of 5% on all indicators implies that 17 of them change level on average. In the worst case, they change level in the same direction, and we obtain an impact of 0.83. To obtain 0.5, we only need 14 indicators that change level in the same direction. On the other hand, for less than 13 indicators changing level in the same direction, there is no impact. In conclusion, this sensitivity study shows that for the algorithm not to be robust, it is necessary to have a proven error of 5% on all the indicators and that 14 of them suffer the error in the same direction. The probability of this happening is 0.01%.
To test the robustness of the inclusivity index, an outlier is integrated in a homogeneous scenario, which is the worst scenario in terms of robustness. This outlier is successively given to each stakeholder. The main stakeholders, student, employee, and alumni have the same weight so a random one was chosen. Fifteen scenarios are designed as explained below:
- -
- Scenarios 1–3 have a homogeneous level of 1 and an outlier with a level of 5.
- -
- Scenarios 4–6 have a homogeneous level of 2 and an outlier with a level of 5.
- -
- Scenarios 7–9 have a homogeneous level of 3 and an outlier with a level of 5.
- -
- Scenarios 10–12 have a homogeneous level of 3 and an outlier with a level of 1.
- -
- Scenarios 13–15 have a homogeneous level of 4 and an outlier with a level of 1.
The results in Table 3 show that the index is robust wherever the location of the outlier and whatever the homogeneous level of the scenario. Scenario 3 is the only one which is sensitive. This scenario has a homogeneous level of one and an outlier with a level of five for one main stakeholder. This result could be discussed. First, the fact that the inclusivity level of one mail stakeholder influences the global result does not seem so unrealistic. Second, it is a highly improbable scenario in real life. Ten scenarios are designed and explained below:
- -
- Scenarios 1–3 have a homogeneous level of 1. An outlier of 5 is integrated.
- -
- Scenarios 4–6 have a homogeneous level of 2. An outlier of 5 is integrated.
- -
- Scenarios 7–9 have a homogeneous level of 3. An outlier of 5 is integrated.
- -
- Scenario 10 has a homogeneous level of 4. An outlier of 1 is integrated.
Table 4 shows the results. With 1 dimension with a level of 1, a final level of 5 is impossible to obtain. To obtain a level of 5, 3 dimensions on 4 with a level of 5 are needed with another level of 2 or 3 (scenarios 6 and 9); only 1 dimension on 4 with a level of 5 is needed if the other levels are 4 (scenario 10).
The analyses demonstrate that the model is robust enough to be used as a reliable measurement tool.
6. Conclusions
This inclusivity index offers a broader view, both in terms of dimensions and stakeholders, than other searches [13]. The inclusion index [4], a questionnaire completed by some stakeholders, does not have the same focus. It is based on feelings, which is also very important, but this index aims at a quantified picture of the inclusivity in the broad sense of an institution of higher education. In that context, this inclusivity index must respond to the characteristics and legislations of different countries. It will appear incomplete for some countries where a lot of personal information is accessible and already very intrusive for other countries where access to personal data is very limited. It has been the subject of much back and forth between different stakeholders in international higher education. It is, therefore, the result of a compromise between creating a tool that can be used by all countries and creating a tool that measures inclusivity in higher education as widely as possible.
This inclusivity index has now to be shared with different higher education institutions to improve the global level of inclusion of higher education. The rating form is intended to allow collaboration and sharing of good practices between higher education actors. The participation of many institutions will create a community that is committed to the creation of a more inclusive society. The annual calculation of inclusivity levels will measure the overall improvement of higher education in terms of inclusivity.
Funding
This research received no external funding.
Informed Consent Statement
Not applicable.
Conflicts of Interest
The author declares no conflict of interest.
References
- Milem, J.F.; Chang, M.J.; Antonio, A.L. Making Diversity Work on Campus: A Research-Based Perspective; Association American Colleges and Universities: Washington, DC, USA, 2005. [Google Scholar]
- Chang, M.J. Does Racial Diversity Matter? The Educational Impact of a Racially Diverse Undergraduate Population. J. Coll. Stud. Dev. 1999, 40, 377–395. [Google Scholar]
- Bensimon, E.M. The Diversity Scorecard: A Learning Approach to Institutional Change. Chang. Mag. High. Learn. 2004, 36, 44–52. [Google Scholar] [CrossRef]
- Booth, T.; Ainscow, M.; Black-Hawkins, K.; Vaughan, M.; Shaw, L. Index for Inclusion. Dev. Learn. Particip. Sch. 2002, 2. Available online: https://inee.org/sites/default/files/resources/index_for_Inclusion_Developing_Play%2C_Learning_and_Participation_in_the_Early_Years_and_Childcare.pdf (accessed on 30 June 2022).
- Dyllick, T.; Muff, K. A Positive Impact Rating for Business Schools: Case Study. Sustainability 2020, 12, 9551. [Google Scholar] [CrossRef]
- Aginako, Z.; Peña-Lang, M.B.; Bedialauneta, M.T.; Guraya, T. Analysis of the Validity and Reliability of a Questionnaire to Measure Students’ Perception of Inclusion of Sustainability in Engineering Degrees. Int. J. Sustain. High. Educ. 2021, 22, 1402–1420. [Google Scholar] [CrossRef]
- Huber, S.; Bassen, A. Towards a Sustainability Reporting Guideline in Higher Education. Int. J. Sustain. High. Educ. 2017, 19, 218–232. [Google Scholar] [CrossRef]
- Jorge, M.L.; Madueño, J.H.; Calzado, Y.; Andrades, J. A Proposal for Measuring Sustainability in Universities: A Case Study of Spain. Int. J. Sustain. High. Educ. 2016, 17, 671–697. [Google Scholar] [CrossRef]
- Mims, Z.; Bearman, B.; Moone, B.; Pachlhofer, C. Leveraging Diversity Of Thought through Inclusion: Advantages, Disadvantages, and Taking Advantage; Air Command And Staff College Maxwell AFB: Montgomery, AL, USA, 2017. [Google Scholar]
- Gerring, J.; Thacker, S.C.; Lu, Y.; Huang, W. Does Diversity Impair Human Development? A Multi-Level Test of the Diversity Debit Hypothesis. World Dev. 2015, 66, 166–188. [Google Scholar] [CrossRef]
- Jaiswal, A.; Dyaram, L. Perceived Diversity and Employee Well-Being: Mediating Role of Inclusion. Pers. Rev. 2019, 49, 1121–1139. [Google Scholar] [CrossRef]
- Mohammadi, A.; Broström, A.; Franzoni, C. Workforce Composition and Innovation: How Diversity in Employees’ Ethnic and Educational Backgrounds Facilitates Firm-Level Innovativeness. J. Prod. Innov. Manag. 2017, 34, 406–426. [Google Scholar] [CrossRef]
- Rezai, M.; Kolne, K.; Bui, S.; Lindsay, S. Measures of Workplace Inclusion: A Systematic Review Using the COSMIN Methodology. J. Occup. Rehabil. 2020, 30, 420–454. [Google Scholar] [CrossRef] [PubMed]
- Mahlangu, V.P. Equality and Diversity of Students in Higher Education. In Diversity within Diversity Management; Emerald Publishing Limited: West Yorkshire, UK, 2019. [Google Scholar]
- Havel, J.; Kratochvílová, J. Maximum Expectation from Pupils—One of the Characteristic Features of Inclusion. Procedia-Soc. Behav. Sci. 2014, 141, 331–336. [Google Scholar] [CrossRef] [Green Version]
- Sharma, U.; Sokal, L.; Wang, M.; Loreman, T. Measuring the Use of Inclusive Practices among Pre-Service Educators: A Multi-National Study. Teach. Teach. Educ. 2021, 107, 103506. [Google Scholar] [CrossRef]
- Lubiano, H.-J.D. A Qualitative Approach in Measuring Inclusion; Air Force Institute of Technology: Dayton, OH, USA, 2019. [Google Scholar]
- Dogra, N.; Wass, V. Can We Assess Students’ Awareness of Cultural Diversity? A Qualitative Study of Stakeholders’ Views. Med. Educ. 2006, 40, 682–690. [Google Scholar] [CrossRef] [PubMed]
- Lee, M.; Coulehan, J.L. Medical Students’ Perceptions of Racial Diversity and Gender Equality. Med. Educ. 2006, 40, 691–696. [Google Scholar] [CrossRef]
- Novak, K.F.; Whitehead, A.W.; Close, J.M.; Kaplan, A.L. Students’ Perceived Importance of Diversity Exposure and Training in Dental Education. J. Dent. Educ. 2004, 68, 355–360. [Google Scholar] [CrossRef]
- Awaworyi Churchill, S.; Madhoo, Y.N.; Nath, S. Ethnic Diversity and Human Capital Development in India: A Disaggregated Analysis at the State and District Levels. Appl. Econ. 2020, 52, 506–518. [Google Scholar] [CrossRef]
- Baker, R.E.; Nowak, B. Statistics on Student Diversity and Multiculturalism in Higher Education. J. Account. Educ. 1997, 15, 71–94. [Google Scholar] [CrossRef]
- McLaughlin, J.E.; McLaughlin, G.W.; McLaughlin, J. Using Composite Metrics to Measure Student Diversity in Higher Education. J. High. Educ. Policy Manag. 2015, 37, 222–240. [Google Scholar] [CrossRef]
- Arman, A.S. Assessing How Perceived Inclusion Affects Minority Employees’ Organizational Satisfaction in Higher Education Institutions in the US. Eur. J. Bus. Manag. Res. 2021, 6, 78–86. [Google Scholar] [CrossRef]
- Wieczorek-Szymańska, A. Gender Diversity in Academic Sector—Case Study. Adm. Sci. 2020, 10, 41. [Google Scholar] [CrossRef]
- Mor Barak, M.E.; Cherin, D.A.; Berkman, S. Organizational and Personal Dimensions in Diversity Climate: Ethnic and Gender Differences in Employee Perceptions. J. Appl. Behav. Sci. 1998, 34, 82–104. [Google Scholar] [CrossRef]
- Feng, Y.; Cheon, Y.M.; Yip, T.; Cham, H. Multilevel IRT Analysis of the Everyday Discrimination Scale and the Racial/Ethnic Discrimination Index. Psychol. Assess. 2021, 33, 637–651. [Google Scholar] [CrossRef] [PubMed]
- Bailey, J. The Validation of a Scale to Measure School Principals’ Attitudes toward the Inclusion of Students with Disabilities in Regular Schools. Aust. Psychol. 2004, 39, 76–87. [Google Scholar] [CrossRef]
- DeVries, J.M.; Voß, S.; Gebhardt, M. Do Learners with Special Education Needs Really Feel Included? Evidence from the Perception of Inclusion Questionnaire and Strengths and Difficulties Questionnaire. Res. Dev. Disabil. 2018, 83, 28–36. [Google Scholar] [CrossRef]
- Frederickson, N.; Simmonds, E.; Evans, L.; Soulsby, C. Assessing the Social and Affective Outcomes of Inclusion. Br. J. Spec. Educ. 2007, 34, 105–115. [Google Scholar] [CrossRef]
- Guenaga, M.; Mechaca, I.; Romero, S.; Eguíluz, A. A Tool to Evaluate the Level of Inclusion of Digital Learning Objects. Procedia Comput. Sci. 2012, 14, 148–154. [Google Scholar] [CrossRef] [Green Version]
- Sveinsdottir, V.; Johnsen, T.L.; Fyhn, T.; Opsahl, J.; Tveito, T.H.; Indahl, A.; Eriksen, H.R.; Reme, S.E. Development of the Workplace Inclusion Questionnaire (WIQ). Scand. J. Public Health 2021, 50, 371–380. [Google Scholar] [CrossRef]
- Alkire, S.; Roche, J.M.; Ballon, P.; Foster, J.; Santos, M.E.; Seth, S. Multidimensional Poverty Measurement and Analysis; Oxford University Press: Cary, NC, USA, 2015. [Google Scholar]
- Fraisse, G. Que Penser d’une Évidence? Travail, Genre et Sociétés 2004, 1, 195–197. [Google Scholar] [CrossRef]
- Gong, Y.; Girma, S. Top Management Gender Diversity and Performance: In Search of Threshold Effects. Camb. J. Econ. 2021, 45, 109–127. [Google Scholar] [CrossRef]
Figure 1.
Number of articles.

Figure 2.
Inclusivity model.

Figure 3.
Process.

Figure 4.
Tests.

Figure 5.
Margin of error.


Table 1.
Margin of error.
| Indicator | 1 | 2 | 3 | 4 | 5 | 6 | 7 | 8 | 9 | 10 | 11 | 12 | 13 | 14 | 15 | 16 |
|---|---|---|---|---|---|---|---|---|---|---|---|---|---|---|---|---|
| % Of error margin | 3 | 5 | 3 | 3 | 3 | 3 | 2 | 0 | 1 | 2 | 3 | 0 | 2 | 3 | 2 | 3 |
| Indicator | 17 | 18 | 19 | 20 | 21 | 22 | 23 | 24 | 25 | 26 | 27 | 28 | 29 | 30 | 31 | |
| % Of error margin | 2 | 50 | 50 | 50 | 50 | 50 | 50 | 50 | 50 | 50 | 50 | 1 | 50 | 50 | 50 |
Table 2.
Impact on the final level according to the percentage of margin of error.
| % of Margin of Error | Number of Impacted Indicators | Impact on the Final Level |
|---|---|---|
| 1 | 3 | 0.08 |
| 2 | 8 | 0.4175 |
| 3 | 17 | 0.83 |
Table 3.
Sensitivity results to an outlier integration.
| Stakeholders/Scenario | 1 | 2 | 3 | 4 | 5 | 6 | 7 | 8 | 9 | 10 | 11 | 12 | 13 | 14 | 15 |
|---|---|---|---|---|---|---|---|---|---|---|---|---|---|---|---|
| Employee | 1 | 1 | 5 | 2 | 2 | 5 | 3 | 3 | 5 | 3 | 3 | 1 | 4 | 4 | 1 |
| Student | 1 | 1 | 1 | 2 | 2 | 2 | 3 | 3 | 3 | 3 | 3 | 3 | 4 | 4 | 4 |
| Alumni | 1 | 1 | 1 | 2 | 2 | 2 | 3 | 3 | 3 | 3 | 3 | 3 | 4 | 4 | 4 |
| Partners | 1 | 5 | 1 | 2 | 5 | 2 | 3 | 5 | 3 | 3 | 1 | 3 | 4 | 1 | 4 |
| Overall context | 5 | 1 | 1 | 5 | 2 | 2 | 5 | 3 | 3 | 1 | 3 | 3 | 1 | 4 | 4 |
| Total | 1.08 | 1.32 | 2.2 | 2.06 | 2.24 | 2.9 | 3.04 | 3.16 | 3.6 | 2.96 | 2.84 | 2.4 | 3.94 | 3.76 | 3.1 |
| Inclusivity level | 2 | 2 | 3 | 3 | 3 | 3 | 4 | 4 | 4 | 3 | 3 | 3 | 4 | 4 | 4 |
Table 4.
Scenarios with level 5.
| Dimension/Scenario | 1 | 2 | 3 | 4 | 5 | 6 | 7 | 8 | 9 | 10 |
|---|---|---|---|---|---|---|---|---|---|---|
| Gender | 1 | 1 | 1 | 2 | 2 | 2 | 3 | 3 | 3 | 4 |
| Identity | 1 | 1 | 5 | 2 | 2 | 5 | 3 | 3 | 5 | 4 |
| Social openess | 1 | 5 | 5 | 2 | 5 | 5 | 3 | 5 | 5 | 4 |
| Disability | 5 | 5 | 5 | 5 | 5 | 5 | 5 | 5 | 5 | 5 |
| Total | 2 | 3 | 4 | 2.75 | 3.5 | 4.3 | 3.5 | 4 | 4.5 | 4.25 |
| Inclusivity level | 2 | 3 | 4 | 3 | 4 | 5 | 4 | 4 | 5 | 5 |
Publisher’s Note: MDPI stays neutral with regard to jurisdictional claims in published maps and institutional affiliations. |
© 2022 by the author. Licensee MDPI, Basel, Switzerland. This article is an open access article distributed under the terms and conditions of the Creative Commons Attribution (CC BY) license (https://creativecommons.org/licenses/by/4.0/).
Share and Cite
MDPI and ACS Style
Jaegler, A. How to Measure Inclusion in Higher Education: An Inclusive Rating. Sustainability 2022, 14, 8278. https://0-doi-org.brum.beds.ac.uk/10.3390/su14148278
AMA Style
Jaegler A. How to Measure Inclusion in Higher Education: An Inclusive Rating. Sustainability. 2022; 14(14):8278. https://0-doi-org.brum.beds.ac.uk/10.3390/su14148278
Chicago/Turabian StyleJaegler, Anicia. 2022. "How to Measure Inclusion in Higher Education: An Inclusive Rating" Sustainability 14, no. 14: 8278. https://0-doi-org.brum.beds.ac.uk/10.3390/su14148278
Note that from the first issue of 2016, this journal uses article numbers instead of page numbers. See further details here.