
Assessment of Multi-Satellite Precipitation Products over the Himalayan Mountains of Pakistan, South Asia

 ,
,  ,
,  ,
,  ,
,
Abstract
:1. Introduction
2. Materials and Methods
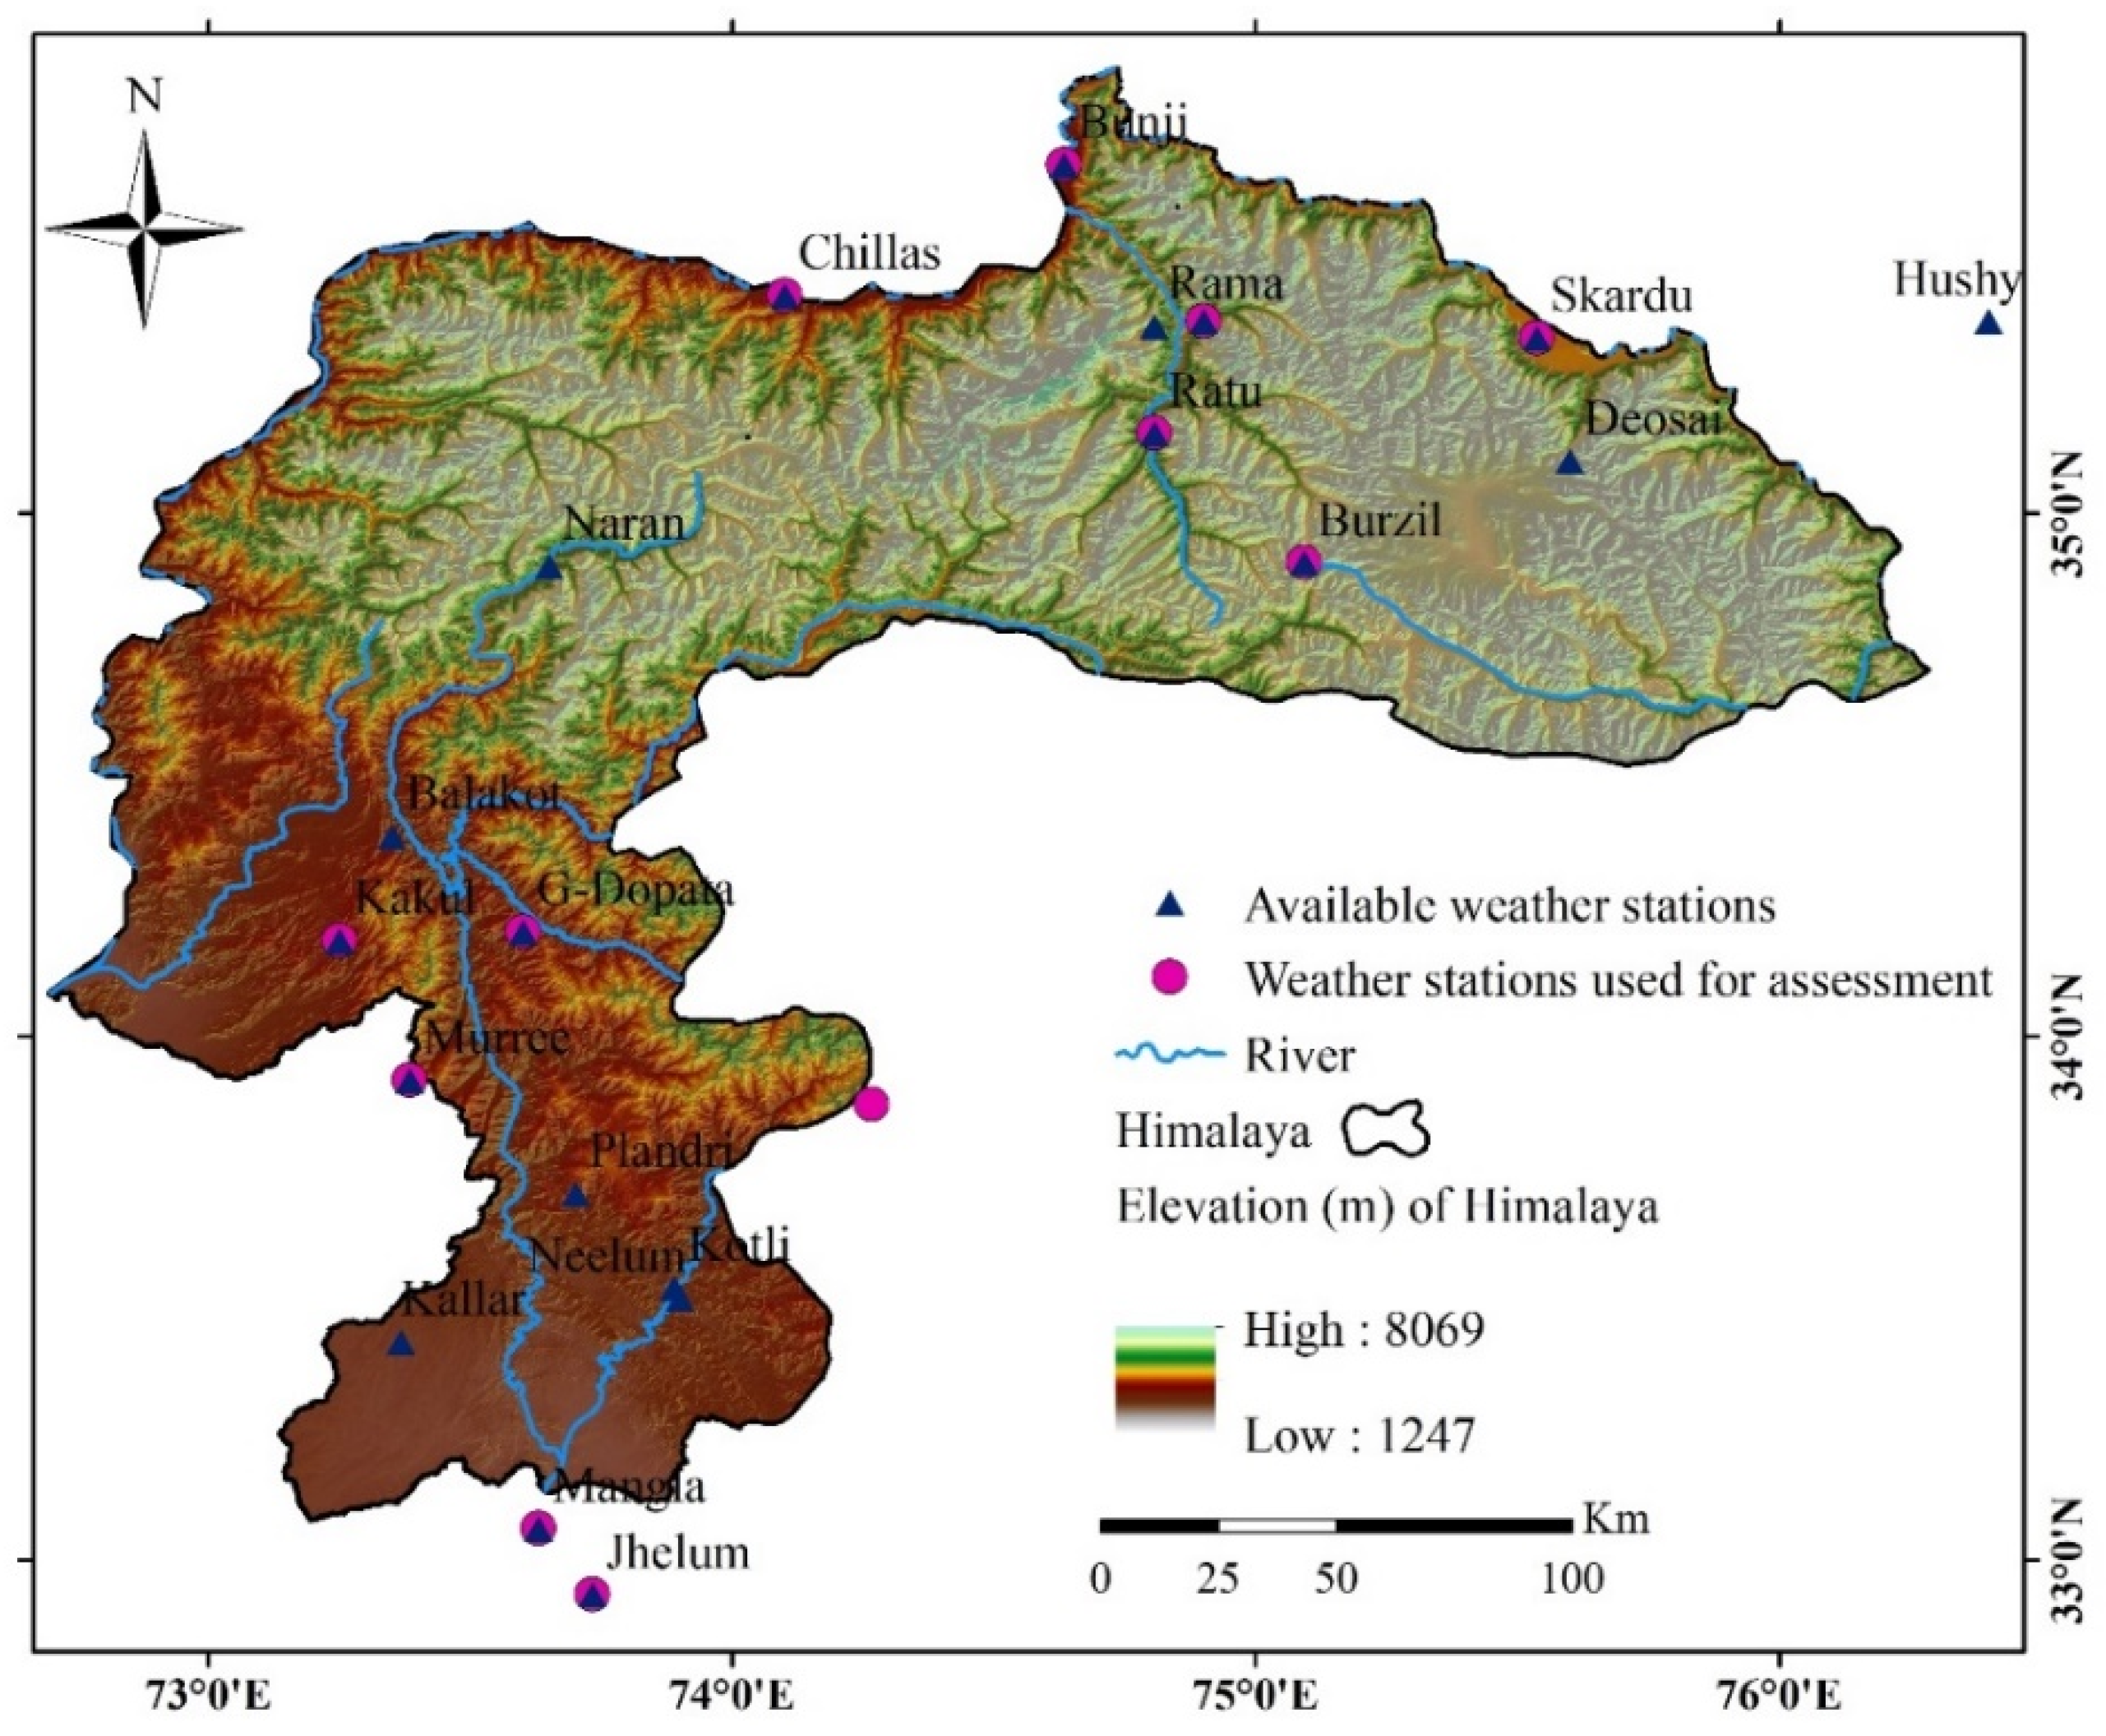
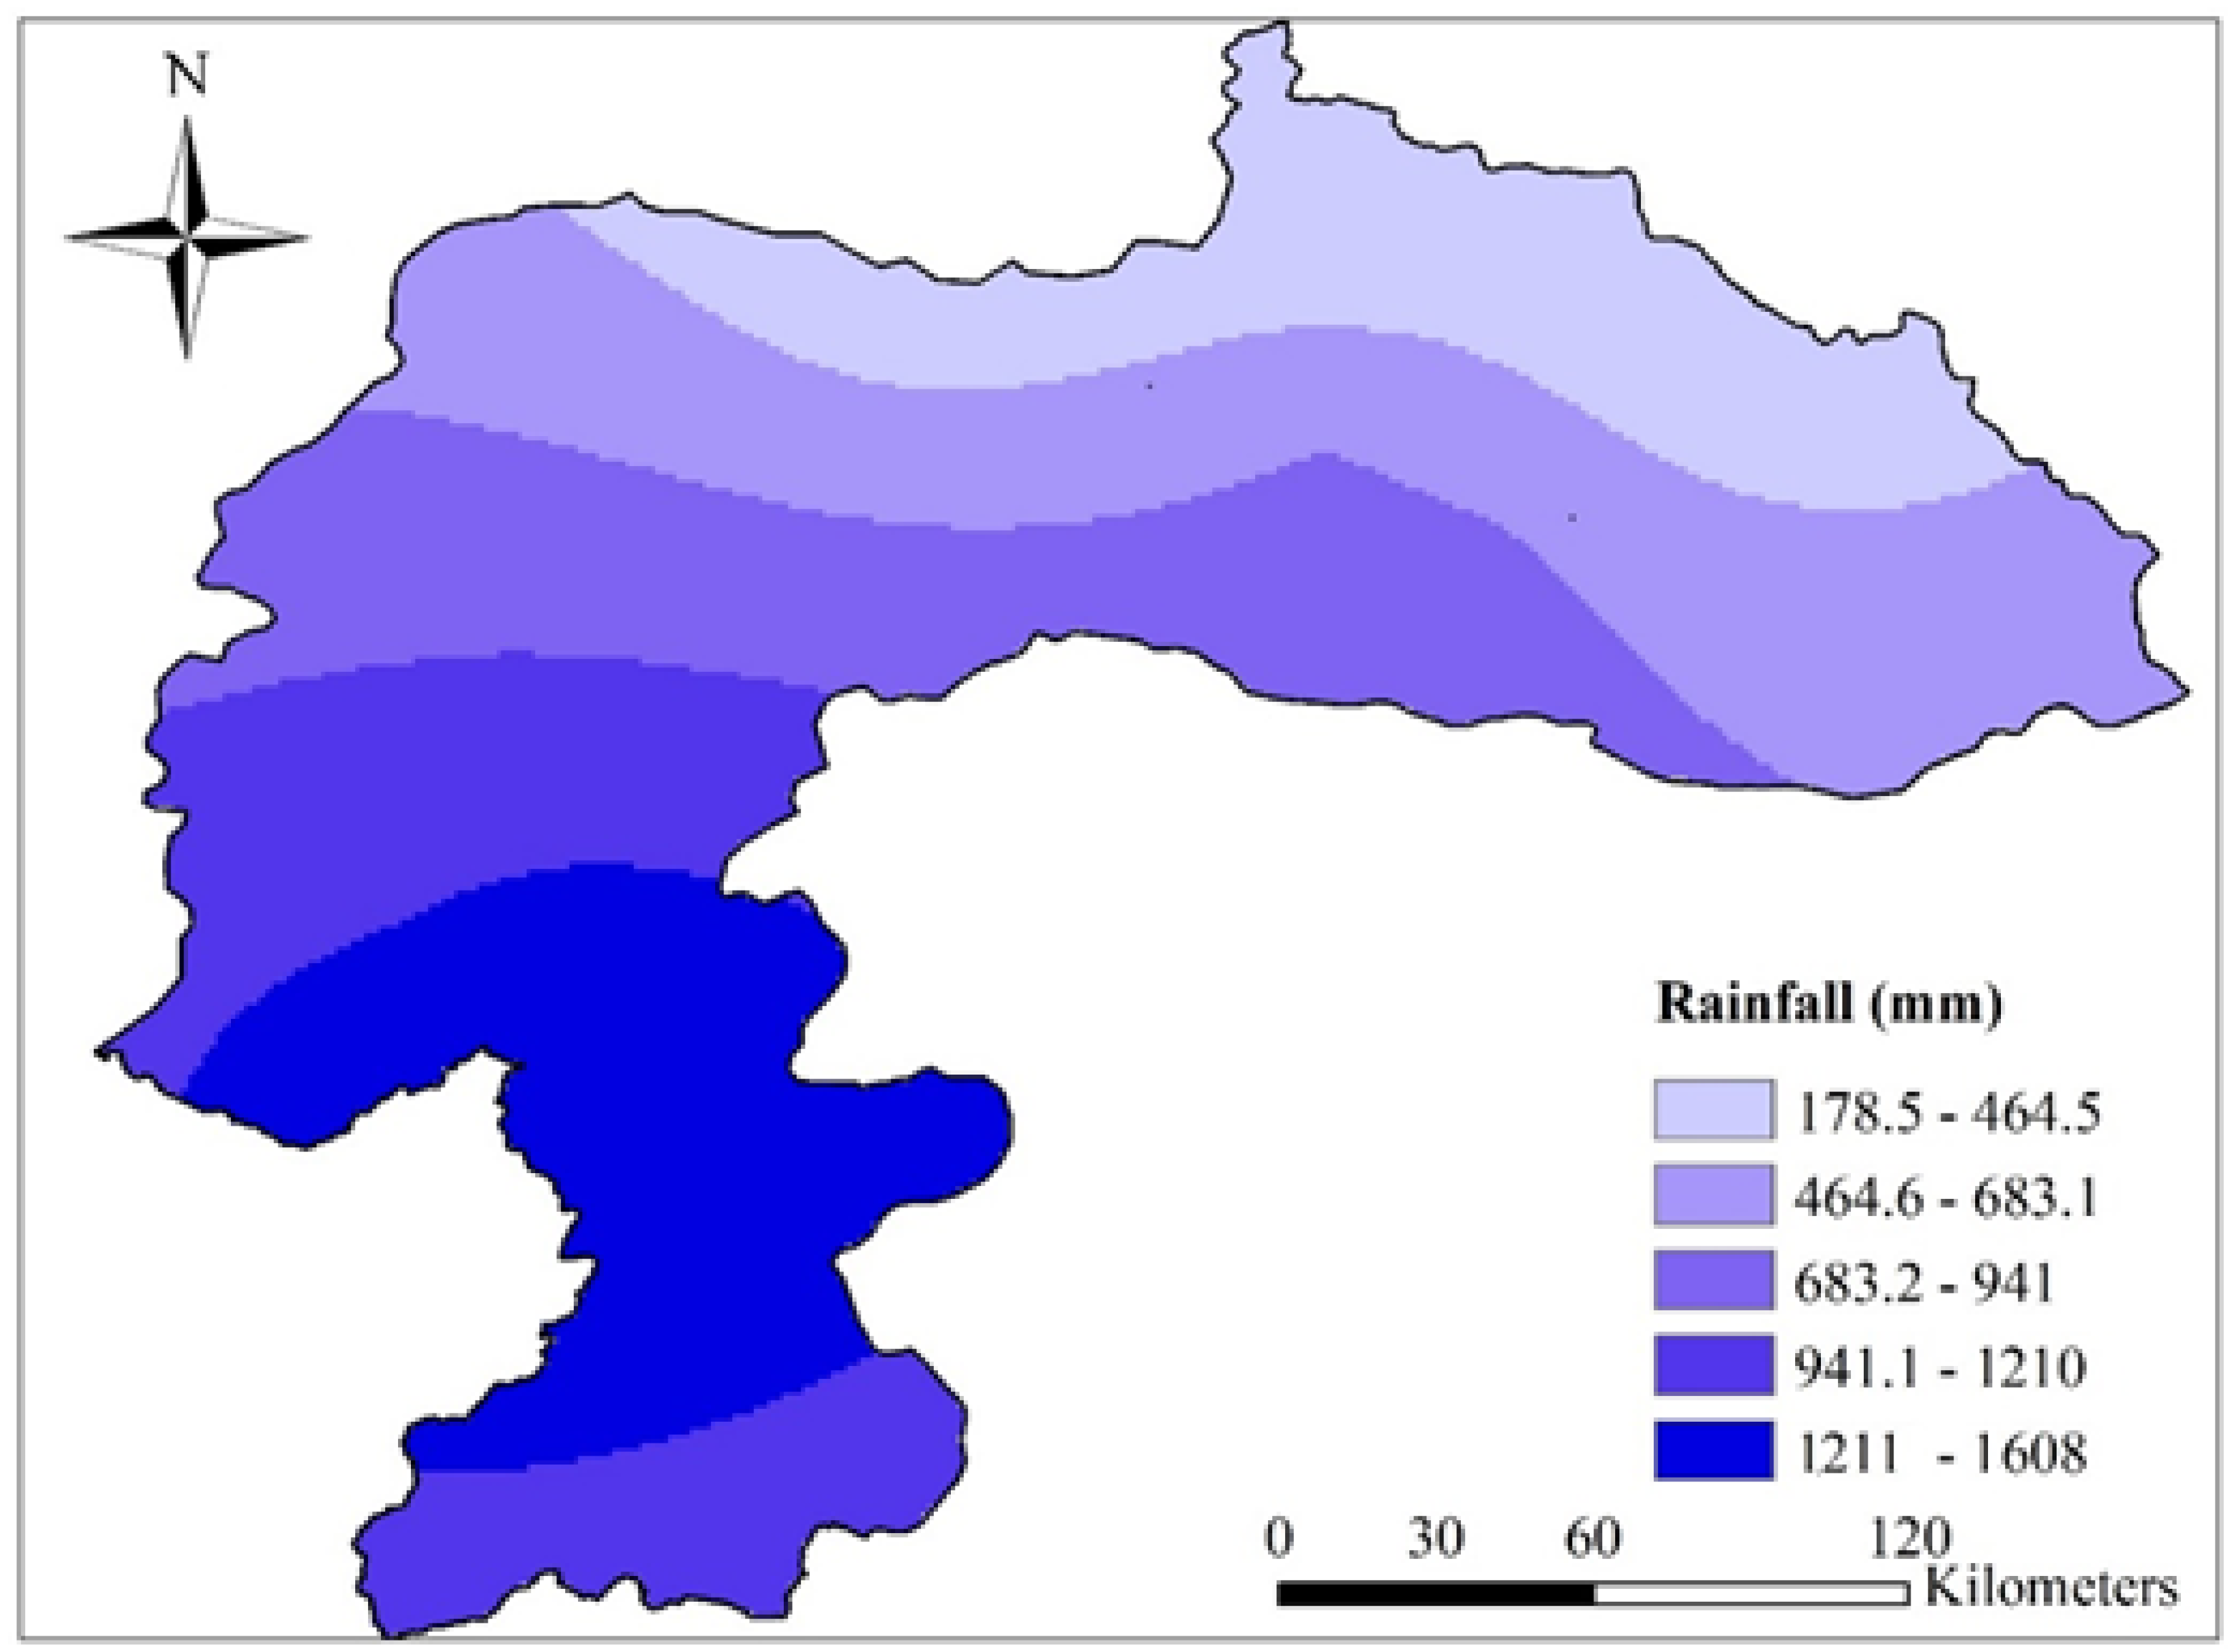
2.1. Study Area
2.2. Datasets
2.3. Methods
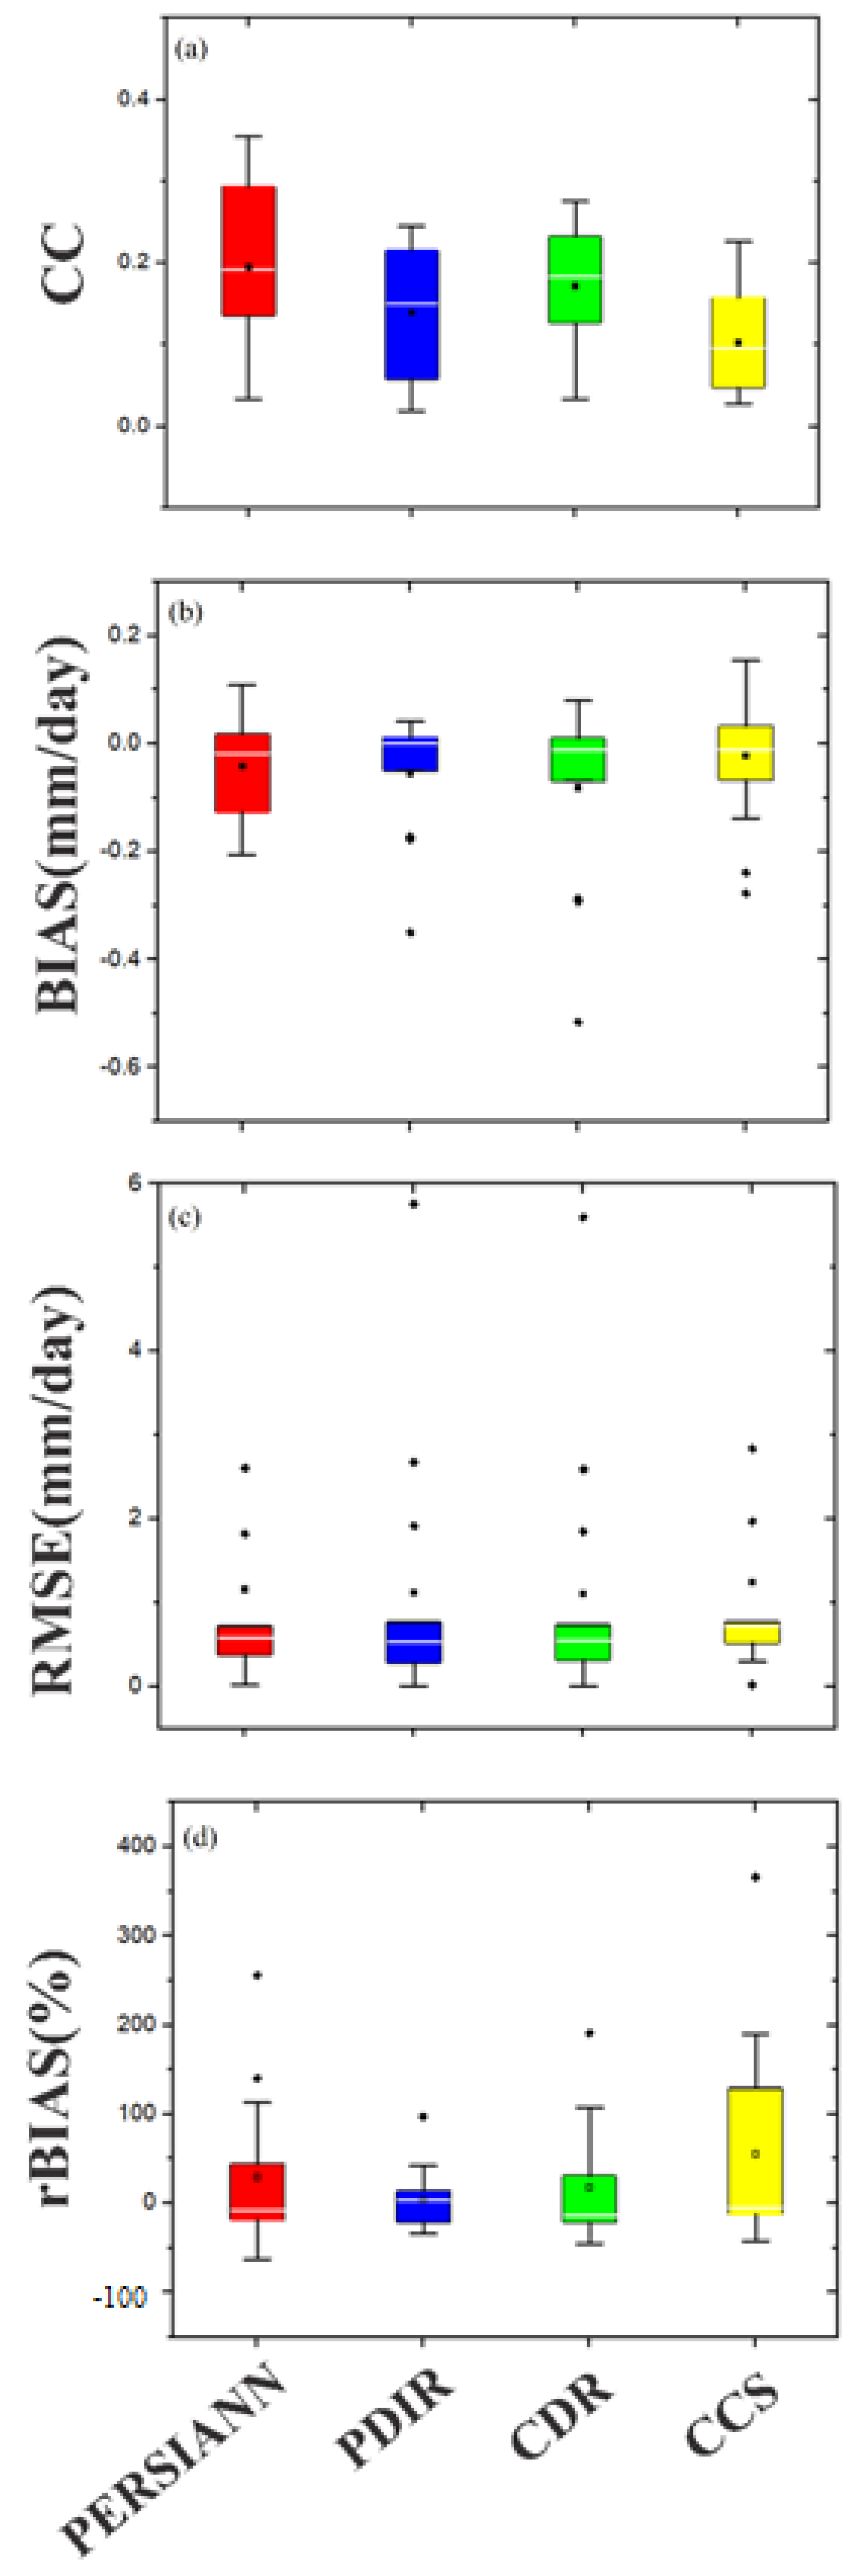
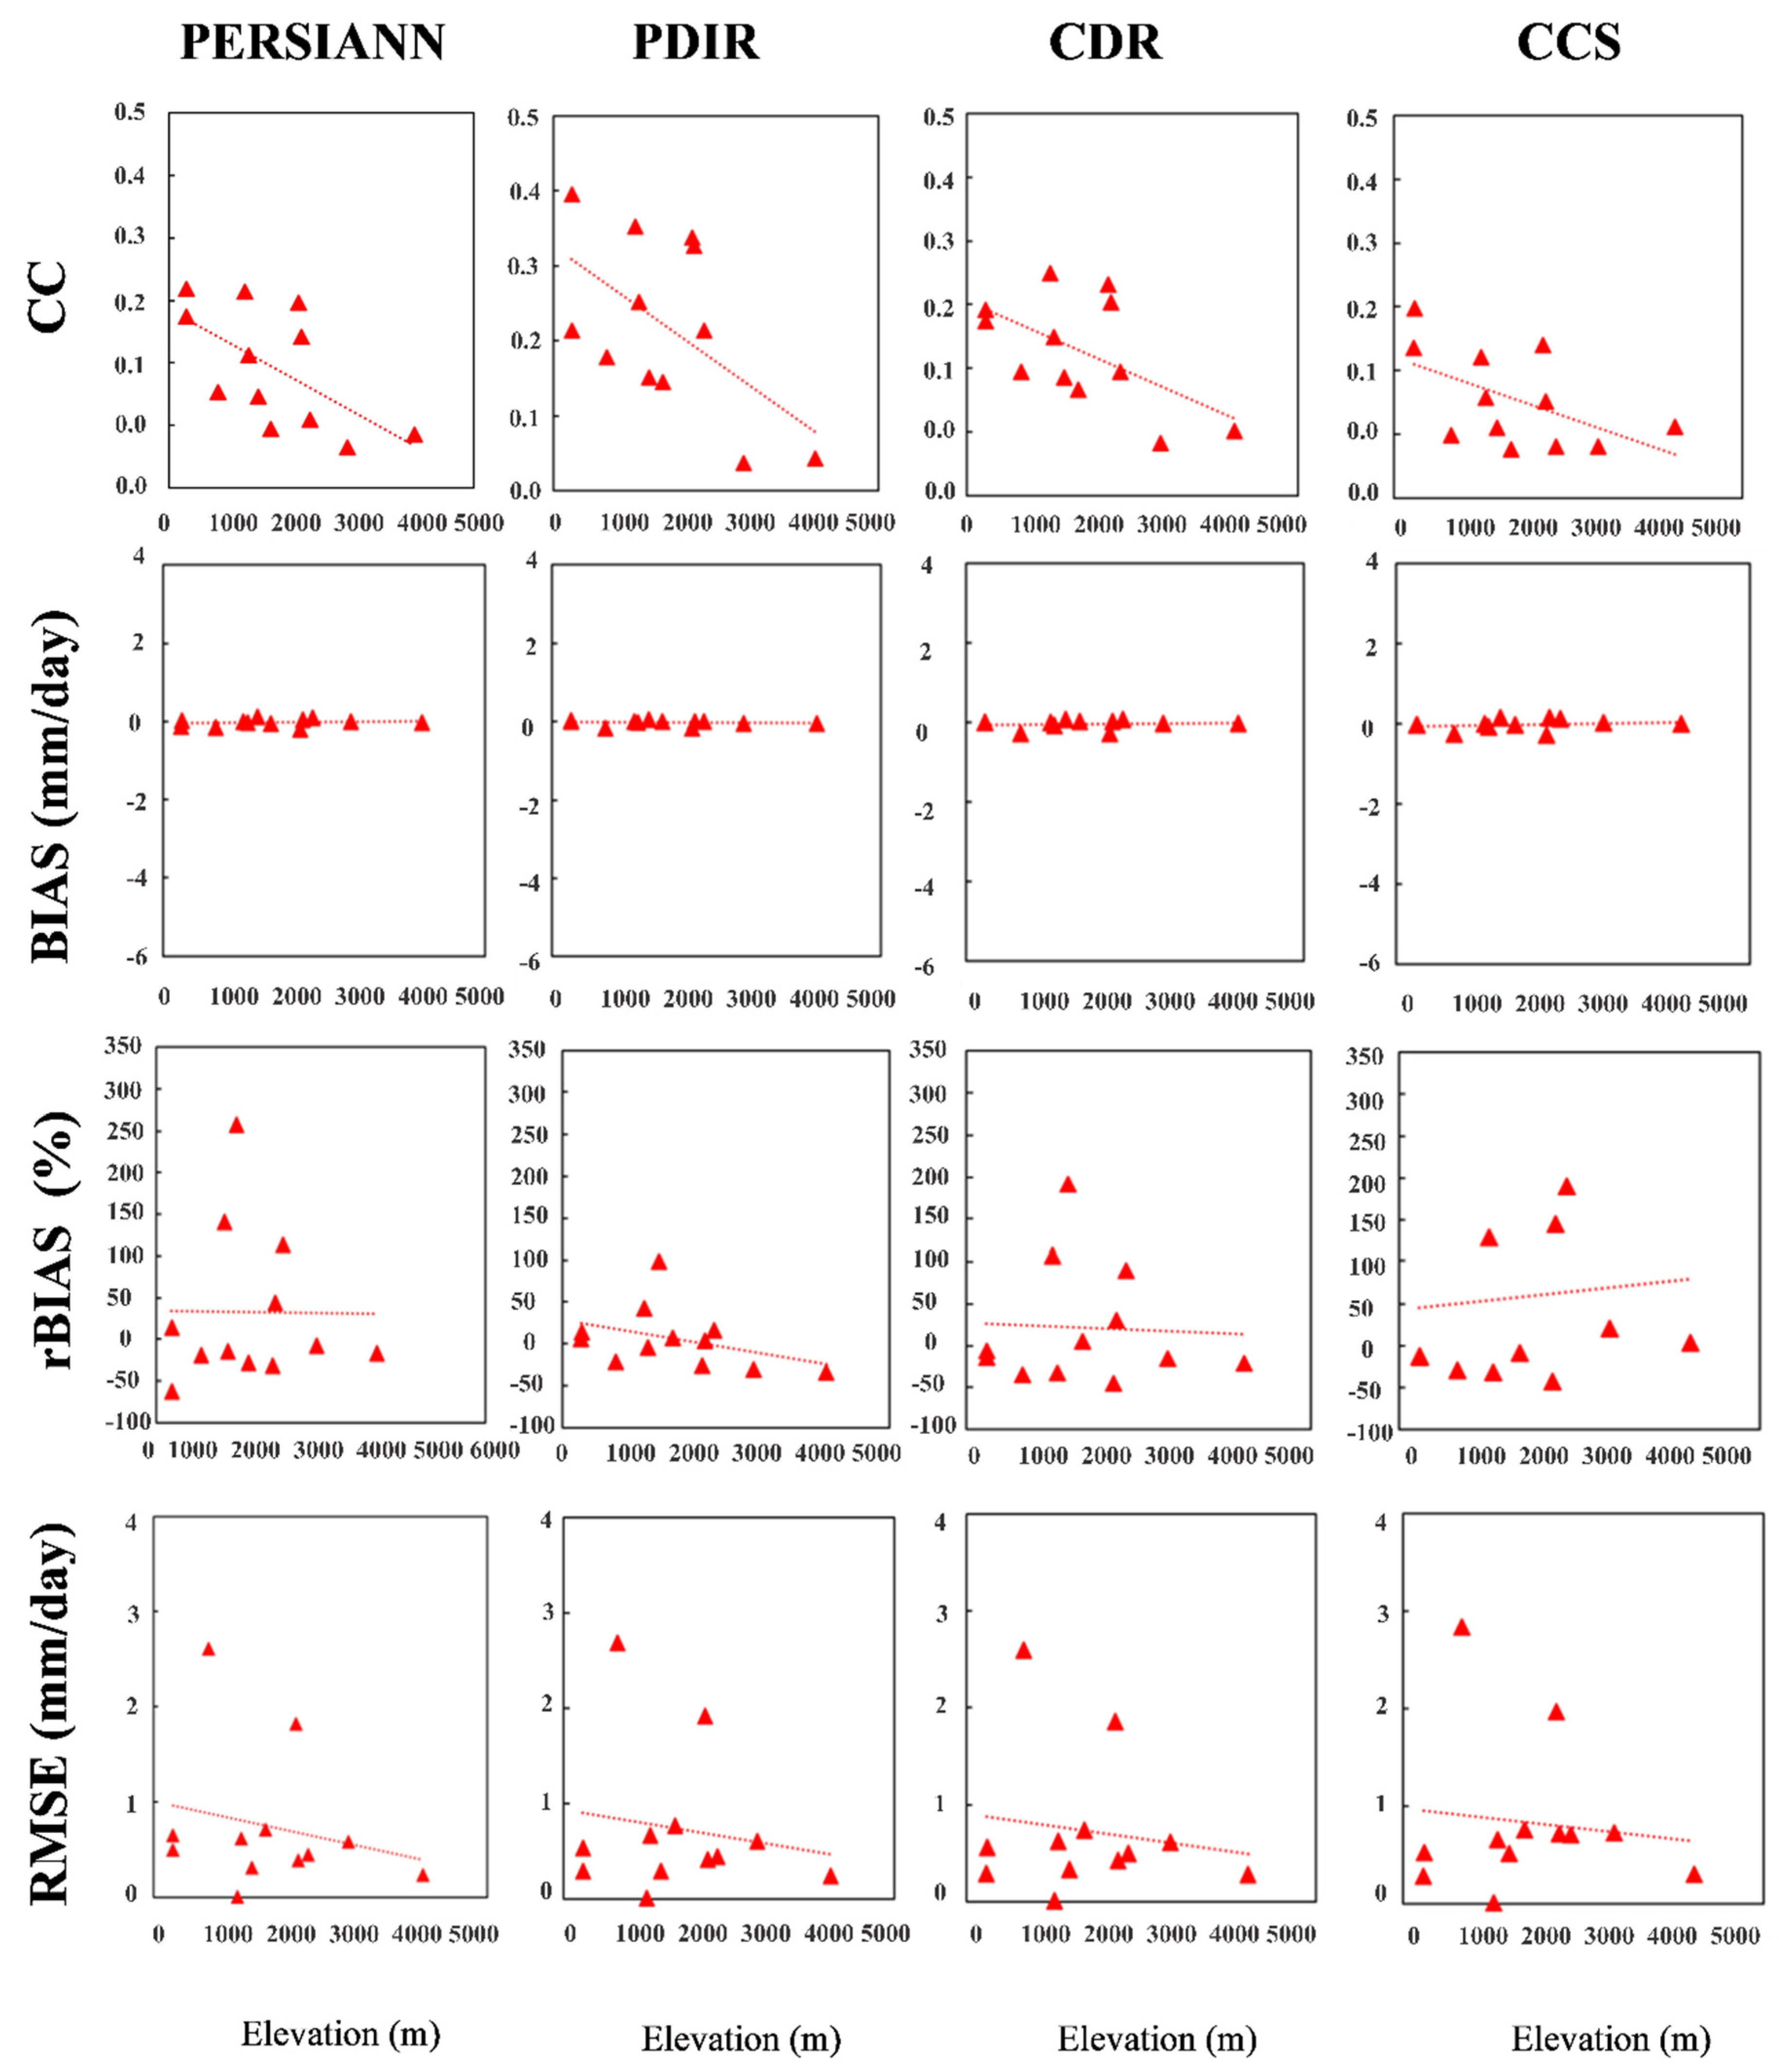
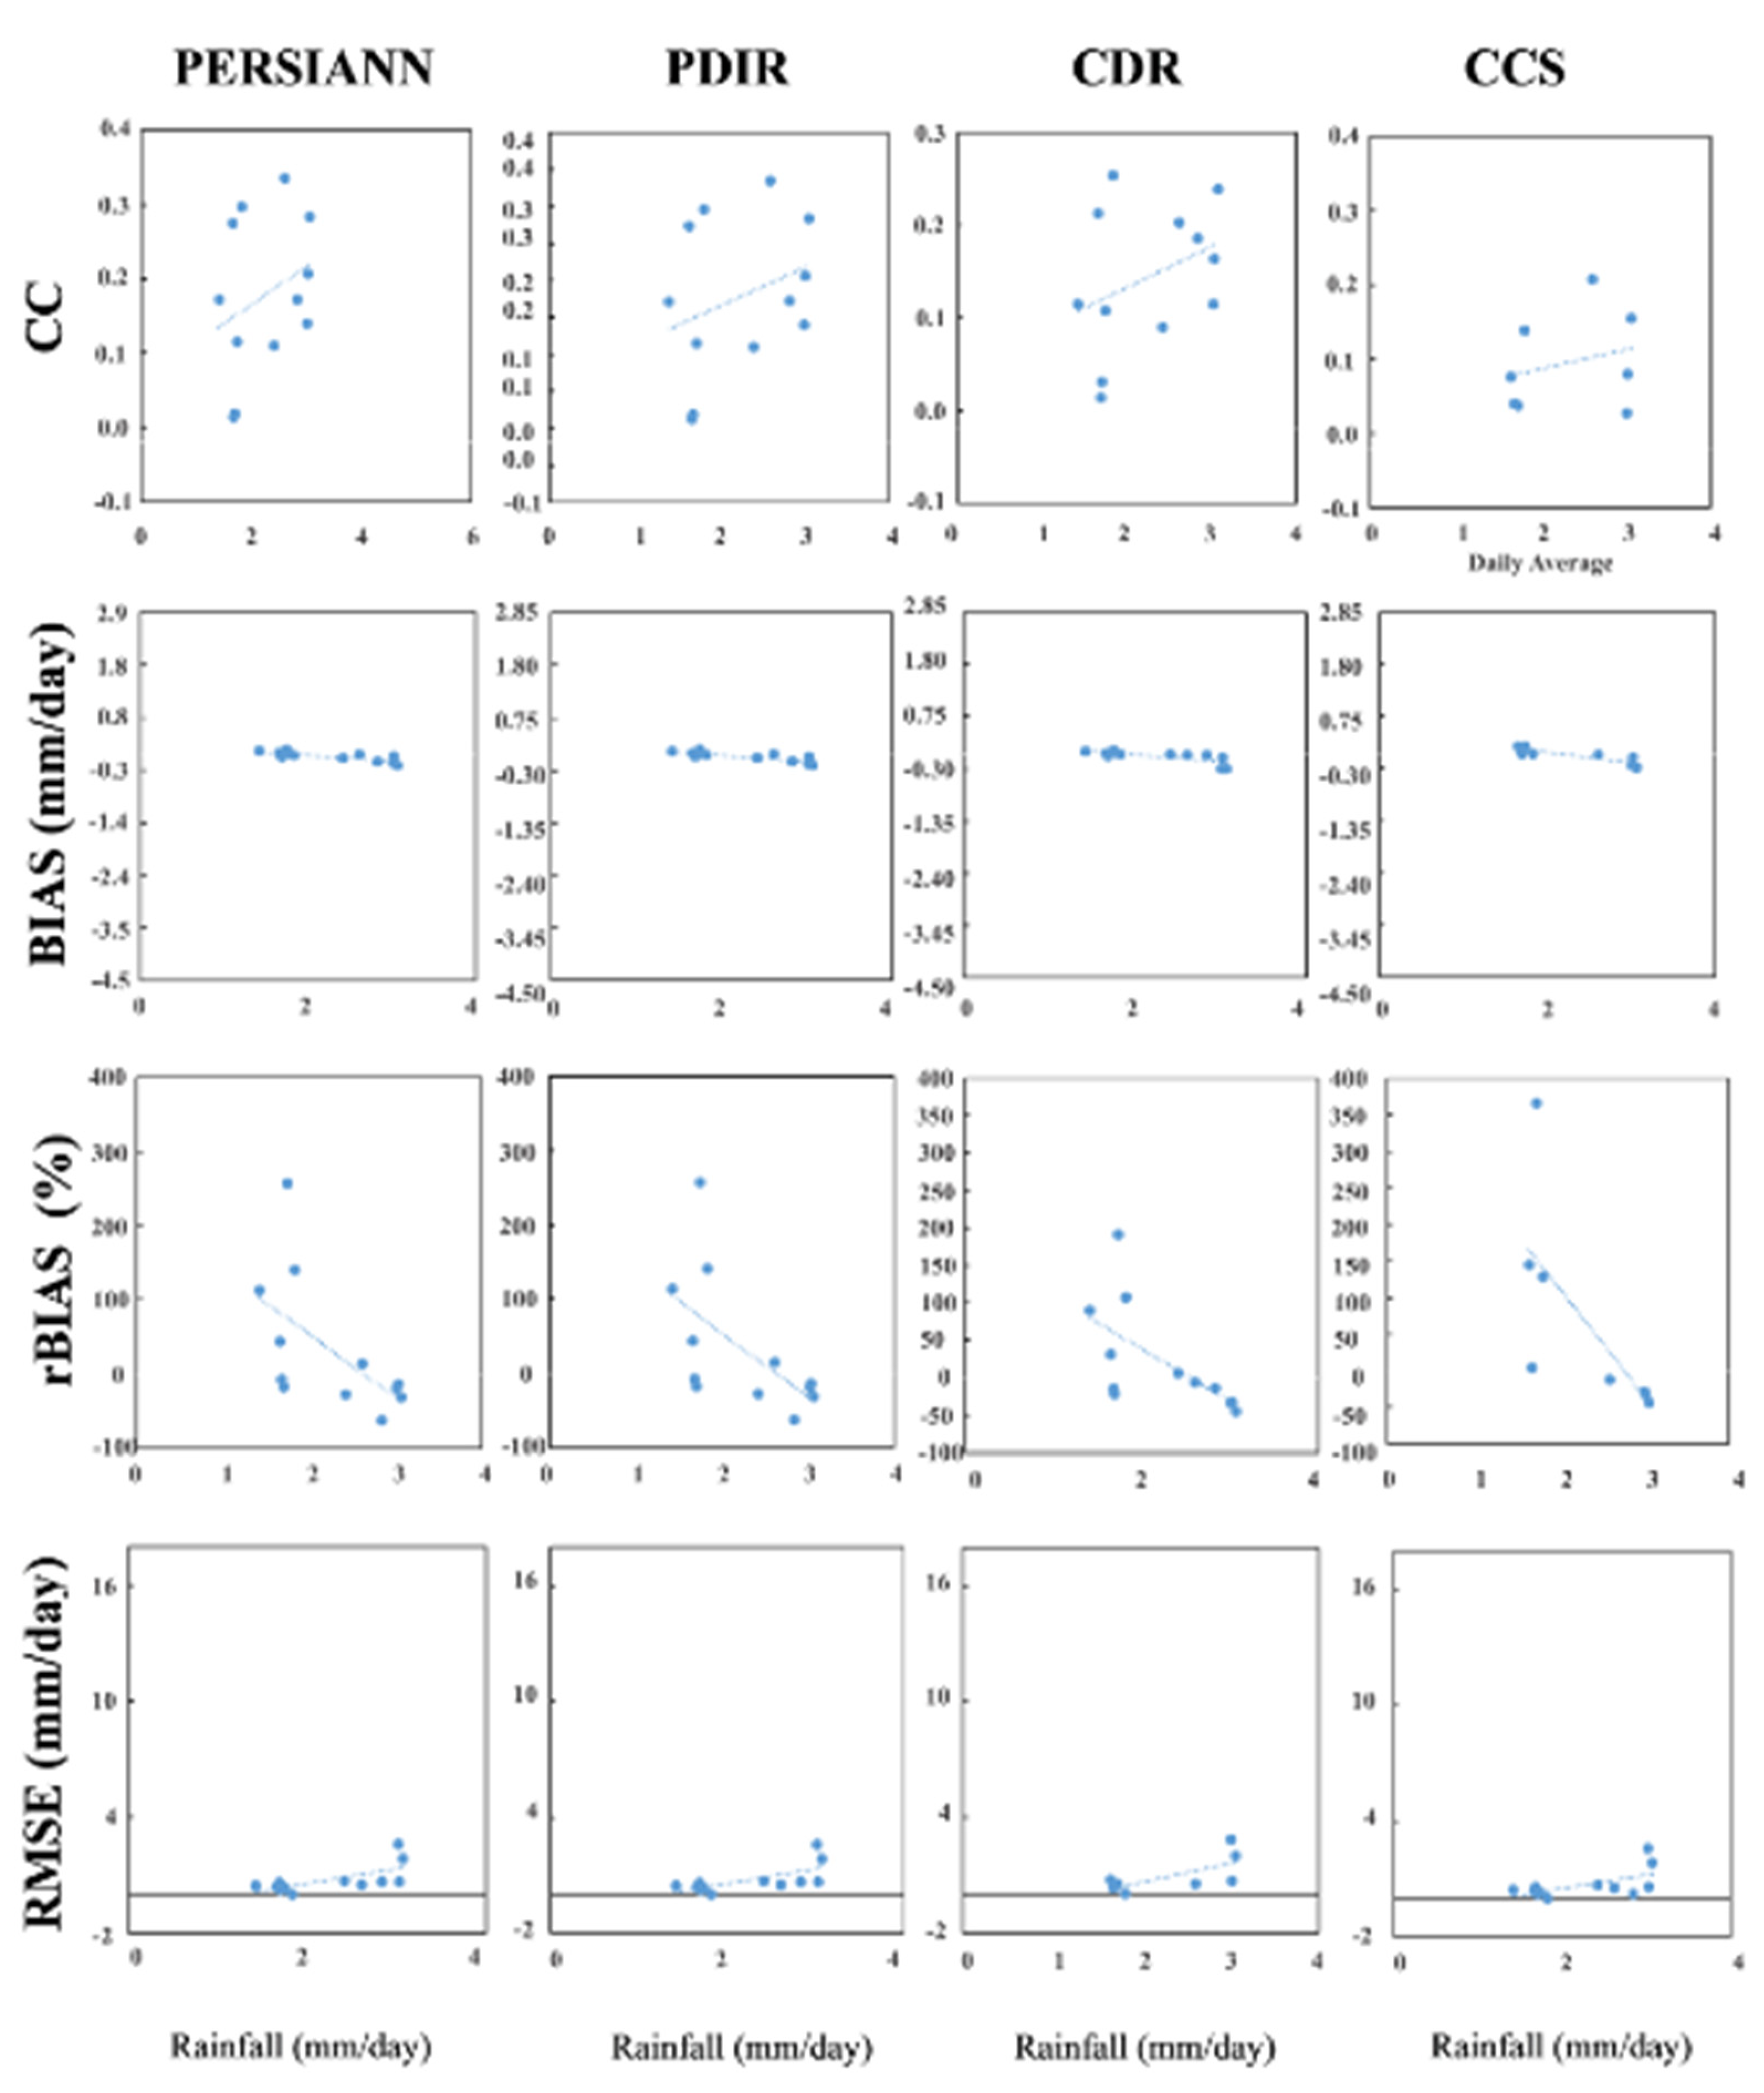
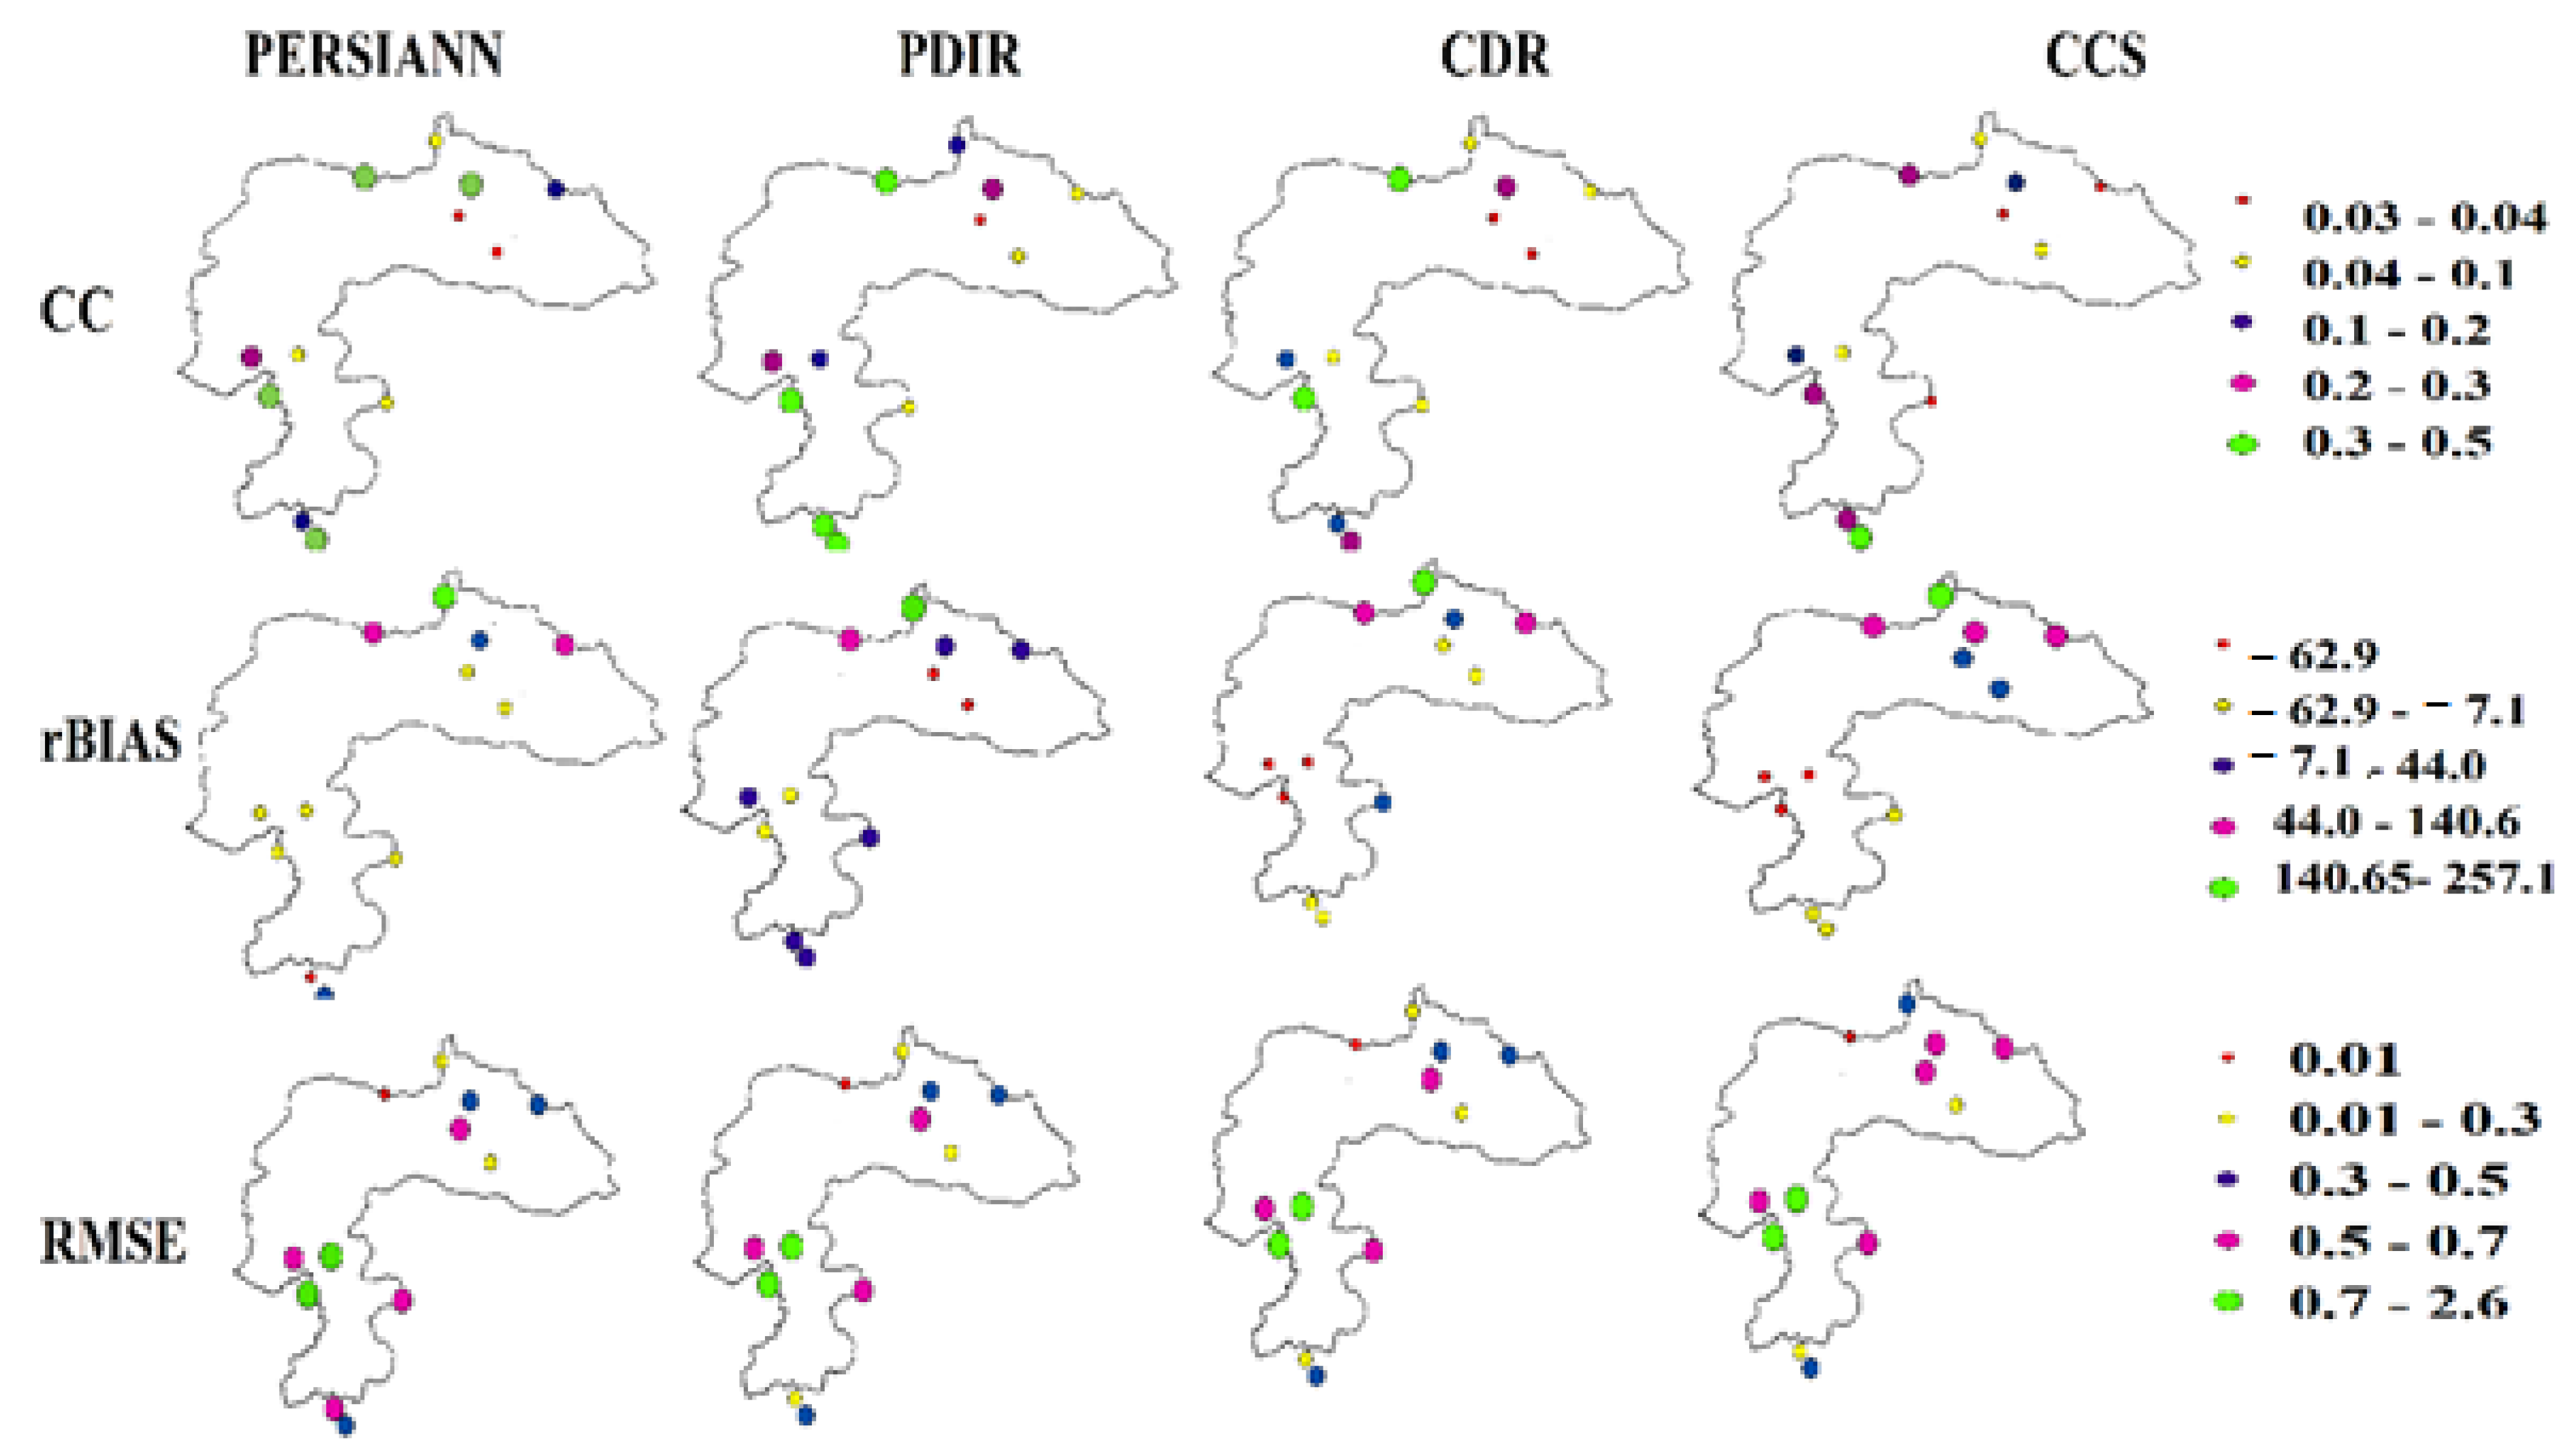
3. Results
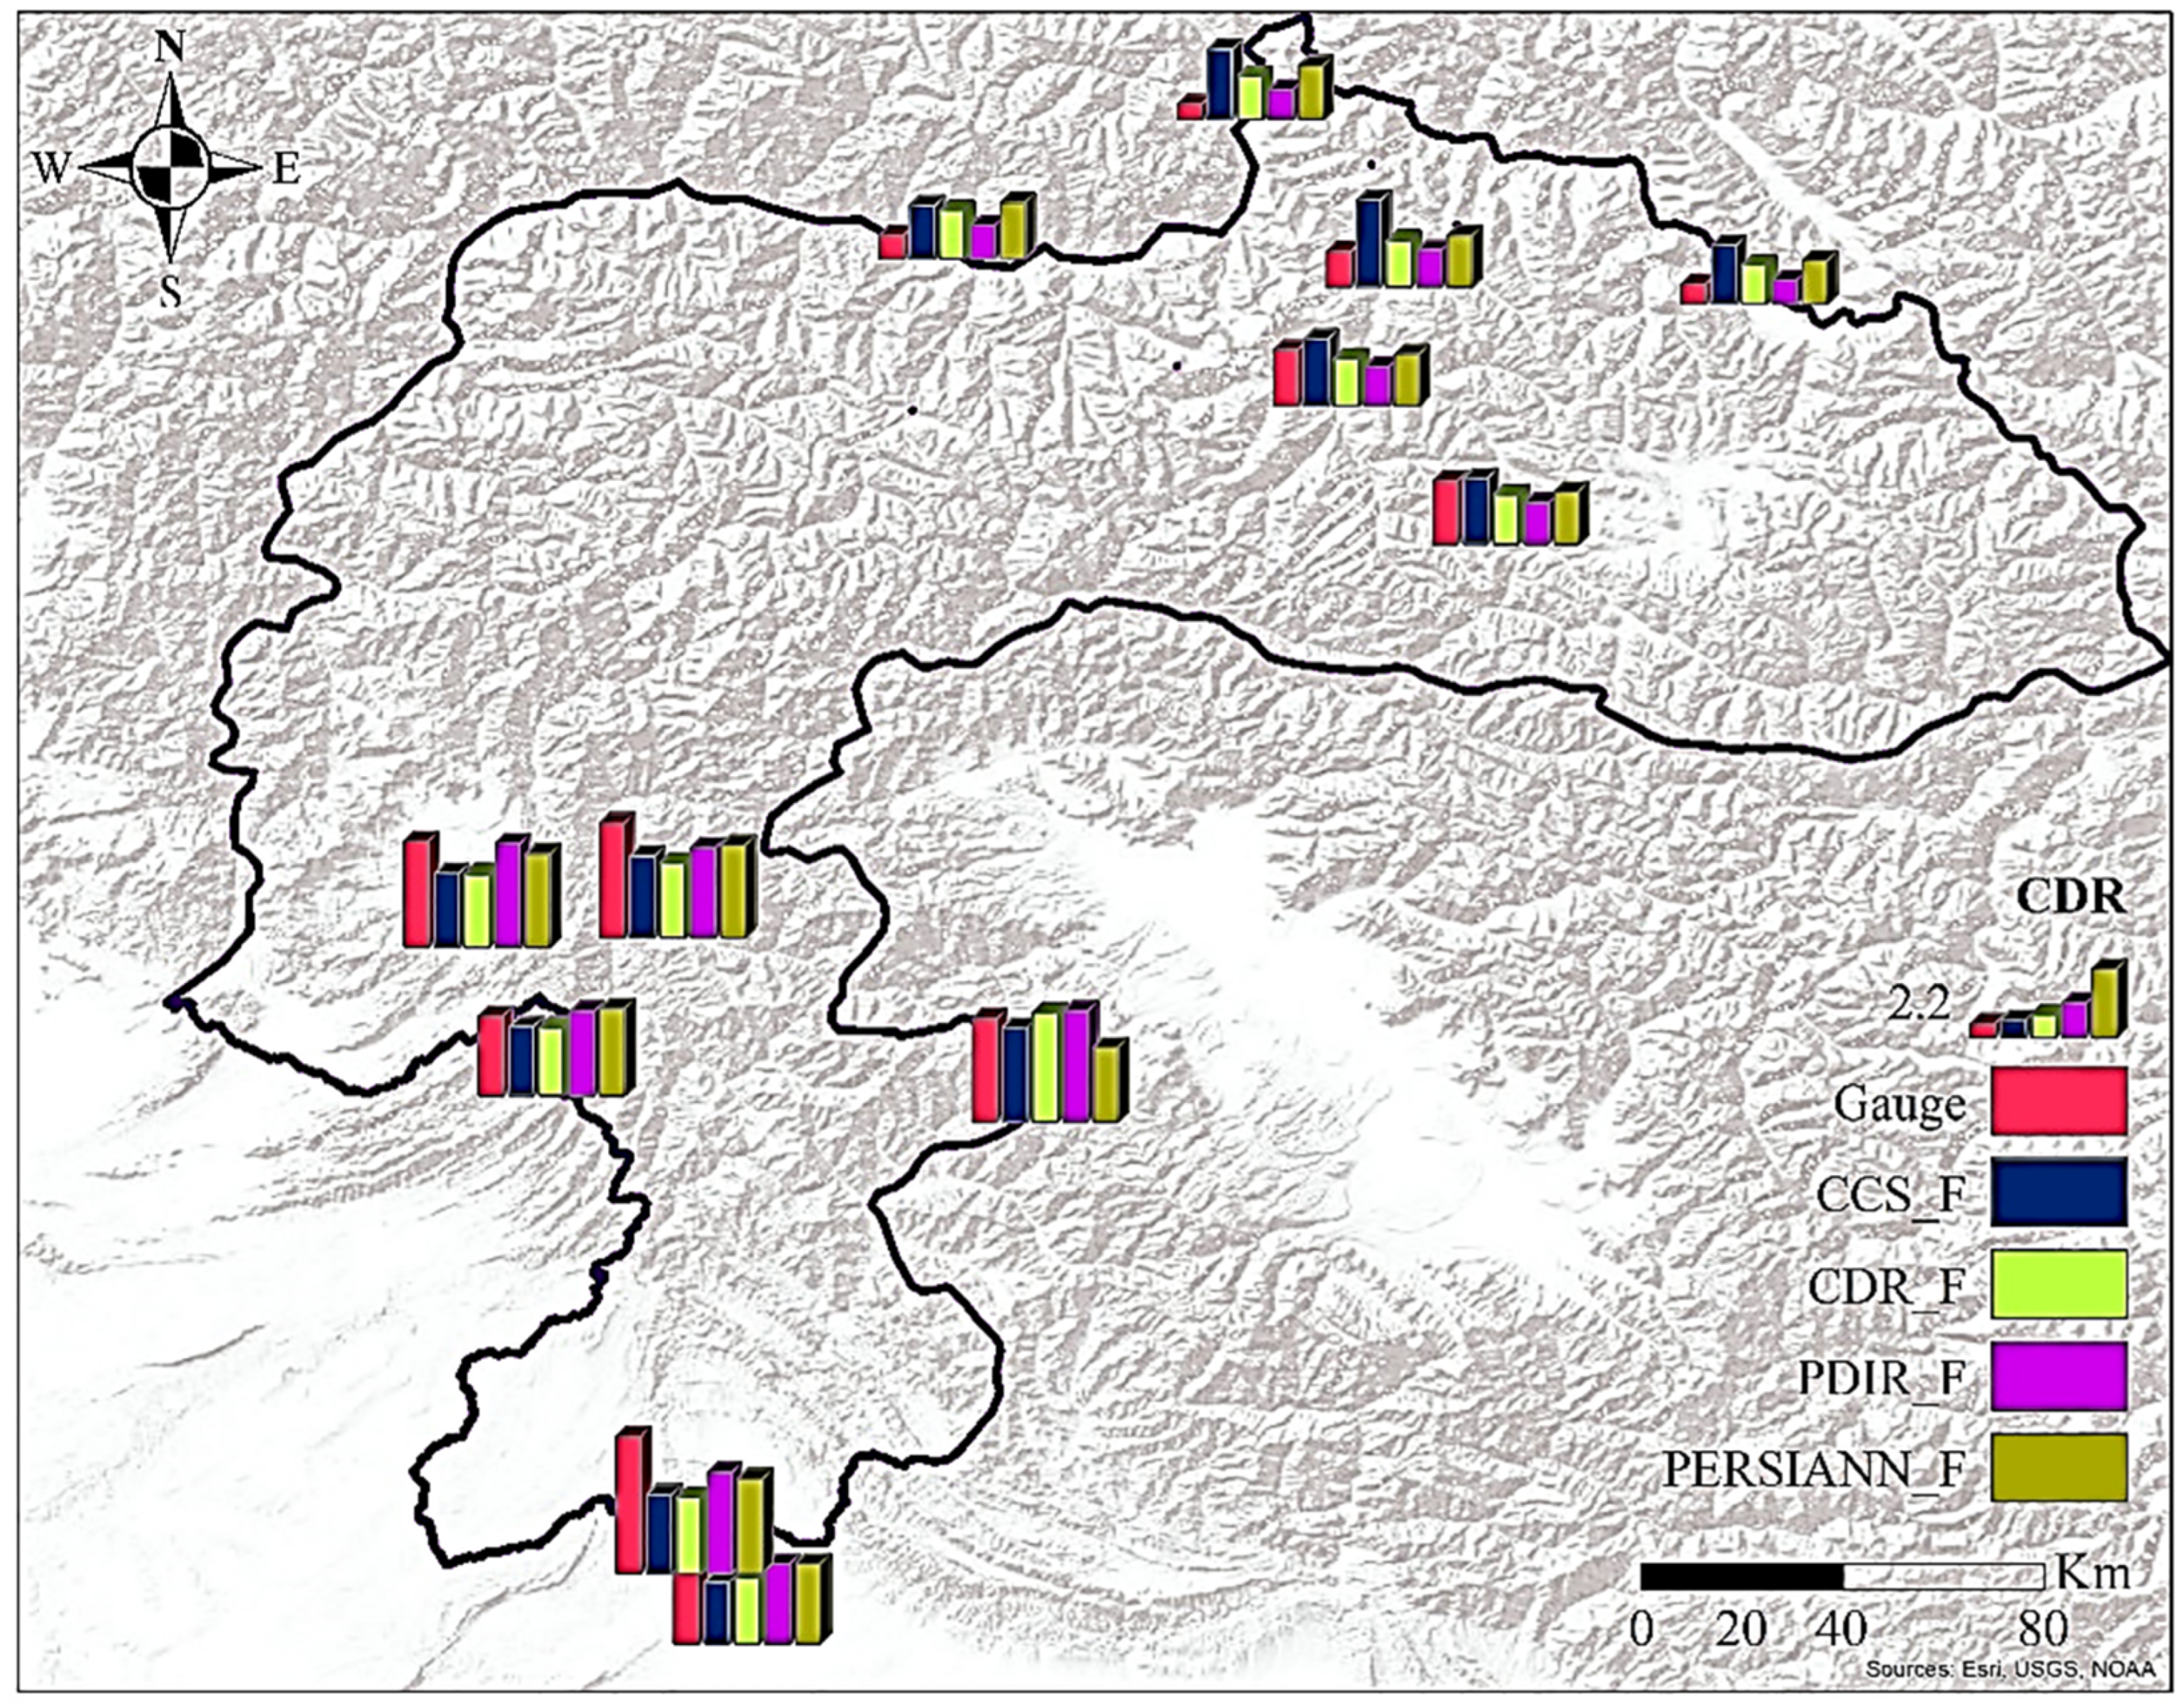
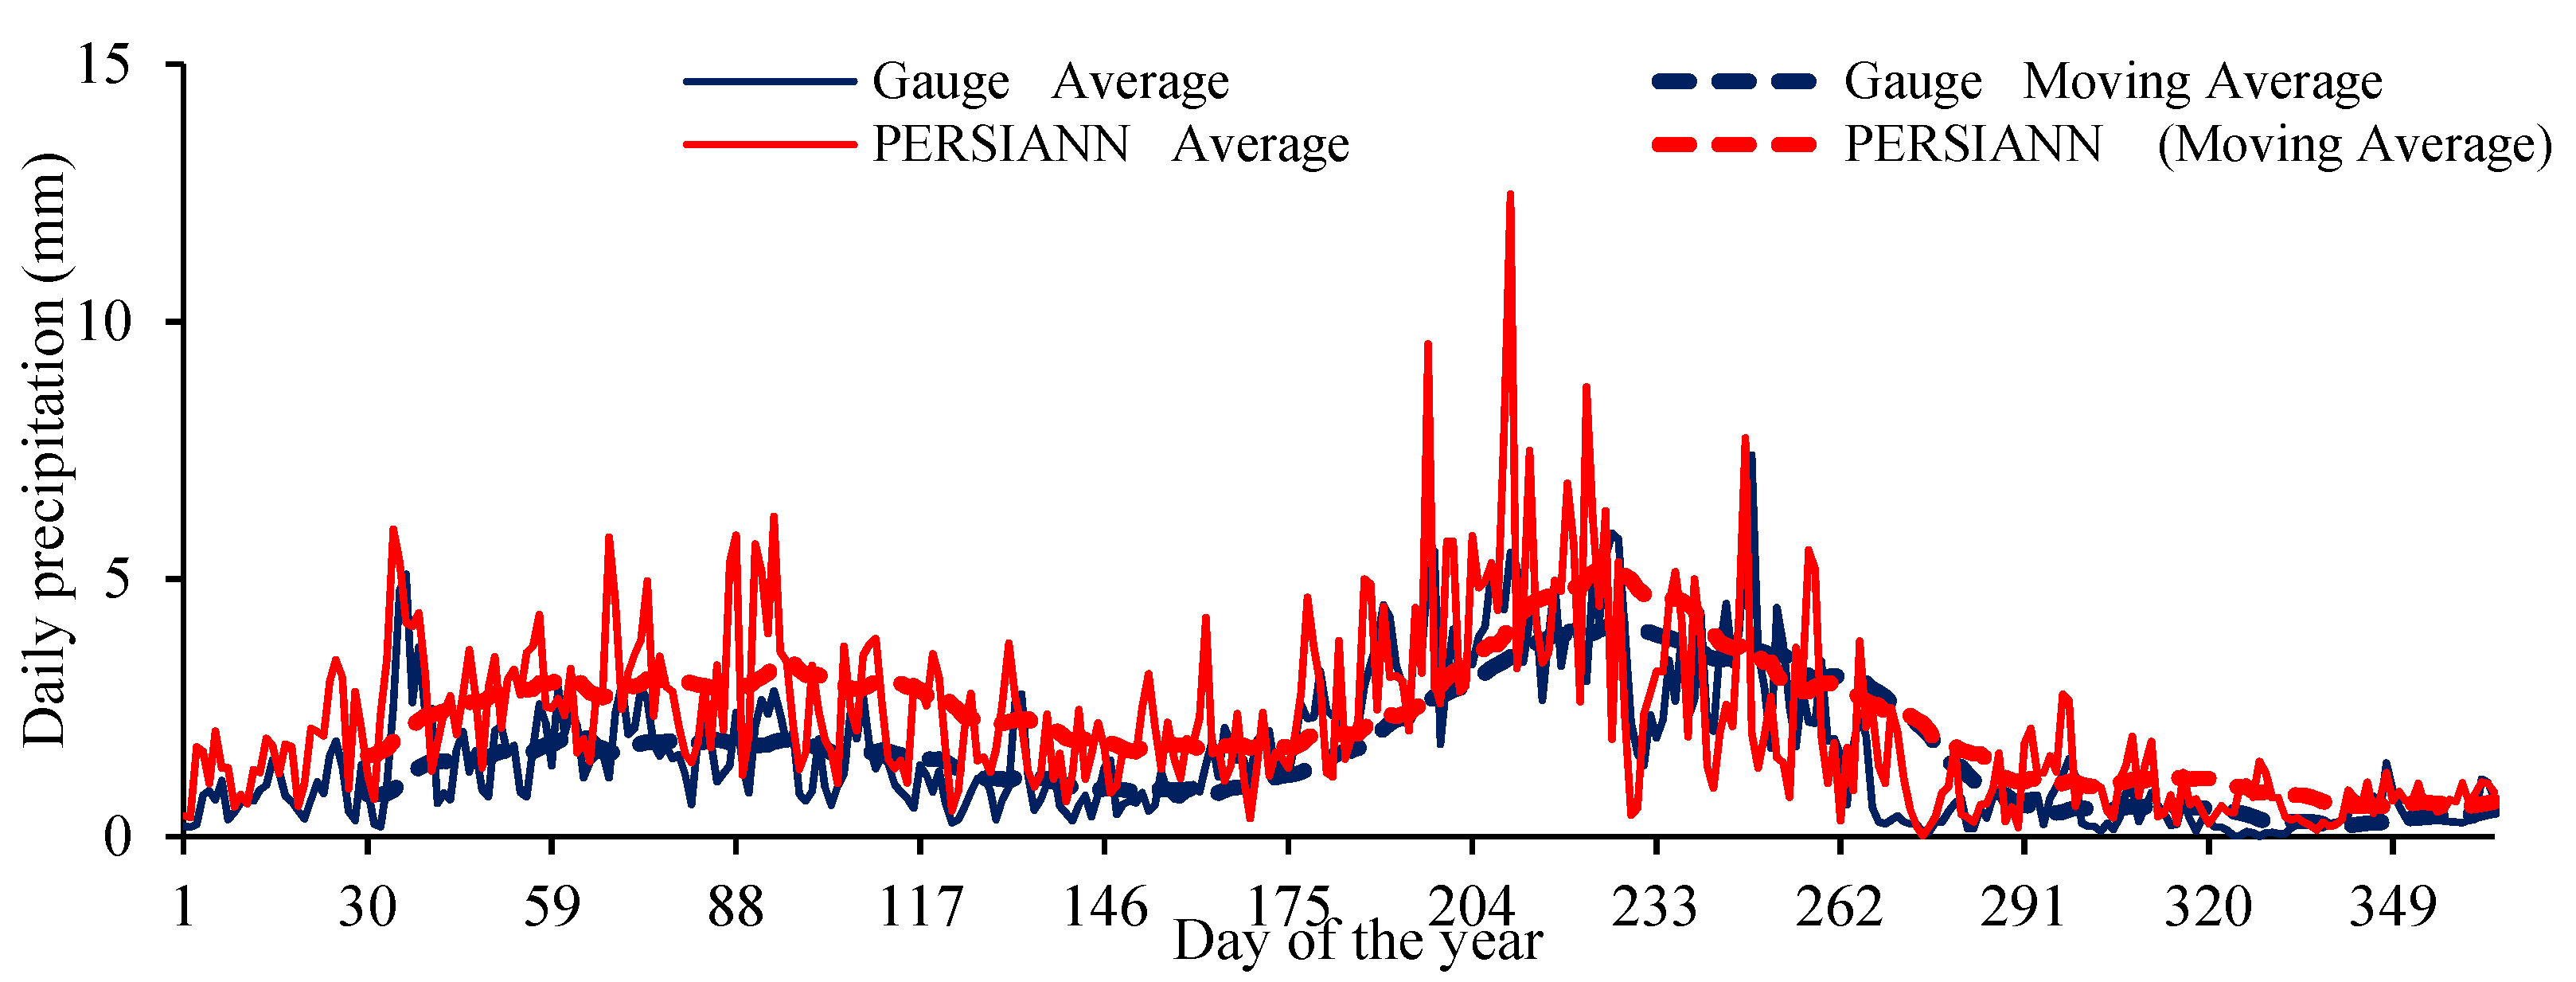
3.1. Potential of PERSIANN Family Products to Monitor the Spatial and Temporal Variability of Precipitation
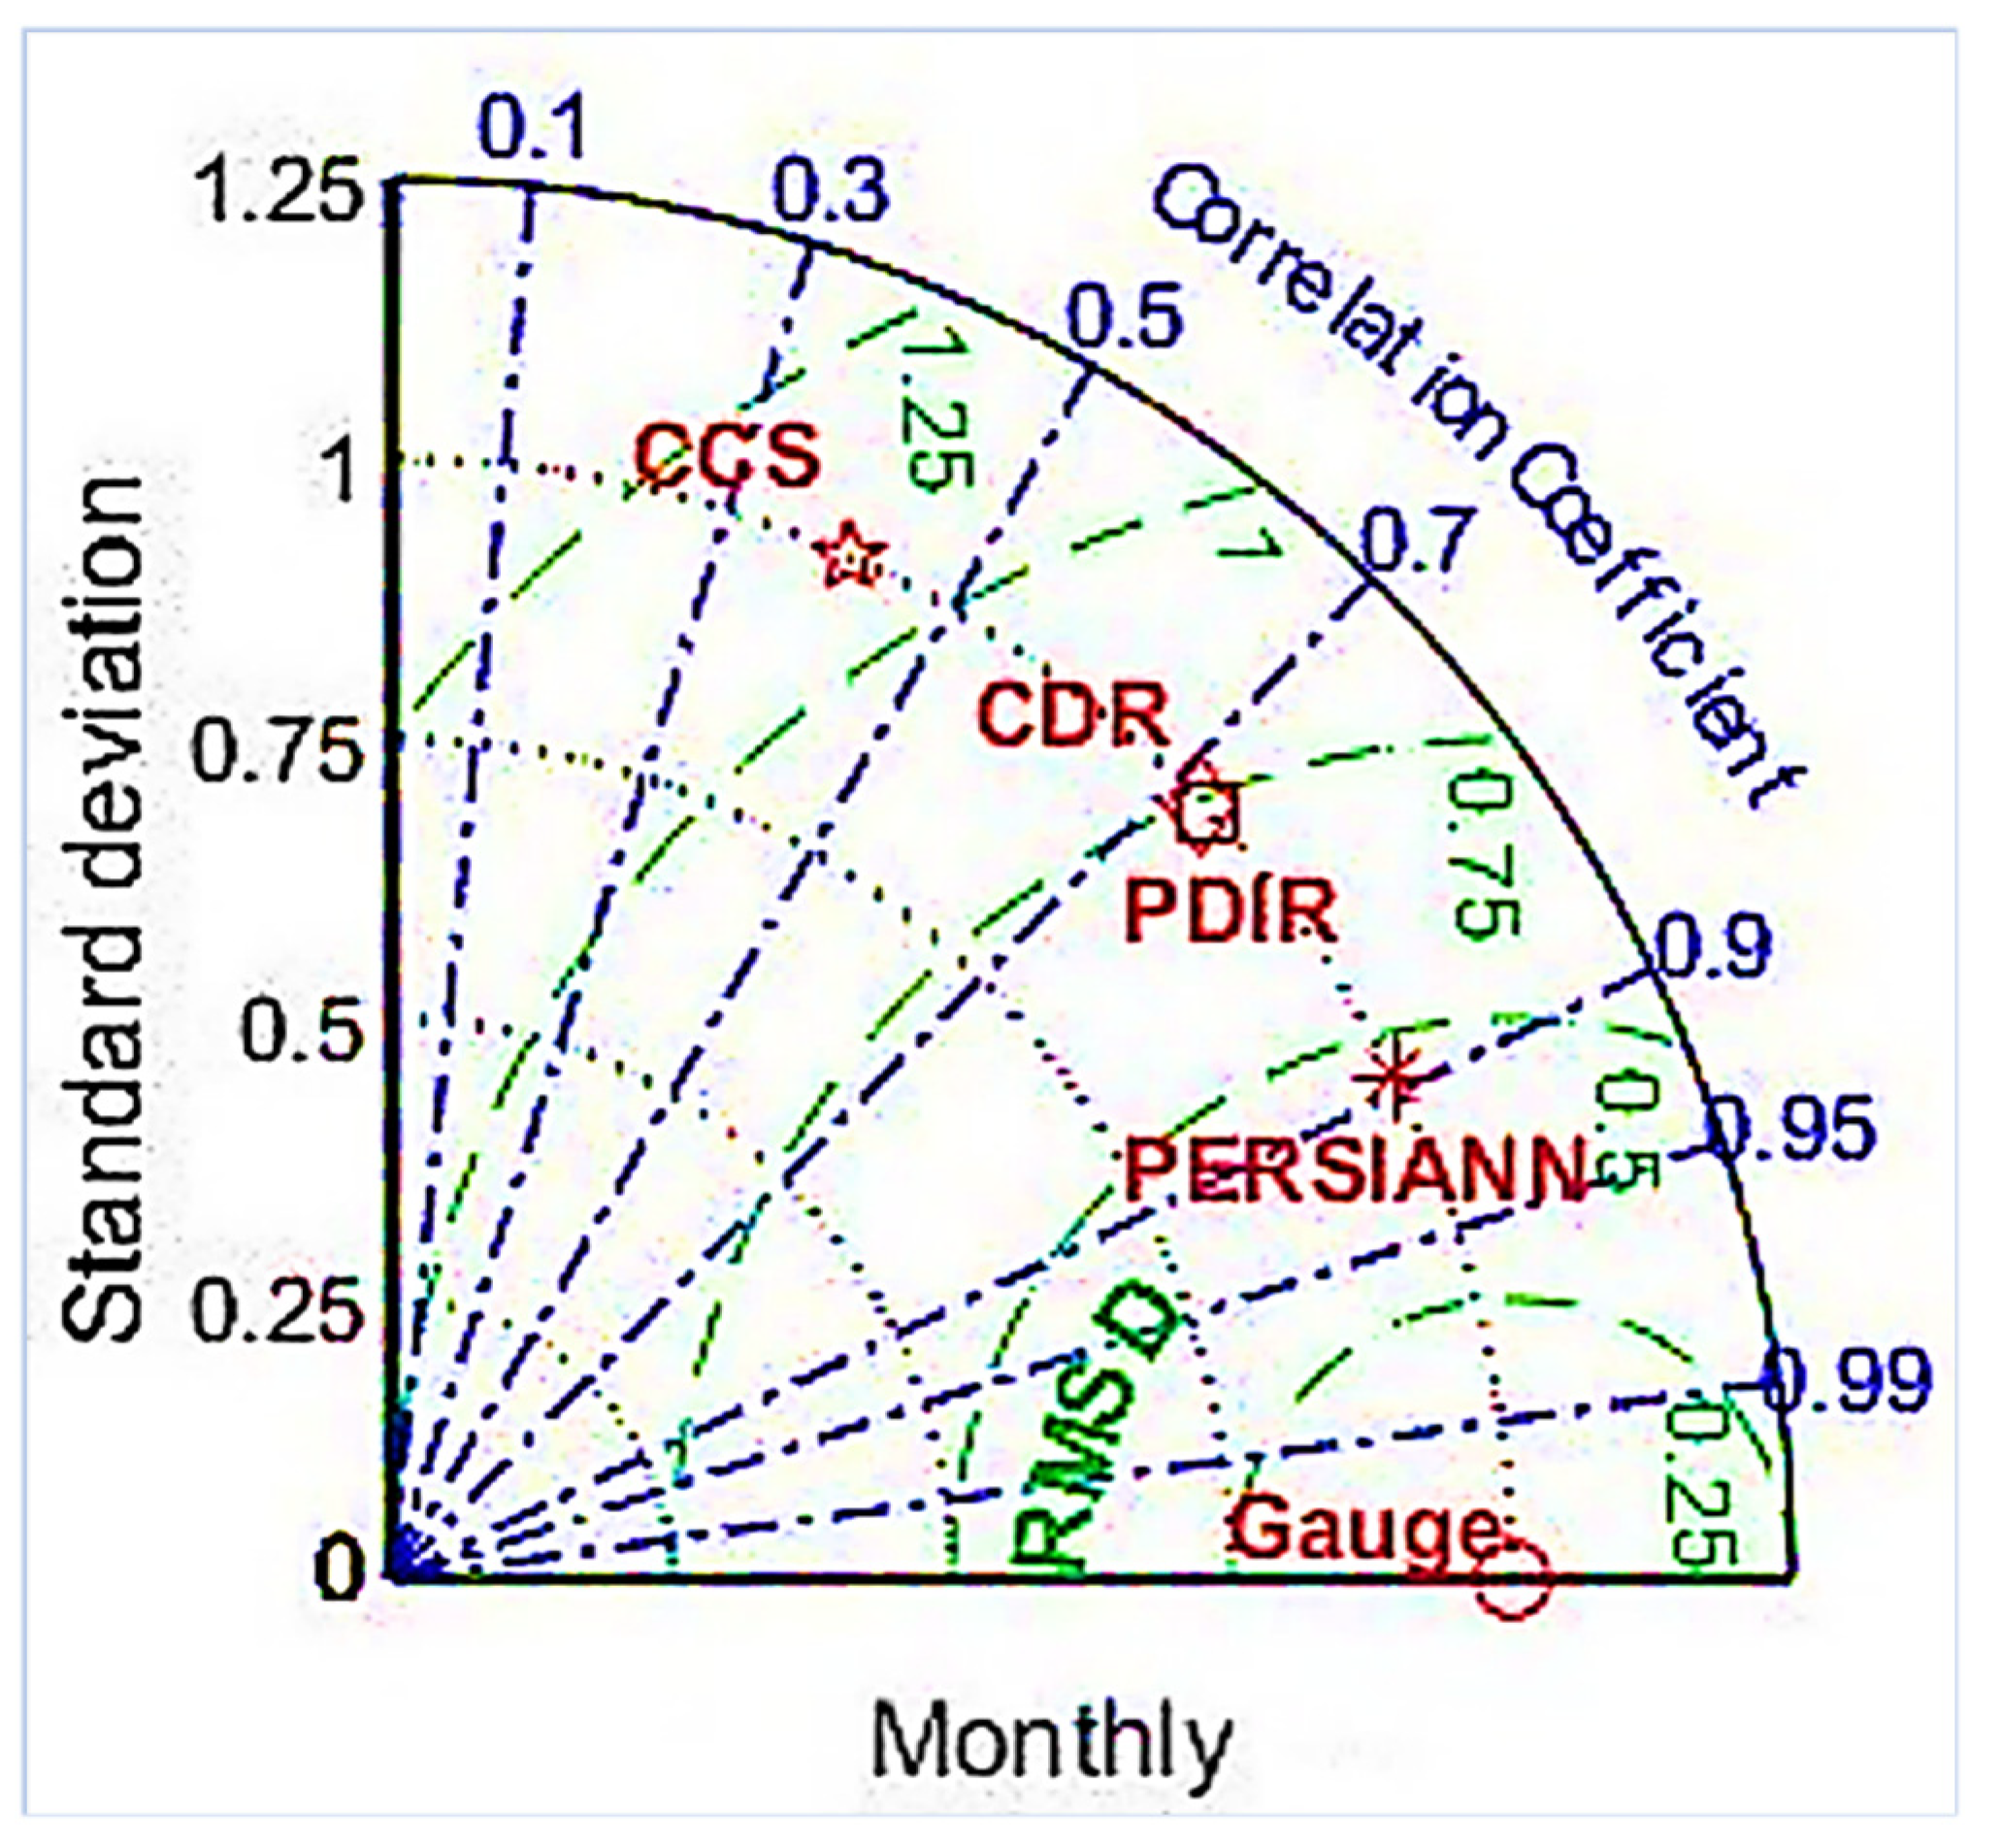
3.2. Performance of PERSIANN Family Products at the Monthly Scale
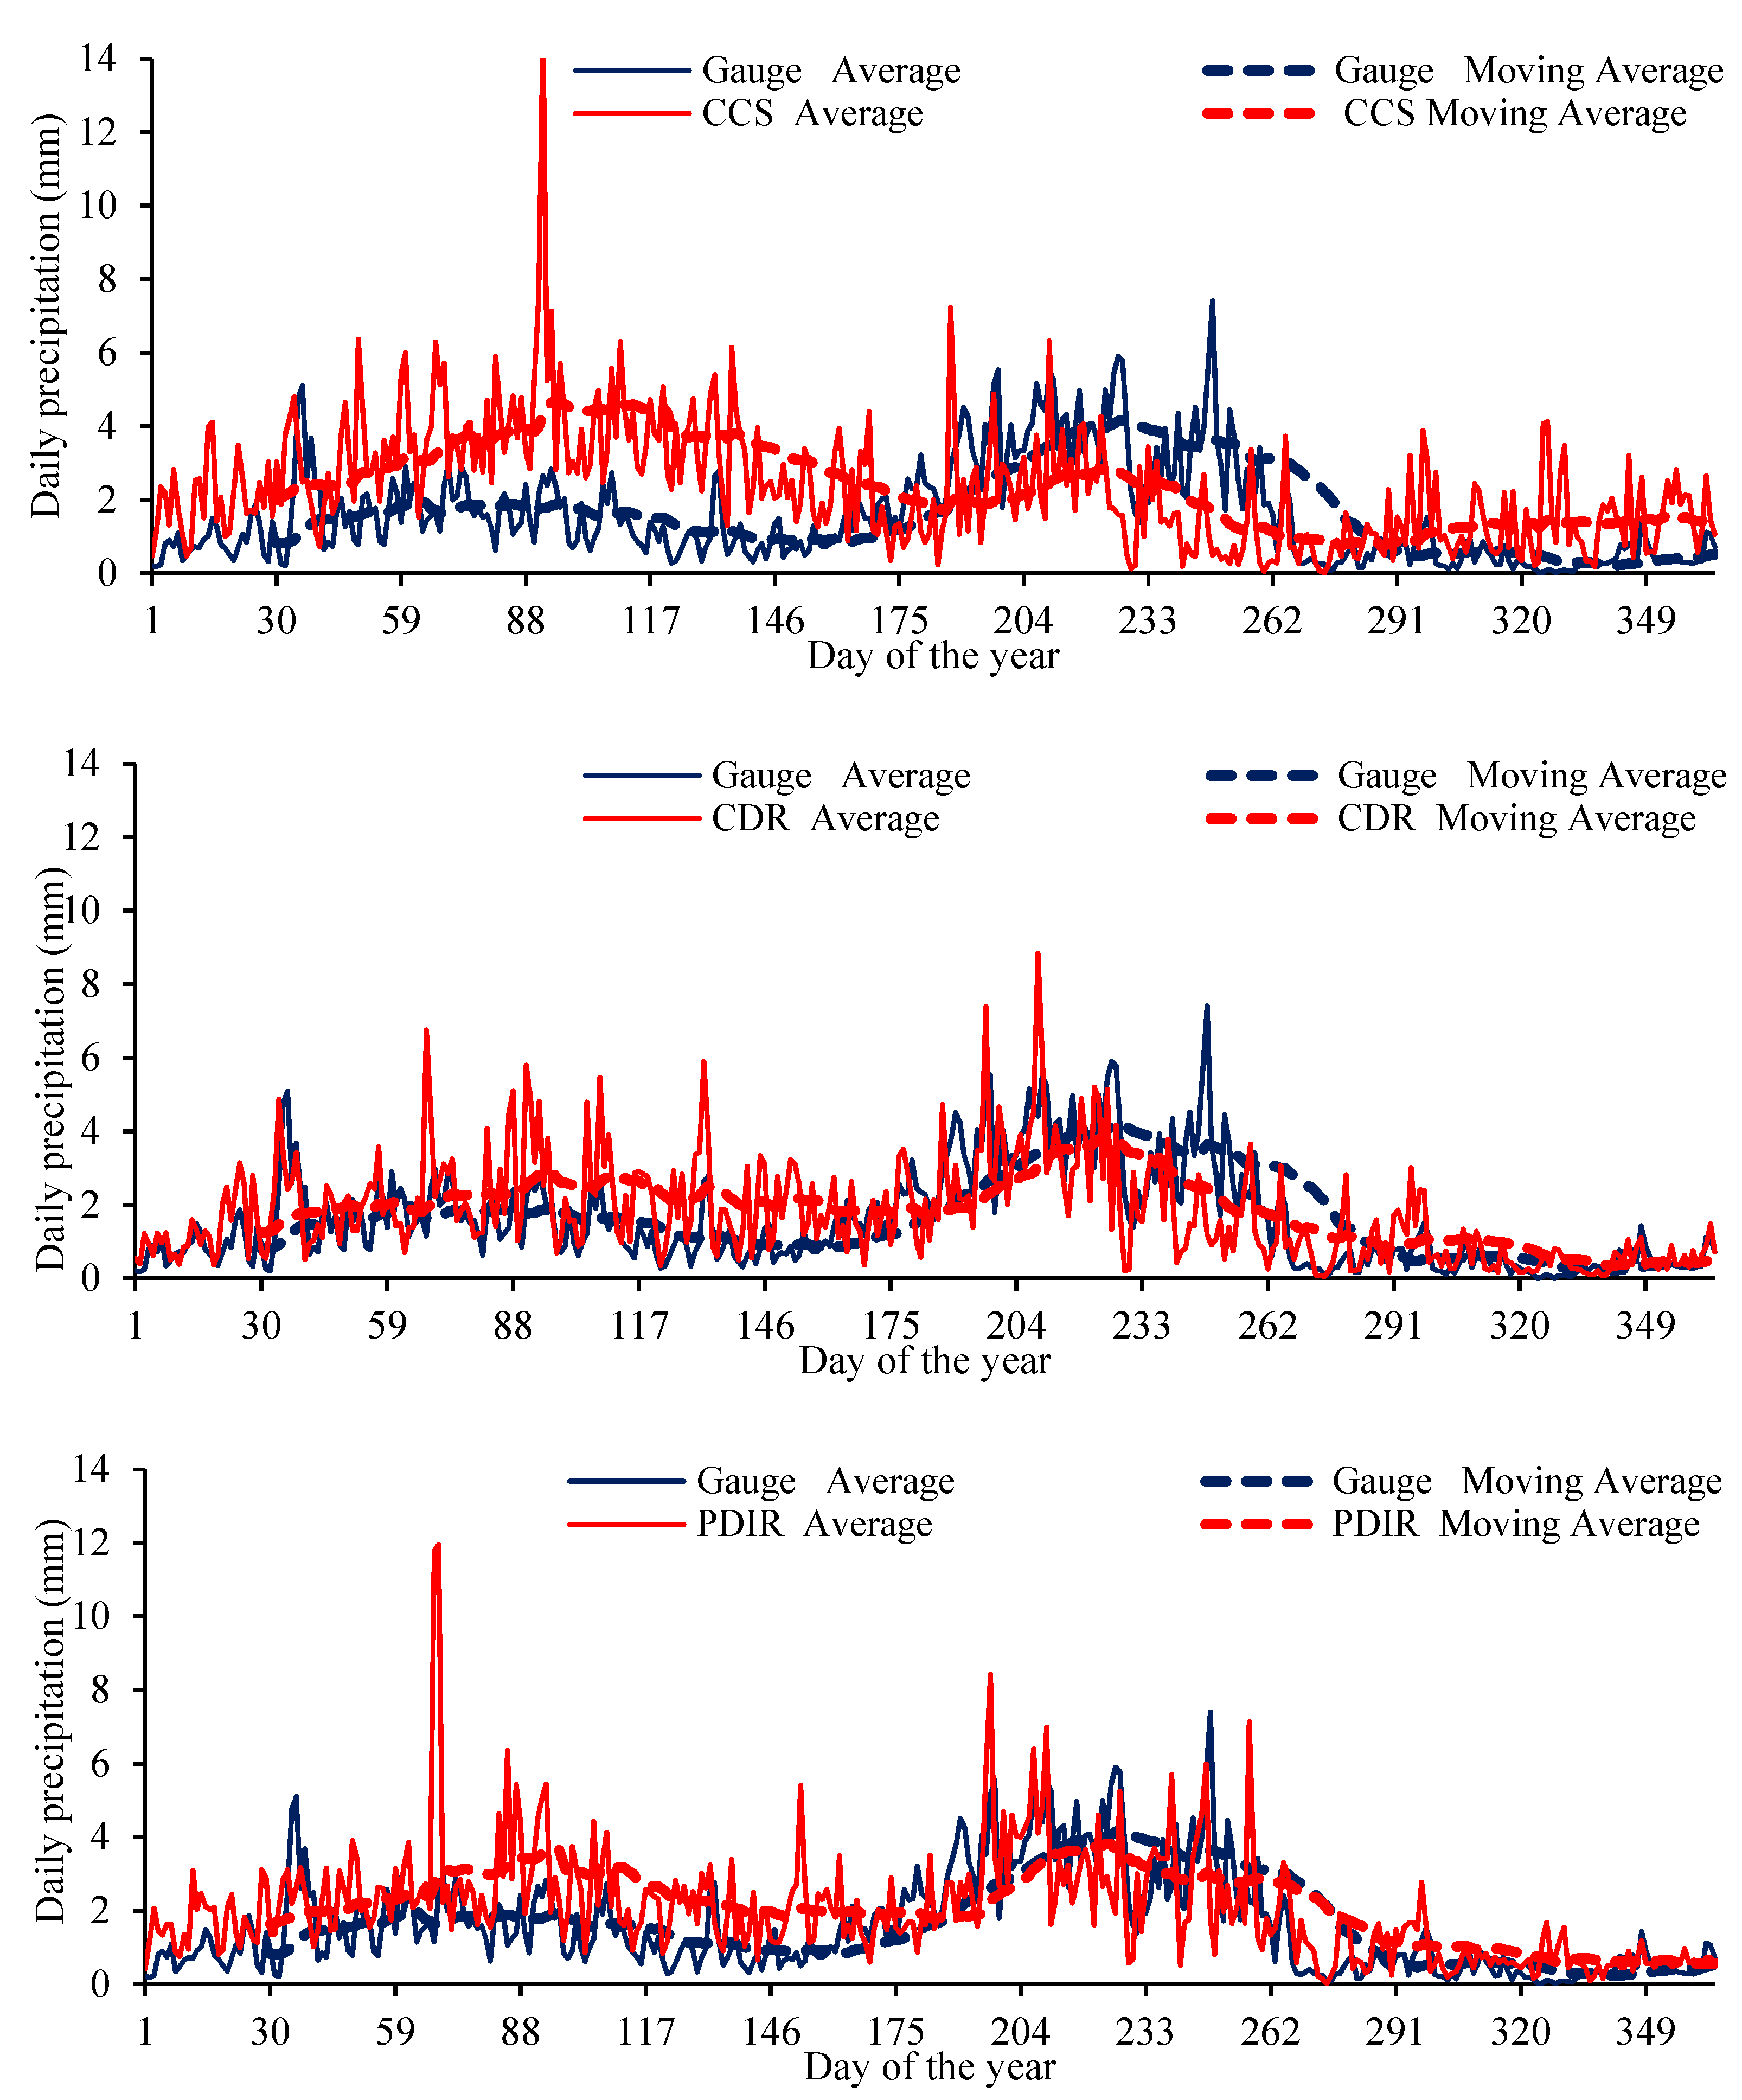
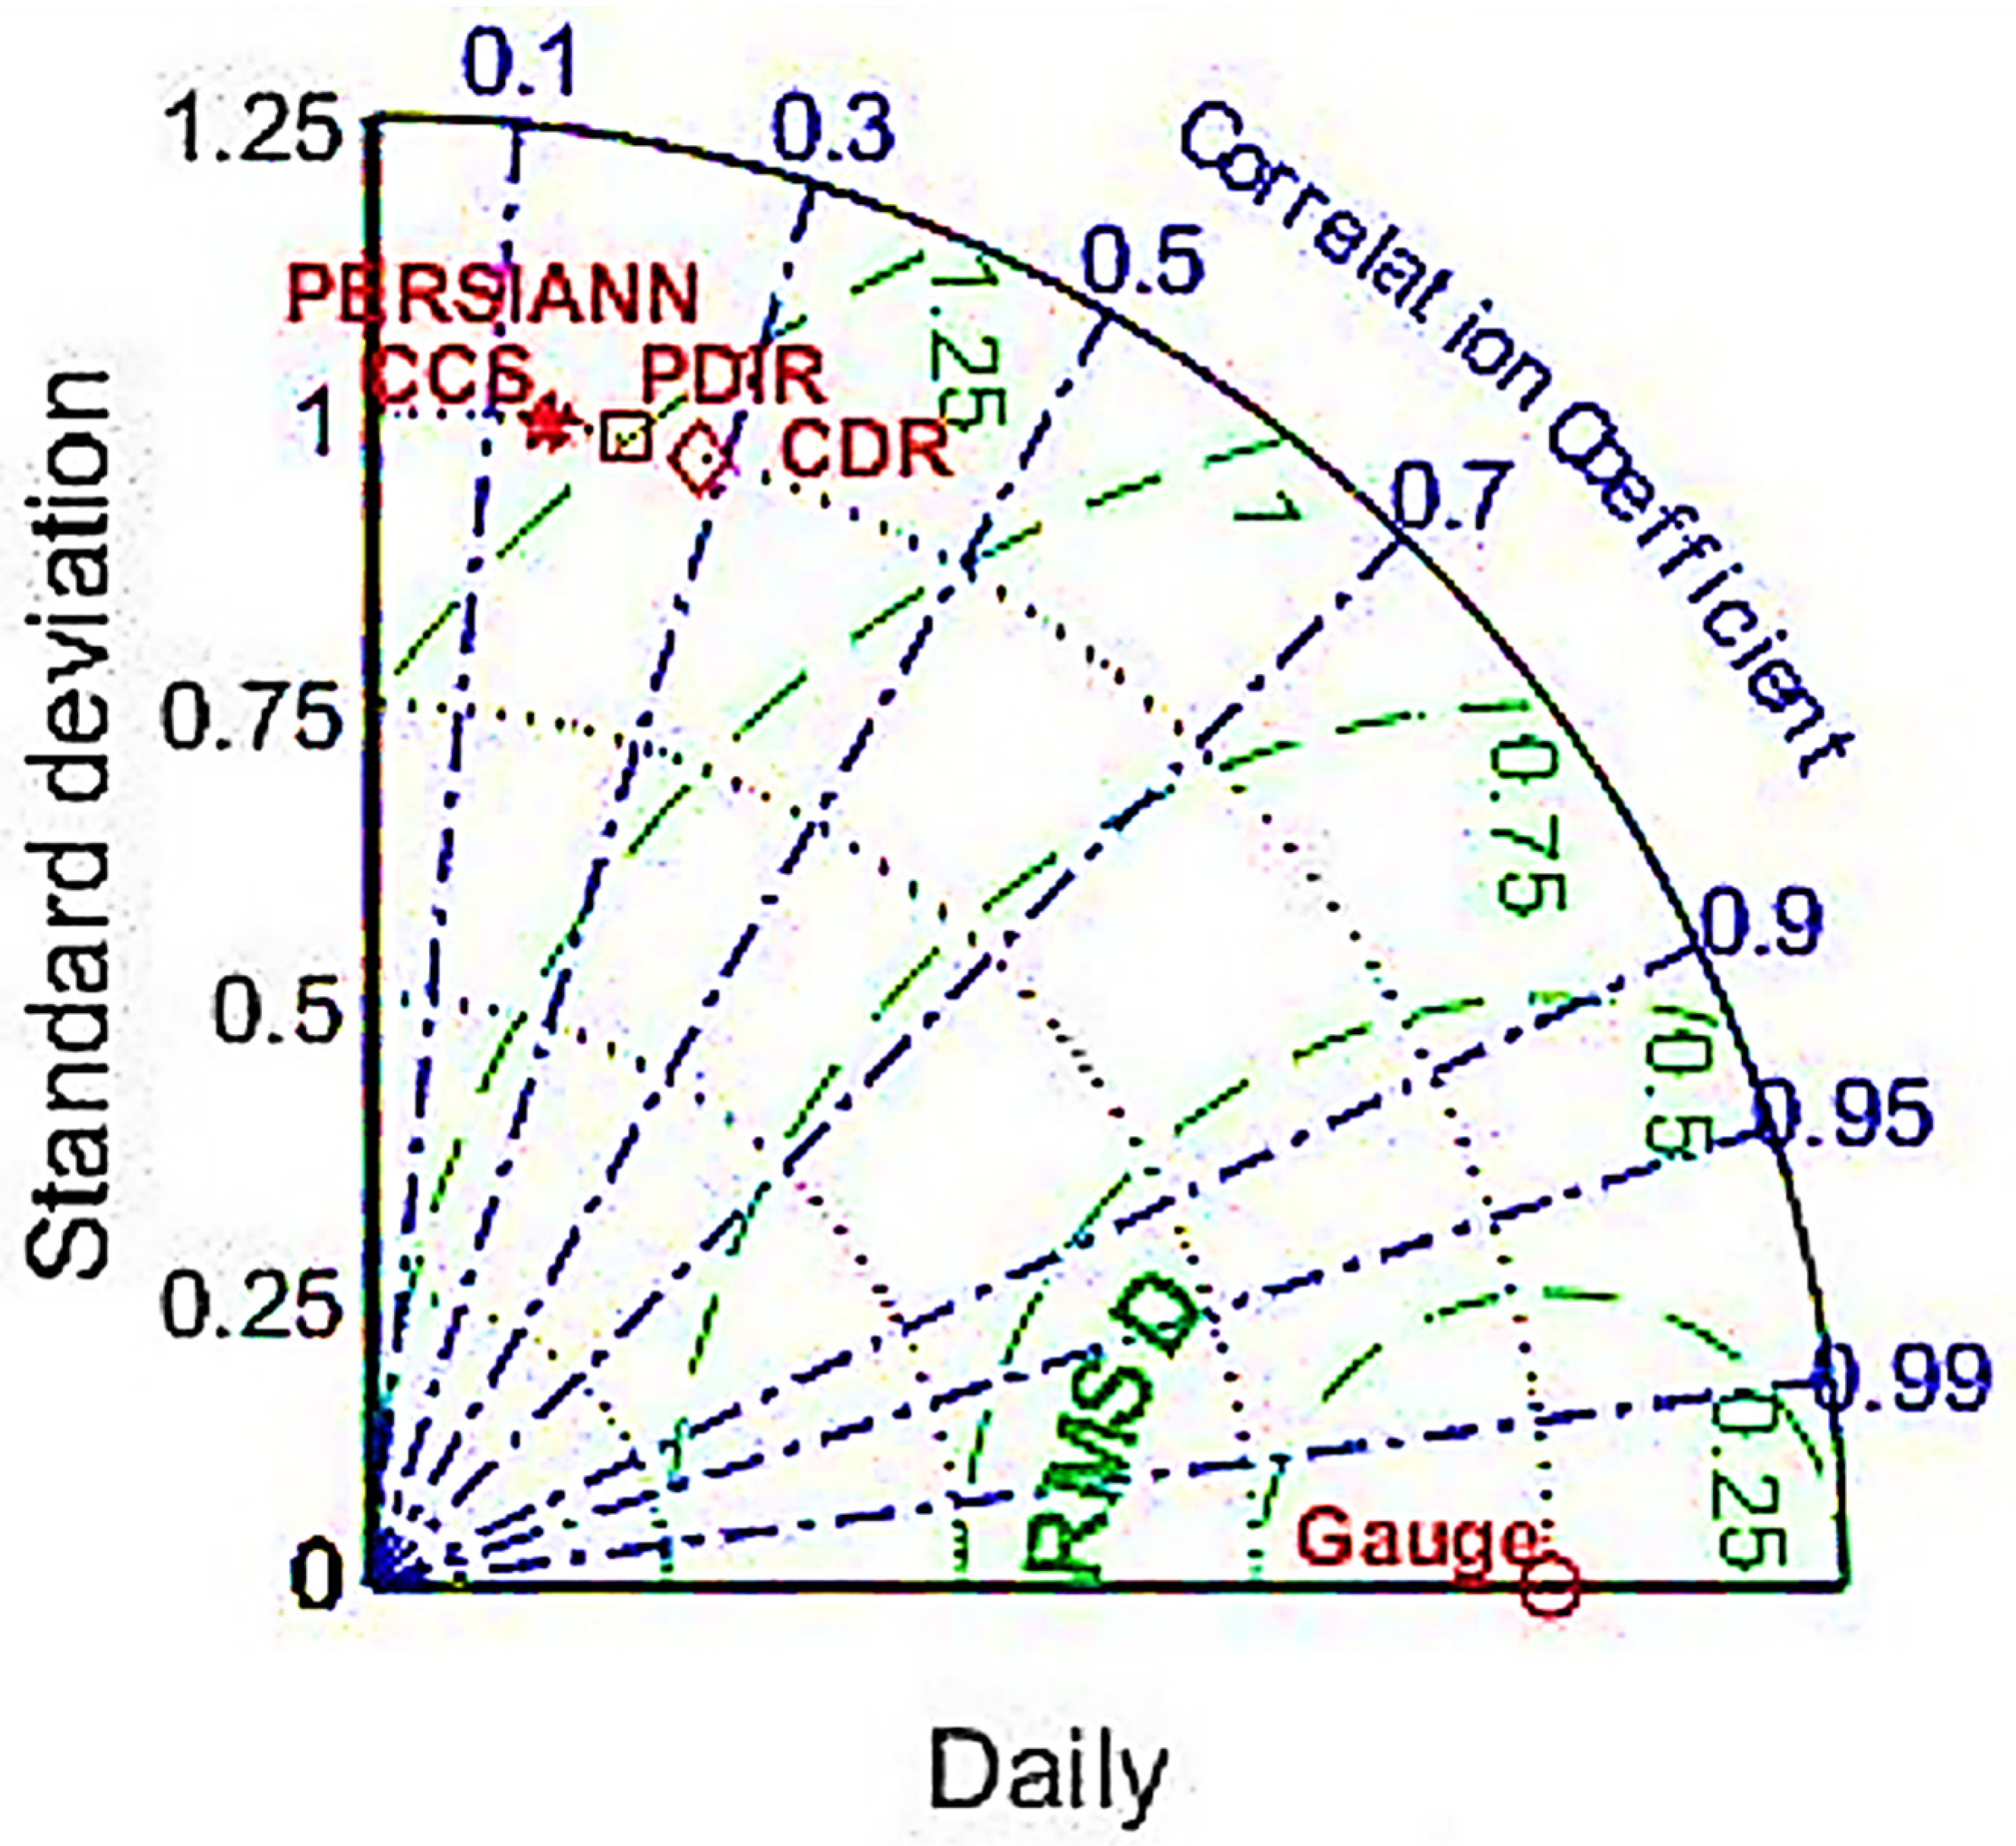
3.3. Performances of PERSIANN Family Products on Daily Estimations
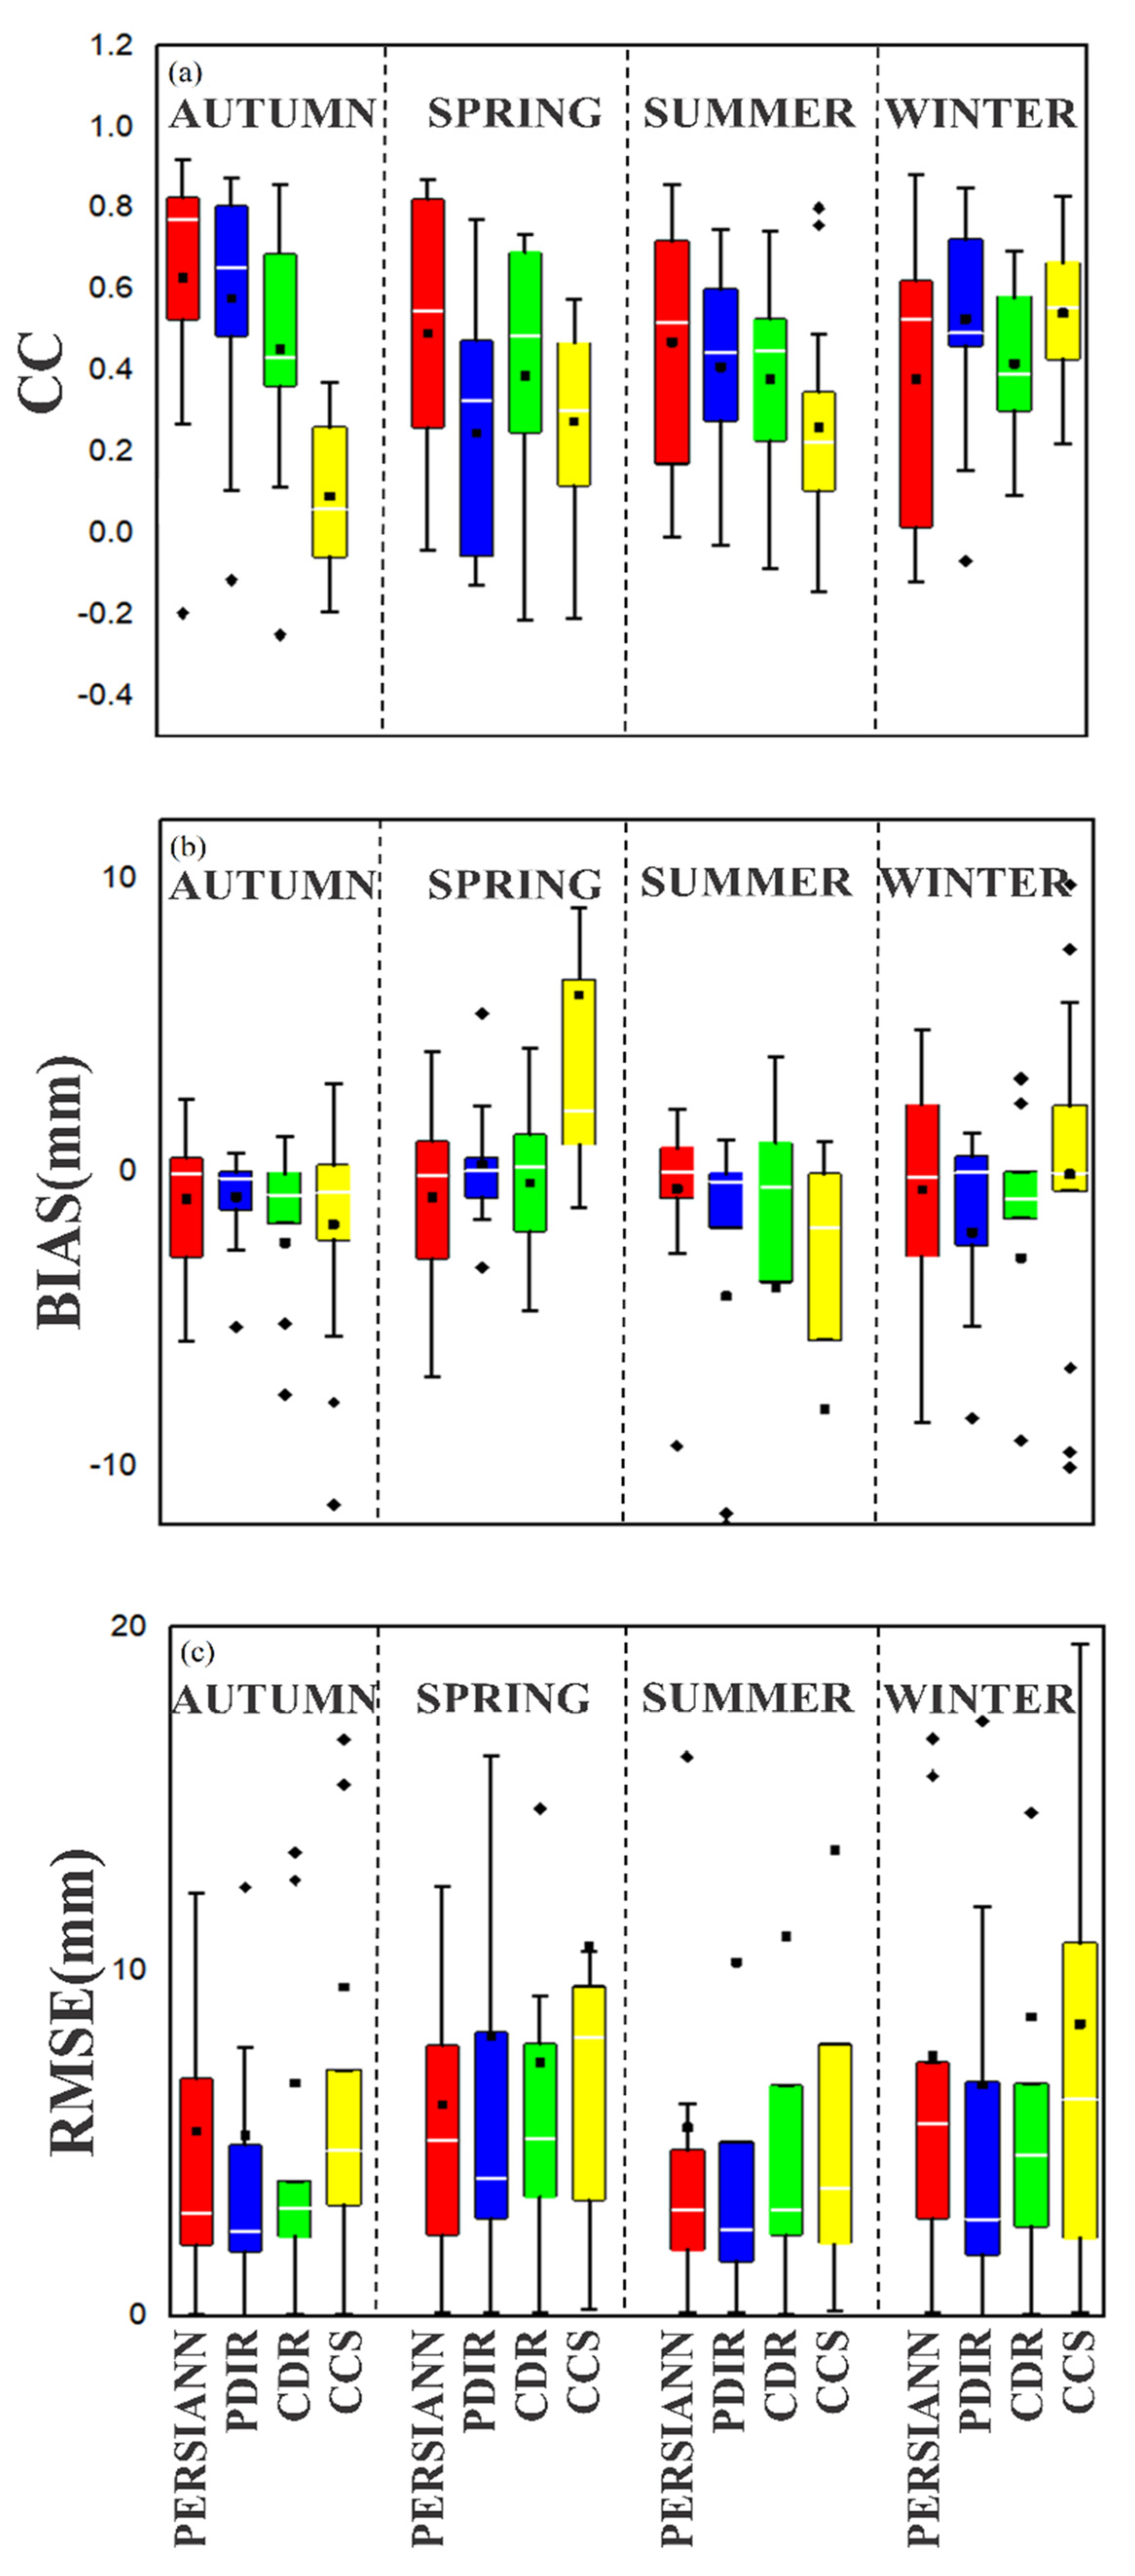
3.4. Evaluation of SPPs at a Seasonal Scale
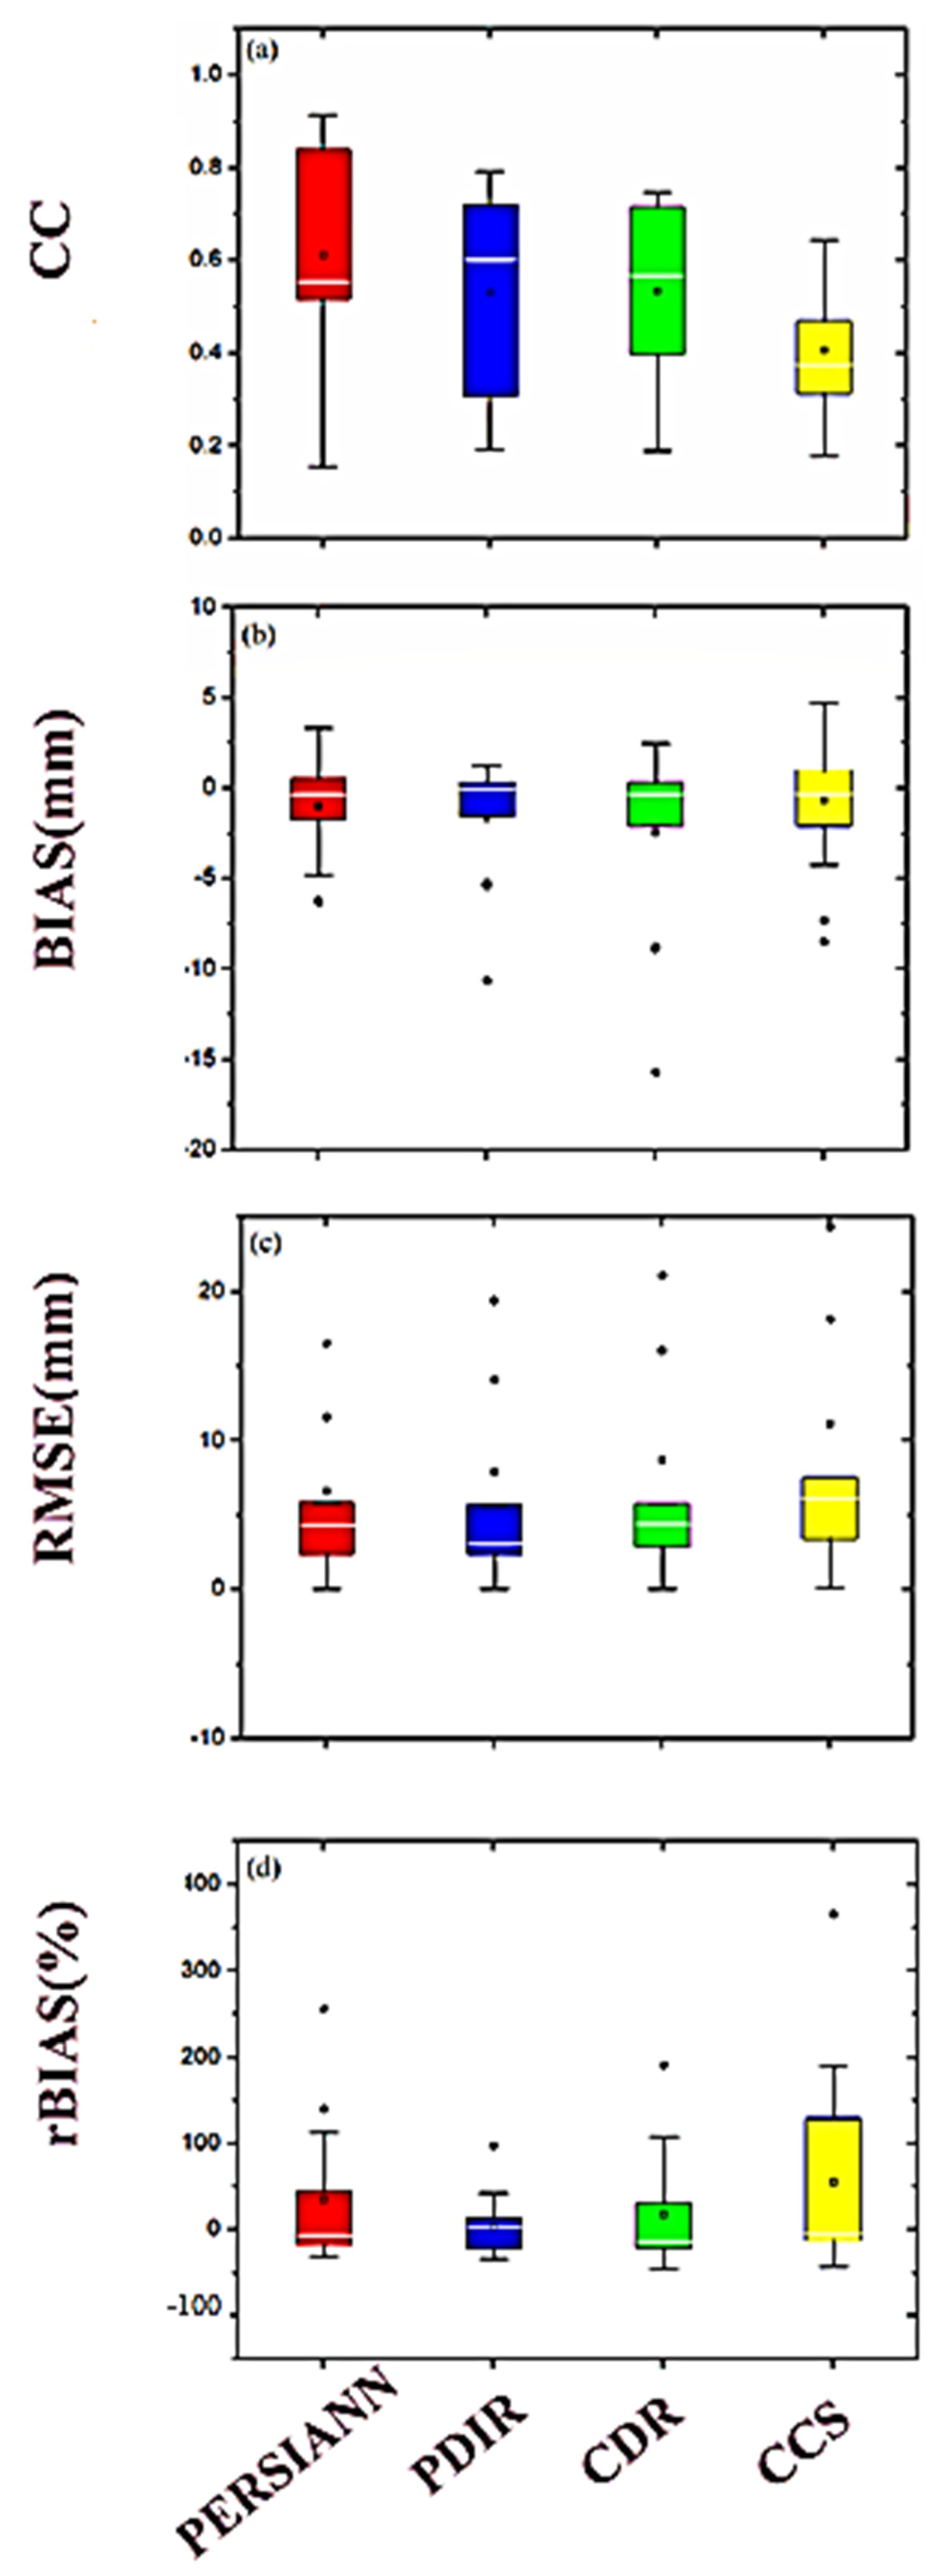
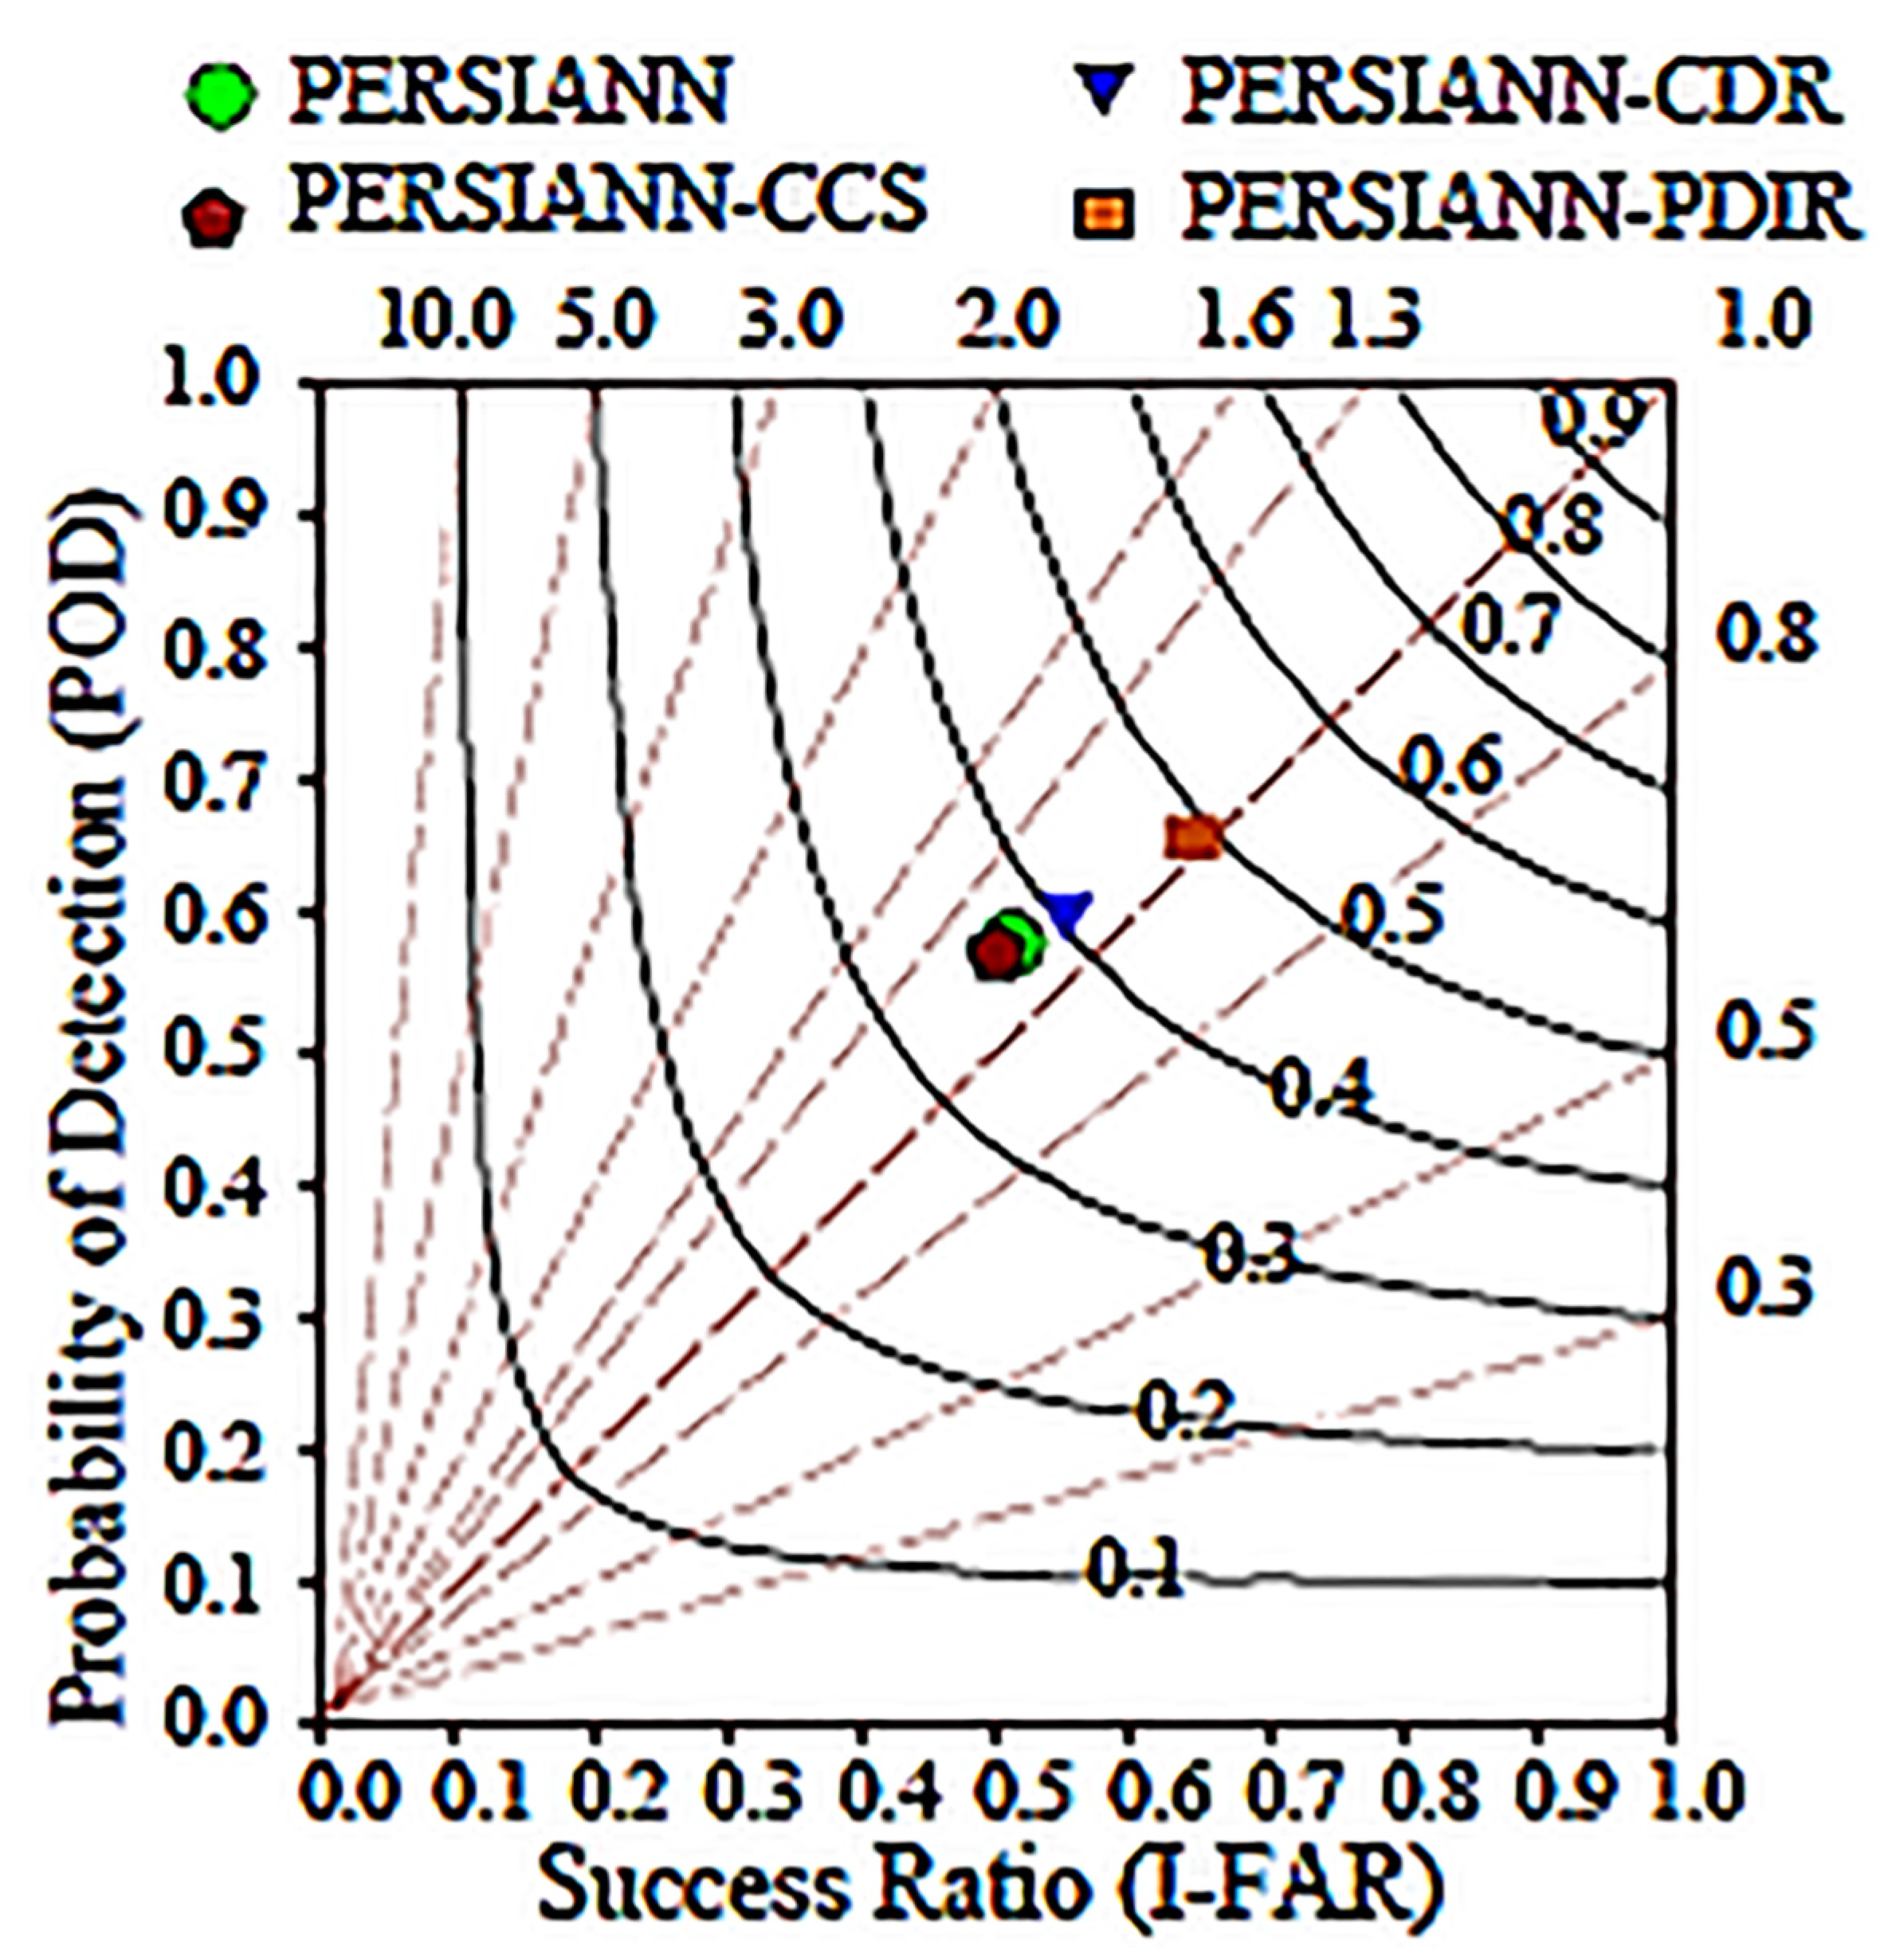
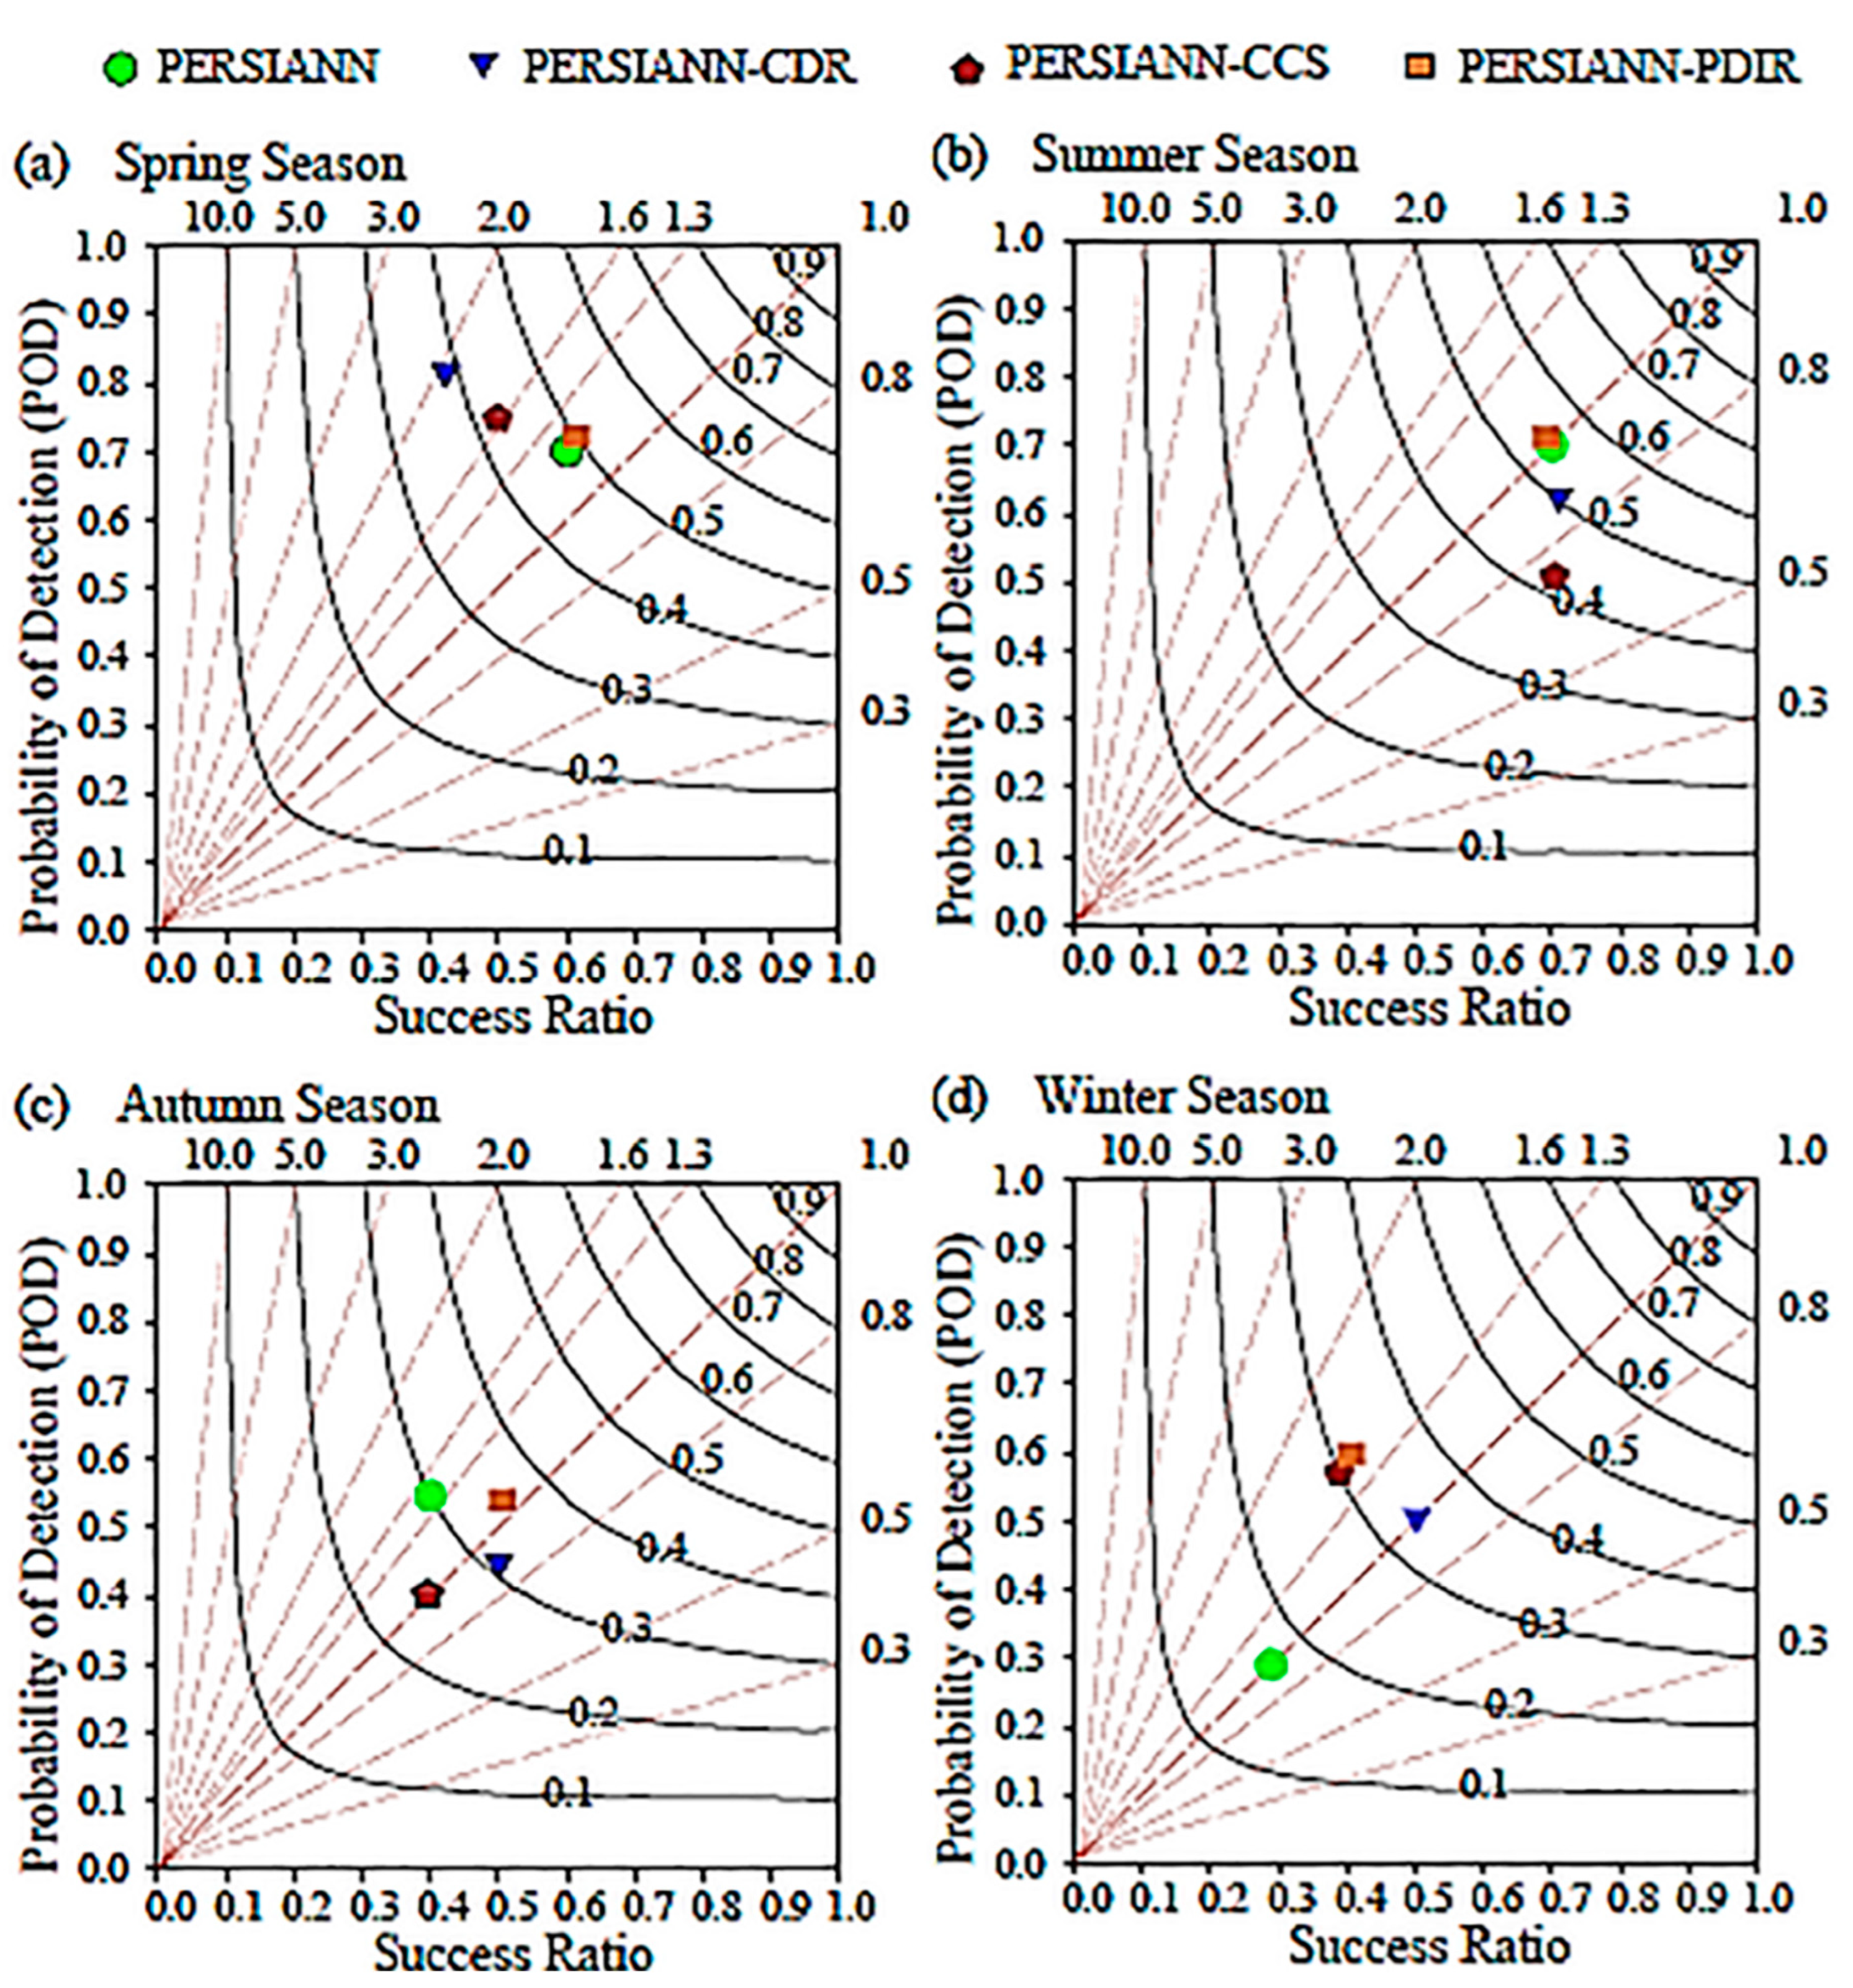
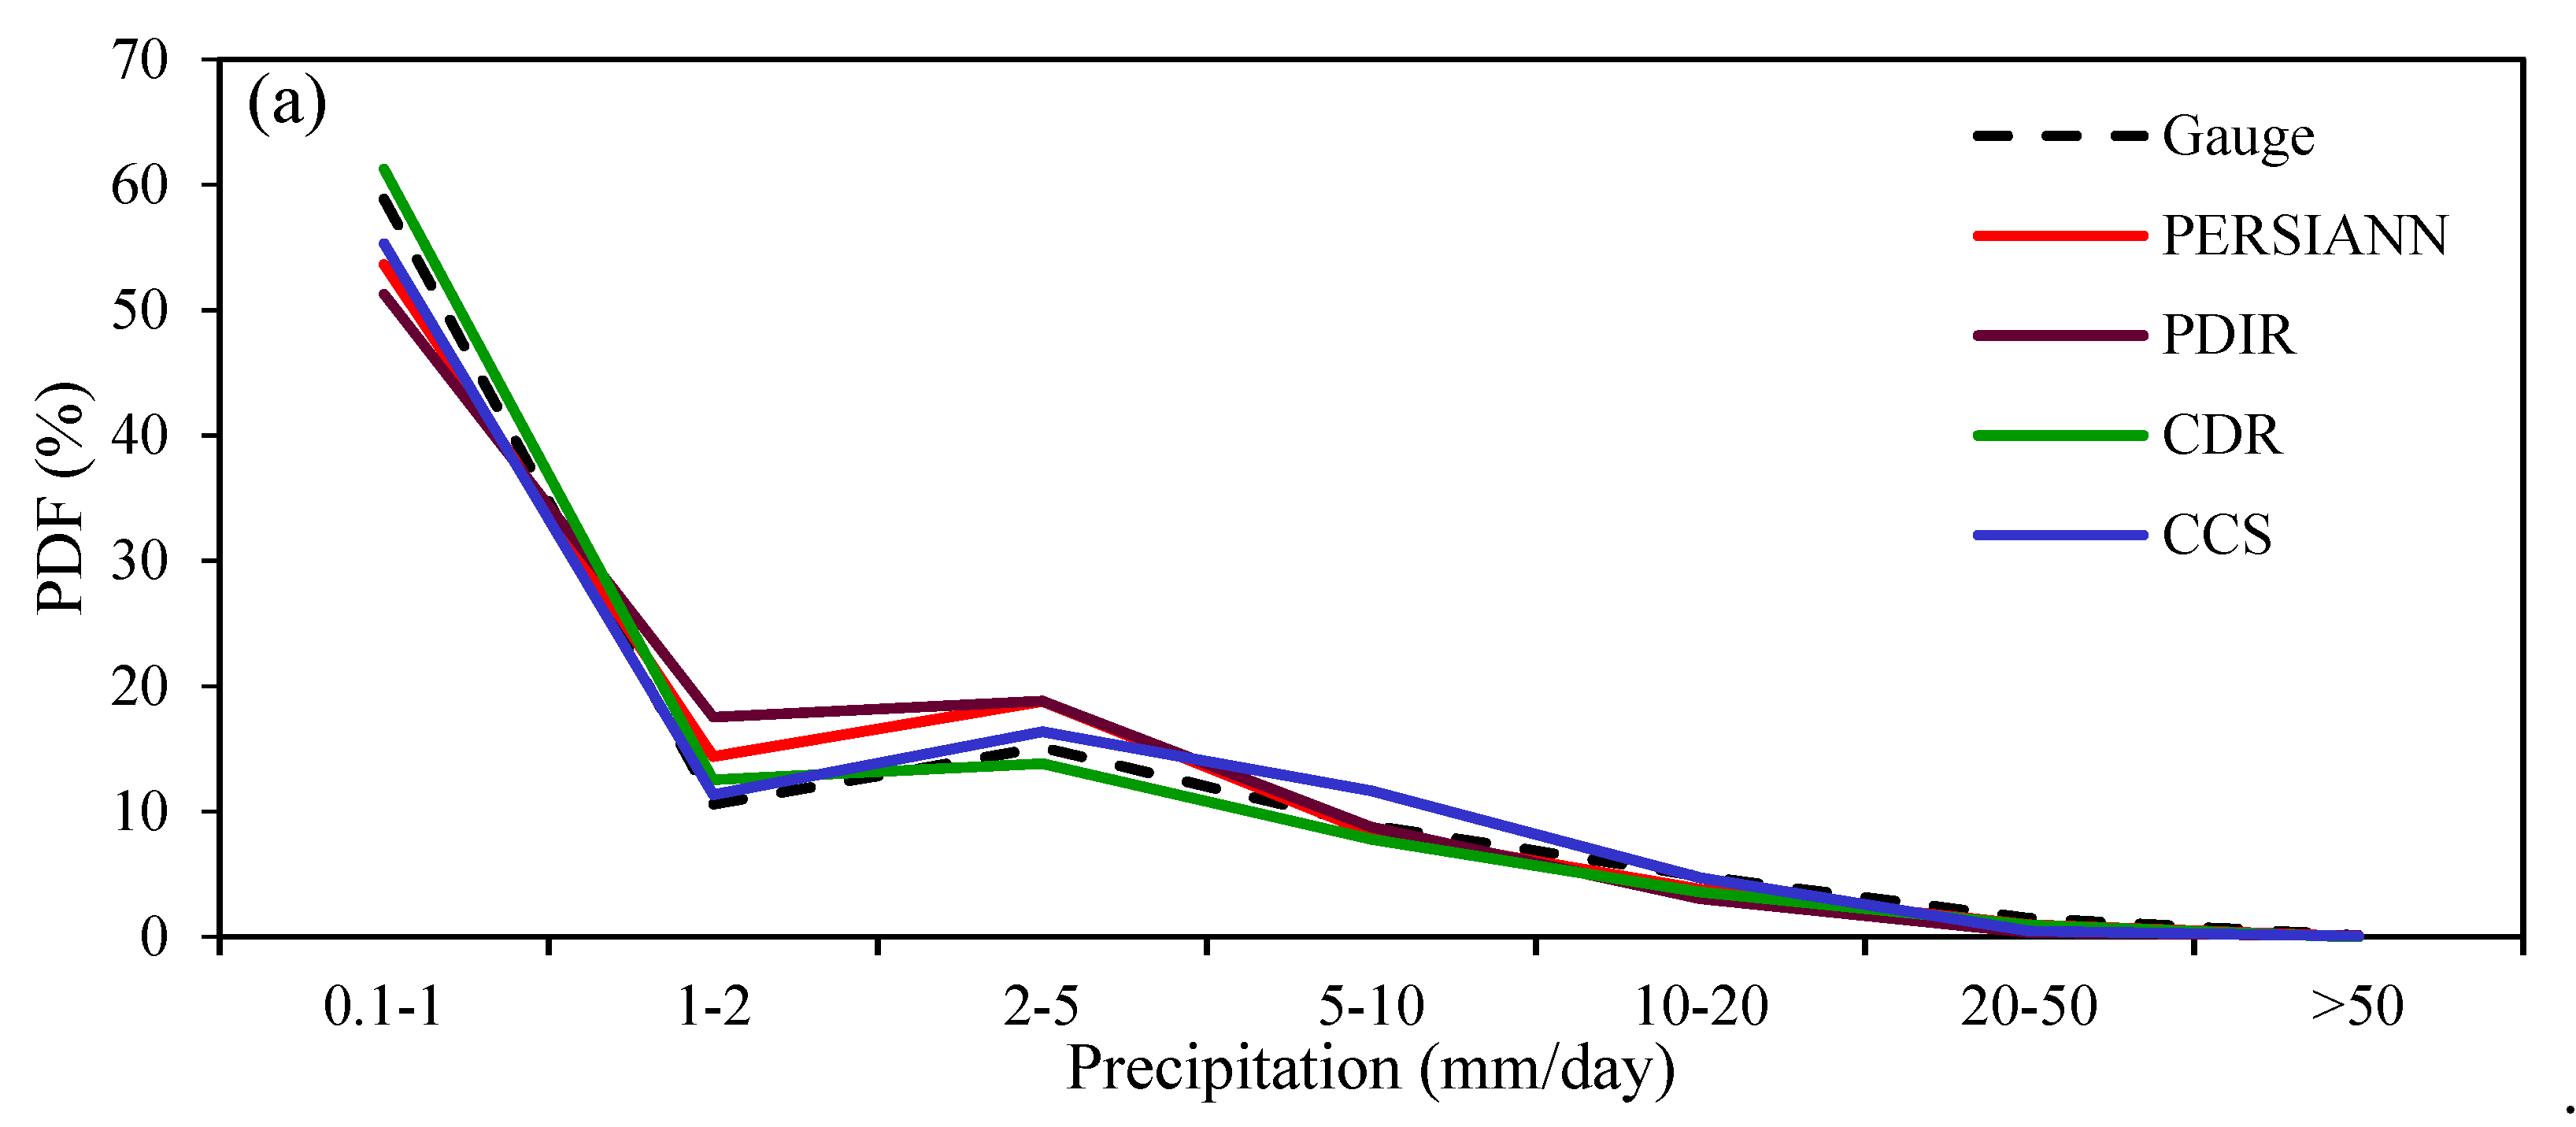
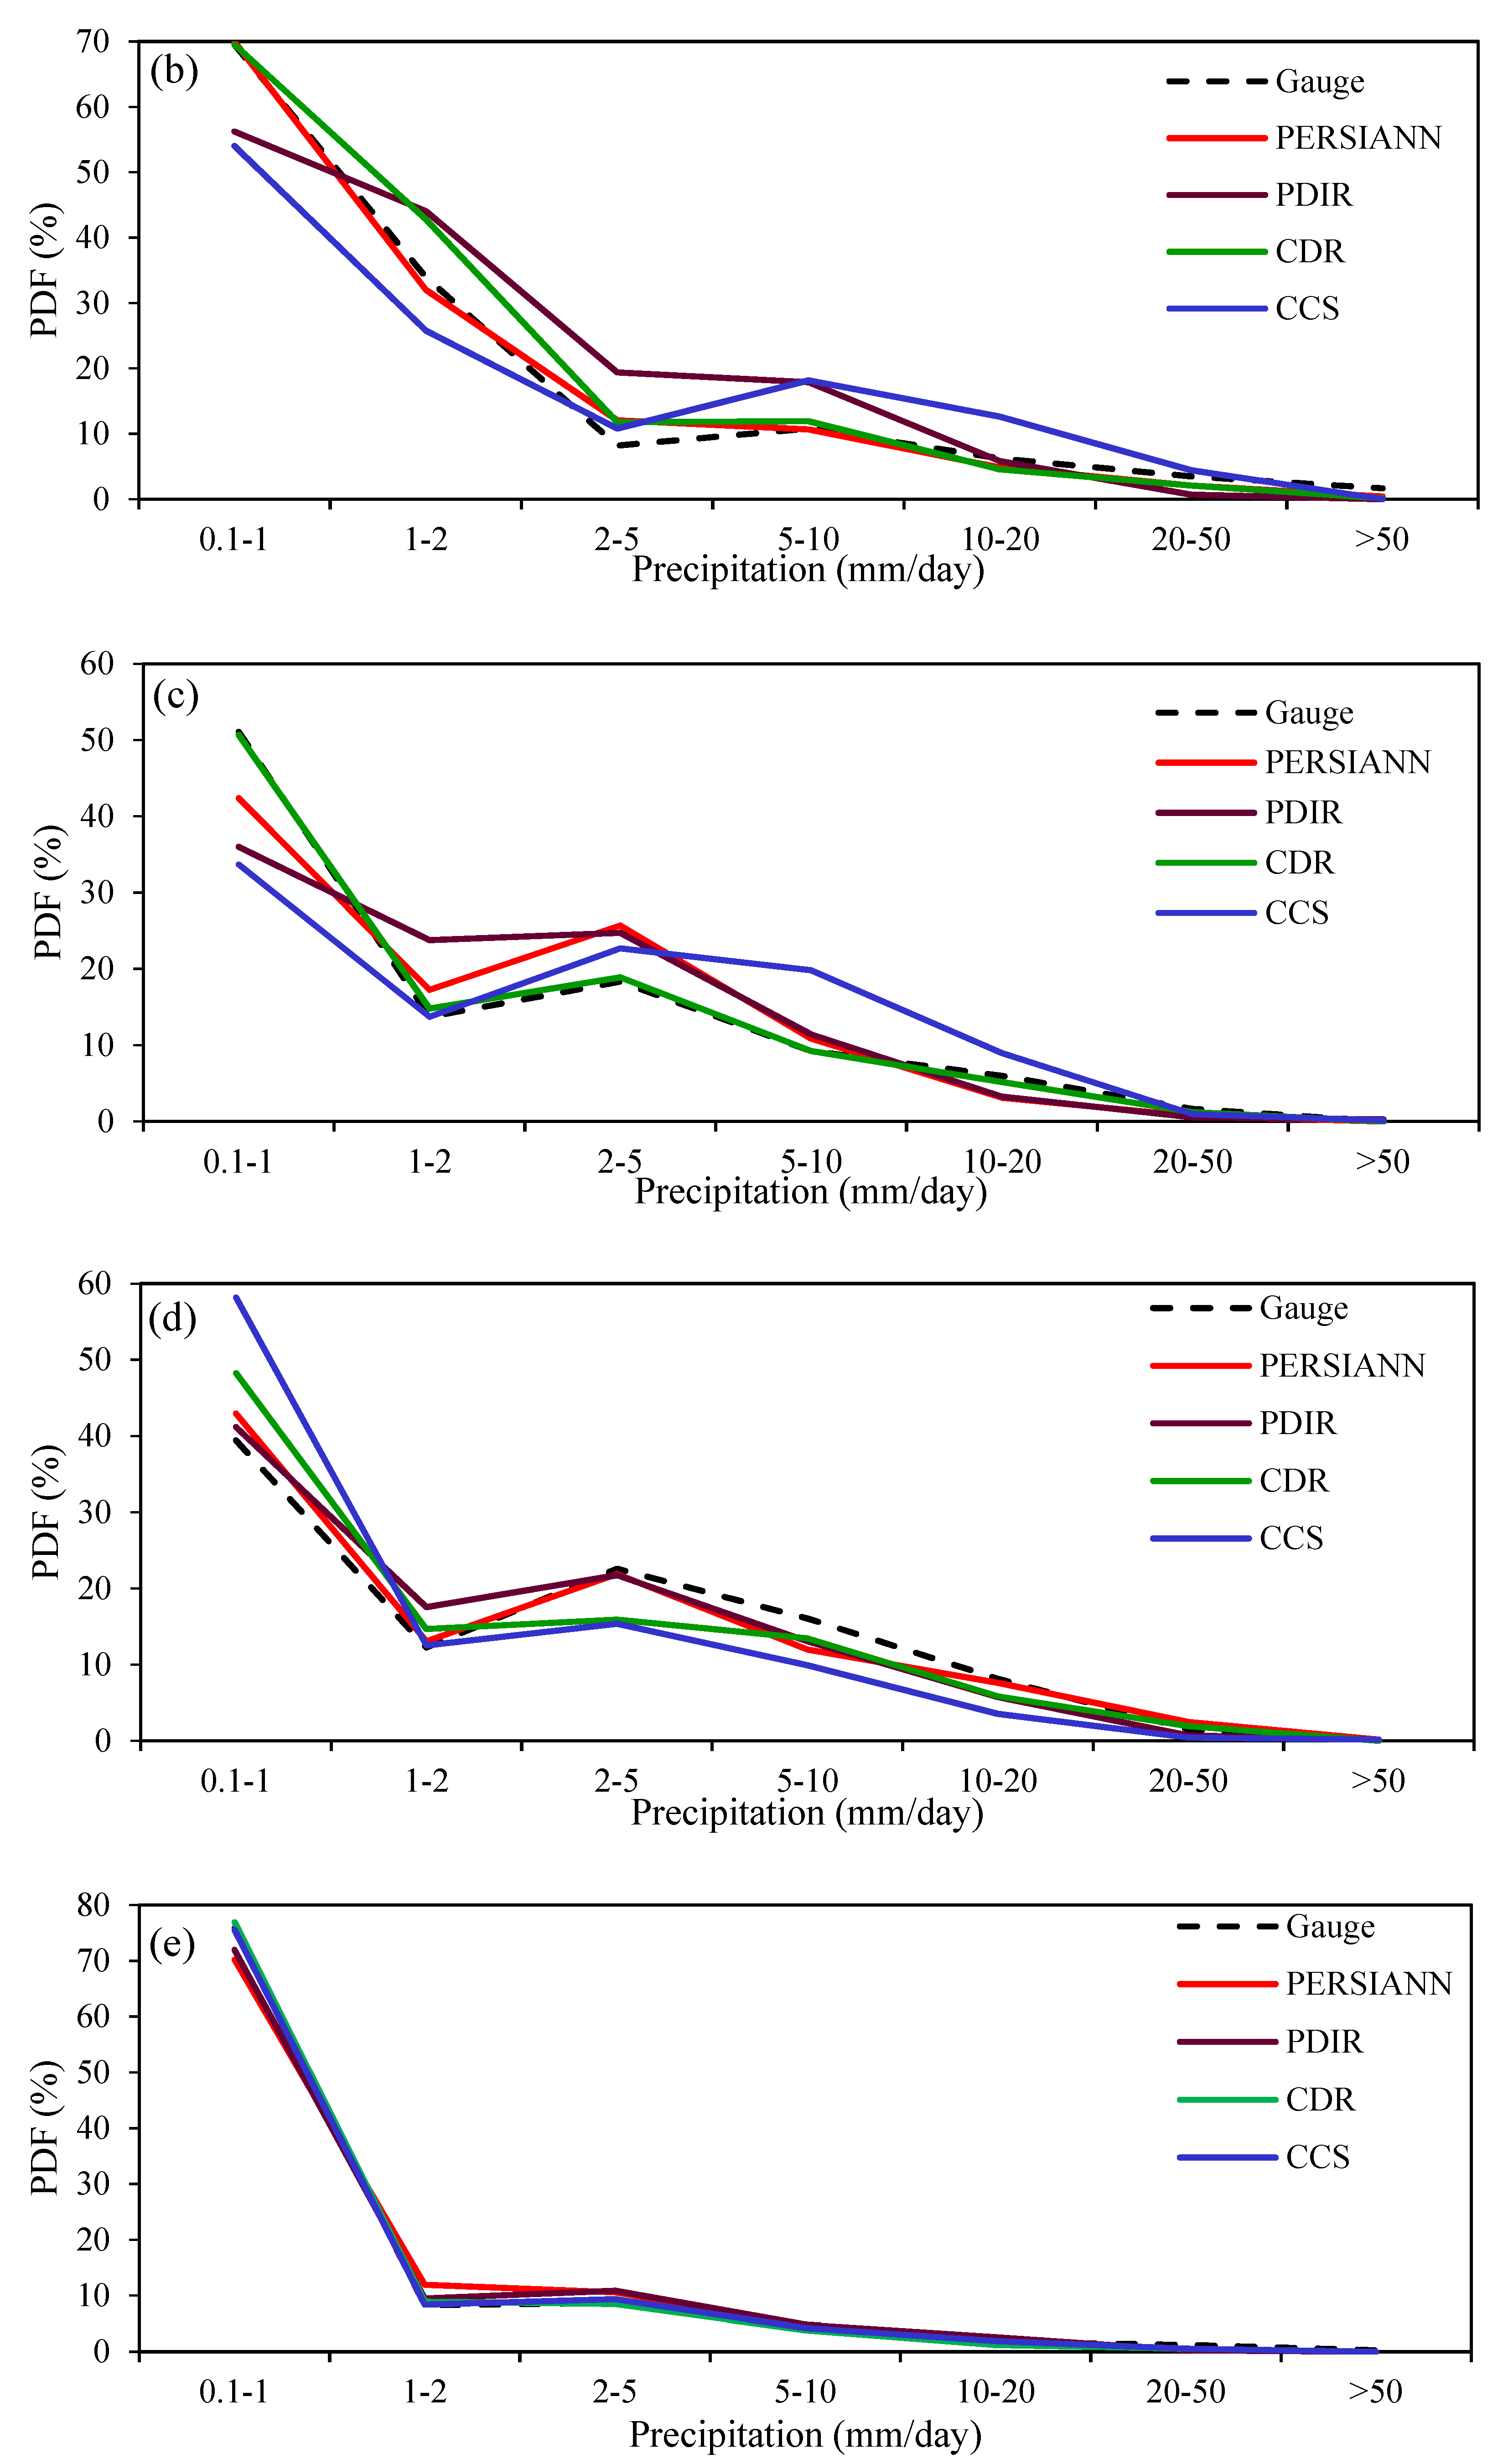
3.5. Ability of PERSIANN Family Products to Capture the Amount of Precipitation Events
4. Discussion
5. Conclusions
- The PERSIANN and PDIR products reliably tracked precipitation in Pakistan’s Himalayan range. However, the spatial variability of precipitation over the study area was difficult to reproduce using PERSIANN-CCS and PERSAINN-CDR products.
- The PERSIANN result accurately reproduced the temporal variability of the observed precipitation over the study area. All other products, including PERSIANN-CDR, PERSIAN-CCS, and PDIR, were unable to capture the precipitation’s temporal variability.
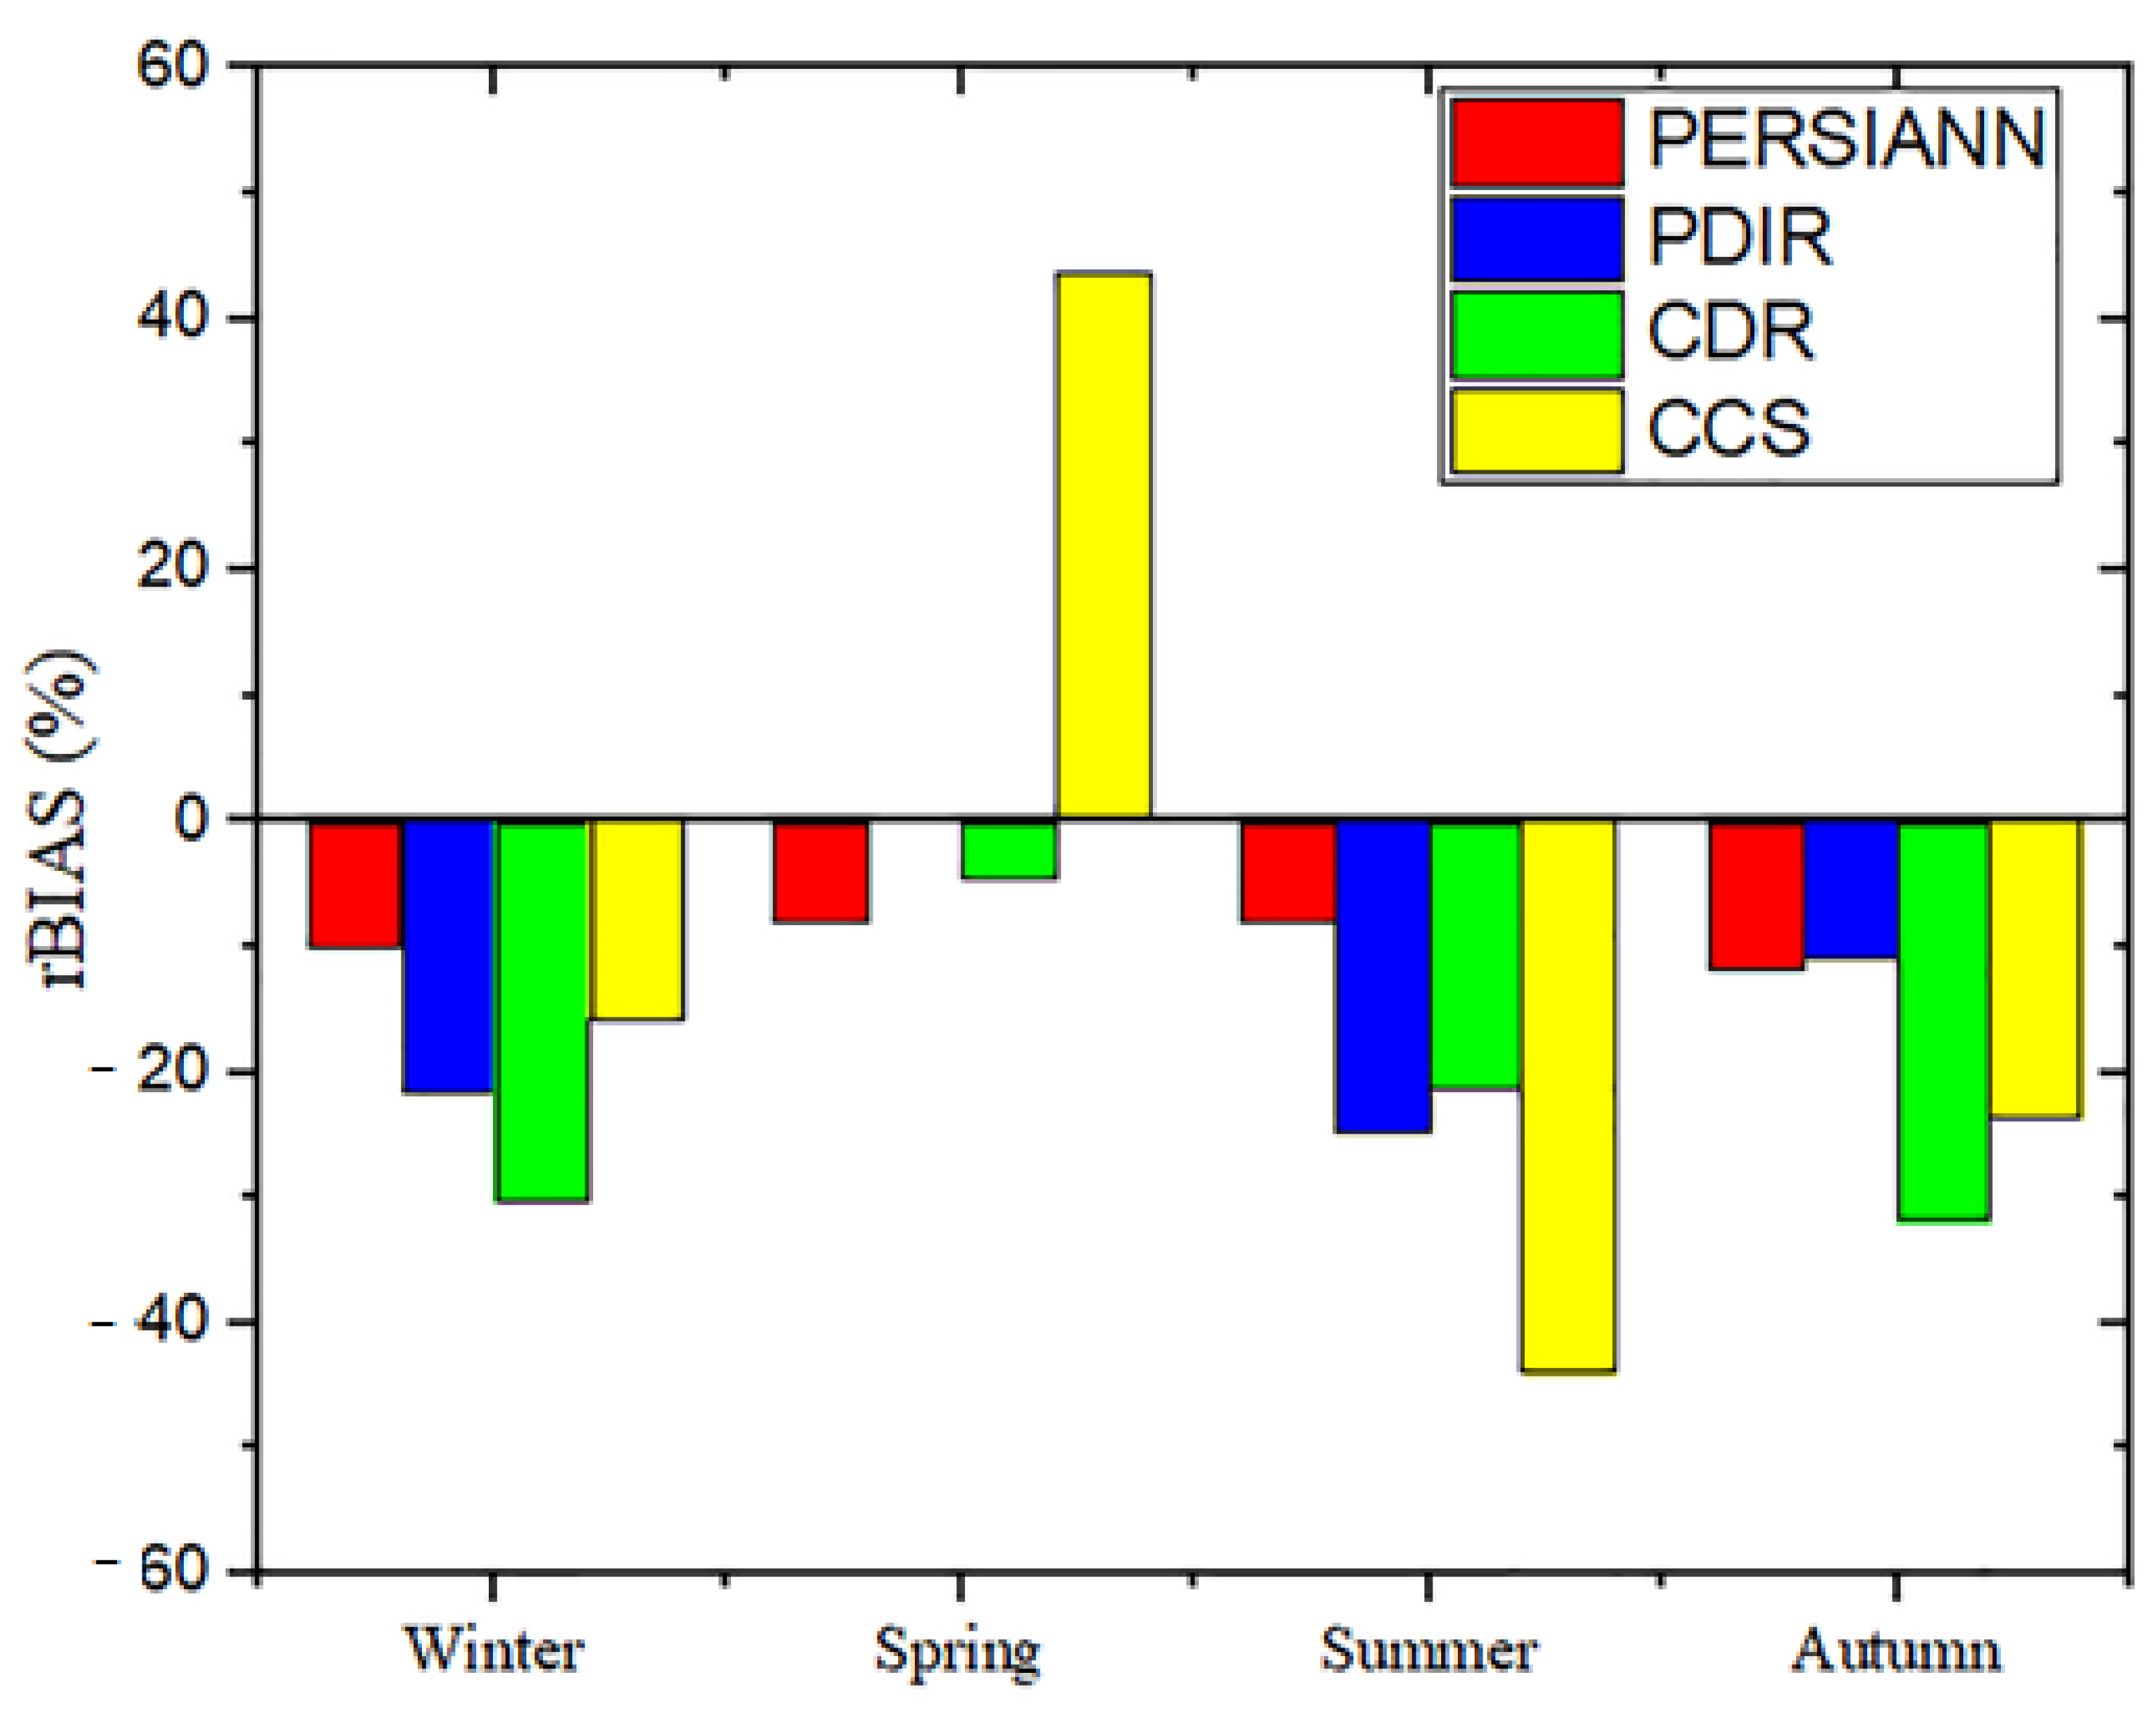
- PERSIANN-CDR and PERSIANN-PDIR exhibited significant underestimation (−20.10% and −13.00%, respectively) of precipitation amounts, whereas PERSIANN and PERSIANN-CCS showed slight underestimation (−8.05% and −5.37%, respectively) of precipitation amounts over the study domain.
- On a monthly scale, all SPPs in the PERSIANN family performed better than on the daily scale.
- Generally, the liner agreement between the reference data and satellite-based data decreased with an increase in altitude. This revealed that the capabilities of SPPs to accurately represent the precipitation amounts at higher altitudes were poor.
- The linear agreement between the reference data and the satellite-based data were higher at higher precipitation intensities.
- PERSIANN and PDIR products exhibited good agreement with the reference data in all seasons; however, the overall performances of PERSIANN-CDR and PERSIANN-CCS were poor in all seasons.
- In terms of probability of detection, the PDIR outperformed all other family products.
Author Contributions
Funding
Institutional Review Board Statement
Informed Consent Statement
Data Availability Statement
Acknowledgments
Conflicts of Interest
References
- Achite, M.; Wał, A.; Toubal, A.K.; Mansour, H. Spatiotemporal Characteristics and Trends of Meteorological Droughts in the Wadi Mina Basin, Northwest Algeria. Water 2021, 13, 3103. [Google Scholar] [CrossRef]
- Ali, A.F.; Xiao, C.; Anjum, M.N.; Adnan, M.; Nawaz, Z.; Ijaz, M.W.; Sajid, M.; Farid, H.U. Evaluation and comparison of TRMM multi-satellite precipitation products with reference to rain gauge observations in Hunza River basin, Karakoram Range, northern Pakistan. Sustainability 2017, 9, 1954. [Google Scholar] [CrossRef] [Green Version]
- Cheema, M.J.M.; Bastiaanssen, W.G.M. Local calibration of remotely sensed rainfall from the TRMM satellite for different periods and spatial scales in the Indus Basin. Int. J. Remote Sens. 2012, 33, 2603–2627. [Google Scholar] [CrossRef]
- Wild, A.; Chua, Z.W.; Kuleshov, Y. Evaluation of satellite precipitation estimates over the south west pacific region. Remote Sens. 2021, 13, 3929. [Google Scholar] [CrossRef]
- Porcù, F.; Milani, L.; Petracca, M. On the uncertainties in validating satellite instantaneous rainfall estimates with raingauge operational network. Atmos. Res. 2014, 144, 73–81. [Google Scholar] [CrossRef]
- Sharifi, E.; Steinacker, R.; Saghafian, B. Assessment of GPM-IMERG and other precipitation products against gauge data under different topographic and climatic conditions in Iran: Preliminary results. Remote Sens. 2016, 8, 135. [Google Scholar] [CrossRef] [Green Version]
- Huffman, G.J.; Adler, R.F.; Bolvin, D.T.; Gu, G.; Nelkin, E.J.; Bowman, K.P.; Hong, Y.; Stocker, E.F.; Wolff, D.B. The TRMM Multisatellite Precipitation Analysis (TMPA): Quasi-global, multiyear, combined-sensor precipitation estimates at fine scales. J. Hydrometeorol. 2007, 8, 38–55. [Google Scholar] [CrossRef]
- Anjum, M.N.; Ahmad, I.; Ding, Y.; Shangguan, D.; Zaman, M.; Ijaz, M.W.; Sarwar, K.; Han, H.; Yang, M. Assessment of IMERG-V06 precipitation product over different hydro-climatic regimes in the Tianshan Mountains, North-Western China. Remote Sens. 2019, 11, 2314. [Google Scholar] [CrossRef] [Green Version]
- Gebremichael, M.; Yue, H.; Nourani, V.; Damoah, R. The Skills of Medium-Range Precipitation Forecasts in the Senegal River Basin. Sustainability 2022, 14, 3349. [Google Scholar] [CrossRef]
- Bhati, D.S.; Dubey, S.K.; Sharma, D. Application of Satellite-Based and Observed Precipitation Datasets for Hydrological Simulation in the Upper Mahi River Basin of Rajasthan, India. Sustainability 2021, 13, 7560. [Google Scholar] [CrossRef]
- Nguyen, P.; Shearer, E.J.; Tran, H.; Ombadi, M.; Hayatbini, N.; Palacios, T.; Huynh, P.; Braithwaite, D.; Updegraff, G.; Hsu, K.; et al. The CHRS data portal, an easily accessible public repository for PERSIANN global satellite precipitation data. Sci. Data 2019, 6, 180296. [Google Scholar] [CrossRef] [PubMed] [Green Version]
- Duan, Z.; Liu, J.; Tuo, Y.; Chiogna, G.; Disse, M. Evaluation of eight high spatial resolution gridded precipitation products in Adige Basin (Italy) at multiple temporal and spatial scales. Sci. Total Environ. 2016, 573, 1536–1553. [Google Scholar] [CrossRef] [PubMed] [Green Version]
- Nadeem, M.U.; Rasool, G.; Nawaz, M.A.; Ghaffar, A.M.; Javaid, M.M.; Hamza, A.; Aurangzaib, M.; Waheed, Z.; Waseem, W.; Din, H.M.S.U.; et al. Runoff Estimations by Using Satellite-Based Rainfall Products (Srps) and Then Identifying Its Relation with Other Gauge Data Over Potohar Plateau, Pakistan. Int. J. Water Res. 2022, 4, 126. [Google Scholar] [CrossRef]
- Wang, Q.; Xia, J.; She, D.; Zhang, X.; Liu, J.; Zhang, Y. Assessment of four latest long-term satellite-based precipitation products in capturing the extreme precipitation and streamflow across a humid region of southern China. Atmos. Res. 2021, 257, 105554. [Google Scholar] [CrossRef]
- Zhang, L.; Xin, Z.; Zhou, H. Assessment of TMPA 3B42V7 and PERSIANN-CDR in driving hydrological modeling in a semi-humid watershed in northeastern China. Remote Sens. 2020, 12, 3133. [Google Scholar] [CrossRef]
- Zhao, C.; Ren, L.; Yuan, F.; Zhang, L.; Jiang, S.; Shi, J.; Chen, T.; Liu, S.; Yang, X.; Liu, Y.; et al. Statistical and hydrological evaluations of multiple satellite precipitation products in the yellow river source region of china. Water 2020, 12, 3082. [Google Scholar] [CrossRef]
- Mosaffa, H.; Shirvani, A.; Khalili, D.; Nguyen, P.; Sorooshian, S. Post and near real-time satellite precipitation products skill over Karkheh River Basin in Iran. Int. J. Remote Sens. 2020, 41, 6484–6502. [Google Scholar] [CrossRef]
- Talchabhadel, R.; Aryal, A.; Kawaike, K.; Yamanoi, K.; Nakagawa, H.; Bhatta, B.; Karki, S.; Thapa, B.R. Evaluation of precipitation elasticity using precipitation data from ground and satellite-based estimates and watershed modeling in Western Nepal. J. Hydrol. Reg. Stud. 2021, 33, 100768. [Google Scholar] [CrossRef]
- Anjum, M.N.; Irfan, M.; Waseem, M.; Leta, M.K.; Niazi, U.M.; Rahman, S.; Ghanim, A.; Mukhtar, M.A.; Nadeem, M.U. Assessment of PERSIANN-CCS, PERSIANN-CDR, SM2RAIN-ASCAT, and CHIRPS-2.0 Rainfall Products over a Semi-Arid Subtropical Climatic Region. Water 2022, 14, 147. [Google Scholar] [CrossRef]
- Sadeghi, M.; Nguyen, P.; Naeini, M.R.; Hsu, K.; Braithwaite, D.; Sorooshian, S. PERSIANN-CCS-CDR, a 3-hourly 0.04° global precipitation climate data record for heavy precipitation studies. Sci. Data 2021, 8, 157. [Google Scholar] [CrossRef]
- Of, J.; Meteorology, A.; Resources, W.; Engineering, E.; Engineering, E.; Resources, W.; Engineering, E.; Engineering, E. Precipitation Estimation from Remotely Sensed Imagery Using an Artificial Neural Network Cloud Classification System. J. Appl. Meteorol. 2004, 43, 1834–1852. [Google Scholar]
- Dinh, K.D.; Anh, T.N.; Nguyen, N.Y.; Bui, D.D.; Srinivasan, R. Evaluation of grid-based rainfall products and water balances over the Mekong river Basin. Remote Sens. 2020, 12, 1858. [Google Scholar] [CrossRef]
- Huang, W.; Liu, P.; Chang, Y.; Liu, C. Evaluation and Application of Satellite Precipitation Products in Studying the Summer Precipitation Variations over Taiwan. Remote Sens. 2020, 6, 347. [Google Scholar] [CrossRef] [Green Version]
- Pellarin, T.; Román-Cascón, C.; Baron, C.; Bindlish, R.; Brocca, L.; Camberlin, P.; Fernández-Prieto, D.; Kerr, Y.H.; Massari, C.; Panthou, G.; et al. The precipitation inferred from soil moisture (PrISM) near real-time rainfall product: Evaluation and comparison. Remote Sens. 2020, 12, 481. [Google Scholar] [CrossRef] [Green Version]
- Zubieta, R.; Getirana, A.; Espinoza, J.C.; Lavado-Casimiro, W.; Aragon, L. Hydrological modeling of the Peruvian-Ecuadorian Amazon basin using GPM-IMERG satellite-based precipitation dataset. Hydrol. Earth Syst. Sci. 2016, 21, 3543–3555. [Google Scholar] [CrossRef] [Green Version]
- Nashwan, M.S.; Shahid, S.; Wang, X. Assessment of satellite-based precipitation measurement products over the hot desert climate of Egypt. Remote Sens. 2019, 11, 555. [Google Scholar] [CrossRef] [Green Version]
- Zhang, L.; Li, X.; Cao, Y.; Nan, Z.; Wang, W.; Ge, Y.; Wang, P.; Yu, W. Evaluation and integration of the top-down and bottom-up satellite precipitation products over mainland China. J. Hydrol. 2020, 581, 124456. [Google Scholar] [CrossRef]
- Anjum, M.N.; Ding, Y.; Shangguan, D.; Ijaz, M.W.; Zhang, S. Evaluation of High-Resolution Satellite-Based Real-Time and Post-Real-Time Precipitation Estimates during 2010 Extreme Flood Event in Swat River Basin, Hindukush Region. Adv. Meteorol. 2016, 2016, 2604980. [Google Scholar] [CrossRef]
- Mourre, L.; Condom, T.; Junquas, C.; Lebel, T.; E Sicart, J.; Figueroa, R.; Cochachin, A. Spatio-temporal assessment of WRF, TRMM and in situ precipitation data in a tropical mountain environment (Cordillera Blanca, Peru). Hydrol. Earth Syst. Sci. 2016, 20, 125–141. [Google Scholar] [CrossRef] [Green Version]
- Guilloteau, C.; Roca, R.; Gosset, M. A multiscale evaluation of the detection capabilities of high-resolution satellite precipitation products in West Africa. J. Hydrometeorol. 2016, 17, 2041–2059. [Google Scholar] [CrossRef]
- Paredes-Trejo, F.; Barbosa, H.; dos Santos, C.A.C. Evaluation of the performance of SM2RAIN-derived rainfall products over Brazil. Remote Sens. 2019, 11, 1113. [Google Scholar] [CrossRef] [Green Version]
- Andries, A.; Morse, S.; Murphy, R.J.; Lynch, J.; Woolliams, E.R. Assessing Education from Space: Using Satellite Earth Observation to Quantify Overcrowding in Primary Schools in Rural Areas of Nigeria. Sustainability 2022, 14, 1408. [Google Scholar] [CrossRef]
- Ling, F.; Zhang, Q.W.; Wang, C. Comparison of SRTM data with other DEM sources in hydrological researches. In Proceedings of the 31st International Symposium on Remote Sensing of Environment, ISRSE 2005: Global Monitoring for Sustainability and Security, St. Petersburg, Russia, 20–24 June 2005. [Google Scholar]
- Pandey, V.; Srivastava, P.K.; Singh, S.K.; Petropoulos, G.P.; Mall, R.K. Drought identification and trend analysis using long-term chirps satellite precipitation product in bundelkhand, india. Sustainability 2021, 13, 1042. [Google Scholar] [CrossRef]
- Al Abdouli, K.; Hussein, K.; Ghebreyesus, D.; Sharif, H.O. Coastal runoff in the United Arab Emirates-the hazard and opportunity. Sustainability 2019, 11, 5406. [Google Scholar] [CrossRef] [Green Version]
- Rozante, J.R.; Vila, D.A.; Chiquetto, J.B.; Fernandes, A.d.A.; Alvim, D.S. Evaluation of TRMM/GPM blended daily products over Brazil. Remote Sens. 2018, 10, 882. [Google Scholar] [CrossRef] [Green Version]
- Ahmed, E.; Al Janabi, F.; Zhang, J.; Yang, W.; Saddique, N.; Krebs, P. Hydrologic assessment of TRMM and GPM-based precipitation products in transboundary river catchment (Chenab River, Pakistan). Water 2020, 12, 1902. [Google Scholar] [CrossRef]
- Ullah, W.; Wang, G.; Ali, G.; Hagan, D.F.T.; Bhatti, A.S.; Lou, D. Comparing multiple precipitation products against in-situ observations over different climate regions of pakistan. Remote Sens. 2019, 11, 697. [Google Scholar] [CrossRef] [Green Version]
- Hussain, S.; Song, X.; Ren, G.; Hussain, I.; Han, D.; Zaman, M.H. Evaluation of gridded precipitation data in the Hindu Kush–Karakoram–Himalaya mountainous area. Hydrol. Sci. J. 2017, 62, 2393–2405. [Google Scholar] [CrossRef]
- Anjum, M.N.; Ding, Y.; Shangguan, D.; Liu, J.; Ahmad, I.; Ijaz, M.W.; Khan, M.I. Quantification of spatial temporal variability of snow cover and hydro-climatic variables based on multi-source remote sensing data in the Swat watershed, Hindukush Mountains, Pakistan. Meteorol. Atmos. Phys. 2019, 131, 467–486. [Google Scholar] [CrossRef]
- Tahir, A.A.; Chevallier, P.; Arnaud, Y.; Ahmad, B. Snow cover dynamics and hydrological regime of the Hunza River basin, Karakoram Range, Northern Pakistan. Hydrol. Earth Syst. Sci. 2011, 15, 2275–2290. [Google Scholar] [CrossRef] [Green Version]
- Rahman, K.U.; Shang, S.; Shahid, M.; Wen, Y. An appraisal of dynamic bayesian model averaging-based merged multi-satellite precipitation datasets over complex topography and the diverse climate of Pakistan. Remote Sens. 2020, 12, 10. [Google Scholar] [CrossRef] [Green Version]
- Chen, C.; Chen, Q.; Duan, Z.; Zhang, J.; Mo, K.; Li, Z.; Tang, G. Multiscale comparative evaluation of the GPM IMERG v5 and TRMM 3B42 v7 precipitation products from 2015 to 2017 over a climate transition area of China. Remote Sens. 2018, 10, 944. [Google Scholar] [CrossRef] [Green Version]
- Yang, M.; Li, Z.; Anjum, M.N.; Gao, Y. Performance evaluation of version 5 (V05) of Integrated Multi-satellite Retrievals for Global Precipitation Measurement (IMERG) over the Tianshan Mountains of China. Water 2019, 11, 1139. [Google Scholar] [CrossRef] [Green Version]
- Amorim, J. da S.; Viola, M.R.; Junqueira, R.; de Oliveira, V.A.; de Mello, C.R. Evaluation of satellite precipitation products for hydrological modeling in the brazilian cerrado biome. Water 2020, 12, 2571. [Google Scholar] [CrossRef]
- Lu, X.; Tang, G.; Liu, X.; Wang, X.; Liu, Y.; Wei, M. The potential and uncertainty of triple collocation in assessing satellite precipitation products in Central Asia. Atmos. Res. 2021, 252, 105452. [Google Scholar] [CrossRef]
- Azizi, A.H.; Akhtar, F. Analysis of Spatiotemporal Variation in the Snow Cover in Western Hindukush-Himalaya Region. Geocarto Int. 2021, 1–23. [Google Scholar] [CrossRef]
- Wei, J.; Li, Z.; Sun, L.; Peng, Y.; Liu, L.; He, L.; Qin, W.; Cribb, M. MODIS Collection 6.1 3 km resolution aerosol optical depth product: Global evaluation and uncertainty analysis. Atmos. Environ. 2020, 240, 117768. [Google Scholar] [CrossRef]
- Shen, Y.; Xiong, A.; Hong, Y.; Yu, J.; Pan, Y.; Chen, Z.; Saharia, M. Uncertainty analysis of five satellite-based precipitation products and evaluation of three optimally merged multi-algorithm products over the Tibetan Plateau. Int. J. Remote Sens. 2014, 35, 6843–6858. [Google Scholar] [CrossRef]
- Anjum, M.N.; Ding, Y.; Shangguan, D.; Tahir, A.A.; Iqbal, M.; Adnan, M. Comparison of two successive versions 6 and 7 of TMPA satellite precipitation products with rain gauge data over Swat Watershed, Hindukush Mountains, Pakistan. Atmos. Sci. Lett. 2016, 17, 270–279. [Google Scholar] [CrossRef] [Green Version]
- Tan, M.L.; Santo, H. Comparison of GPM IMERG, TMPA 3B42 and PERSIANN-CDR satellite precipitation products over Malaysia. Atmos. Res. 2018, 202, 63–76. [Google Scholar] [CrossRef]
- Hamza, A.; Anjum, M.N.; Cheema, M.J.M.; Chen, X.; Afzal, A.; Azam, M.; Shafi, M.K.; Gulakhmadov, A. Assessment of IMERG-V06, TRMM-3B42V7, SM2RAIN-ASCAT, and PERSIANN-CDR precipitation products over the hindu kush mountains of Pakistan, South Asia. Remote Sens. 2020, 12, 3871. [Google Scholar] [CrossRef]
- Liu, Y.; Huang, Y.; Liu, Y.; Li, K.; Li, M. The Impact of Rainfall Movement Direction on Urban Runoff Cannot Be Ignored in Urban Hydrologic Management. Water 2021, 13, 2923. [Google Scholar] [CrossRef]
- Shen, Z.; Yong, B.; Yi, L.; Wu, H.; Xu, H. From TRMM to GPM, how do improvements of post/near-real-time satellite precipitation estimates manifest? Atmos. Res. 2022, 268, 106029. [Google Scholar] [CrossRef]
- Mazzoglio, P.; Laio, F.; Balbo, S.; Boccardo, P.; Disabato, F. Improving an Extreme Rainfall Detection System with GPM IMERG data. Remote Sens. 2019, 11, 677. [Google Scholar] [CrossRef] [Green Version]


| Sr. No. | Station | Latitude (°) | Longitude (°) | Elevation (m) |
|---|---|---|---|---|
| 1 | Astore | 35.37 | 74.9 | 2168 |
| 2 | Bunji | 35.67 | 74.63 | 1470 |
| 3 | Burzil | 34.91 | 75.09 | 4030 |
| 4 | Chillas | 35.42 | 74.1 | 1251 |
| 5 | G-Dopata | 34.2 | 73.6 | 813.5 |
| 6 | Jhelum | 32.93 | 73.73 | 287.2 |
| 7 | Kakul | 34.18 | 73.25 | 1309 |
| 8 | Murree | 33.92 | 73.38 | 2127 |
| 9 | Ratu | 35.15 | 74.81 | 2920 |
| 10 | Skardu | 35.34 | 75.54 | 2316.5 |
| 11 | Mangla | 33.06 | 73.63 | 283.3 |
| 12 | Rawalkoat | 33.87 | 74.27 | 1677 |
Publisher’s Note: MDPI stays neutral with regard to jurisdictional claims in published maps and institutional affiliations. |
© 2022 by the authors. Licensee MDPI, Basel, Switzerland. This article is an open access article distributed under the terms and conditions of the Creative Commons Attribution (CC BY) license (https://creativecommons.org/licenses/by/4.0/).
Share and Cite
Nadeem, M.U.; Anjum, M.N.; Afzal, A.; Azam, M.; Hussain, F.; Usman, M.; Javaid, M.M.; Mukhtar, M.A.; Majeed, F. Assessment of Multi-Satellite Precipitation Products over the Himalayan Mountains of Pakistan, South Asia. Sustainability 2022, 14, 8490. https://0-doi-org.brum.beds.ac.uk/10.3390/su14148490
Nadeem MU, Anjum MN, Afzal A, Azam M, Hussain F, Usman M, Javaid MM, Mukhtar MA, Majeed F. Assessment of Multi-Satellite Precipitation Products over the Himalayan Mountains of Pakistan, South Asia. Sustainability. 2022; 14(14):8490. https://0-doi-org.brum.beds.ac.uk/10.3390/su14148490
Chicago/Turabian StyleNadeem, Muhammad Umer, Muhammad Naveed Anjum, Arslan Afzal, Muhammad Azam, Fiaz Hussain, Muhammad Usman, Muhammad Mashood Javaid, Muhammad Ahsan Mukhtar, and Faizan Majeed. 2022. "Assessment of Multi-Satellite Precipitation Products over the Himalayan Mountains of Pakistan, South Asia" Sustainability 14, no. 14: 8490. https://0-doi-org.brum.beds.ac.uk/10.3390/su14148490