
Evaluating the Sustainable Development of the Semiconductor Industry Using BWM and Fuzzy TOPSIS

Department of Business Management, National Taipei University of Technology, 1, Sec. 3, Zhongxiao E. Rd., Taipei 10608, Taiwan
*
Author to whom correspondence should be addressed.
Sustainability 2022, 14(17), 10693; https://0-doi-org.brum.beds.ac.uk/10.3390/su141710693
Submission received: 2 August 2022
/
Revised: 22 August 2022
/
Accepted: 24 August 2022
/
Published: 27 August 2022
(This article belongs to the Special Issue Technological and Organizational Innovation for Sustainable Development)
Abstract
:In recent years, the advancement of electronic technology has been driving a boom in the semiconductor industry worldwide. When implementing business activities, those involved strive to pursue the balanced development of the economy, society, environment, and ecology. Our proposed model provides a systematic analysis process to help conduct a comprehensive evaluation and determine priorities in the semiconductor industry’s pursuit of sustainable development. In the proposed model, we determine the weights of evaluation criteria using the Best Worst Method, which overcomes the shortcomings of AHP. Meanwhile, we incorporate the concept of the aspiration level to optimize the fuzzy TOPSIS technique. The results reveal that the two most important criteria are green resource integration and pollution-discharge treatment for sustainable development in the semiconductor industry. In the traditional TOPSIS method, pollution-discharge treatment is considered the expected value, leading the decision-maker to believe that no improvement is required for pollution-discharge treatment. The model proposed in this study can overcome the abovementioned shortcoming and offer more reliable managerial implications.
1. Introduction
In response to climate change, the sustainable development of industries has become a common global trend [1]. Past scholars’ key discussion points are the circular economy and ensuring the sustainability of limited resources from the perspective of areas [2]. At the same time, the application of sustainable energy and environmental management in the context of industry seeks to maximize economic benefits while minimizing negative impacts on the environment [3]. In light of sustainable development worldwide, various international organizations, including the World Trade Organization (WTO) and European Union (EU), have promulgated a series of legislation and agreements concerning the monitoring of environmental protection.
Having long been energy-intensive, the semiconductor industry is widely recognized as one of the essential industries critical to technological advancement worldwide [4]. Semiconductor firms have also significantly contributed to the increasing convenience mobile devices bring. In the area of professional integrated circuit (IC) manufacturing services, these firms manufacture products that are more advanced, energy-saving, and environmentally friendly and help to reduce the impact of technological progress on the environment [5].
Semiconductor firms continue to lead the way in launching advanced process technologies and providing a comprehensive and complete range of specialized processes to optimize the expansion of research and development (R&D) while driving progress and enhancing life and social well-being through innovation. Furthermore, semiconductor firms have also begun to link their operations with the United Nations Sustainable Development Goals (UN SDGs) and introduce impact valuation to understand the real impact of their operations on the value chain in the face of various problems such as extreme weather conditions, the frequent occurrence of disasters, and an aging society. Semiconductor firms comprehensively examine the relevance of SDGs to their value chain among material issues about corporate social responsibility (CSR) based on two areas of focus: business-driven and welfare-driven priorities [6].
By observing the disclosure and communication principles stipulated in the SDG Compass, semiconductor firms first identify priorities linked to SDGs based on material issues before continuously reviewing and revising priorities. In addition, semiconductor firms clearly explain their annual management performance and goal-achievement status concerning sustainable actions associated with the SDGs and proactively disclose and communicate follow-up measures to stakeholders [7].
Revolving around business models, sustainable management requires investment in six types of capital—namely, finance, manufacturing, intelligence, human resources, nature, and society—to create corresponding value for stakeholders [8]. Various processes in the value chain, such as procurement, production, and product use, could negatively impact the environment and society. Therefore, a sustainable value management model is established as a framework to promote corporate sustainability within the organization through sustainable management capabilities (e.g., business ethics management, innovation, and R&D management) to actively pursue sustainable performance that maximizes positive impact and minimizes adverse impact [9,10].
Currently, the standard method used to evaluate the sustainable development performance of the semiconductor industry is financial cost–benefit analysis [11]. Financial performance is still emphasized when evaluating the sustainable development performance of the semiconductor industry [12]. Furthermore, previous studies on the semiconductor industry do not discuss environment-related criteria for the industry [13]. Compared with other industries, studies evaluating the sustainable development performance of the semiconductor industry are scarce.
Some developed countries have included the semiconductor industry as a key development project [14]. Although many methods are commonly used for organizing and analyzing complex decisions, multiple-criteria decision-making (MCDM) has been comprehensively applied to resolve the decision-making method for dealing with both qualitative and quantitative judgments [15]. The analytical hierarchy process (AHP) is an MCDM methodology and has been used to propose an integrated approach that consists of AHP and DEA in several previous studies [16], such as ranking decision-making [17], evaluating external function importance [18], conducting economic feasibility analysis [19], and evaluating multi-expert performance [20]. Furthermore, MCDM has been widely applied to the evaluation and selection of problems in various industries [21].
This study proposes a framework for evaluating the sustainable development performance of the semiconductor industry and ranking sustainable development performance. First, this study establishes a complete evaluation criteria system based on a review of past literature on sustainable development. Next, the Best Worst Method (BWM) is employed to determine the weights of the evaluation criteria. As a popular method for calculating weights, the BWM addresses two shortcomings of AHP: a high number of pairwise comparisons and poor consistency. Finally, this study calculates the total evaluation score for each sustainable development evaluation criterion and ranks them by priority using modified fuzzy TOPSIS. Fuzzy theory is added to overcome information uncertainty. The traditional concept of “relative satisfaction” is replaced with “aspiration level” to meet the development trends in TOPSIS [22]. The modified TOPSIS can tell how much room for improvement in each criterion for practical application. In summary, there are four main features and contributions of the model proposed in this study:
- Establish a comprehensive framework to evaluate sustainable development performance.
- Determine the weights of evaluation criteria using BWM, which overcomes the shortcomings of AHP.
- Incorporate the concept of aspiration level to optimize the fuzzy TOPSIS technique.
- Investigate the sustainable development of the semiconductor industry based on four dimensions of sustainable value creation (i.e., economy, environment, society, and innovation).
The rest of this paper is structured as follows. The second section introduces the criteria for the sustainable development of the semiconductor industry. The third section describes the hybrid model proposed in this study and the concepts underlying the methods used. The fourth section presents the feasibility and practicality of the model. The fifth and final section concludes the discussion of the study.
2. Literature Review
Evaluation criteria are essential for evaluating the sustainable development performance of the semiconductor industry. First, initial criteria were determined based on relevant academic literature and expert interviews. Second, the framework for evaluating the sustainable development performance of the semiconductor industry was confirmed with the four dimensions. The sustainable development evaluation criteria framework for the semiconductor industry is listed in Table 1.
2.1. Environmental Dimension
Numerous firms devote themselves to environmental sustainability as they continue to promote green factories and pursue optimal efficiency in energy and resource use. Kiani Mavi et al. [28] contended that the purpose of the circular economy is to practice sustainable development by increasing focus on the lean management of renewable energy and waste, as well as on coping with climate change and global warming. These firms are also willing to share their knowledge and experience in environmental protection in the industry with hopes of coping with severe challenges posed by climate change in cooperation with all of society. Regarding the supply chain, environmental externalities arising from the procurement demand of semiconductor firms are heavily influenced by fine particulate matter (PM2.5) and greenhouse gas emissions from the production of chemical raw materials and chemical products. Semiconductor firms continue to actively promote a responsible supply chain by requiring and assisting suppliers in implementing pollution control and preventing and reducing energy and resource use. This dimension includes the following evaluation criteria:
Clean energy use (A11) evaluates whether a company can build a wafer-fabrication plant that achieves clean production. Effective power saving is achieved by implementing energy-efficiency measures. The development of energy-efficient semiconductor technology can help customers produce more energy-efficient products.
Recycling/renewable capacity (A12) evaluates whether a company can establish recycling technologies to share with suppliers. Through joint investment in the development of recycling and reuse, companies can achieve their sustainability goals of manufacturing environmentally friendly products of high quality.
Green resource integration (A13) evaluates whether a company can promote sustainable supply chain management. Companies can establish a supplier risk management matrix and necessitate their suppliers to propose and implement green manufacturing goals.
Pollution-discharge treatment (A14) evaluates whether a firm is actively implementing environmental-protection policies to reduce pollution discharge and thus improve its energy use efficiency. Pollution discharge from the semiconductor industry, especially wafer cleaning and cooling, can have a serious impact on the environment.
2.2. Economic Dimension
Good financial performance is primarily reflected in revenue growth and continuous improvement in profitability, serving as the key to whether a firm can operate sustainably [12]. To pursue good financial performance, the firm sets clear quantitative financial goals so that investors can better understand the long-term value of its investments [23]. Good financial performance also increases investors’ confidence that the firm will be able to maintain profitable growth and a good return on equity. With sound financial performance, the firm can steadily create higher economic value over time while giving it back to its stakeholders. Financial performance is vital to investors because it often directly influences the value of a firm’s investments.
The economic dimension (D2) evaluates a firm’s business performance and governance capabilities. This dimension includes the following evaluation criteria:
Firm size (A21) evaluates a firm’s capitalization, employees, market share, and management. Combining these factors serves as an indicator of firm size and internationalization.
Financial strength (A22) evaluates a firm’s assets and liabilities, income statement, and cash flows shown in its financial statements. Information regarding solvency, internal control, business status, and functions of the board of directors serves as a vital basis for the firm’s financial strength.
Material cost/selling price (A23) is an essential indicator to evaluate a firm’s profitability as it includes all direct and indirect fixed and variable costs such as materials, labor, equipment, plant, operations, marketing, and net/gross profit.
2.3. Social Dimension
Firms focus on labor rights to ensure that employees enjoy a safe and healthy work environment with learning and development opportunities [25]. With sound corporate governance as the cornerstone, firms set out from their own business to actively realize the mission of caring for the disadvantaged by setting related goals and reviewing action plans while maintaining good interaction with stakeholders to create value for them on an ongoing basis [10].
To ensure the implementation of resolutions passed by the ESG Steering Committee, firms lead the members of all committees in formulating annual implementation strategies and goals for sustainability issues and tracking the relevant implementation effectiveness. Firms actively balance the interests of all stakeholders and fully implement ESG strategies in their daily operations [26].
The social dimension (D3) refers to a firm’s ability to offer social care to internal and external organizations. This dimension includes the following evaluation criteria: partners complementarity (A31), corporate brand image (A32), and customer relationship management (CRM) capability (A33).
Partner complementarity (A31) evaluates whether the different resources, capabilities, and technologies owned by all stakeholders in the semiconductor industry can be integrated and managed to enhance competitiveness. Industry heterogeneity among partnering stakeholders can maximize complementarity.
Corporate brand image (A32) fully reflects the firm’s value as it refers to society’s perception. Having an excellent brand image helps a firm increase its profits and expand its channels, thus increasing the market share of its products.
CRM capability (A33) refers to a firm being able to meet customer needs. Specifically, this criterion evaluates how a firm processes customer orders quickly. A firm’s CRM capabilities have a high correlation with loyalty.
2.4. Innovation Dimension
Innovation (D4). Thanks to many innovations and breakthroughs, the semiconductor industry possesses more substantial computing capabilities and better energy efficiency, thereby bringing significant reforms to numerous critical industries, including information and communication technology, transportation, education, healthcare, entertainment, and agriculture [24,27]. Such advances are critical to electronic products that have more positive effects on human life.
The core technical patent (A41). Patents not only come from a firm’s own R&D but can also be obtained by various means, such as the purchase of patents and technology licensing. Firms develop a patent strategy to maintain their competitive advantage.
The product life cycle (A42) refers to the timeline over which a semiconductor product goes through a series of stages, including introduction, growth, maturity, and decline. Firms usually expect a longer life cycle for a semiconductor product as it indicates that the product is able to contribute to the semiconductor industry over a long period.
R&D capability (A43) evaluates whether a firm, based on R&D, possesses advanced technologies and knowledge, clearly understands market needs, and owns product-innovation capabilities.
3. Methods
3.1. Best Worst Method
The BWM, proposed by Rezaei [29], uses a more streamlined questionnaire and demonstrates better consistency than AHP. BWM has been widely used in decision-making problems in a wide range of industries. Rezaei et al. [30] conducted a survey among travelers of different nationalities in the airline industry using the service quality (SERVQUAL) model. Furthermore, Omrani et al. [31] assessed the human development index using a combination of BWM and MULTIMOORA, confirming that BWM is more effective in calculating weights than AHP. The practical application of BWM can also be observed in other examples, such as site selection [32], supplier evaluation [33], and evaluation of firm performance [34]. The steps for obtaining the weights of evaluation criteria are as follows:
Step 1. Select a set of decision criteria.
The decision-making group sets n evaluation criteria that satisfy the decision-making problem .
Step 2. Determine the best and worst criteria.
The decision-maker selects the best (e.g., most satisfactory, most desirable, or most important) and worst criteria. The critical aspects impacting the consequences of the analysis are the criteria selected.
Step 3. Determine the preference of the best criterion over all other criteria to produce the Best-to-Others (BO) vector.
The decision-maker determines the preference of the best criterion over all other criteria, as presented in Table 2, using a scale of 1 to 9, with 1 representing “Equally important” and 9 “Extremely more important” to produce a BO vector. The resulting BO vector is expressed as follows:
where indicates the preference of the best criterion B over criterion j, and =1. The preference of the best criterion B over itself is 1.
Step 4. Determine the preference of all the remaining criteria over the worst criterion to produce the Others-to-Worst (OW) vector.
Similar to Step 3, the decision-maker determines the preference of other criteria over the worst criterion to produce the OW vector. The resulting OW vector is expressed as follows:
where indicates the preference of criterion j over the worst criterion W, and =1. The preference of the worst criterion W over itself is 1.
Step 5. Compute the optimal weight of all criteria .
The optimal weight of the criteria is determined using a linear programming model. The inputs of this model are the absolute differences between the BO and OW vectors (the ratio of the weight of the best criterion to the weight of other criteria and the ratio of the weight of other criteria to the weight of the worst criterion) and expert evaluations (i.e., and ). After maximizing these absolute differences, the minimum of the two remaining values is chosen as the best objective function value. The complete model is expressed as follows:
In Equation (1), the objective function for minimizing the maximum value can be converted into a linear objective function for calculation purposes. The converted objective function for minimization can be expressed by the following model:
As Equation (2) may produce multiple optimal solutions, Rezaei [35] proposed a linear BWM model by modifying the objective function for minimization into:
Since Equation (3) is a linear problem, only one optimal solution, that is, optimal weight , will be obtained. In this equation, can be considered a consistency indicator, where values of approaching 0 indicate high consistency.
3.2. Basic Concepts in Fuzzy Set Theory
In the real world, uncertainty arises in many decision-making processes because goals, constraints, and judgmental behaviors are neither accurate nor known information. The decision-making process is often influenced by subjective and fuzzy judgments when implemented against the backdrop of uncertainty. In practice, linguistic variables can be expressed in terms of fuzzy numbers, thereby forming fuzzy sets. Triangular fuzzy numbers consist of a lower limit, middle limit, and upper limit. Suppose that is a set of triangular fuzzy numbers, which can be expressed as . Some important definitions and symbols related to fuzzy set theory are available in the paper published by Zadeh [36].
The four arithmetic operations on fuzzy numbers are often employed in the MCDM process. Hence, the arithmetic operations on two sets of triangular fuzzy numbers, and , are listed as follows:
- (i)
- Addition of two sets of triangular fuzzy numbers:
- (ii)
- Subtraction of two sets of triangular fuzzy numbers:
- (iii)
- Multiplication of two sets of triangular fuzzy numbers:
- (iv)
- Division of two sets of triangular fuzzy numbers:
3.3. Fuzzy Modified TOPSIS-AL Technique
TOPSIS has been applied to various problems as it is easy to understand and use [37]. This study employs TOPSIS in combination with fuzzy theory to reflect uncertainty in the practical evaluation environment and replaces relatively better solutions in existing methods with aspiration levels. The steps for performing TOPSIS are as follows:
Step 1. Define the symbols.
Suppose there are m alternatives and n criteria , where the weight of these criteria is defined as . Dk (k = 1, 2,…, p) evaluates alternatives Ai (i = 1, 2,…, m) according to criteria cj (j = 1, 2,…, n). Table 3 presents the scale of the performance evaluation.
Step 2. Construct initial fuzzy decision matrix .
Expert Dk evaluates all alternatives according to the scale shown in Table 3. This study aggregates evaluations from all the experts using an arithmetic mean as follows:
Step 3. Construct a normalized fuzzy decision matrix .
The normalized fuzzy decision matrix is . Conventional normalization is performed by taking the best performance value as the denominator, that is:
In this study, the concept of aspiration level is introduced in this step. Hence, the modified equation is expressed as follows:
where xasprie = 10 (the highest level on the evaluation scale).
Step 4. Construct a weighted normalized fuzzy decision matrix .
Considering the different levels of importance among all criteria, the weighted normalized fuzzy decision matrix is obtained by multiplying the weight of the evaluation criteria (wj) by the normalized fuzzy decision matrix () as shown below:
Step 5. Define the fuzzy positive ideal solution (FPIS) and fuzzy negative ideal solution (FNIS).
The alternatives (Aasprie and Aworst) are calculated as follows:
Step 6. Calculate the distances of each alternative from FPIS and FNIS.
Based on the definition of squared Euclidean distance, the distances of alternative i from PIS and NIS are calculated using Equations (14) and (15), respectively. In this step, the fuzzy values are defuzzified and converted to explicit values.
Step 7. Calculate the closeness coefficient (CCi).
is a reliable ranking score. The model considers the distance between all alternatives and PIS and NIS, respectively, which allows for compensation for the shortcomings of the traditional TOPSIS method [21].
The closer is to 1, the closer it is to the aspiration level, while the closer it is to −1, the closer it is to the worst level.
4. Results
This section explains the computation process proposed in this study. A group of 8 experts with more than 15 years of work experience in the semiconductor industry was enrolled in this study to assess from different professional perspectives whether it is necessary to evaluate sustainable development performance. Additionally, their backgrounds are briefly described in Table 4 below. We identified 4 dimensions and 13 criteria under these dimensions through a review of the relevant literature.
4.1. Obtaining the Weights of Criteria through BWM
We obtained the weights of criteria using BWM as described in Section 3.1. First, the experts were asked to determine the best and worst criteria. Table 5 reveals the results from eight experts are presented. The best and worst dimensions were chosen, while Table 6 shows the BO vector for the dimensions. The OW vector for the dimensions is presented in Table 7.
By solving Equation (3), we could determine the weight of each dimension. The weights of all criteria were obtained following the same procedure. Table 8 presents the weights of dimensions provided by the eight experts based on BWM.
Table 9 presents the combined weights of the evaluation criteria for all dimensions obtained using BWM. The environmental dimension (D1) is the most important dimension that semiconductor firms need to focus on in the area of sustainable development. The dimensions are ranked by weight as follows: environmental dimension (D1) , social dimension (D3) , economic dimension (D2) , and innovation dimension (D4). The results reveal that the innovation dimension and economic dimension are relatively mature for the sustainable development of the semiconductor industry. Through numerous innovations and breakthroughs, semiconductors have obtained more powerful computing power and better energy efficiency and have brought significant reforms in many key industries, including information and communications technology, transportation, education, healthcare, entertainment, and agriculture. These advancements are significant for electronic products that impact human life more positively.
Semiconductor companies construct a global patent strategy to protect their freedom to operate and maintain advanced technological achievements. With the technical leadership of professional integrated circuit manufacturing services and innovative analysis methods such as patent maps, companies can formulate a global intellectual property deployment strategy. Simultaneously, through an innovative patent-management system, the patent application process is supervised to ensure quality and efficiency. The companies regularly review the patent map, implement strategic patent purchases or patent alliance cooperation, and build a dense patent-protection network.
4.2. Sustainable Development Performance of the Semiconductor Industry
The process of constructing a sustainable development framework for the semiconductor industry is both complex and difficult. MCDM satisfies business owners’ desire to understand the situation with a simple and quick analysis process to support the formulation of improvement strategies. The model incorporates the aspiration level concept to avoid considering only relatively preferred solutions in existing methods.
It is challenging to transform experts’ subjective opinions directly into numerical values. Therefore, converting expert opinions into triangular fuzzy numbers using linguistic variables is a useful solution for converting qualitative data into fuzzy numbers. The eight experts evaluated the performance of the four dimensions related to the sustainable development of the semiconductor industry.
Table 10 presents the initial fuzzy decision matrix obtained from the eight experts. Table 11 and Table 12 present the normalized fuzzy decision matrix and weighted normalized fuzzy decision matrix , which can be obtained using Equations (10) and (11), respectively. In practice, governments, firms, or organizations will set a benchmark goal, which they can improve and move toward. This is consistent in this study, as more practical feedback and recommendations for improvement can be obtained via the fuzzy modified TOPSIS-AL technique.
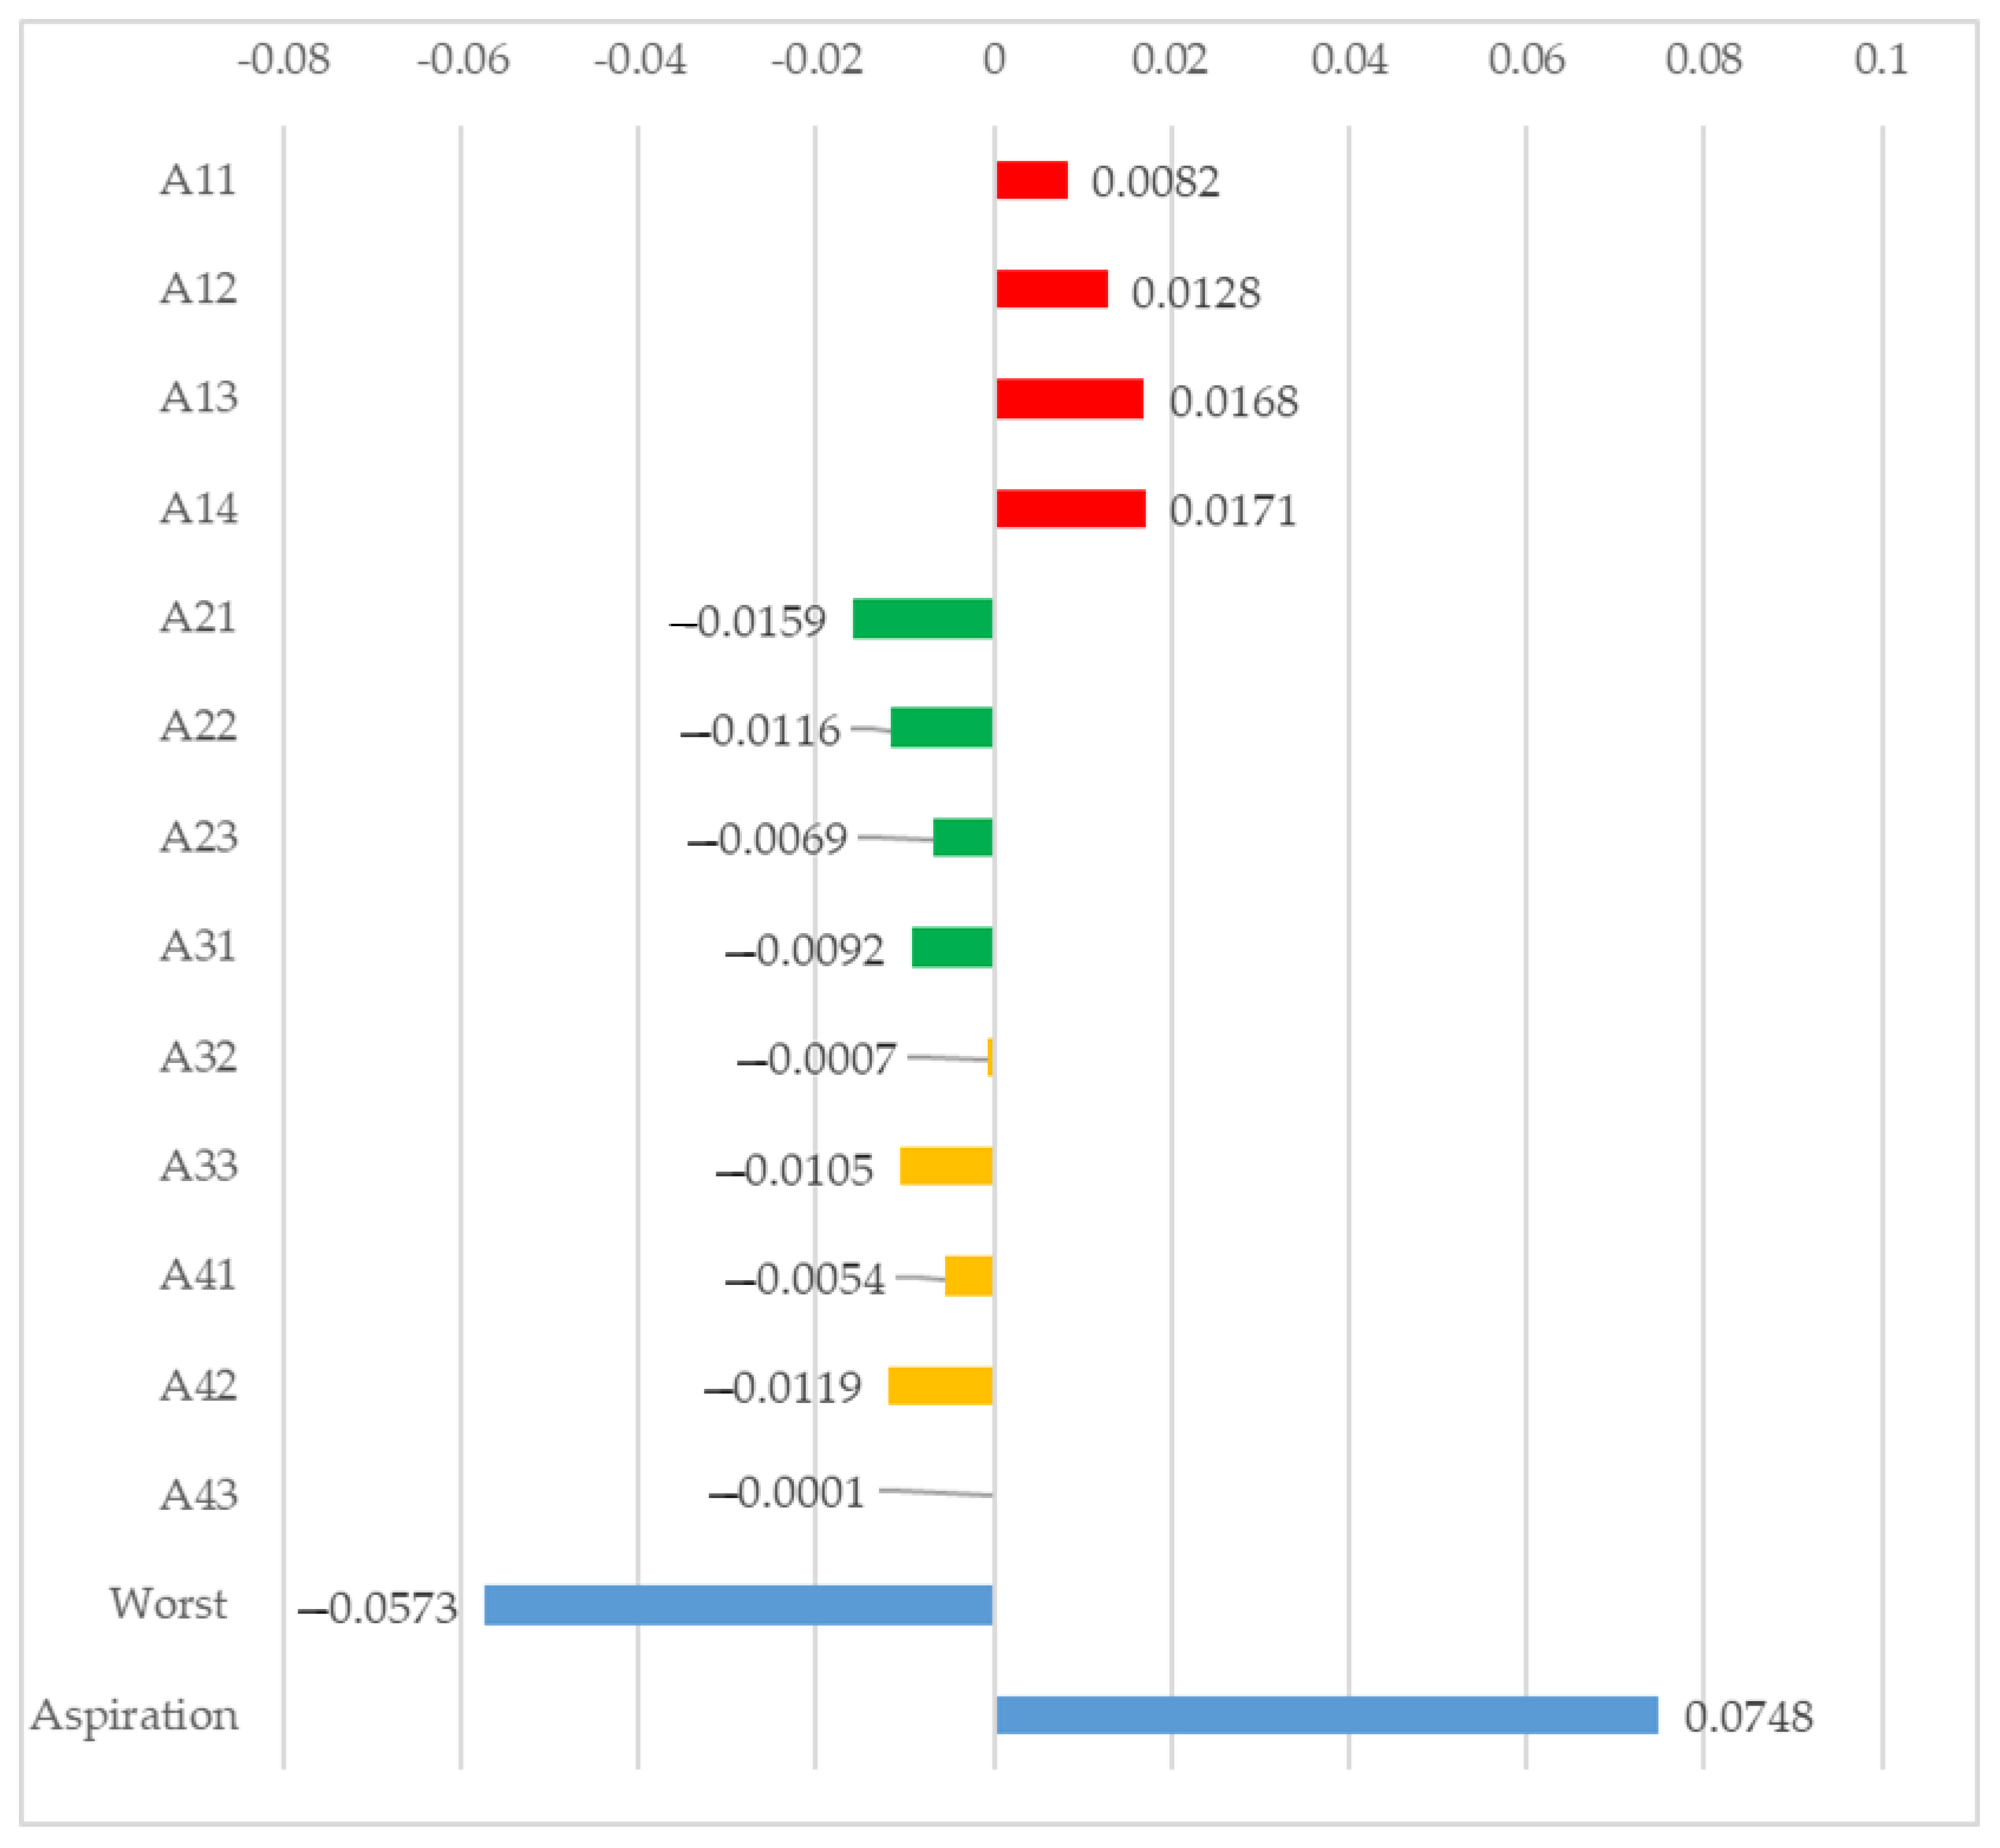
Semiconductor firms need to integrate these goals into daily activities by various means and identify feasible ways to incorporate the SDGs into organizational culture. By carrying out integration at various stages, semiconductor firms, in collaboration with their stakeholders, establish their SDGs, namely, the supply chain, process, and product, before shifting from answering the call of SDGs to linking them to tangible actions and then implementing them through collaboration. The distances of evaluation criterion Ai from FPIS and FNIS can be determined using Equations (12)–(15). Table 13 shows the calculation results obtained using both BWM and the fuzzy-modified TOPSIS-AL technique. The evaluation criteria are ranked by priority as follows: A14 A13 A12 A11 A43. To visualize our evaluation results, Figure 1 offers a clearer picture of the relative performance and room for improvement of evaluation criterion Ai. Green enterprises, which are committed to the sustainable development of the environment, comply with environmental regulations and related international standards and norms. They make continuous improvements while engaging in source reduction and full employee participation to reduce the impact of production on the environment. Furthermore, these firms eliminate any foreseeable risk of environmental pollution and appropriately protect the natural environment.
The distance between each evaluation criterion and the aspiration level is illustrated in Figure 1. Although A14 is the top-ranked sustainable development evaluation criterion, the overall distance of this criterion from the aspiration level is 0.0577 units. In the traditional TOPSIS method, A14 is considered the expected value, which leads the decision-maker to believe that no improvement is required for A14. The model proposed in this study can overcome the abovementioned shortcoming and offer more reliable managerial implications. Previous studies established industry standards by strengthening the requirements for the supply chain on climate issues while using the best available technology standards for mitigation and adaptation promoted by international industry associations in collaboration with governments [38,39]. The purpose was to gradually enhance the ability of the entire industry chain to face climate change and thus reduce the climate risk of business operations. Their studies echo our analysis results, with the two most important criteria being green resource integration (A13) and pollution-discharge treatment (A14).
Past studies argued that firms’ performance in environmental protection could enhance the competitiveness of the semiconductor industry [40]. The construction and expansion of semiconductor plants, along with the evolution of advanced process technology, have led to rising demand for electricity, water, and raw materials. To reduce the social cost of energy consumption, semiconductor firms should continue to promote various sustainable actions such as engaging in low-carbon manufacturing, improving energy-use efficiency, and increasing the proportion of renewable energy use.
With the development of advanced manufacturing processes, there has been an increase in the complexity of the manufacturing process and production capacity. As a result, the number of raw materials used by semiconductor companies and the amount of waste output have also increased simultaneously. In response to the increase in air pollutant emissions due to the manufacturing process’s development, semiconductor companies have started actively improving the processing efficiency of terminal pollution control equipment. Semiconductor companies practice green manufacturing and adhere to the principle of waste management, which aims to minimize waste output and maximize resource recycling.
5. Discussions
There has been a surge in demand for electronic products such as personal computers, multimedia devices, workstations, networks, and communication-related equipment. This is driving a boom in the semiconductor industry worldwide. In Taiwan, the semiconductor industry has become a major force in sustaining the national economy. Essentially, semiconductor manufacturing is a high-value-added industry with a vertical division of labor. Its rapid growth will also drive prosperity in other peripheral industries.
Finance-wise, economic value is created and given back through the effective management of financial resources. Building factories with cleaner production is the basic responsibility for corporate sustainability. Regarding the social aspect, semiconductor firms strengthen talent cultivation to ensure that talents become a key capital for firms. In addition, a safe and inclusive workplace is created to ensure that each employee can enjoy a safe work environment that safeguards human rights and offers skill development while becoming a protected asset for firms. Concerning the environment, the consumption of natural resources is reduced through source control to maintain optimal resource use efficiency. Apart from reviewing the supply chain to continuously ensure no abuse and no violation of human rights, semiconductor firms provide suppliers with the necessary guidance and training and require them to comply with the code of conduct. The purpose is to promote sustainable actions for a green supply chain and the recycling of material and energy sources across fields to ensure the positive development of the supply chain.
In the innovation dimension, semiconductor firms continue to invest in innovation, R&D, and patents to strengthen their intellectual capital. In response to the rapid evolution of technology along with global sustainability trends, they not only bring new technology applications through innovation but also address climate change issues facing mankind through product and process innovation. A solid intellectual property portfolio enhances a firm’s leadership in technology. Establishing an operating model that creates value through intellectual property rights protects a firm’s freedom to operate and enhances its competitive advantage, using it to generate profit. To continuously strengthen their R&D momentum to maintain their leadership in technology, semiconductor firms encourage their employees to engage in various innovations in their work through the firms’ internal innovation reward mechanism, thus enhancing the innovation vitality of their organization on an ongoing basis. Furthermore, assistance is provided to customers, industry, and academia to engage in innovation across fields, including product innovation with customers, technical talent innovation with academic and research institutions, and green innovation with suppliers.
With technological challenges becoming increasingly complex and difficult, as noted by Moore’s law, semiconductor firms must constantly invest in R&D resources to keep providing cutting-edge process technologies and design solutions. While continuously paying attention to the trend of climate change due to corporate responsibility for environmental protection, semiconductor firms engage in not only electricity saving but also in the use of renewable energy as another concrete action to reduce greenhouse gas emissions. When various conditions such as laws and regulations and a gradual increase in local market supply mature, they directly purchase renewable energy to effectively reduce greenhouse gas emissions, demonstrating active support for SDGs in the process. Through intelligent and precise manufacturing, semiconductor companies can stably promote intelligent manufacturing and continue to bring innovations into the globally integrated circuit manufacturing industry to achieve comprehensive smart automatic manufacturing.
6. Conclusions
This study proposed a model for evaluating the sustainable development performance of the semiconductor industry. First, after a review of a large volume of literature and expert interviews, this study determined 4 dimensions and 13 criteria to establish an evaluation framework. Second, this study obtained the weights of evaluation criteria using BWM, a reliable method for determining weights in MCDM problems, thanks to fewer pairwise comparisons and the ease of obtaining highly consistent results. Lastly, we modified the TOPSIS method proposed by Kuo [41] by adding fuzzy theory.
Some studies confirmed the effectiveness of using both BWM and TOPSIS to analyze evaluation problems. Thus, the computation procedures proposed in this study optimize the TOPSIS technique. All semiconductor firms can formulate relevant improvement strategies based on these evaluation results to achieve their aspiration level. The result in Table 9 reveals that the innovation dimension and economic dimension are relatively mature for the sustainable development of the semiconductor industry. Moreover, Table 13 shows that pollution-discharge treatment is the top-ranked sustainable development evaluation criterion. Faced with the evolution of advanced processes and the expansion of production capacity, semiconductor firms continue to expand the circular economy to effectively reduce the environmental impact of rising waste volume. To achieve resource recycling and reuse, firms should implement a gradual shift in management strategy from waste management to sustainable resource management. While continuously reducing the use of resources at the source (reduce), firms should first consider reusing raw materials in their factories and delay discarding materials as waste after using raw materials in manufacturing processes. In addition, reuse is carried out through recycling and recovery before disposal by means of incineration and landfilling.
Overall, our model combines a few state-of-the-art methods and considers various realistic factors, including information uncertainty and the concept of aspiration level. This study has proven the validity and reliability of the proposed model. Although this study has contributed to the understanding of evaluating the sustainable development in the semiconductor industry, there are still several limitations. This study utilizes the BWM techniques to overcome the shortcomings of AHP. Future work can consider a broader range of fuzzy information to check the proposed model’s applicability and effectiveness. Furthermore, MCDM provides a plethora of distinct methodologies for analyzing complex and contradictory problems, especially involving multiple and conflicting criteria that overstep the limitations of cognition and become a complicated issue for decision-making. Future studies can consider advanced tools for intelligent analysis of expert opinions with more accurate and deeper insights (such as NVivo).
Author Contributions
S.-P.S. and J.-F.T. built the evaluation system and performed the research together. S.-P.S. analyzed the data and wrote the manuscript. J.-F.T. revised the manuscript. All authors have read and agreed to the published version of the manuscript.
Funding
This research received no external funding.
Data Availability Statement
The datasets generated during and analyzed during the current study are available from the corresponding author on reasonable request.
Conflicts of Interest
The authors declare no conflict of interest.
References
- Liu, J.; Fang, M.; Jin, F.; Wu, C.; Chen, H. Multi-attribute decision making based on stochastic DEA cross-efficiency with ordinal variable and its application to evaluation of banks’ sustainable development. Sustainability 2020, 12, 2375. [Google Scholar] [CrossRef]
- Liu, X.; Guo, P.; Guo, S. Assessing the eco-efficiency of a circular economy system in China’s coal mining areas: Emergy and data envelopment analysis. J. Clean. Prod. 2019, 206, 1101–1109. [Google Scholar] [CrossRef]
- Lin, F.; Lin, S.-W.; Lu, W.-M. Dynamic eco-efficiency evaluation of the semiconductor industry: A sustainable development perspective. Environ. Monit. Assess. 2019, 191, 435. [Google Scholar] [CrossRef] [PubMed]
- Chang, C.T.; Lee, H.C. Taiwan’s renewable energy strategy and energy-intensive industrial policy. Renew. Sustain. Energy Rev. 2016, 64, 456–465. [Google Scholar] [CrossRef]
- Sueyoshi, T.; Ryu, Y. Performance Assessment of the semiconductor industry: Measured by DEA environmental assessment. Energies 2020, 13, 5998. [Google Scholar] [CrossRef]
- Walker, A.M.; Vermeulen, W.J.; Simboli, A.; Raggi, A. Sustainability assessment in circular inter-firm networks: An integrated framework of industrial ecology and circular supply chain management approaches. J. Clean. Prod. 2021, 286, 125457. [Google Scholar] [CrossRef]
- Sarker, M.R.; Ali, S.M.; Paul, S.K.; Munim, Z.H. Measuring sustainability performance using an integrated model. Measurement 2021, 184, 109931. [Google Scholar] [CrossRef]
- Ajmal, M.M.; Khan, M.; Hussain, M.; Helo, P. Conceptualizing and incorporating social sustainability in the business world. Int. J. Sustain. Dev. World Ecol. 2018, 25, 327–339. [Google Scholar] [CrossRef]
- D’amato, D.; Korhonen, J. Integrating the green economy, circular economy and bioeconomy in a strategic sustainability framework. Ecol. Econ. 2021, 188, 107143. [Google Scholar] [CrossRef]
- Lin, X.-M.; Kireeva, N.; Timoshin, A.; Naderipour, A.; Abdul-Malek, Z.; Kamyab, H. A multi-criteria framework for designing of stand-alone and grid-connected photovoltaic, wind, battery clean energy system considering reliability and economic assessment. Energy 2021, 224, 120154. [Google Scholar] [CrossRef]
- Tirkel, I.; Rabinowitz, G. Modeling cost benefit analysis of inspection in a production line. Int. J. Prod. Econ. 2014, 147, 38–45. [Google Scholar] [CrossRef]
- Park, J.H.; Chung, H.; Kim, K.H.; Kim, J.J.; Lee, C. The Impact of Technological Capability on Financial Performance in the Semiconductor Industry. Sustainability 2021, 13, 489. [Google Scholar] [CrossRef]
- Li, H.; He, H.; Shan, J.; Cai, J. Innovation efficiency of semiconductor industry in China: A new framework based on generalized three-stage DEA analysis. Socio-Econ. Plan. Sci. 2019, 66, 136–148. [Google Scholar] [CrossRef]
- Lin, F.; Lin, S.-W.; Lu, W.-M. Sustainability assessment of Taiwan’s semiconductor industry: A new hybrid model using combined analytic hierarchy process and two-stage additive network data envelopment analysis. Sustainability 2018, 10, 4070. [Google Scholar] [CrossRef]
- Kavurmaci, M.; Üstün, A.K. Assessment of groundwater quality using DEA and AHP: A case study in the Sereflikochisar region in Turkey. Environ. Monit. Assess. 2016, 188, 1–13. [Google Scholar] [CrossRef] [PubMed]
- Kengpol, A.; Tuammee, S. The development of a decision support framework for a quantitative risk assessment in multimodal green logistics: An empirical study. Int. J. Prod. Res. 2015, 54, 1020–1038. [Google Scholar] [CrossRef]
- An, Q.; Meng, F.; Xiong, B. Interval cross efficiency for fully ranking decision making units using DEA/AHP approach. Ann. Oper. Res. 2018, 271, 297–317. [Google Scholar] [CrossRef]
- Chul Park, S.; Lee, J.H. Supplier selection and stepwise benchmarking: A new hybrid model using DEA and AHP based on cluster Analysis. J. Oper. Res. Soc. 2017, 69, 449–466. [Google Scholar] [CrossRef]
- Lu, G.; Dirong, X.; Lin, H.; Lei, W. Economic Feasibility Analysis for Renewable Energy Project Using an Integrated TFN–AHP–DEA Approach on the Basis of Consumer Utility. Energies 2017, 10, 2089. [Google Scholar] [CrossRef]
- Otay, İ.; Oztaysi, B.; Cevik Onar, S.; Kahraman, C. Multi-expert performance evaluation of healthcare institutions using an integrated intuitionistic fuzzy AHP&DEA methodology. Knowl.-Based Syst. 2017, 133, 90–106. [Google Scholar] [CrossRef]
- Lo, H.-W.; Liou, J.J.H.; Wang, H.-S.; Tsai, Y.-S. An integrated model for solving problems in green supplier selection and order allocation. J. Clean. Prod. 2018, 190, 339–352. [Google Scholar] [CrossRef]
- Chang, T.-W.; Lo, H.-W.; Chen, K.-Y.; Liou, J.J. A novel FMEA model based on rough BWM and rough TOPSIS-AL for risk assessment. Mathematics 2019, 7, 874. [Google Scholar] [CrossRef]
- Khan, M.P.; Talib, N.A.; Kowang, T.O. Development of Sustainability Framework Based on the Theory of Resource Based View. Int. J. Acad. Res. Bus. Soc. Sci. 2018, 8, 636–647. [Google Scholar] [CrossRef]
- Manjunatheshwara, K.; Vinodh, S. Sustainable electronics product design and manufacturing: State of art review. Int. J. Sustain. Eng. 2021, 14, 541–551. [Google Scholar] [CrossRef]
- Jamwal, A.; Agrawal, R.; Sharma, M.; Kumar, V.; Kumar, S. Developing A sustainability framework for Industry 4.0. Procedia CIRP 2021, 98, 430–435. [Google Scholar] [CrossRef]
- Malesios, C.; De, D.; Moursellas, A.; Dey, P.K.; Evangelinos, K. Sustainability performance analysis of small and medium sized enterprises: Criteria, methods and framework. Socio-Econ. Plan. Sci. 2021, 75, 100993. [Google Scholar] [CrossRef]
- Sanchez-Planelles, J.; Segarra-Oña, M.; Peiro-Signes, A. Building a Theoretical Framework for Corporate Sustainability. Sustainability 2021, 13, 273. [Google Scholar] [CrossRef]
- Kiani Mavi, R.; Saen, R.F.; Goh, M. Joint analysis of eco-efficiency and eco-innovation with common weights in two-stage network DEA: A big data approach. Technol. Forecast. Soc. Chang. 2018, 144, 553–562. [Google Scholar] [CrossRef]
- Rezaei, J. Best-worst multi-criteria decision-making method. Omega 2015, 53, 49–57. [Google Scholar] [CrossRef]
- Rezaei, J.; Kothadiya, O.; Tavasszy, L.; Kroesen, M. Quality assessment of airline baggage handling systems using SERVQUAL and BWM. Tour. Manag. 2018, 66, 85–93. [Google Scholar] [CrossRef]
- Omrani, H.; Alizadeh, A.; Amini, M. A new approach based on BWM and MULTIMOORA methods for calculating semi-human development index: An application for provinces of Iran. Socio-Econ. Plan. Sci. 2020, 70, 100689. [Google Scholar] [CrossRef]
- Stević, Ž.; Pamučar, D.; Subotić, M.; Antuchevičiene, J.; Zavadskas, E.K. The location selection for roundabout construction using Rough BWM-Rough WASPAS approach based on a new Rough Hamy aggregator. Sustainability 2018, 10, 2817. [Google Scholar] [CrossRef]
- Amiri, M.; Hashemi-Tabatabaei, M.; Ghahremanloo, M.; Keshavarz-Ghorabaee, M.; Zavadskas, E.; Banaitis, A. A new fuzzy BWM approach for evaluating and selecting a sustainable supplier in supply chain management. Int. J. Sustain. Dev. World Ecol. 2021, 28, 125–142. [Google Scholar] [CrossRef]
- Garg, C.P.; Sharma, A. Sustainable outsourcing partner selection and evaluation using an integrated BWM–VIKOR framework. Environ. Dev. Sustain. 2020, 22, 1529–1557. [Google Scholar] [CrossRef]
- Rezaei, J. Best-worst multi-criteria decision-making method: Some properties and a linear model. Omega 2016, 64, 126–130. [Google Scholar] [CrossRef]
- Zadeh, L.A. The concept of a linguistic variable and its application to approximate reasoning—I. Inf. Sci. 1975, 8, 199–249. [Google Scholar] [CrossRef]
- Chen, P. Effects of the entropy weight on TOPSIS. Expert Syst. Appl. 2021, 168, 114186. [Google Scholar] [CrossRef]
- Kazancoglu, I.; Sagnak, M.; Kumar Mangla, S.; Kazancoglu, Y. Circular economy and the policy: A framework for improving the corporate environmental management in supply chains. Bus. Strategy Environ. 2021, 30, 590–608. [Google Scholar] [CrossRef]
- Sharma, M.; Luthra, S.; Joshi, S.; Kumar, A. Developing a framework for enhancing survivability of sustainable supply chains during and post-COVID-19 pandemic. Int. J. Logist. Res. Appl. 2022, 25, 433–453. [Google Scholar] [CrossRef]
- Hatami-Marbini, A.; Agrell, P.J.; Tavana, M.; Khoshnevis, P. A flexible cross-efficiency fuzzy data envelopment analysis model for sustainable sourcing. J. Clean. Prod. 2017, 142, 2761–2779. [Google Scholar] [CrossRef]
- Kuo, T. A modified TOPSIS with a different ranking index. Eur. J. Oper. Res. 2017, 260, 152–160. [Google Scholar] [CrossRef]
Figure 1.
Closeness coefficients of the evaluation criteria.


Table 1.
Sustainable development evaluation criteria framework for the semiconductor industry.
| Dimension | Criteria | Description | References |
|---|---|---|---|
| Environmental (D1) | Clean energy use (A11) | Whether a company can build a wafer-fabrication plant that achieves clean production. Effective power saving is achieved by implementing energy-efficiency measures. The development of energy-efficient semiconductor technology can help customers produce more energy-efficient products. | [5,23,24] |
| Recycling/renewable capacity (A12) | Whether a company can establish recycling technologies to share with suppliers. Through joint investment in the development of recycling and reuse, companies can achieve their sustainability goals of manufacturing environmentally friendly products of high quality. | [9,25,26,27] | |
| Green resource integration (A13) | Whether a company can promote sustainable supply chain management. Companies can establish a supplier risk management matrix and necessitate their suppliers to propose and implement green manufacturing goals. | [6,7] | |
| Pollution-discharge treatment (A14) | Whether a firm is actively implementing environmental-protection policies to reduce pollution discharge and thus improve their energy-use efficiency. Pollution discharge from the semiconductor industry, especially wafer cleaning and cooling, can have a serious impact on the environment. | [5,26,27] | |
| Economic (D2) | Firm size (A21) | A firm’s capitalization, employees, market share, and management. | [7,9,10] |
| Financial strength (A22) | A firm’s assets and liabilities, income statement, and cash flows shown in its financial statements. | [9,24] | |
| Material cost/selling price (A23) | A firm’s profitability as it includes all direct and indirect fixed and variable costs such as materials, labor, equipment, plant, operations, and marketing, and net/gross profit. | [10,24,27] | |
| Social (D3) | Partner complementarity (A31) | Whether the different resources, capabilities, and technologies owned by all stakeholders in the semiconductor industry can be integrated and managed to enhance competitiveness. | [8,9,25] |
| Corporate brand image (A32) | The firm’s value as it refers to society’s perception. | [8,24] | |
| CRM capability (A33) | A firm can provide to meet customer needs. | [8,9,25,27] | |
| Innovation (D4) | Core technical patent (A41) | Patents not only come from a firm’s own R&D but can also be obtained by various means, such as the purchase of patents and technology licensing. | [5,6,7] |
| Product life cycle (A 42) | The timeline over which a semiconductor product goes through a series of stages, including introduction, growth, maturity, and decline. | [5,24,26] | |
| R&D capability (A43) | Whether a firm, based on R&D, possesses advanced technologies and knowledge, clearly understands market needs, and owns product-innovation capabilities. | [6,7,26] |
Table 2.
Evaluation scale for the BWM questionnaire.
| Linguistic Variable | Code |
|---|---|
| Equally important | 1 |
| Moderately more important | 3 |
| Strongly more important | 5 |
| Very strongly more important | 7 |
| Extremely more important | 9 |
| Intermediate values | 2, 4, 6, 8 |
Table 3.
Linguistic variables and corresponding triangular fuzzy numbers.
| Linguistic Variable | Code | Fuzzy Numbers |
|---|---|---|
| Very poor | VP | (0, 1, 2) |
| Poor | P | (2, 3, 4) |
| Fair | F | (4, 5, 6) |
| Good | G | (6, 7, 8) |
| Very good | VG | (8, 9, 10) |
Table 4.
Introduction to the background and academic experience of the experts.
| Expertise | Expert Composition | Number of Experts |
|---|---|---|
| Practical Experience (years) | 5–10 11–20 21–30 | 1 5 2 |
| Field | Vice President Project Manager Engineer | 3 2 3 |
Table 5.
BWM dimensions.
| Expert No. | 1 | 2 | 3 | 4 | 5 | 6 | 7 | 8 |
|---|---|---|---|---|---|---|---|---|
| Best | D3 | D1 | D1 | D1 | D1 | D3 | D3 | D1 |
| Worst | D4 | D3 | D3 | D4 | D4 | D4 | D4 | D2 |
Table 6.
BO vector for dimensions.
| Expert No. | Best | D1 | D2 | D3 | D4 |
|---|---|---|---|---|---|
| 1 | D3 | 2 | 3 | 1 | 5 |
| 2 | D1 | 1 | 3 | 7 | 5 |
| 3 | D1 | 1 | 4 | 5 | 3 |
| 4 | D1 | 1 | 5 | 3 | 7 |
| 5 | D1 | 1 | 5 | 3 | 7 |
| 6 | D3 | 4 | 3 | 1 | 5 |
| 7 | D3 | 3 | 4 | 1 | 5 |
| 8 | D1 | 1 | 7 | 5 | 3 |
Table 7.
OW vector for dimensions.
| Expert No. | 1 | 2 | 3 | 4 | 5 | 6 | 7 | 8 |
|---|---|---|---|---|---|---|---|---|
| Worst | D4 | D3 | D3 | D4 | D4 | D4 | D4 | D2 |
| D1 | 5 | 6 | 7 | 7 | 7 | 3 | 3 | 7 |
| D2 | 2 | 2 | 3 | 2 | 5 | 5 | 2 | 1 |
| D3 | 7 | 1 | 1 | 3 | 6 | 7 | 5 | 3 |
| D4 | 1 | 5 | 5 | 1 | 1 | 1 | 1 | 5 |
Table 8.
Weights of dimensions provided by the eight experts and corresponding average weights.
| Expert No. | 1 | 2 | 3 | 4 | 5 | 6 | 7 | 8 |
|---|---|---|---|---|---|---|---|---|
| D1 | 0.360 | 0.423 | 0.418 | 0.448 | 0.401 | 0.290 | 0.336 | 0.425 |
| D2 | 0.176 | 0.203 | 0.186 | 0.172 | 0.200 | 0.232 | 0.185 | 0.135 |
| D3 | 0.339 | 0.168 | 0.176 | 0.253 | 0.278 | 0.341 | 0.335 | 0.213 |
| D4 | 0.125 | 0.206 | 0.219 | 0.126 | 0.122 | 0.137 | 0.144 | 0.227 |
Table 9.
Weights of the evaluation criteria.
| D1 | D2 | D3 | D4 | |
|---|---|---|---|---|
| Waggregation | 0.3862 | 0.1910 | 0.2578 | 0.1650 |
Table 10.
Initial fuzzy decision matrix .
| D1 | D2 | D3 | D4 | |
|---|---|---|---|---|
| A11 | (4.875, 5.875, 6.875) | (5.250, 6.250, 7.125) | (1.250, 2.000, 3.000) | (4.875, 5.875, 6.875) |
| A12 | (5.000, 6.000, 7.000) | (4.250, 5.250, 6.250) | (4.750, 5.750, 6.750) | (4.750, 5.750, 8.250) |
| A13 | (5.500, 6.500, 7.500) | (6.375, 7.375, 8.375) | (1.875, 2.750, 3.750) | (4.875, 5.875, 6.875) |
| A14 | (6.000, 7.000, 7.875) | (5.625, 6.625, 7.625) | (1.750, 2.625, 3.625) | (5.500, 6.500, 7.500) |
| A21 | (2.250, 3.000, 4.000) | (2.750, 3.750, 4.750) | (2.750, 3.750, 4.750) | (3.250, 4.250, 5.250) |
| A22 | (3.125, 4.000, 5.000) | (3.250, 4.250, 5.250) | (2.125, 3.125, 4.125) | (3.375, 4.375, 5.375) |
| A23 | (3.25, 4.000, 5.000) | (3.250, 4.250, 5.250) | (3.500, 4.500, 5.500) | (3.750, 4.750, 5.750) |
| A31 | (3.375, 4.250, 5.250) | (3.875, 4.750, 5.750) | (3.125, 4.000, 5.000) | (2.750, 3.750, 4.750) |
| A32 | (4.625, 5.625, 6.500) | (3.500, 4.500, 5.500) | (4.125, 5.125, 6.125) | (3.625, 4.625, 5.500) |
| A33 | (4.000, 5.000, 6.000) | (3.000, 4.000, 5.000) | (3.000, 4.000, 5.000) | (2.875, 3.875, 4.875) |
| A41 | (4.375, 5.375, 6.375) | (3.375, 4.375, 5.375) | (3.750, 4.750, 5.750) | (3.000, 4.000, 5.000) |
| A42 | (3.875, 4.750, 5.750) | (3.000, 3.875, 4.875) | (3.625, 4.625, 5.625) | (2.500, 3.500, 4.500) |
| A43 | (5.250, 6.250, 7.125) | (4.250, 5.250, 6.250) | (2.750, 3.750, 4.750) | (3.125, 4.125, 5.125) |
| Aspiration level | (10, 10, 10) | (10, 10, 10) | (10, 10, 10) | (10, 10, 10) |
| Worst level | (0, 0, 0) | (0, 0, 0) | (0, 0, 0) | (0, 0, 0) |
Table 11.
Normalized fuzzy decision matrix .
| D1 | D2 | D3 | D4 | |
|---|---|---|---|---|
| A11 | (0.488, 0.588, 0.688) | (0.525, 0.625, 0.713) | (0.125, 0.200, 0.300) | (0.488, 0.588, 0.688) |
| A12 | (0.500, 0.600, 0.700) | (0.388, 0.488, 0.588) | (0.338, 0.425, 0.525) | (0.625, 0.725, 0.825) |
| A13 | (0.550, 0.650, 0.750) | (0.638, 0.738, 0.838) | (0.188, 0.275, 0.375) | (0.488, 0.588, 0.688) |
| A14 | (0.600, 0.700, 0.788) | (0.563, 0.663, 0.763) | (0.175, 0.263, 0.363) | (0.550, 0.650, 0.750) |
| A21 | (0.225, 0.300, 0.400) | (0.275, 0.375, 0.475) | (0.275, 0.375, 0.475) | (0.325, 0.425, 0.525) |
| A22 | (0.313, 0.400, 0.500) | (0.325, 0.425, 0.525) | (0.213, 0.313, 0.413) | (0.338, 0.438, 0.538) |
| A23 | (0.325, 0.400, 0.500) | (0.325, 0.425, 0.525) | (0.350, 0.450, 0.550) | (0.375, 0.475, 0.575) |
| A31 | (0.338, 0.425, 0.525) | (0.388, 0.475, 0.575) | (0.313, 0.400, 0.500) | (0.275, 0.375, 0.475) |
| A32 | (0.463, 0.563, 0.650) | (0.350, 0.450, 0.550) | (0.413, 0.513, 0.613) | (0.363, 0.463, 0.550) |
| A33 | (0.400, 0.500, 0.600) | (0.300, 0.400, 0.500) | (0.300, 0.400, 0.500) | (0.288, 0.388, 0.488) |
| A41 | (0.438, 0.538, 0.638) | (0.338, 0.438, 0.538) | (0.375, 0.475, 0.575) | (0.300, 0.400, 0.500) |
| A42 | (0.388, 0.475, 0.575) | (0.300, 0.388, 0.488) | (0.363, 0.463, 0.563) | (0.250, 0.350, 0.450) |
| A43 | (0.525, 0.625, 0.713) | (0.425, 0.525, 0.625 | (0.275, 0.375, 0.475) | (0.313, 0.413, 0.513) |
| Aspiration level | (1, 1, 1) | (1, 1, 1) | (1, 1, 1) | (1, 1, 1) |
| Worst level | (0, 0, 0) | (0, 0, 0) | (0, 0, 0) | (0, 0, 0) |
Table 12.
Weighted normalized fuzzy decision matrix .
| D1 | D2 | D3 | D4 | |
|---|---|---|---|---|
| A11 | (0.109, 0.131, 0.153) | (0.155, 0.185, 0.211) | (0.024, 0.039, 0.059) | (0.139, 0.168, 0.197) |
| A12 | (0.111, 0.134, 0.156) | (0.115, 0.144, 0.174) | (0.066, 0.083, 0.103) | (0.179, 0.207, 0.236) |
| A13 | (0.123, 0.145, 0.167) | (0.189, 0.218, 0.248) | (0.037, 0.054, 0.073) | (0.139, 0.168, 0.197) |
| A14 | (0.134, 0.156, 0.175) | (0.166, 0.196, 0.226) | (0.034, 0.051, 0.071) | (0.157, 0.186, 0.214) |
| A21 | (0.050, 0.067, 0.089) | (0.081, 0.111, 0.140) | (0.054, 0.073, 0.093) | (0.093, 0.122, 0.150) |
| A22 | (0.070, 0.089, 0.111) | (0.096, 0.126, 0.155) | (0.042, 0.061, 0.081) | (0.096, 0.125, 0.154) |
| A23 | (0.072, 0.089, 0.111) | (0.096, 0.126, 0.155) | (0.068, 0.088, 0.108) | (0.107, 0.136, 0.164) |
| A31 | (0.075, 0.095, 0.117) | (0.115, 0.140, 0.170) | (0.061, 0.078, 0.098) | (0.079, 0.107, 0.136) |
| A32 | (0.103, 0.125, 0.145) | (0.104, 0.133, 0.163) | (0.081, 0.100, 0.120) | (0.104, 0.132, 0.157) |
| A33 | (0.089, 0.111, 0.134) | (0.089, 0.118, 0.148) | (0.059, 0.078, 0.098) | (0.082, 0.111, 0.139) |
| A41 | (0.097, 0.120, 0.142) | (0.100, 0.129, 0.159) | (0.073, 0.093, 0.112) | (0.086, 0.114, 0.143) |
| A42 | (0.086, 0.106, 0.128) | (0.089, 0.115, 0.144) | (0.071, 0.090, 0.110) | (0.071, 0.100, 0.129) |
| A43 | (0.117, 0.139, 0.159) | (0.126, 0.155, 0.185) | (0.054, 0.073, 0.093) | (0.089, 0.118, 0.147) |
| Aspiration level | (0.223, 0.223, 0.223) | (0.071, 0.071, 0.071) | (0.031, 0.031, 0.031) | (0.066, 0.066, 0.066) |
| Worst level | (0.000, 0.000, 0.000) | (0.000, 0.000, 0.000) | (0.000, 0.000, 0.000) | (0.000, 0.000, 0.000) |
Table 13.
Results and rankings through a fuzzy modified TOPSIS-AL.
| di+ | di− | CCi | Rank | |
|---|---|---|---|---|
| A11 | 0.245 | 0.238 | 0.008 | 4 |
| A12 | 0.226 | 0.251 | 0.013 | 3 |
| A13 | 0.217 | 0.269 | 0.017 | 2 |
| A14 | 0.215 | 0.269 | 0.017 | 1 |
| A21 | 0.318 | 0.147 | −0.016 | 13 |
| A22 | 0.303 | 0.162 | −0.012 | 11 |
| A23 | 0.286 | 0.177 | −0.007 | 8 |
| A31 | 0.295 | 0.169 | −0.009 | 9 |
| A32 | 0.265 | 0.199 | −0.001 | 6 |
| A33 | 0.299 | 0.165 | −0.011 | 10 |
| A41 | 0.282 | 0.183 | −0.005 | 7 |
| A42 | 0.305 | 0.161 | −0.012 | 12 |
| A43 | 0.267 | 0.204 | 0.000 | 5 |
| Aspiration level | 0 | 1 | 0.075 | |
| Worst level | 1 | 0 | −0.057 |
Publisher’s Note: MDPI stays neutral with regard to jurisdictional claims in published maps and institutional affiliations. |
© 2022 by the authors. Licensee MDPI, Basel, Switzerland. This article is an open access article distributed under the terms and conditions of the Creative Commons Attribution (CC BY) license (https://creativecommons.org/licenses/by/4.0/).
Share and Cite
MDPI and ACS Style
Shen, S.-P.; Tsai, J.-F. Evaluating the Sustainable Development of the Semiconductor Industry Using BWM and Fuzzy TOPSIS. Sustainability 2022, 14, 10693. https://0-doi-org.brum.beds.ac.uk/10.3390/su141710693
AMA Style
Shen S-P, Tsai J-F. Evaluating the Sustainable Development of the Semiconductor Industry Using BWM and Fuzzy TOPSIS. Sustainability. 2022; 14(17):10693. https://0-doi-org.brum.beds.ac.uk/10.3390/su141710693
Chicago/Turabian StyleShen, Shih-Ping, and Jung-Fa Tsai. 2022. "Evaluating the Sustainable Development of the Semiconductor Industry Using BWM and Fuzzy TOPSIS" Sustainability 14, no. 17: 10693. https://0-doi-org.brum.beds.ac.uk/10.3390/su141710693
Note that from the first issue of 2016, this journal uses article numbers instead of page numbers. See further details here.