1. Introduction
The COVID-19 pandemic has changed people’s lives in many ways. It not only affected issues related to social relations, but also significantly altered the functioning of the economy. Many indicators related to economics, finance, or social interactions were severely disrupted by the outbreak of the pandemic [
1]. This resulted in a growing wave of uncertainty about the behavior of markets [
2]. All this has confirmed that COVID-19, since its emergence, has become the worst problem of this century [
3]. Various types of measures implemented by the authorities of many countries are among the elements of controlling the negative effects of the pandemic. These actions are aimed at providing positive incentives to stabilize the financial sector, but they have nevertheless changed the entire paradigm of global economic interactions [
4]. These changes, as well as emerging inflationary pressures, have forced many players to seek new instruments to diversify their investment portfolios. Tools for investing in the art market are among these instruments. The art market, after initial declines in turnover, closed at
$347 billion in 2020 and was expected to reach
$405 billion in 2021 (with projections of
$553 billion in 2025) [
5]. The initial declines were influenced by blockades and closures of public spaces [
6], social distancing measures to limit people’s interactions [
7], as well as restrictions on cross-border activities [
8]. However, these obstacles have resulted in attempts to adapt the art market by introducing new mechanisms of functioning, e.g., by moving auctions online, as well as sealed bid auctions (where orders are delivered by phone, for example); thus, the market share of new auction mechanisms has increased by at least several times [
9]. The currently available literature attempts to describe global changes in this market [
10,
11], as well as local changes (e.g., in Australia [
12], Belgium [
13], United Arab Emirates [
14], Spain/Portugal/Brazil [
15]). The changes described in the indicated literature often point to (as mentioned earlier in the article) the flexibility of transforming one form of sales (traditional sales) to another (online sales), as well as the potential for increased turnover that provides opportunities for investment success. However, there are also articles indicating that the transformation of the form of sales will not change the long-term trend of returns on investment in the art market [
16].
The most frequently described segment of the art market in the literature is the market for paintings (for example, [
17,
18]). Of course, it should not be forgotten that the literature also covers other market segments, such as stamps [
19], coins [
20], or even wine [
21]. Analyses of these market segments, however, are not very recent and do not take into account the impact of COVID-19. To the authors’ knowledge, this article significantly bridges the gap regarding the rare books market. Moreover, this study not only shows how the mentioned market segment is shaping up—it aims to verify the hypothesis that the COVID-19 pandemic has not changed the revenues generated in the market in the long term, but has created a kind of a speculative bubble. It should be added that the very concept of rare books is discussed in the literature (for example, [
22,
23,
24,
25]). Furthermore, the issue of investments in the rare books market has been subject to research for many years, and often in relation to specific categories of books—e.g., economic, medical, comic books, etc. (for example, [
26,
27,
28,
29,
30,
31,
32,
33,
34,
35]).
Rare books, collecting them, and treating them as a form of investment are characterized by specificity and differ from the branches of the art market that record the highest turnover, i.e., painting or sculpture markets. Many factors can affect the value of a book. Taking into account the guidelines presented in [
36], the term “rare book” is used to describe a book according to one or any combination of the following criteria: market value, rarity and scarcity, date and place of publication, physical and internal characteristics, bibliographic and research value (historical, cultural, or intellectual interest), and condition. In the case of books, there are many editions with very different numbers of copies, and the value of an individual copy can be determined by the smallest details, which can often only be observed by eye. This market characteristic also means that there is a dense network of collectors and antiquarian bookstores, and traveling to familiarize yourself with the characteristics of the items is very important. James Gannon, Director of Rare Books at Heritage Auctions, said [
37] that the pandemic has led to the closure of many antique shops with rare books and the transfer of activities to the online space. The Internet has made many books that were once rare now seem common—especially for non-top books. The market for rare books in Poland also has its own characteristics. There are surprises lurking for sellers and buyers. After the Second World War, numerous private collections and public book collections were dispersed as a result of the regime change and border changes. Books to which former owners lay claim are coming into trade [
38].
1.1. Sustainability and the Rare Books Market
Investing in art is often far more than just investing capital. The term “priceless” is used for many works of art because their value is estimated on so many levels, and they are elements that shape our culture.
Culture, regardless of its definition, is the basis for understanding the relationship between economic, environmental, and social issues. It was named the fourth pillar of sustainable development by J. Hawkes [
39], and in 2013, the UNESCO declaration was adopted, in which culture was pronounced a key strategy for the implementation of sustainable development [
40]. In this document, culture is considered the basis of socioeconomic well-being, but at the same time the lack of definitiveness of this concept leads to difficulties in implementing culture in sustainable development policies, in specific development strategies at the global, regional, or local level. Manuscripts, miniatures, and early printed books are a unique part of cultural heritage. They help us understand who we are and how we fit into our historical context. New and ecological art forms are an indispensable part of the sustainable development policy. This does not mean, however, that old works of art have no place in it. They are an indispensable source of descriptions of nature over the centuries in the form of prose, diaries, poetry, or graphics, which allow us to look back at the world in the context of climate change and the devastated environment of the 21st century [
41].
The importance of sustainable development for the global art market is also noticed by major market players. Charles Stewart, CEO of Sotheby’s, and his team developed eight predictions [
42] for their environment based on pandemic experiences. According to one of them, the art market is to continue to develop initiatives related to sustainable development and reducing the carbon footprint. According to Stewart’s team, in the near future, more and more entities will certainly strive to eliminate printed catalogs, invitations, reduce excess packaging in transport, etc. Certainly, a greater emphasis on ecology and social concerns related to the climate crisis will also be reflected in art itself.
1.2. The Problem of Market Bubbles
The concept of a bubble is very often defined as large-scale trading of a given asset class at prices far above its intrinsic value [
43]. Thus, for example, a mere increase in prices is not necessarily an indicator of a bubble. In the case of art markets, however, this concept is more difficult to analyze than in the case of classical financial markets. Bubbles in the art market are unique in that they can appear in the absence of much uncertainty or innovation and need not be driven by excessive credit or leverage [
44,
45]. What is more, bubbles, with a delay, can be fueled by a boom that occurs in another—sometimes difficult to identify—market (as was the case in the 1990s in Japan when the bubble in the art market burst after the collapse of the real estate market, which caused losses among wealthy investors) [
46]. Referring to the aforementioned definition of a bubble, the following limitations in detecting bubble formation should be pointed out in the art market: (i) large quantities of objects must be traded; (ii) the increase must be followed by a sharp collapse; (iii) prices must be above the items’ fundamental value [
47]. While the limitations of the first and second issues can be overcome by having access to an adequately large and time-wide database, the third is quite a fundamental problem. Determining the fundamental value of a work of art is very difficult in itself. Of course, in the literature, you can find items (e.g., [
48,
49,
50]) showing how to try to do this (based on, e.g., production costs, size and type of work, buyer’s income, measure of aesthetic quality, measure of the artist’s attributes, etc.), but the research often concerns the painting market. Unfortunately, if we want to do the same in the case of the rare books market in Poland, we encounter a barrier to the lack of access to detailed data. Another attempt to determine the fundamental value assumes that it is the private value of the good for the person who last auctioned the work. Accordingly, a bubble corresponds to a market in which players are willing to pay more than their perception of private value because they expect the later resale to be even more expensive [
51]. In order to avoid identifying fundamental values, for example, the literature on the subject has proposed a solution based on the augmented Dickey–Fuller test (ADF), which can detect explosive behavior directly in the market time series (e.g., [
47,
52,
53]). In addition to the ADF test or its modifications (SADF, etc.), there have been attempts to identify a bubble in the art market by analyzing absolute values (e.g., several tens of percent price increases and subsequent sharp declines to the initial price level tend to indicate the existence of a bubble [
51]). The literature has also pointed out that an important indicator of an emerging bubble is an increase in the volume of goods offered, only to be followed by a sharp price boom [
51]. Evidently, price booms coincide with periods of strong demand for art (which may be caused, for example, by the need to diversify one’s portfolio), but they are usually followed by predictable collapses [
54]. The literature has also pointed out that an important determinant of an emerging bubble is the increase in the volume of goods offered, followed by a sharp price boom [
51]. Clearly, price booms coincide with periods of strong demand for art (which may be caused by the need to diversify the portfolio), but they are usually followed by predictable collapses [
54]. The available literature on detecting bubbles in the art market is not extensive; it has been created for over a dozen years and concerns the painting market. It is worth adding that from the Polish point of view, the possibility of creating and thus detecting bubbles actually applies to the period of the last 33 years (from 1989—from the time of political transformation and introduction of the market economy). Taking into account this objection to the time horizon, the literature only provides data on a few bubbles: around 1990, 2008, and 2011 [
47,
54]; 1990 [
51]; a few small bubbles in 2002—2005 and the period around 2011 [
53]. The rare books available on the market and other recommendations outlined above (e.g., an increase in the volume of items on offer prior to price increases) have also been verified.
3. Results
As mentioned earlier, descriptive measures were used at the beginning. It should be mentioned that the amounts are presented in euros, although the data were in Polish currency. As a result, in other parts of the work, rounding of values may appear in some cells.
Considering absolute values,
Table 1 shows that the highest revenues were generated in the pandemic half-year of 2021 (2021H1—1,042,318.94 euros). Moreover, the observed revenues of the two earlier periods (2020H1 and 2020H2) indicate increasing revenues. In contrast, the two later periods (2021H2 and 2022H1) illustrate declines. The effect of highlighting this half-year is, therefore, particularly significant. It is difficult to make similar conclusions for the other absolute values presented in the table (such as the number of items offered or the number of items sold). Interesting statements can be based on the analysis of single-basis indices. For the individual single-basis indices (half-year to half-year), the results are shown in the chart below.
In
Chart 1, seasonal effect can be clearly observed—after increases in the value of the index in the first half of a given year, we observed a decrease in the second half of the year. Nevertheless, in one case (2020H2), the index values, despite the decrease in value relative to the previous period, still exceeded 100%. Thus, only for this half-year, all the parameters analyzed in the chart (revenue, number of items offered and sold) reached higher absolute values than in the theoretically “better” first half-year. Once again, the pandemic half-year proved to be exceptional in this case.
The data look a little different when considering single-basis chain indices (2018H1 basis). The effects are shown in the chart below (
Chart 2).
Furthermore, in the case of the analyzed chart, seasonal effect can be observed. Nevertheless, it can be seen that the specific parameters (in the context of specific index values) began to grow quite significantly from 2020H1 (the beginning of the pandemic) and collapsed in 2021H2. This collapse can be observed in relation to revenues in 2022H1 as well. However, a rebound is observed for the volume of both items offered and sold. The latter effect, however, was difficult to assess at this stage of the analysis.
It is worth noting here the medium-term growth rate (
Table 1, last row). Despite the rather evident effect of the pandemic’s impact on the analyzed parameters (increases), the growth rate was flat over the studied period (2018–2022). For all the three parameters (revenues, items offered, and items sold), it did not exceed 1.7%. Moreover, considering the ratio of the items bought to the items sold, as well as the average revenue to the items sold, included in
Table 1, their medium-term growth rate was almost exactly 0%.
Due to the previously observed seasonality, the authors decided to conduct an additional analysis in the context of annual changes. This allowed excluding the mentioned seasonality effect in a simple way. Nevertheless, such an action involved the need to forecast data for 2022H2 (the ratio of the first half-year to the second half-year for the previous years was used for this purpose—the obtained value was multiplied by the data from 2022H1). The results obtained are shown in the
Table 2.
A chart showing the absolute data on the revenue and the number of items offered and sold, as well as the average revenue per item sold and the ratio of the items sold to the items offered, is presented below (
Chart 3 based on
Table 2). Due to the fact that the data were not denominated in the same units, normalization was performed (the “Normalize” function of MS Excel was used).
The results are quite clear. All the parameters shown in the chart reached their maxima in the pandemic years of 2020 and 2021. Interestingly, 2020 marked the peak for the number of items sold and offered, and the peak associated with revenue shifted to 2021, while 2022 is characterized by a marked decline relative to each parameter.
A slightly different perspective on the data obtained was provided by an analysis based on individual single-basis indices (year to year). The effects are shown in
Chart 4.
The data no longer look so clear. The chart shows that index values increased in 2019 and 2020 and fell in the subsequent years. It should be noted, however, that, usually, the fluctuations in index values for 2018, 2019, 2021, and 2022 were relatively small and did not exceed 5%. This did not apply to revenue, which recorded large increases in 2020 and 2021 and fell sharply in 2022. Furthermore, the number of items sold in 2020 increased by more than 10% and was characterized by insignificant fluctuation in the remaining years. However, when considering the medium-term growth rate (
Table 2, last row), we come to the conclusions similar to the ones for the half-yearly data, where changes (although slightly higher) did not exceed 3%.
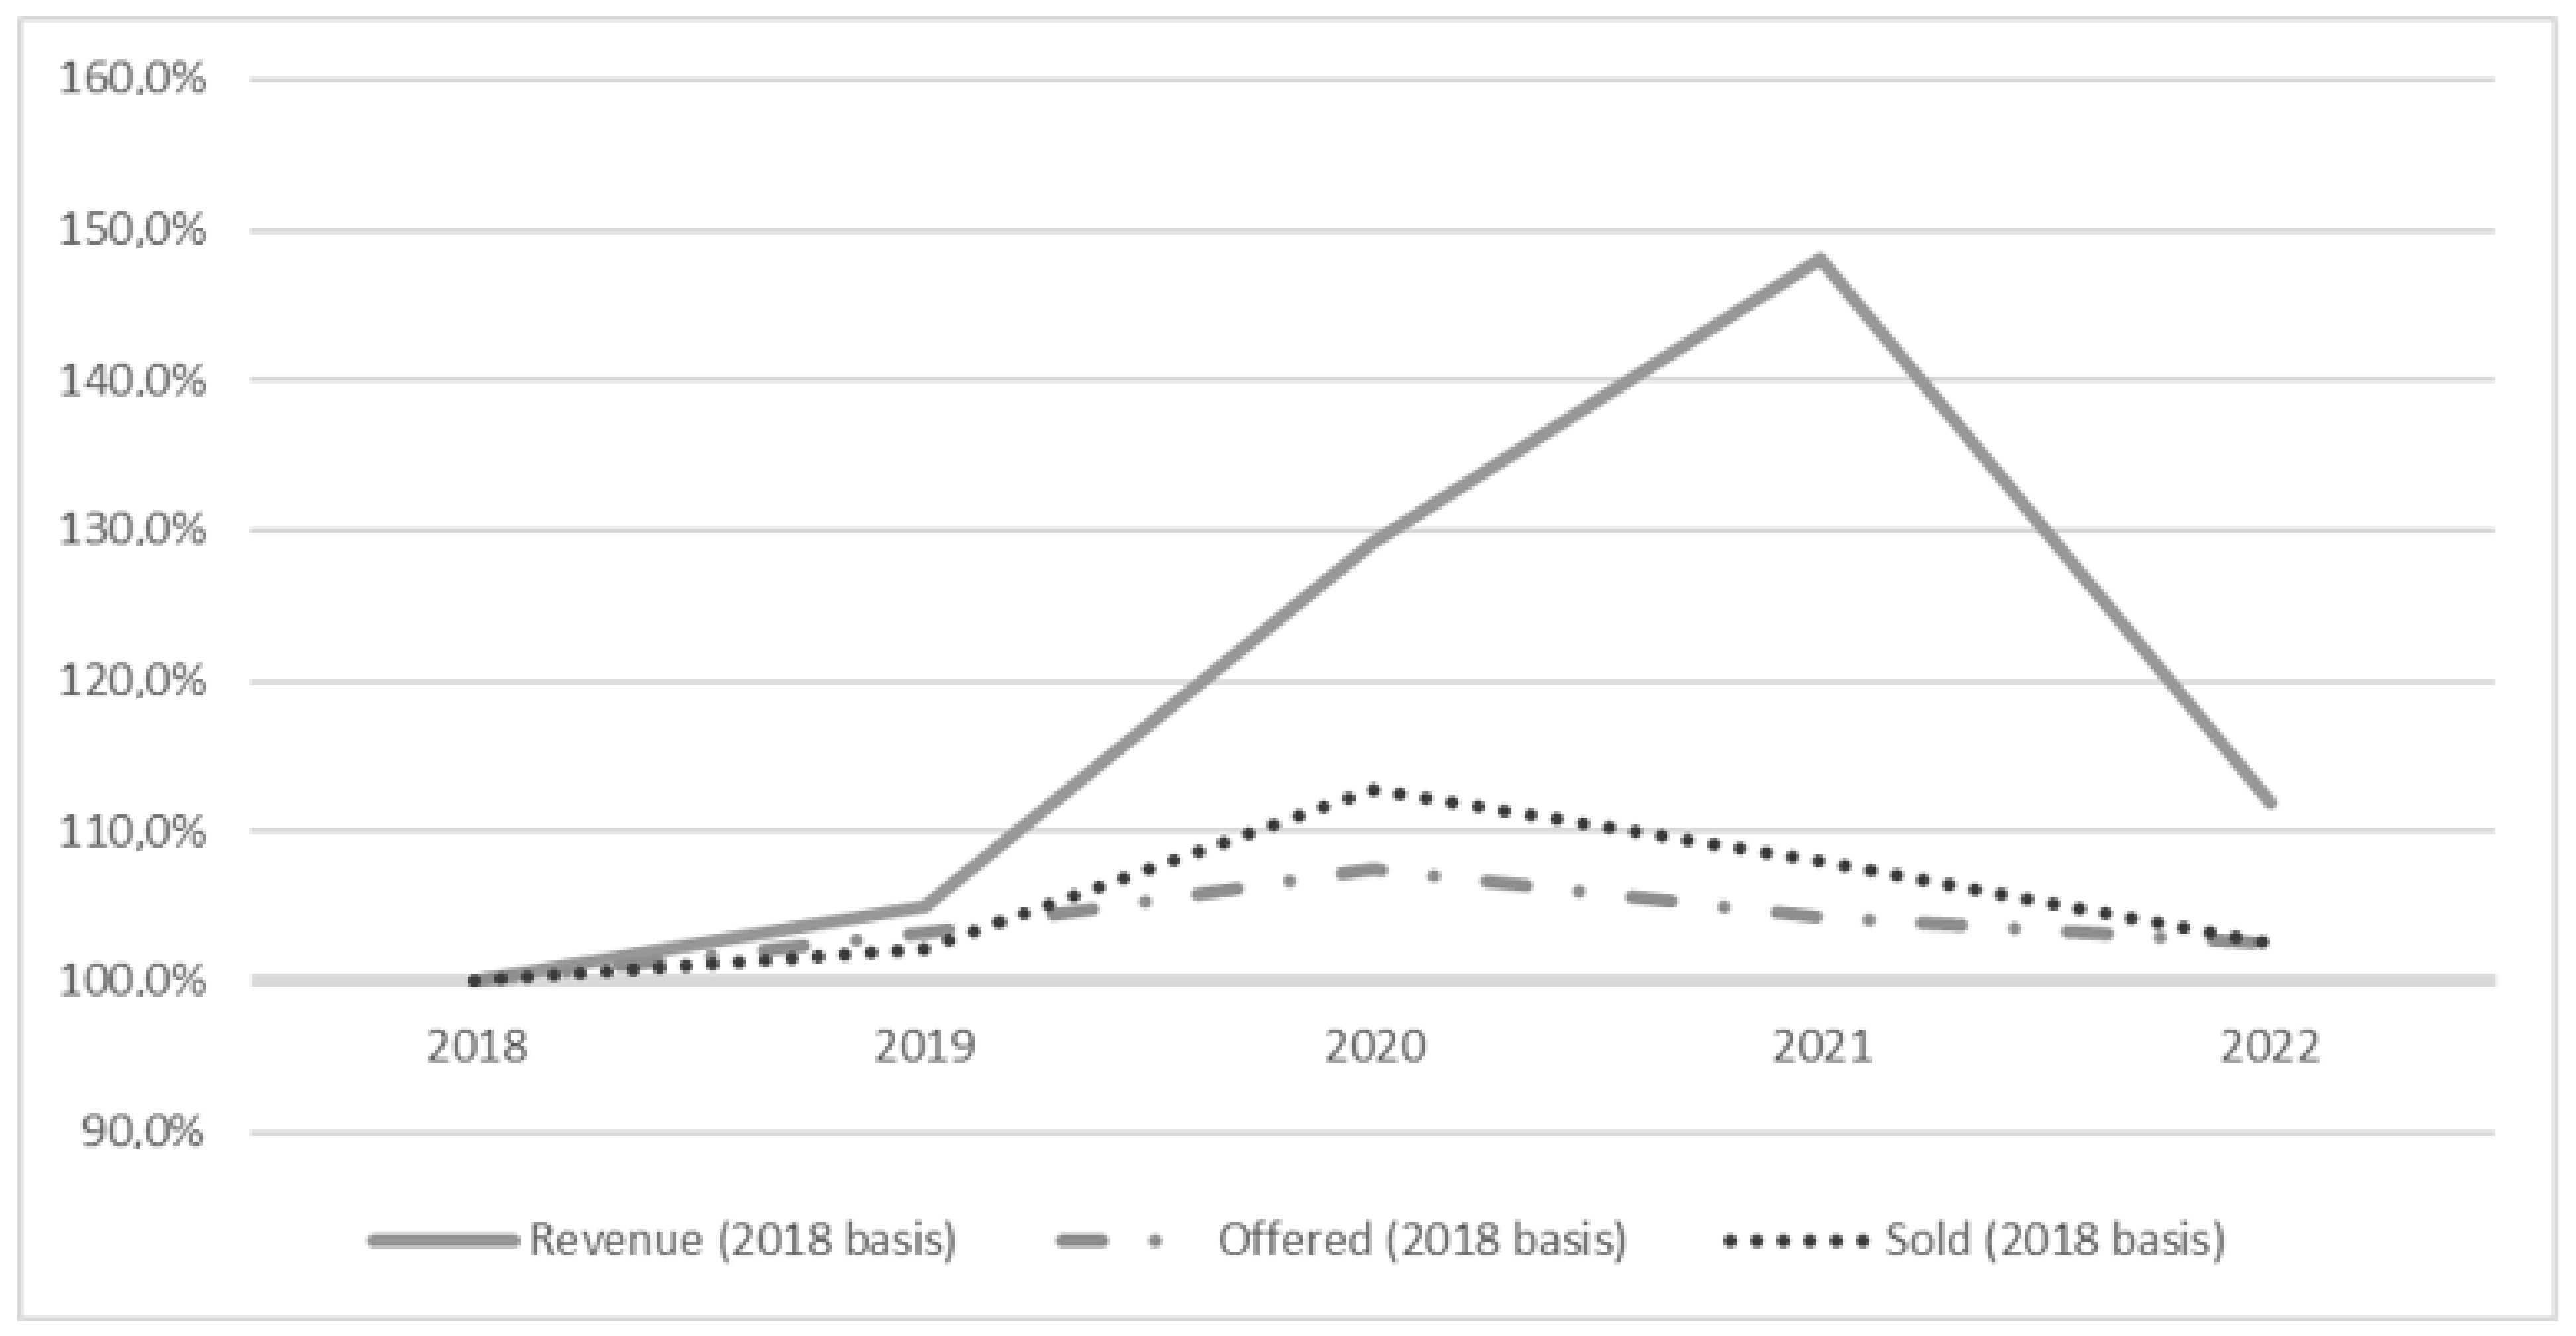
Similar conclusions can be reached by analyzing the values of the single-basis chain indices shown in
Chart 5.
In the case of this chart, again, the most noticeable is the effect of the increase in revenue in 2021, which was nearly 50% higher than in the base year of 2018. We can also see a huge drop in revenue in 2022. Nevertheless, it is worth noting that none of the analyzed parameters was lower in 2022 than in 2018 (none of the indices fell below 100%).
Analysis of rare books in terms of classifying them into a specific set (e.g., period of publication, subject, selling price) can also provide interesting conclusions. Due to the way the data were aggregated, this aggregation was possible from the point of view of the selling price. This task was based on the groups defined by the largest antiquarian house in Poland. Four groups were distinguished: low-value books (up to 99 euros), medium-value books (from 100 to 999 euros), high-value books (from 1000 euros to 9999 euros), and the most expensive books (from 10,000 euros). Aggregating the data, an average was drawn from the results obtained for each auction held by each auction house. For a simpler analysis, the data are presented on an annual basis (
Table 3), where the shares of quantity and volume of books sold in specific price categories are included.
A chart showing the share of the quantity of items sold is shown below (
Chart 6):
Analyzing the number of items sold in each category, it can be seen that the cheapest and mid-priced items predominated (they always had an approximately 95% share of the total number of books sold). The most expensive books, with a selling price of more than 10,000 euros, appeared incidentally—at most, a few copies in a given year. There was also a lack of extremely expensive items with a price clearly exceeding, for example, 100,000 euros. Such a price is reached, for example, by copies of the first three editions of the work of the Polish astronomer Nicolaus Copernicus “De revolutionibus orbium coelestium” (the estimated worldwide price is about million euros [
63]); unfortunately, very valuable books were lost in Poland, for example, due to the destruction and looting of war. At first glance, it is not possible to notice significant differences in the relation to the number of items sold in specific groups in subsequent years (although this does not apply to the category of the most expensive items, which is discussed later). Admittedly, the number of low-cost books in the total number of items sold generally decreased—and this was associated with increases in other groups. A change in this subtle trend can be seen in 2022. However, we find it difficult to link the described effect to the COVID-19 epidemic, if only because it has been observed since 2019.
A chart of the volume of items sold is shown in
Chart 7.
A somewhat different conclusion was reached by analyzing the volume of sales by category. It was difficult to clearly define the observed differences for the middle categories, but a rather significant effect could be observed (relative to the pandemic years) for the category of the most expensive items. The share for this category increased from about 2% in 2018–2019 to more than 5.5% in 2020 and more than 15.5% in 2021, while 2022 saw a marked decline—roughly to the level of the pre-pandemic years (2.42%). Interestingly, in 2021, the volume of sales of the most expensive items exceeded the volume obtained for the cheapest items (the difference was 1%). It is worth noting that in 2019 and 2022, it was about 18–19%, but in favor of the cheapest items. Of course, the increase in the volume of sales of the most expensive items could be associated with an increase in their sales amount (in 2020, the share increased from 0.06% to 0.15%, in 2021—to 0.27%). Nevertheless, the increase in value far exceeded the increase in volume. The offering of the most expensive items and the perceived willingness to purchase them once again draw attention to the unique period of pandemic years in the rare books market.
The authors decided that the conclusions based on descriptive measures should also be checked on the basis of statistical inference.
Initially, the authors checked whether the variables revenue and the number of items sold and offered were explosive in nature, which would indicate the emergence of a bubble. For this purpose, the ADF test was used. The calculations were performed in IBM SPSS Statistics v.27 using the R Essentials addon. The calculations made using semiannual data for the period 2018–2022 were inconclusive (the
p-value was slightly above the required threshold). Conclusive results were obtained for the 2019–2022 data (
Table 4).
Based on the results of the test, it can be noted that during the period under review, the time series on revenues showed an explosive nature, which may confirm the existence of a bubble in the market. Nonetheless, it should also be noted that this could not be confirmed for such a series on the volume of items offered as well as sold.
In the next step, the authors took into account the WDPI indicator. The WPDI value was considered as an independent parameter in the study. This indicator is reported on a quarterly basis, so for semiannual data, the factor was modified by taking out the arithmetic average of the quarters. In addition, an artificial variable called “the pandemic” was introduced. This variable took the value of 1 in the periods considered pandemic (based on the WPDI index) and 0 in other periods. Due to the fact that the distribution of the parameters analyzed in the article may raise doubts about conformity to normal distribution, nonparametric tests were used. Initially, the Mann–Whitney test was used as the strongest nonparametric alternative to Student’s
t-test for independent samples [
61]. The calculations were performed in IBM SPSS Statistics v.27. The variable pandemic was used as a grouping variable. A pair of hypotheses was defined as follows:
Hypothesis 0 (H0). The distribution of the parameter under study is the same for the pandemic category.
As a result of the calculations for semiannual data,
Table 5 was obtained.
As we can see in the table above for three parameters, the results obtained indicated the influence of the pandemic factor. This is the case, of course, of the parameter WPDI. In addition, we can find the effect of the pandemic in the context of revenue (significance = 0.032) and the ratio of the revenue to the number of items sold (significance = 0.016). The results obtained convinced authors to check the strength of the relationship between the factors. We mainly used the Pearson coefficient, which is the main measure when testing the linear relationship between parameters. However, due to the fact that the use of the Pearson coefficient is subject to certain conditions of applicability, the Kendall Tau-b coefficient, which is less restrictive in its application, was used to confirm the relationship. The results from the point of view of the WPDI parameter and the pandemic are shown in the table below (
Table 6).
The Pearson correlation coefficient proved statistically significant in the following pairs of parameters: WPDI–revenue (significance = 0.026), pandemic–revenue (significance = 0.020), and WPDI–pandemic (significance = 0.000). The last correlation is obvious. On the other hand, the first and second correlations indicate a statistically significant relationship between the revenue received in each six-month period and the occurrence of the pandemic. Such a relationship is positive: with an increase in pandemic concerns (WPDI indicator), there was an increase in the revenue obtained at auctions. The strength of this relationship was quite strong, in both cases exceeding the value of 0.73. The Kendall Tau-b coefficient confirmed the above conclusions, but it should be noted that in the case of the WPDI–revenue pair, the significance level exceeded 0.05, but was less than 0.1 (which can be considered acceptable and confirms the statistical trend [
64]). It is worth noting that it was not possible to confirm statistical significance between the appearance of the pandemic and the numbers of items offered or sold. Nevertheless, this probably resulted from the seasonality factor mentioned earlier. Therefore, the Pearson coefficient was calculated for annual data, taking into account the forecast for the second half of 2022. The data are shown in the table below (
Table 7).
In the case of annual data, the relationship between the pandemic and the revenue was, again, statistically significant (significance = 0.029) (although the WPDI index itself only showed a statistical trend in relation to revenue; significance = 0.074). The strength of the relationship was quite strong, oscillating around 0.9. The authors expected that once seasonality was excluded, the relationships between the pandemic and the numbers of items offered and sold would prove statistically significant. Indeed, this was the case in relation to the quantity of items sold (WPDI–sold, significance = 0.020; pandemic–sold, significance = 0.029), where the strength of the relationship was even greater than in the case of revenue (a value above 0.9). It was a bit different for the number of items offered, where, although the WPDI–offered pair showed a statistical trend (significance = 0.070), the pandemic–offered pair had already turned out to be minimally statistically insignificant (significance = 0.103).
The high value of the Pearson coefficient encouraged the authors to build a model capable of reflecting revenue depending on the level of the WPDI index. An OLS-based (ordinary least squares) model was used (even using such relatively simple methods for microdata can often yield acceptable results [
65]). Due to the small amount of data for annual observations, the authors decided to include only semiannual data. The result obtained is shown in
Table 8.
At this point, it should be further noted that in the case of art markets, studies very often use modifications of the classical linear regression—the so-called hedonic regression (HR), often using semi-logistic transformations. The first articles based on this method appeared even before World War II [
66], and the annual number of publications is estimated at several hundred pieces indexed in important databases—such as Web of Science [
67]. In this method, the value of a studied good is determined by the subtotals of the utility of its individual characteristics [
68]. However, in the case of the current article, the features of a given product were not analyzed (in the case of rare prints, this could be, for example, the period of publication, type of binding, subject matter, author), and the focus was on the impact of an external factor—i.e., the emergence of the pandemic. This approach was determined by the range of data that were available for use. In addition to building a basic hedonic model, the repeat sales regression (RSR) method is often found [
69]. RSR “explicitly controls for differences in quality between works by only considering items that have been sold at least twice” [
70]. As can be seen, the method can be applied to, for example, specific rare books sold more than once during the time period under study. In the case of the article presented here, the aggregate data did not warrant its application. All this determined the choice of the primary method.
The obtained model is formally correct (significant value in the ANOVA test as well as for individual independent parameters). The model achieved an intermediate R
2 coefficient value (the model explained about 53% of the variation in the dependent variable revenue). The most interesting finding was the value of the WPDI coefficient (which was 797.71). This meant that, theoretically, any change (by a unit) in the value of the indicator results in an increase (or corresponding decrease) in the annual auction revenue of 797.71 euros. Reading the maximum value of the indicator (which occurred in 2020H2)—309.36—it can be assumed that if the pandemic did not occur during this period, the revenues would have been lower by 246,779.57 euros. Thus, according to the model, without the impact of the pandemic, the revenue would have been 29.55% less. In an attempt to check the effectiveness of the model, the actual data obtained for 2018–2021 (the forecast for the second half of 2022 was no longer included) were compared to the data calculated using the model. The results are shown in the table below (
Table 9).
Based on the table above, we can conclude that the model shows the revenue well for 2018–2019 (the differences did not exceed 5%). It performs worse with the pandemic years where it clearly overestimated the result in 2020 and underestimated it in 2021. Nevertheless, if we take into account the sum of the pandemic and other years, the differences become negligible (not exceeding 2%). Of course, we must keep in mind that this rather simple model is not meant to present the exact values. The model was only meant to supplement the previously presented findings.
4. Discussion and Final Remarks
The data and the conclusions obtained and presented above confirm the hypothesis posed in the paper. Identification of a bubble can formally be supported by three basic facts which are consistent with the assumptions described in the section of the article relating to the concept of a bubble (cl. 1.2): (i) the explosive nature of the revenue data (based on the ADF test—
Table 4); (ii) the several tens of percent increase in sales revenue during the pandemic period and the marked decline in the following period to the pre-pandemic levels (best seen in
Chart 5); (iii) the observed effect of an increase in the number of items on the market preceding the jump in revenue (2020 and 2021—best seen in
Chart 3).
COVID-19 seems to have affected the creation of a specific investment bubble in the Polish rare books market. The effect of this bubble could be seen most strongly in the market revenue, which rose rapidly by an average of 40% in the pandemic years (compared to 2018), only to collapse quite sharply in the first half of 2022. Changes in the market could also be seen in the increased number of items sold (an increase of about 10% on average was recorded in the pandemic years). To a lesser extent, this was seen in the number of items appearing on the market (nevertheless, in this case, the increases also exceeded 5% on average). Interestingly, the more dynamic growth in the number of items offered and sold on the market (2020) preceded the more dynamic growth in the revenues received (2021). As a result, the highest ratio of the revenue to the items sold was observed in 2021 (an average of 248.54 euros versus 181.49 euros in 2018). The ratio fell below 200 euros in 2022. Static inference based on the Mann–Whitney test, the correlation coefficient, as well as the simple linear regression model, confirmed these conclusions. A relatively strong connection was found between people’s fears about the pandemic (WPDI coefficient) and an increase in both revenue (the strength of the relationship based on the Pearson coefficient was between 0.73 for the six-month data and 0.841 for the annual data) and the number of items sold (Pearson coefficient of 0.935 for the annual data) as well as offered (Pearson coefficient of 0.848 for the annual data) on the market. A simple linear regression model allowed the WPDI measure to be linked to expected revenue. This allowed us to confirm the fact of revenue growth in pandemic years.
Despite such relatively good results obtained in the quantitative context, attention should be drawn to qualitative problems. The first category of problems was the seasonality effect, where especially such parameters as the number of items sold and offered differed in the context of the first and second halves of the year. This problem was solved by taking into account annual data; unfortunately, this involved forecasting sales for the second half of 2022, as well as a reduced number of observations (only five). The second and, arguably, more important category of problems was how specifically the pandemic period caused the mentioned investment bubble. At least two hypotheses can be put forward here, the testing of which would require different data. The first hypothesis assumes that only turbulence and uncertainty in other markets convinced people to invest more in the art market (and, therefore, in the rare books market, too) and that the end of the pandemic will restore old investment preferences. The second hypothesis states that the transition of auctions in the rare books market to the virtual space caused new investors to enter the market. It is difficult to provide answers to these two important issues in this article. Nevertheless, the opinions appearing in the Polish trade press lead to certain conclusions. The beginning of the epidemic (2020) surprised the Polish rare books market very positively—the experts agreed that “never before had the market been so strong and so strongly rising” [
71]. The main explanation given for this phenomenon was the entry of “young energetic investors under the age of 40” into the market [
9], and this, in turn, was made possible by the shift from stationary to online auctions [
72]. Could the described situations have suggested only increases and simply an expansion of the market (which, however, does not seem to have happened as indicated by the analyses performed in this article)? The answer to this question intuitively seemed negative. It is true that the market initially surprised the specialists by the fact that the increase in offered products was not followed by a decrease in prices, but the answer to this apparent paradox was the participation in auctions of new inexperienced investors who did not know the realities of the market [
73]. The price they were expected to pay for their inexperience constituted the declines shown in the article [
73]. However, other experts’ predictions may also be interesting—dwindling supply may be responsible for the drop in sales (rare books cannot be produced—although this may encourage dishonest players to introduce counterfeits, which the Polish market has not yet experienced in general). The solution may also lie in finding new niches in the market, which can already be slowly observed in the case of books of the socialist realism period (which was previously rejected in Poland due to bad political connotations). The question is, how long will this niche be appreciated? Undoubtedly, finding answers to these questions could be a very desirable direction for future research.
However, there remain other issues that are difficult to verify at this point. It is unclear whether the COVID-19 pandemic is actually dying out (as assumed in 2022H1), and it is also unclear what impact the ongoing war in Ukraine and the related economic crisis have and will have on the market. Both of these factors can completely change the issues considered in this section.


 ,
, 


