


The Impact of Digital Transformation on Supply Chain Procurement for Creating Competitive Advantage: An Empirical Study


Business Administration Department, Faculty of Economics and Administration, King Abdulaziz University, Jeddah 22254, Saudi Arabia
*
Author to whom correspondence should be addressed.
Sustainability 2022, 14(19), 12269; https://0-doi-org.brum.beds.ac.uk/10.3390/su141912269
Submission received: 14 August 2022
/
Revised: 21 September 2022
/
Accepted: 23 September 2022
/
Published: 27 September 2022
(This article belongs to the Special Issue Sustainable Supply Chain and Logistics Management in a Digital Age)
Abstract
:This study examined the impact of digital transformation (DT) on supply chain procurement (SCP) for the creation of competitive advantage (CAD). This study adopted a quantitative approach using a survey administered to 221 supply chain (SC) professionals through the professional networking website LinkedIn. The conceptual model was evaluated with the partial least squares-based structural equation model (PLS-SEM) using SmartPLS. The findings showed that DT has significant positive impacts on SCP and CAD, and that SCP has a significant positive impact on CAD. Supply chain procurement plays a significant mediating role in the relationship between DT and CAD. The findings are useful for decision-makers investing in digitally modernising their SC processes. The study recommends starting the DT of an SC with procurement, as procurement is a complex process involving a wide range of internal and external stakeholders. The results show that digital procurement may be an SC game changer in a competitive market. The study provides initial guidelines for a transition from traditional to smart procurement (procurement 4.0). Despite the prevalence of studies on SCP, there is a lack of empirical evidence on how DT of procurement functions can lead to sustainable CAD.
1. Introduction
Supply chains (SCs) have been transformed and reformed in the digital era. The COVID-19 pandemic accelerated these changes globally. The need to accelerate digital transformation (DT) has emerged as a top priority. Digital transformation involves more than technology, which is considered a driver and enabler of DT in itself [1,2,3,4]. Although there are no unified and standard definitions of DT [2,5], it includes the development of employees’ capabilities; changes in the management, mindset, and organisational structure; leadership empowerment; cultural considerations; values; business strategies; process and development issues; customer journeys; and experience, in addition to considerations of technology as a driver and enabler for organisational business models [2,3,4]. The distinct arrangement, utilisation, and mixture of such elements differ based on each organisation’s nature and business [3]. The application of technology is not transformational unless it impacts the entire organisation’s strategy, system, culture, mindset, and community and drives the evolution of the entire business model [6,7,8,9].
Competition among organisations has begun to focus on business, services, and products. Supply chain competition among organisations is therefore on the rise. SCs are key factors in providing sustainable competitive advantage (CAD). Following the outbreak of COVID-19, which affected the entire world, SCs were reshaped and redefined. Organisations with SC resilience in addressing such crises gained greater CAD [10,11,12,13]. Digital transformation plays a vital role in purchasing and procurement and is therefore a valuable resource, including features such as warehouse automation, robotics delivery, e-commerce enablement, networking, transportation, and the formation of industry 4.0, which is therefore a valuable resource [14]. Securing supplies at the right cost and quality and establishing long-term partnerships with suppliers provides a sustainable advantage. Digitising procurement functions is important as it enables the management of different parties, which involves huge amounts of data and information [15]. Digitisation requires human and system-wide technology capabilities [16,17], aside from internal and external capacities; however, it can help companies gain the best outcomes, as it can guide them towards reducing cost, time, and efforts and increasing productivity, efficiency, and quality [15].
Competitive advantage distinguishes an organisation from others in the long term. It must be advanced and sustained. Revamping procurement through DT can provide a company with sustainable CAD in the market by merging technologies with other resources. Organisations that focus on their core CAD in procurement can achieve remarkable success, as today’s business competitions are not limited to business; in fact, firms compete nowadays in their supply chain practices, including procurement. About 70% of DT projects do not achieve their objectives, which is a major concern for leaders, as such a high percentage represents a degenerative amount of USD 900 billion [3]. Although studies have examined the influence of technology on SCs, there is a lack of research on the impact of DT on SC procurement (SCP) to create CAD [18,19]. This study employs resource-based and capability theories, which derive from accessibility to expertise, aiming for increased business performance [20] and long-term CAD. Organisations with valuable, unique, hard-to-replicate, and irreplaceable resources can craft value-creating strategies that are difficult for competitors to replicate [14,21,22]. This can help organisations embed DT in their SCP processes, given the involvement of various factors, such as culture and structure, aside from technology. This study investigates the following questions:
RQ1: Does digital transformation (DT) impact supply chain procurement (SCP)?
RQ2: Does supply chain procurement (SCP) impact organizational competitive advantage (CAD)?
The aim of this study is to analyse whether the role of procurement function can digitally transform and create competitive advantage for the entire supply chain. The mediation role of procurement function is underexplored, and the current study is designed to address this gap in the literature. With this goal, the current study collected data using an online survey on the LinkedIn network with supply chain professionals in Saudi Arabia to test the hypothesized model. The results of this study confirm that DT plays a major role in procurement, as well as in competitive advantage for organizations. The contribution of this research is that it takes a step towards identifying the relationship between procurement and organizational competitiveness by adopting RBV theory. Future research should collect data from different countries and apply a case study strategy to inspect the data further and in-depth. Additionally, it is recommended to include specific technology that may transform procurement digitally, such as machine learning, big data, and blockchain.
The subsequent section reviews the literature to understand the background and theories needed to create a conceptual model. Then, we discuss the research methodology, which is followed by a presentation of the results and discussions including theoretical and practical implications, limitations, recommendations for further research, and conclusion.
2. Literature Review
Customers, suppliers, governments, retailers, financial institutions, and other key stakeholders are all part of the DT framework, as is the deployment of new technology, and this framework covers businesses and their models, partnerships, the workflow of processes, and much more [18,19,23,24,25]. Utilising organisational resources and obtaining the best benefits by allocating them leads to the generation of sustainable competitive advantage [26], which not easy to imitate and is rare and creates values [27]. Teece et al. [28] divided the utilisation of organisational resources into building and creating dynamic capabilities, including the use of technologies to create sustainable CAD by managing interorganisational relationships [29].
2.1. Digital Transformation (DT)
Traditionally, companies have treated technology as a tool for communication or data sharing. Digital transformation has ranked much higher on the corporate agenda since the emergence of COVID-19 pandemic [30,31]. Companies need to start treating technology as a tool for proactive management, which is a hard lesson learned from the impacts and consequences of the COVID pandemic [4,29,30]. Technology can enable quick and exploratory reactions, as a crucial component of DT involves greater reliance on IT and analytical services [32]. There is mounting evidence that DT may help improve the cost efficiency, operational and financial performance, CAD, customer-centricity, and management of multi-supplier partnering relationships in SCs [6,9,16]. Procurement processes can better serve SCs by utilising new DTs, and this can demonstrate how procurement can become a crucial function in SCs that rely on DT [8,33,34,35,36,37,38,39].
Digital transformation is critical to the creation of more transparent [40] and traceable [38,41,42] procurement transactions. Increased openness and traceability can benefit businesses and strengthen buyer–supplier relationships and the level of confidence between them, which will make procurement functions more strategic and support overall organisation goals [43]. Implementing the right DT in procurement can generate sustainable CADs that are hard for others to imitate [7,43]. According to Hallikas et al. [6], digital procurement can provide improved alternatives for strategic decision-making through the use of better data: from accessing supplier innovation to collaborative platforms and innovation laboratories, sophisticated analytics, greater computing capacity, and improved visualisation tools. In humanitarian SCs, DT plays a crucial role in ensuring the benefits of traceable logistics aids and support reach the right people as quickly as feasible [41,42]. Hence, the following hypothesis was developed according to the above clarification:
H1.
Digital transformation (DT) positively impacts supply chain procurement (SCP).
2.2. Supply Chain Procurement (SCP)
Jahani et al. [25] found that purchasing and supply management, as well as inbound and outbound logistics, are all part of the procurement process. Supplier selection is critical as it can affect delivery lead times. The length of the procurement cycle may be affected by the type of supplier collaboration. Supply chain agility can be considerably improved through strategic purchase and flexibility [34,35,44]. The challenge lies in identifying ways to make procurement more strategically driven through the application of DT instead of tactics; technology can be used to ensure there are minimal errors and to streamline the process to achieve the right levels of supply at the right time, with the right cost, and at the right location [41,42]. As Verhoefa et al. [19] stated, DT is multidisciplinary and includes SCs in addition to other disciplines. Supply chains can make procurement effectiveness a centrepiece of companies’ SC value proposition, but this brings forth many questions, such as procurement’s relationship with business activities, how such new business strategies can best be formulated, and which DT, human capabilities, and organisational arrangements and structures will work best. Several studies have suggested reasons, such as cost reduction, increased productivity, minimising errors, exceeding customer satisfaction, product availability, reducing waste, and so on, for adopting DT in procurement to create CAD [33,39,43,45].
Hallikas et al. [6] and Bienhaus and Haddud [43] showed that procurement 4.0 is a strategic function that transforms the entire business model; impacts organisational efficiency, effectiveness, results, performance, and development; and creates CAD. The specifics of the utilisation of DT and what they can unravel for procurement effectiveness remain unclear. Adopting technology to manage the data for and the selection of suppliers, as for outbound and inbound orders, is critical for making decisions that build organisational capabilities and create CAD [8,37,43,46,47]. This leads to the second hypothesis:
H2.
Supply chain procurement (SCP) positively impacts competitive advantage (CAD).
2.3. Competitive Advantage (CAD)
Competitive advantage refers to allocating and utilising organisational resources in a way that others cannot imitate [14,27]. It is a mix of capabilities, physical resources, and intangibles, such as the way in which the organisation manages its business, culture, reputation, brand, process efficiency, and productivity. Digitising procurement may be considered a game changer and a CAD, such as in Amazon [17], Dell, or Apple [19]. Organisations and stakeholders must rethink their innovation and SC strategies to stay ahead of the curve as the digital revolution accelerates [36].
To maintain procurement data, many firms are integrating technology into the sourcing, contracting, and purchasing processes [48]. Managing procurement means managing the relationships between several parties and stakeholders. As Malhotra et al. [16] stated, technology supports organisations in building sustainable and long-term CAD by addressing the role of knowledge created by different parties involved in the SC. Managing the flow of information and knowledge created out of the procurement function is a key source for CAD. Organisations that can utilise DT to manage procurement can better allocate resources, which, in turn, will generate sustainable CAD [6,43,47]. The third hypothesis is as follows:
H3.
Digital transformation (DT) positively impacts competitive advantage (CAD).
3. Conceptual Model
This study applied the stimulus–organism–response approach developed by Mehrabian and Russell [49]. In this approach, the stimulus is the action that agitates the organism and causes a response [50]. The stimulus in this study is DT, which involves revamping the entire business model. All pillars of DT have a significant influence on procurement. The organism in this study comprises the people in companies, who have distinct emotional and cognitive states. People run SCP, which includes all events that take place between inputs and reactions. Thus, the DT stimuli prompt people to alter SCP, which helps generate CAD. The last component is response, which refers to the consequences of DT for SCP and leads to CAD as an outcome (see Figure 1).
Theoretical Foundation
The resource-based view from the strategic management field proposes that the sources of competition for organisations are their resources and capabilities [51]. A resource is anything owned or acquired by an organisation, and capacity is the ability to utilise and obtain benefits from resources to conduct operations [52,53]. As long as an organisation has resources that are valuable in their own right, they will have the ability to implement value-creating tactics that cannot readily be replicated by rivals [26,28,51]. Firms that have access to the best mix of SCP and knowledge-based resources and competencies will be able to maintain a long-term advantage in the marketplace [14,23,51].
Bowersox et al. [23] noted that e-procurement can differentiate firms from their competitors. Using technology improves e-procurement operations management and enhances customer services [54,55]. As Kosmol et al. [15] claimed, there is a need for digital procurement in practices across the SC. Kosmol et al. [15] adopted the RBV and dynamic capabilities theory to examine technology, organisational structure, and culture in the context of DT, SCP, and CAD by extending the work done by Kwak et al. [21] (see Figure 1). By adopting and extending the RBV and dynamic capabilities models, this study contributes to the literature by associating DT, SCP, and CAD. To operationalise the conceptual model, this study applies the research onion methodology, which is explained in the next section.
4. Research Methodology
This study applied David and Han’s [56] approach, which recommends searching databases and eliminating irrelevant and duplicate articles. After implementing this search, all remaining articles that had adequate fundamental content (the paper evaluates the basic principles of the theory) and empirical substance (the study shows results using statistical analysis) were included. New items were added using the snowball effect to draw upon more relevant articles. This study applied the quantitative research method, which is used to test theories by investigating the relationship between constructs, where such constructs can be assessed by instruments, leading to numerical data that can be analysed using statistical processes [57]. This method focuses on gathering facts and data, as well as classification of collected data, to draw informed conclusions [58,59].
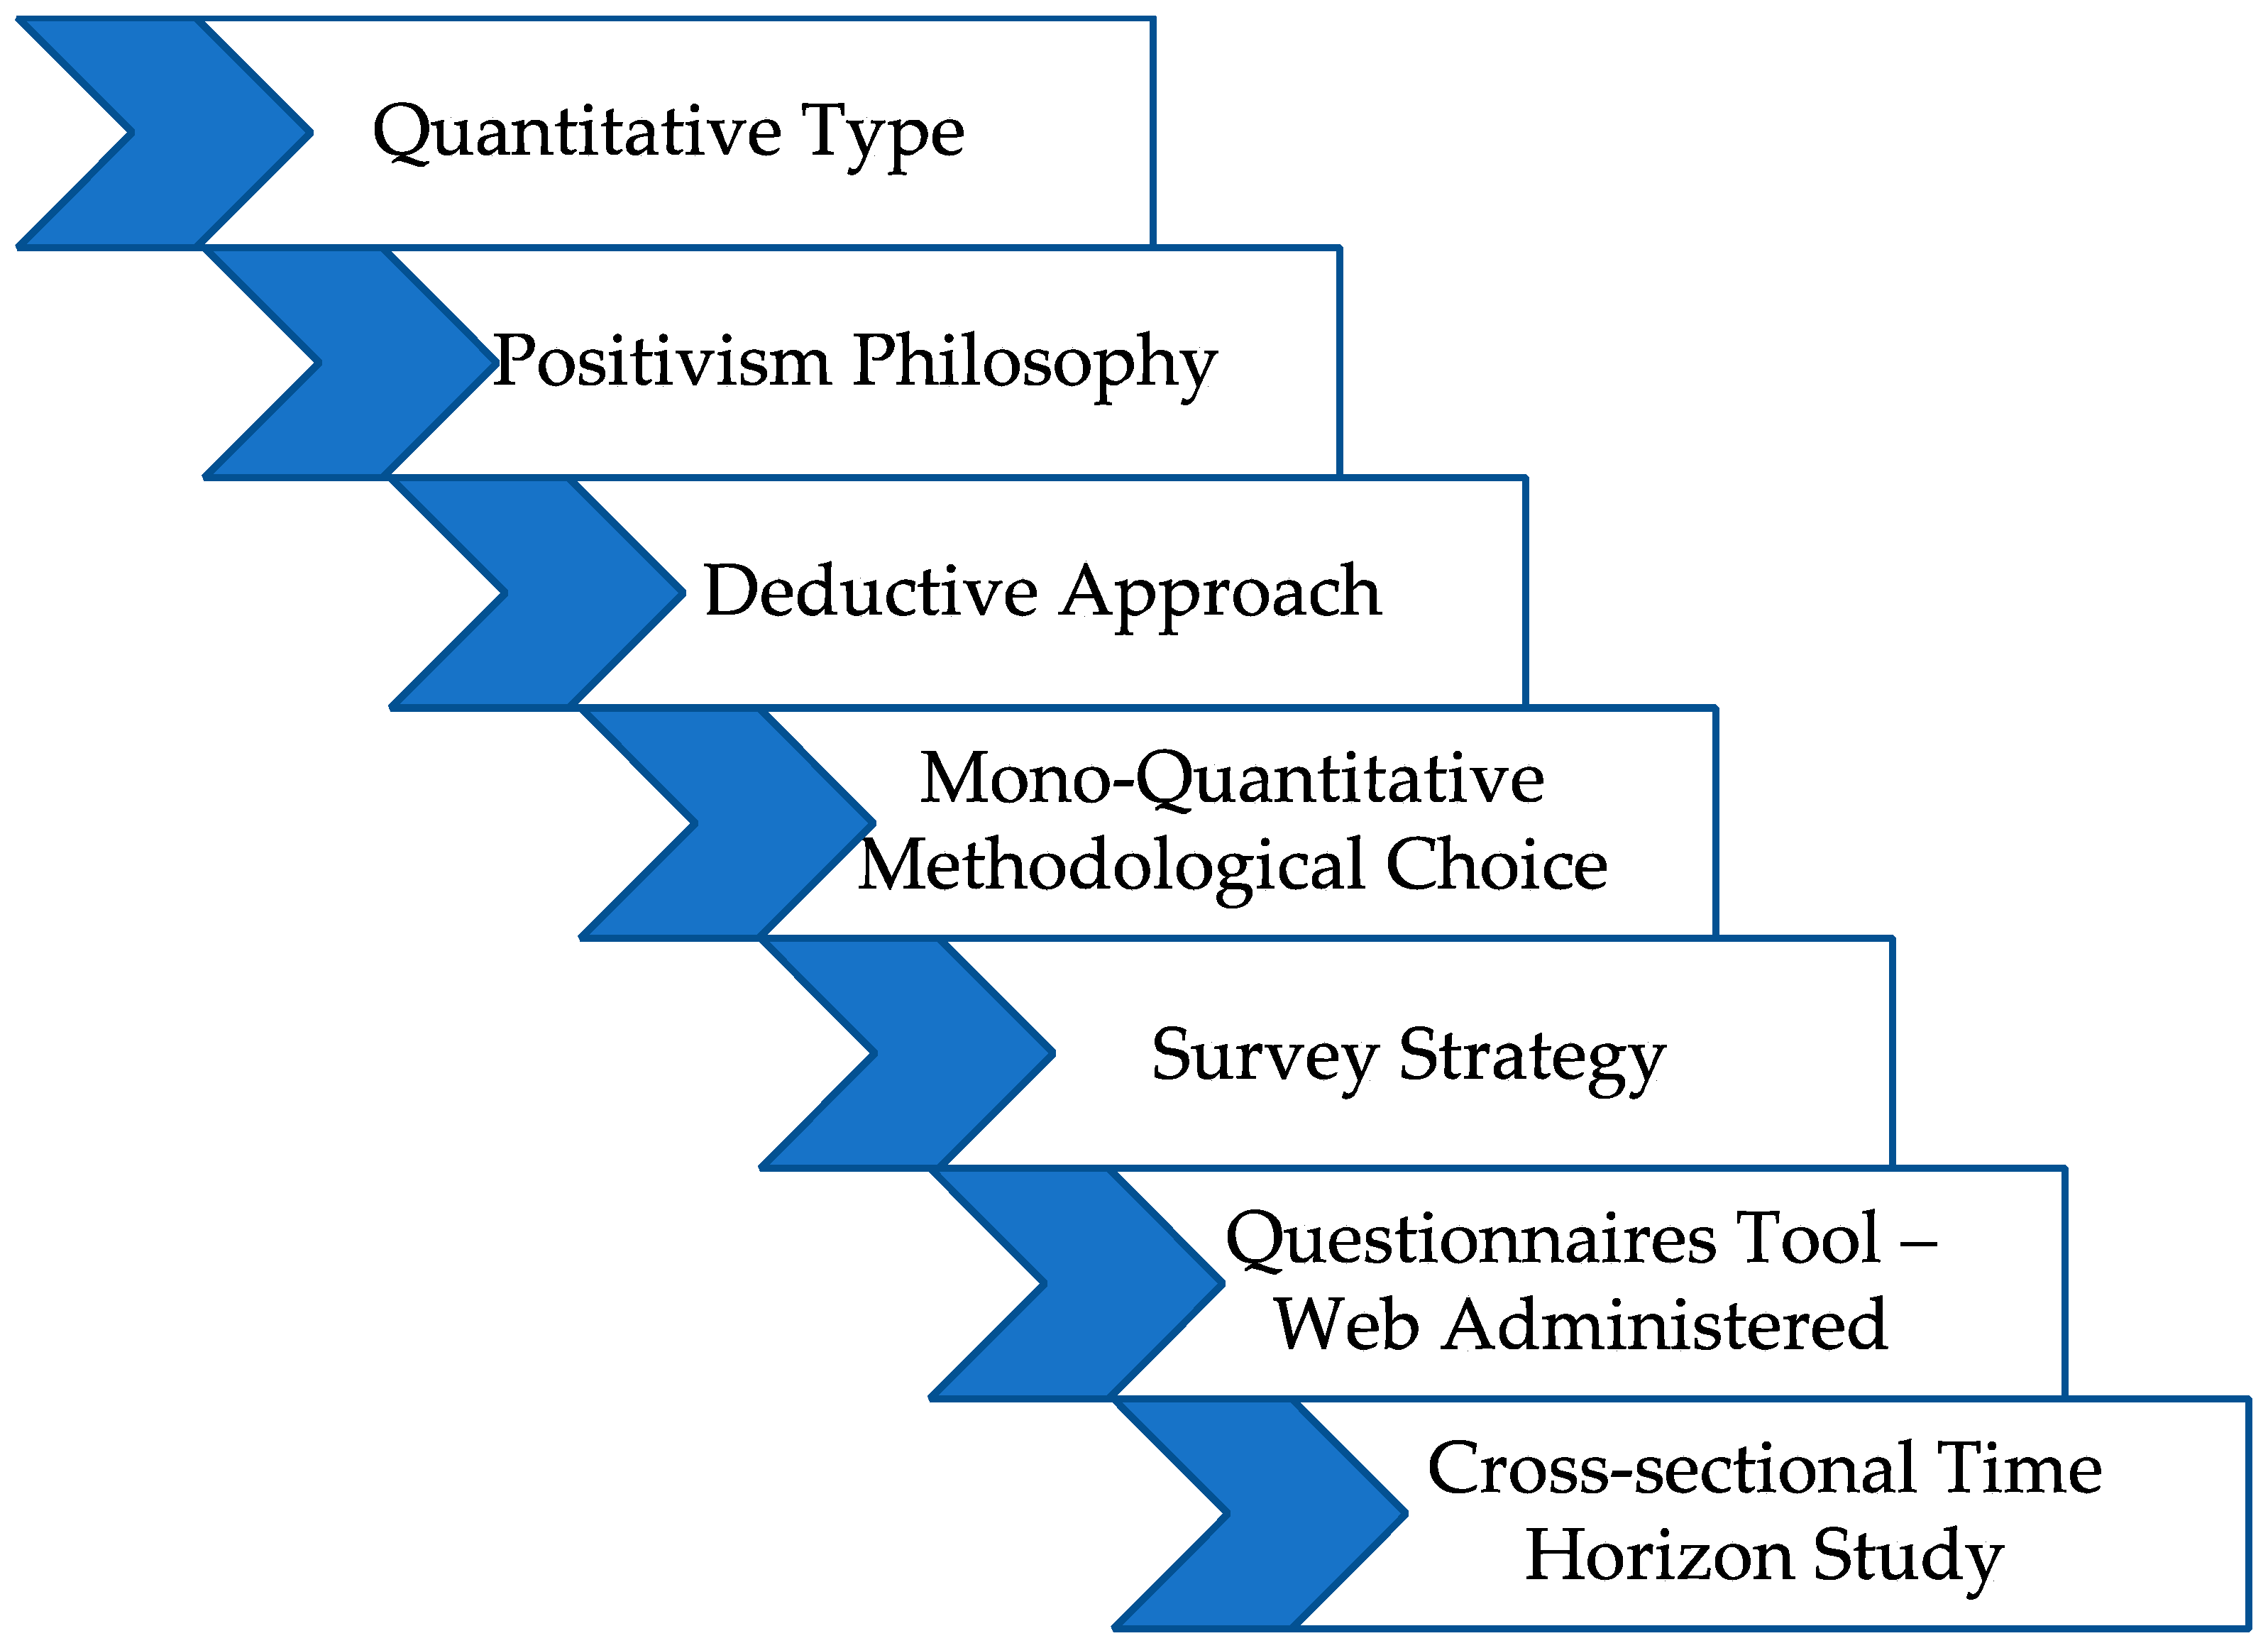
This study relied on the philosophy of positivism, where the phenomena are completely isolated from the researcher’s point of view. Positivism is simple and saves time and effort. Positivism used with the quantitative research method enables accuracy, facilitates measurement and data collection, and facilitates the identification of factors and the implications of the analysis for theory and practice with extensions and contributions [2]. Given the method and research philosophy, this study used a deductive approach, where the idea was developed with a theoretical basis using the literature, and the proposed hypotheses were tested [15]. The methodological choice here was a mono-quantitative one using a single data collection technique; namely, matching previously chosen slices [58] (Figure 2).
This study used a survey with a deductive approach commonly used in management research [57]. Questionnaires were used to collect data to discover relationships between factors and to build constructs to answer questions such as what, who, where, why, when, and how [58]. The survey strategy is the standard tool for empirical research in the social sciences [60]. This study was cross-sectional, a format that is compatible with the survey strategy, and analysed the phenomenon within a particular time span, in this case six months or less, as mentioned in the timeline section [58]. This study applied partial least squares structural equation modelling (PLS-SEM) for data analysis. This method emphasises prediction in the estimation of statistics and is a causally explanatory approach to SEM [61]. PLS-SEM is widely used in SC research [62]. The data were analysed using the SmartPLS application, which is simple, easy to use, and widely applicable [61].
4.1. Sampling
There is no single best approach to sampling [58]. This study used a combination of convenience and snowball sampling. The participants were chosen using a convenience sampling technique as it is the simplest means of contacting participants [60]. The targeted samples were SCP professionals from different industries.
4.2. Instrument Development
The instruments used in this study were adopted from work by Aral and Weill [62], Croom [54], Croom and Johnson [55], and Kwak et al. [21] (see Appendix A). These studies were published in top FT50 journals and have been used in several studies, including those of Sousa-Zomer et al. [8], Li et al. [63], Anim-Yeboah et al. [64], Chang et al. [65], Bag et al. [47], Kumar and Ganguly [40], Afraz et al. [66], and Dubey et al. [67]. These studies have demonstrated that the loading, predictive power, and reliability and validity of the pertinent instruments are all within the relevant thresholds. To accommodate cultural differences, the instruments were back-translated to ensure that there were no misunderstandings [68]. Bilingual (Arabic and English) web-based questionnaires were used. The questionnaire was reviewed by an expert focus group in the field to make sure that the meaning of each element measured what it was supposed to measure and was easily understandable. The questionnaire used a seven-point Likert scale, with responses ranging from 1 = “strongly disagree” to 7 = “strongly agree” [69,70,71]. Demographic items were included (see Appendix A).
4.3. Pretesting and Pilot Study
The questionnaires were distributed among the targeted participants until 30 of them responded. SmartPLS was used to check the reliability and validity of the items. The Cronbach’s alpha was greater than 0.7 for all items and the factor loadings were above 0.680. All items were retained, and the survey was distributed among the targeted sample (see details in next section).
4.4. Final Survey Procedures
After developing the measurement items and conducting a pilot study, the web-based survey was distributed. This study used a unique approach to reach SC professionals. LinkedIn is a powerful tool to connect with and reach the right respondents. One of the author’s LinkedIn profiles has approximately 30,000 network members. When filtered for first connections, there were over 2000 professionals involved in SCP. Only 550 participants were sent surveys, and they were addressed using their first names to indicate the importance of the message. The sample selection had quality, as the potential participants’ profiles indicated that they were qualified to participate and would understand the questionnaire. The quality of the sample is one of the main contributions of this study. This study shows that LinkedIn works well for targeting a sample of professional and business-to-business (B2B) participants and is recommended for use in future studies.
The survey was reviewed by a focus group of experts. A pilot test was conducted. All steps helped minimise and avoid non-response biases. Whereas non-observation and observation errors may have occurred, the literature review built a sound structure for measurement, and the aforementioned revisions eliminated several errors. The PLS-SEM statistical analysis using SmartPLS is discussed in the next section.
5. Results
In this study, 550 surveys were distributed through LinkedIn and 221 were returned. The response rate of 41% was acceptable, as it was greater than the 30% acceptable level for online surveys [72]. Therefore, the sample size was sufficient to further test the hypotheses. Similar studies using online surveys reported that a 36% response rate is necessary to analyze a research model [73]. All the complete responses were used for analysis because no outliers were identified. The data were first screened to assess the normality. The skewness and kurtosis met the threshold cut-offs at ± 1 [74], which validates the findings.
5.1. Descriptive Analysis
Table 1 presents the demographic items and respondents’ profiles. Only 14% of the participants were female. This percentage is similar to the global trend in the inclusion of women in the SC field (globally, women make up 17% of the SC workforce) [75,76]. Most participants were mid-career professionals, as 97% were aged above 29 years, 95% were at a specialist level or higher, and 96% had bachelor’s degrees or higher (see Table 2). The participants were qualified for the study in terms of experience and seniority.
5.2. Common Method Bias/Variance (CMB/CMV)
The measured latent marker variable (MLMV) technique can be used to discover issues with CMV in PLS-SEM models [77]. The age variable was included in the model, as it measured the individual’s age and did not fall within the same domain as the other variables. Table 3 shows that the R2 values of the dependent variables differed by less than 10% after adding the respondents’ ages [78,79]. The model in this study was free of CMB/CMV problems, as shown using MLMV.
5.3. Measurement Model
5.3.1. Convergent Validity
Convergent validity was used to compare the same factors in the questionnaire to see if they were associated with and relevant to the measurement of the construct. All factor loadings were above 0.708, indicating acceptable reliability and explaining over 50% of the items’ variances [74]. To assess the reliability of the items measuring the latent constructs, Cronbach’s alpha (CA) was used, which is a measure of internal consistency reliability that ranges from 0 to 1 and assumes equal (unweighted) indicator loadings [61,80]. When SEM is used with reflectively measured constructs, composite reliability is considered a more suitable criterion of reliability. Cronbach’s alpha was applied in this study to test the internal consistency of the measurement items, and all the results were >0.7, which is an acceptable threshold according to Nunnally [81]. Additionally, composite reliability (CR) is a measurement of internal consistency reliability, which, in contrast to Cronbach’s alpha, does not assume equally weighted indicator loadings. Composite reliability should be above 0.60 in exploratory research and above 0.70 as a general guideline but not above 0.95, according to Hair et al. [72].
The convergent validity measured by all the average variance extracted (AVE) results was greater than the threshold of 0.50, meaning that the items explained more errors than the variance in the constructs [74,77] (see Table 4). According to Hair et al. [61], the AVE is a summary measure of convergence among a set of items representing a reflectively measured latent construct [61]. In this study, AVE indicates the average percentage of variation explained (variance extracted) among the items of a construct. The AVE is calculated based on the square of a standardized indicator’s outer loading, which is a measure of convergent validity. AVE represents the variation in an item explained by the construct and is referred to as the variance extracted from the item. The AVE value is the degree to which a latent construct explains the variance of its indicators [61]. As a threshold, an AVE value greater than 0.5 indicates that the measurement questions can better reflect the characteristics of each research variable in the model.
5.3.2. Discriminant Validity
Unlike convergent validity, discriminant validity determines whether the items of each construct are similar to those of others. Reporting the heterotrait–monotrait ratio (HTMT) alone is recommended. This study met the criterion for the HTMT of <0.9 [74,82] (see Table 5). Discriminant validity can be determined from the square root of the AVE, which should be more than the correlations of the latent variables, according to the Fornel–Larcker criterion and Hair et al. [74]. The diagonals are the square roots of the AVE and are indicated by the highest values in the column and its left row (see Table 5). All cross-loading results were above the cut-off of 0.5 (see Table 6), which is the rule of thumb defined by Hair et al. [79]. Thus, the construct measurements in this study were reliable and valid. The next step was to evaluate the structural model findings.
5.3.3. Structural Model
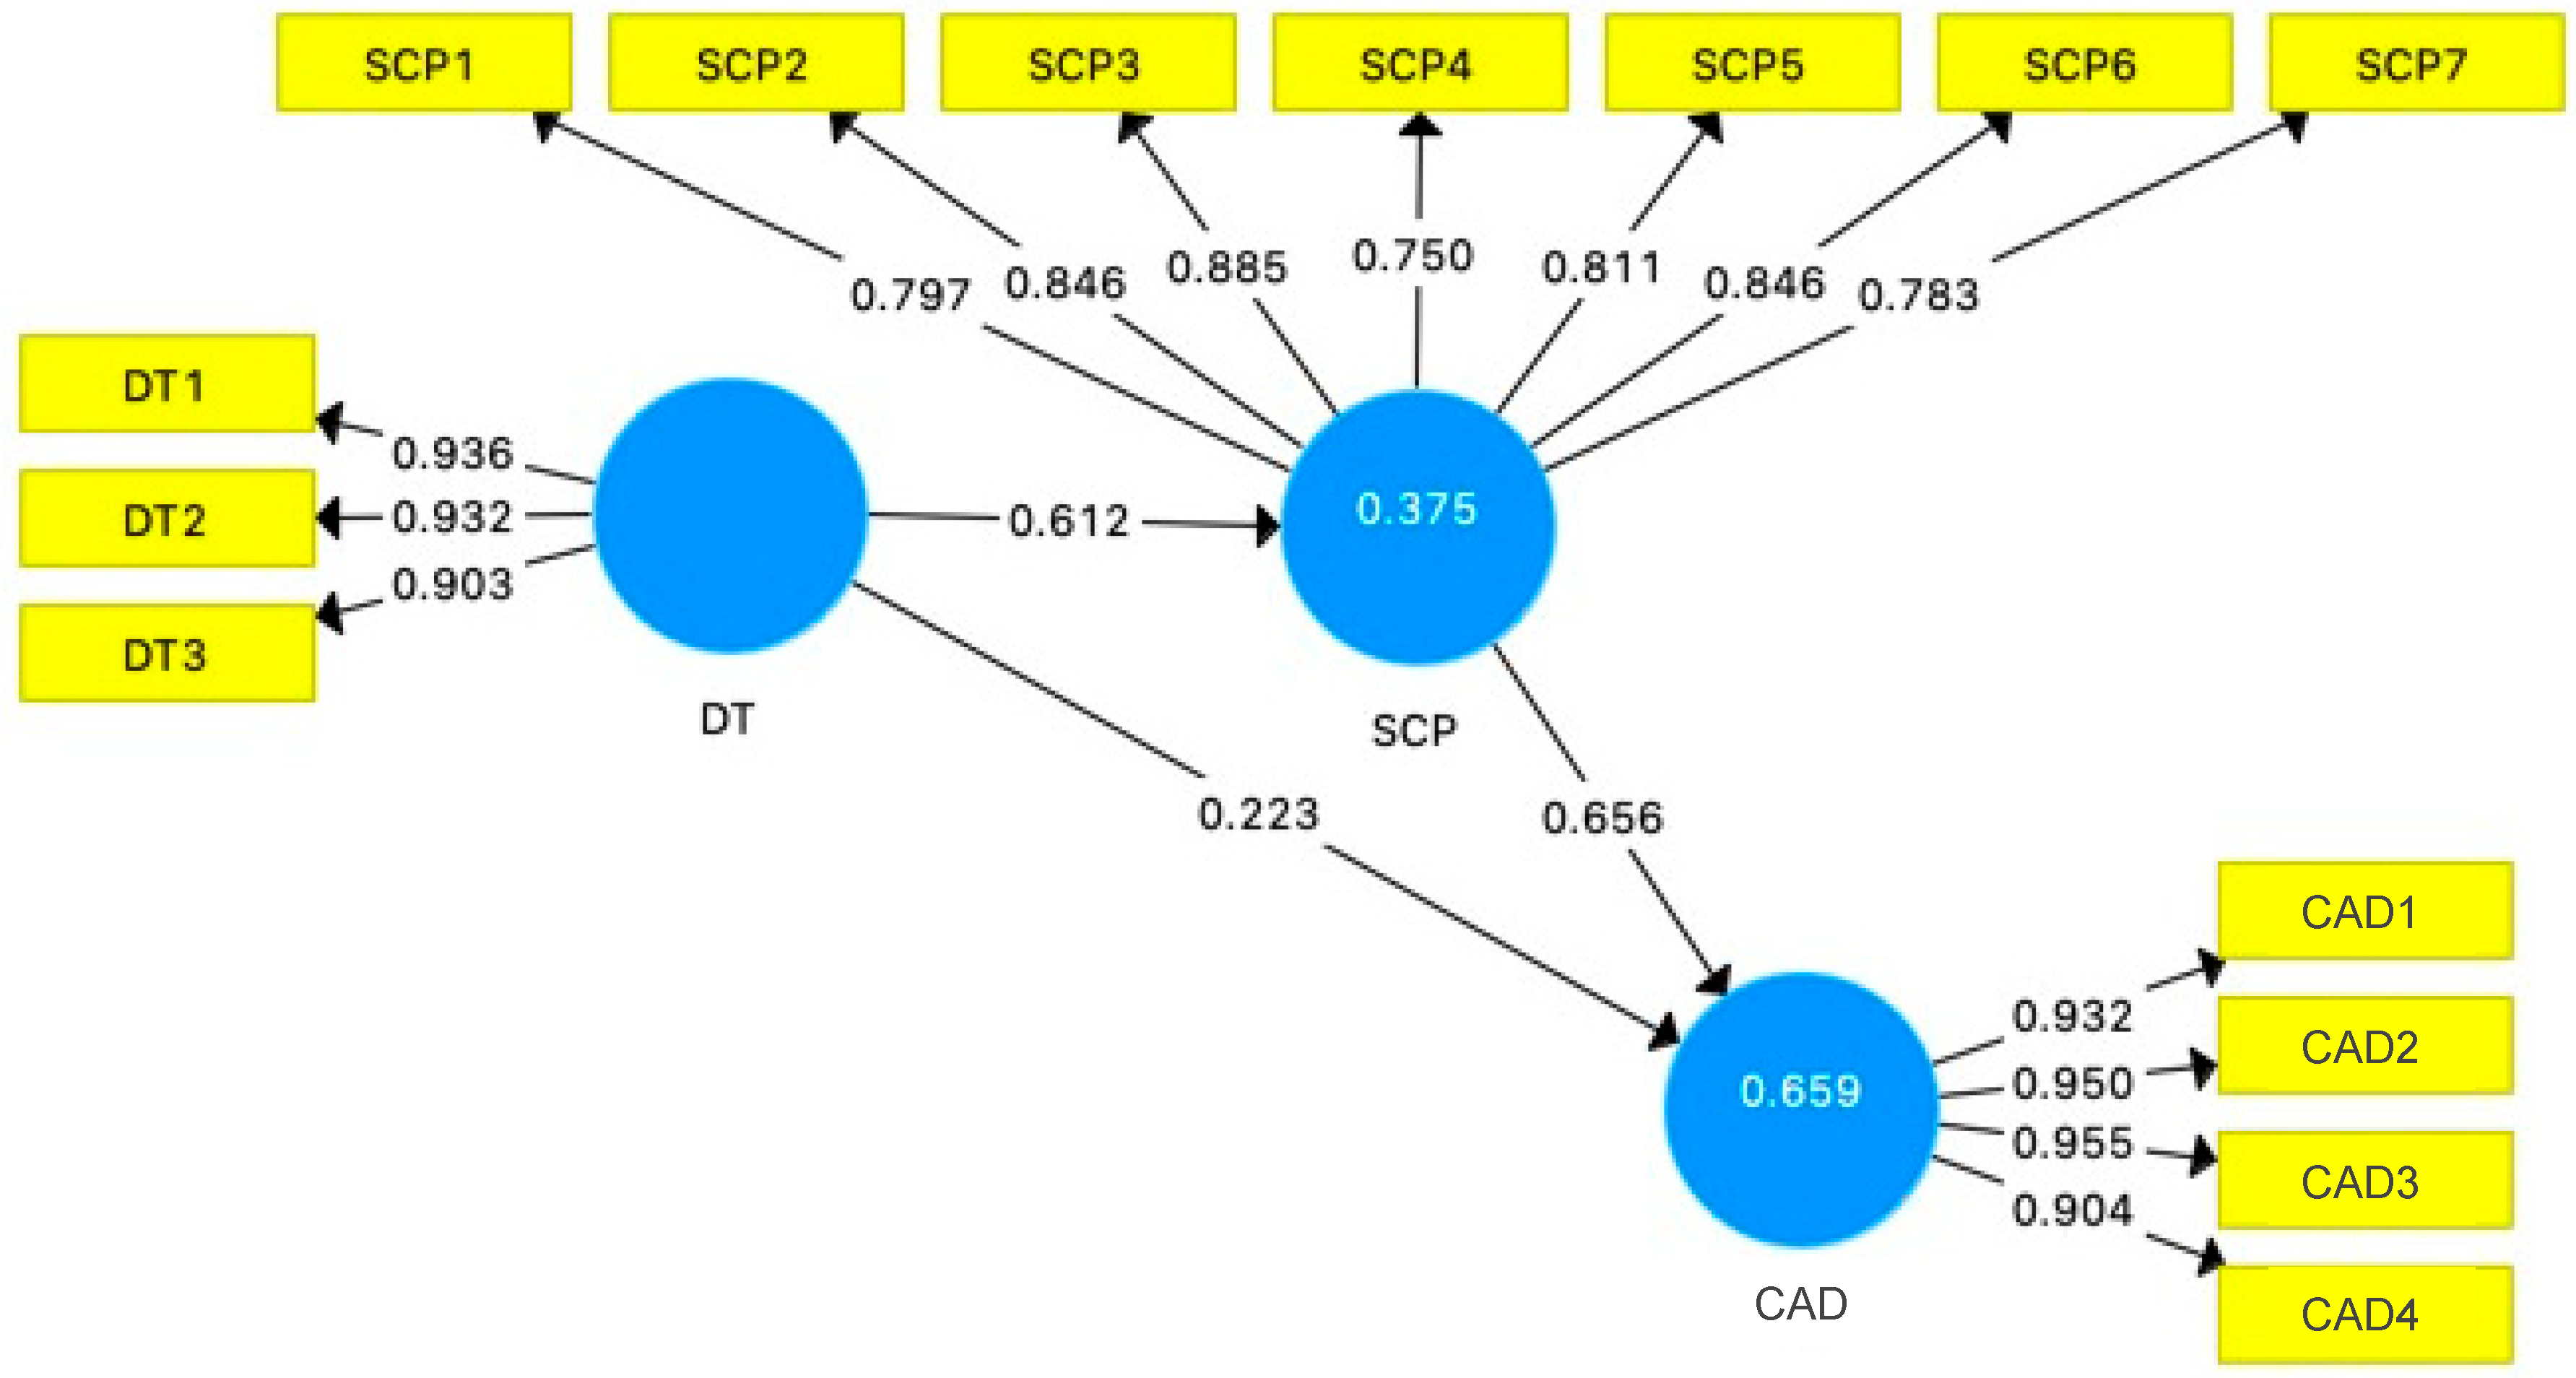
In this part of the study, the results were analysed at the construct level. The relationships between them (inner model) were examined for potential collinearity issues. It is important to check the relevance and significance of the structural model relationships and the model’s explanatory and predictive power [83]. The coefficient of determination R2 results were 0.736 and 0.445 for CAD and SCP, respectively (see Table 3). Both met the cut-off range, with CAD being substantial and SCP moderate [79]. The Q2 shows a model’s predictive power. The results were 0.572 and 0.248 for CAD and SCP, respectively [84]. To assess potential collinearity, the variance inflation factor (VIF) was used with the inner reflective model, and a VIF < 3 is considered acceptable [74,85]. Table 7 shows that the VIF was less than 3 in all constructs, which confirms that there were no collinearity issues in the model. The effect size f2 was large for both H1 and H2 but small for H3. The results were 0.803, 0.788, and 0.091, respectively (see Table 8). All results fell within the threshold ranges of 0.02, 0.15, and 035—namely, small, medium, and large, respectively—as defined by Cohen [86] (see Figure 3).
As recommended by Hair et al. [61], this study used bootstrapping with 5,000 iterations to obtain the path coefficient and the bias-corrected confidence interval, including the model fit criterion. This method was used to test the indirect relations of SCP’s mediating role. The standardised root mean square residuals (SRMRs) are reported in Table 8, and the values were less than the threshold of 0.08. The squared Euclidean (dULS) and geodesic (dG) distances were lower than the upper bounds of the confidence intervals of 95% and 99%, respectively [83]. This confirmed that the model fit accordingly (Table 9).
This study proposed three hypotheses. All three are supported with high levels of significance, with p-values = 0.000 *** in the data analysis (see Table 8), and all path coefficients were significant at the 99.999% confidence level, which confirms strong positive relationships between digital transformation and SCP and between procurement, CAD, and DT.
5.4. The Indirect Effect and SCP Mediation Analysis
The results show that procurement mediates the relationship between DT and CAD. Table 8 confirms that zero did not fall between 2.5% and 97.5% of the CI.
6. Discussion
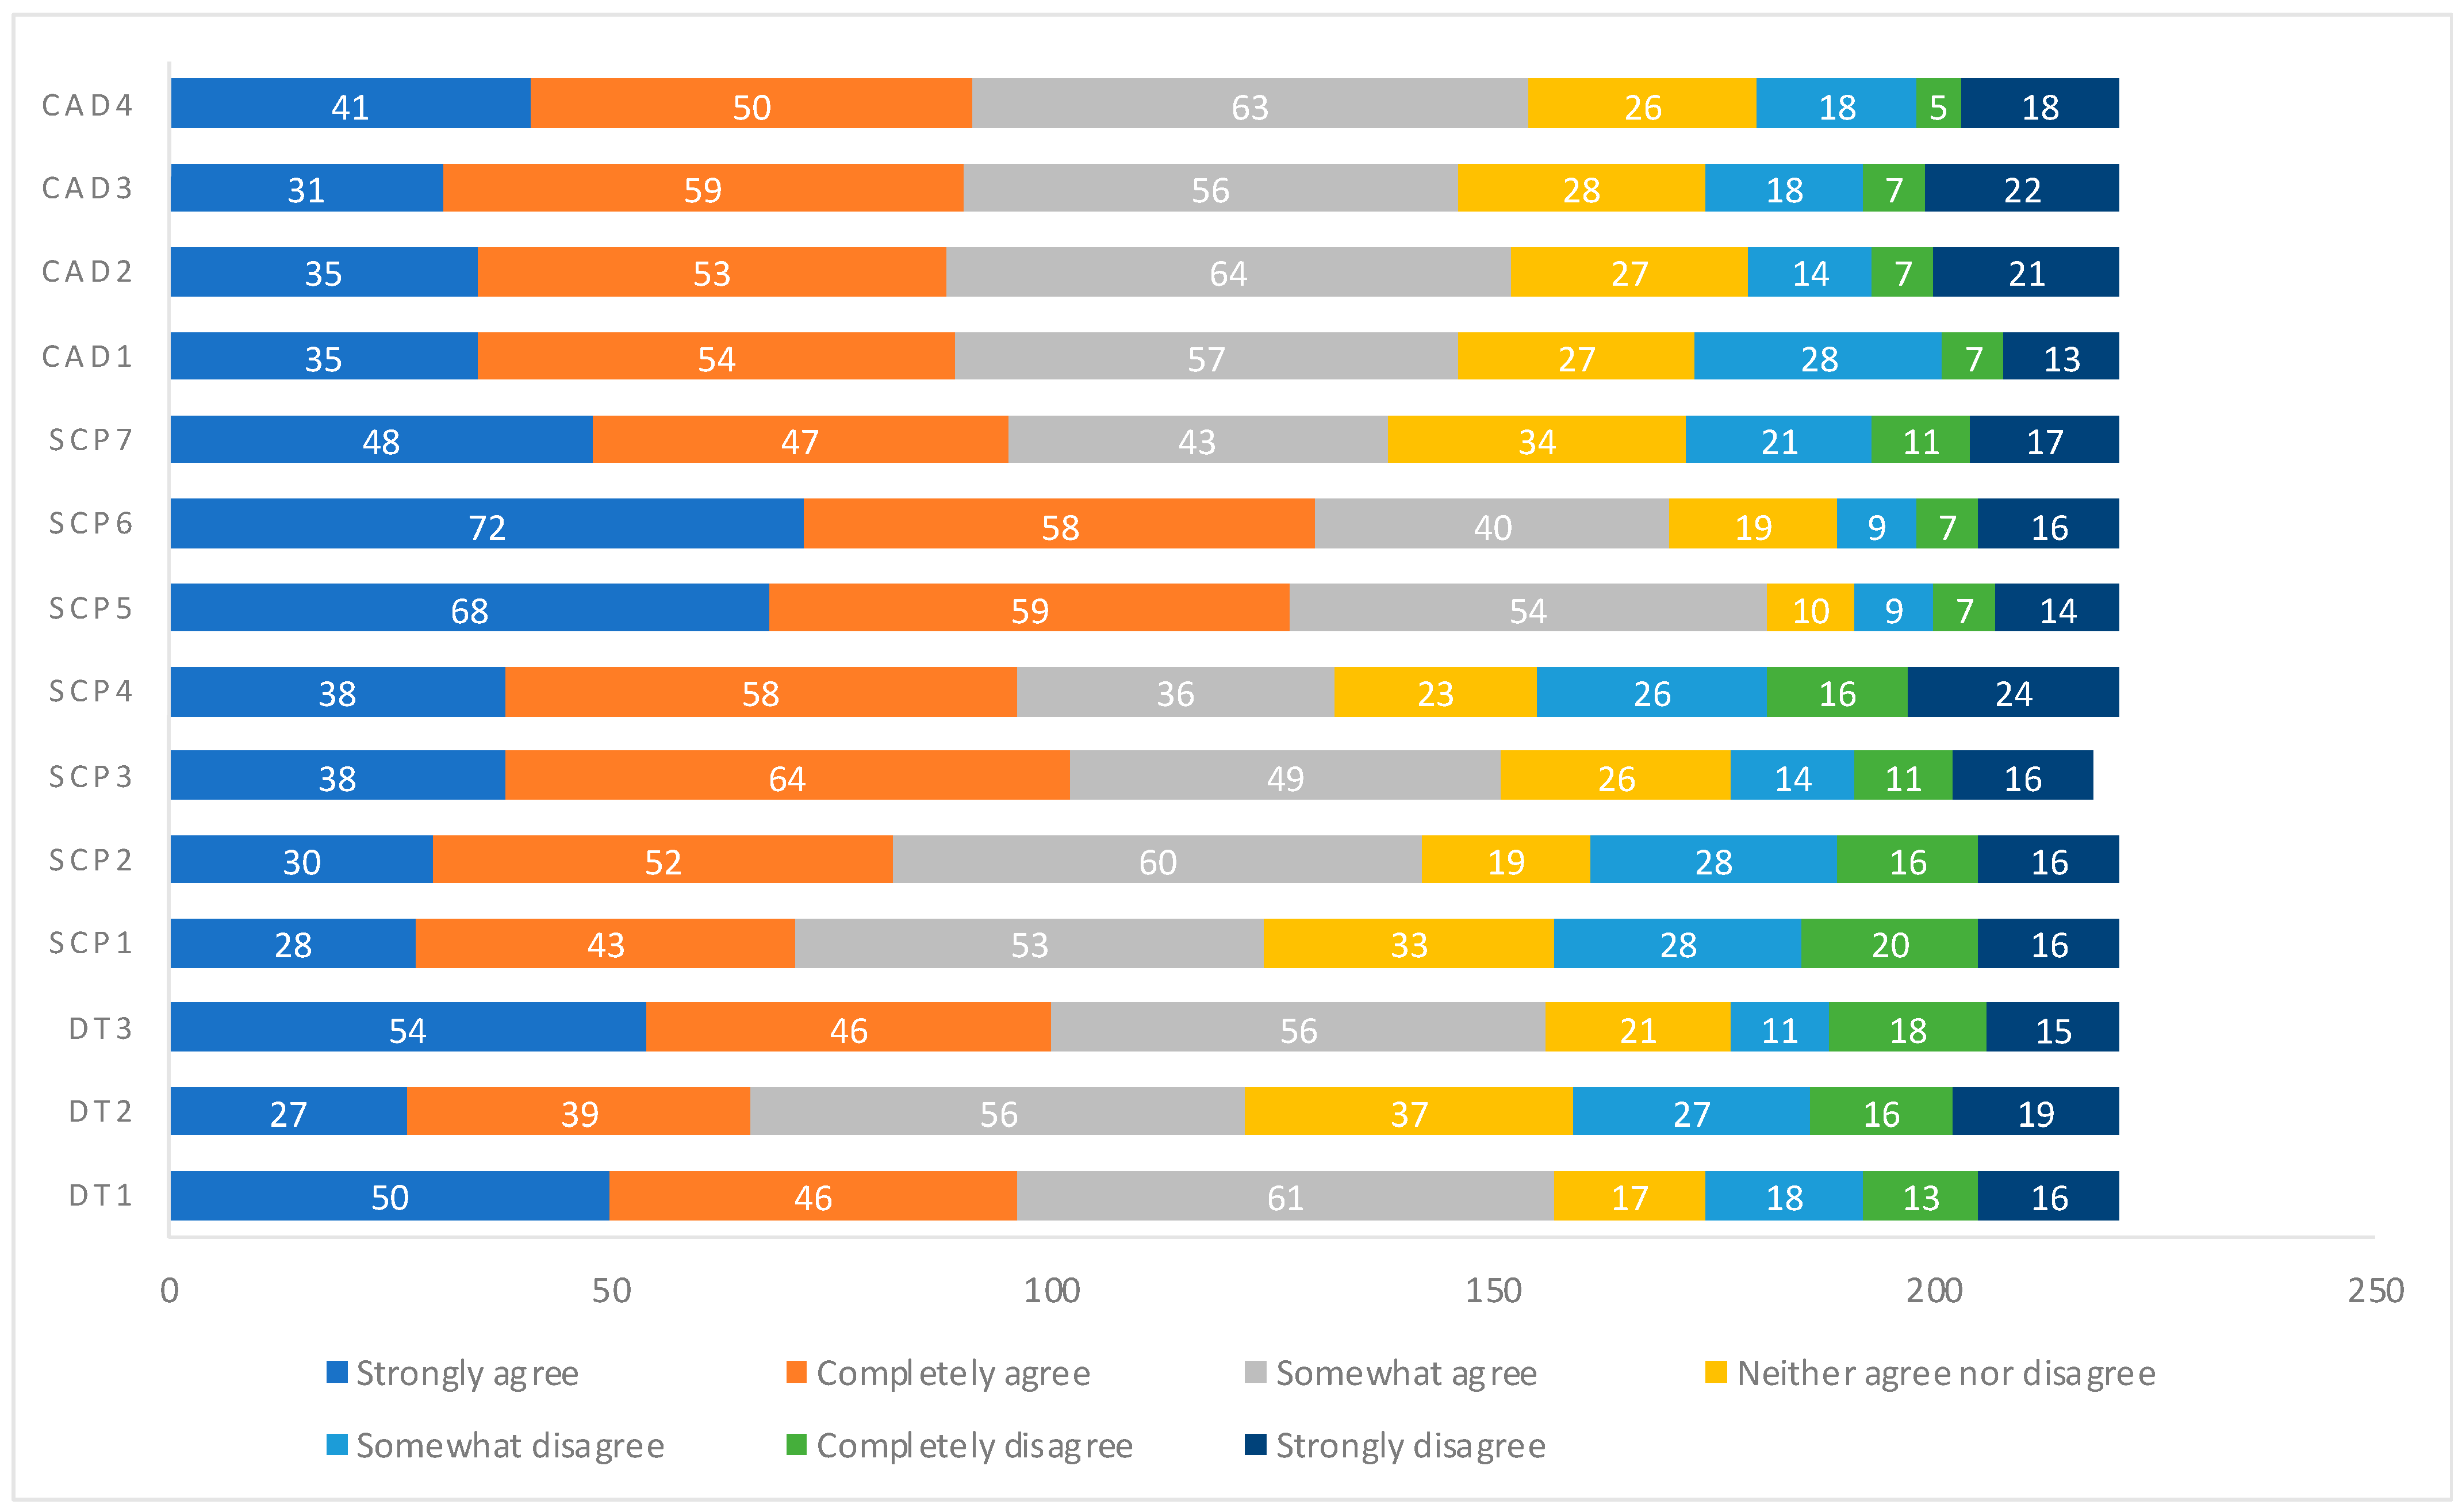
This study relied on a quantitative research method in line with the philosophy of positivism. It extends existing theory and its implications for practice. Studies have shown the importance of digital technology and the value outcomes that emerge when DT is implemented successfully. The literature shows how DT can benefit SCs generally and procurement specifically. Therefore, DT is important for companies’ CAD. The results of this study align with the findings in the literature [8,33,38], showing that DT impacts SCP significantly, as can be observed from the responses shown in Figure 4.
As procurement is a strategic upstream function, the clarity and traceability [12] of information is critical for strategy and for ensuring CAD. The results of this study align with those of Bienhaus and Haddud [43], Viale and Zouari [7], and Khan et al. [41]. The competition between firms in a SC makes procurement a critical function. The involvement of different parties both within and outside the organisation, which generates massive amounts of data, makes DT key. Companies should upgrade their capabilities in procurement, including people, systems, processes, technology, partnerships, and upstream/downstream supply-chain relationships, to achieve sustainability and gain CAD that differentiates them from others. The findings of this study confirm that procurement is a part of strategic resources and that investment in DT starts with SCP [34,35].
The procurement function is a resource for any organisation that can be digitally transformed and leads to intangible CAD that is difficult for others to match. The results confirm this, as H3 highlights the significant impact of SCP on CAD. The findings show that SCP plays a significant mediating role between DT and CAD, and this result is considered the main contribution of this study because, if an organisation invests in digitally transforming procurement functions, it can gain CAD.
6.1. Theoretical and Practical Implications/Contributions (Implications for Theory and Practice)
From an academic perspective, there is a need to investigate the impact of digitising procurement on organisational competitiveness. This study helps identify the relationship between procurement and organisational competitiveness using a RBV [14,51], considering procurement as a valuable resource for organisations and DT as a driver for generating sustainable CAD [22]. This expands the application of the theory of the RBV to SCs. The identification of the mediating role of SCP is one contribution of this study to the literature. Future research can examine case studies or conduct in-depth experiments to further extend understanding of its applications. This study used the professional networking website LinkedIn to target SC professionals, which helped the researchers to reach the right audience. The quality, response rate, timeframe, and value of the LinkedIn results show that it is a viable research tool and can be used more widely to target professionals in appropriate fields.
This study can be used to help organisations make decisions about investing in transforming the procurement function digitally. It is recommended to start with procurement because it involves the use of large amounts of data and many different parties internally and externally. Organisations can strengthen their DT agendas to generate CAD through their procurement functions. The results show that digital procurement can be a game changer in a competitive market. The professionals from different industries and occupational levels who answered the questionnaires affirmed that successful DT in procurement led to CAD. This research adds to the existing body of literature by demonstrating how digital transformation can play a role in enabling supply chain resilience and overcoming future disruptions in global supply chains [12,13].
6.2. Limitations and Future Research Recommendations
This study has several limitations. First, the sample data were obtained within the single economy of Saudi Arabia; hence, the findings may not be generalizable to different settings with different economic structures. Second, the period for which the data were collected was relatively short, although the response rate was sufficient when compared to other SC studies. However, a longer timeframe could strengthen the results, and a longitudinal study with time-series data is recommended. Third, the current study did not consider the challenges involved in the successful execution of DT [25], which is an emergent area for future research. Specific forms of technology, such as big data, augmented reality, machine learning, artificial intelligence, robotics, and blockchain [13,25,40], can be considered drivers and enablers of change for DT. Finally, this study did not incorporate the mediation roles of two emergent phenomena; i.e., digital maturity and supply chain maturity. These variables could have enriched the contributions of the study. Future research is recommended to investigate the mediation roles of digital maturity and supply chain maturity constructs aligning with trends relevant to industry 4.0 [17,20,33].
7. Conclusions
The DT agenda is becoming significant in contemporary times. With the advent of DT, SCs have undergone significant changes. True transformation unfolds only when organizational strategies, systems, cultures, attitudes, people, and business models are transformed using technology. Competitive advantage is not attained until and unless the advantage is maintained. Increasing the relevance of the SC as a source of long-term CAD is a logical next step in this process. The findings of this study are in alignment with [14], which asserted that resource-based theory has attributes that can enable purchasing and supply chain management to be sources of sustained competitive advantage. In today’s DT environment, rethinking procurement may offer long-term CAD. The procurement process includes purchase and supply management and inbound and outbound logistics. Strategic buying and flexibility may increase the agility of a SC significantly. SCs are part of the interdisciplinary character of DT. The technological capacity of an SC can lead to creation and leverage of knowledge across multiple parties at all stages of procurement [16]. In sum, Jeanne Ross, the Director of the MIT Center for Information Systems Research, states that, ‘Clearly, the thing that’s transforming is not the technology—it’s the technology that is transforming you’ [83].
Author Contributions
Conceptualization, M.A.A.; Formal analysis, M.A.A.; Methodology, M.A.A.; Supervision, M.A.S.; Validation, M.A.A. and M.A.S.; Writing—original draft, M.A.A.; Writing—review and editing, M.A.A. and M.A.S. All authors have read and agreed to the published version of the manuscript.
Funding
This research received no external funding.
Institutional Review Board Statement
Not applicable.
Informed Consent Statement
Not applicable.
Data Availability Statement
Not applicable.
Conflicts of Interest
The authors declare no conflict of interest.
Appendix A

Table A1.
Measurement items.
| Item | Source |
|---|---|
| Digital Transformation (DT) DT1: Our firm is driving new business processes built on technologies such as big data, analytics, cloud, mobile, and social media platform. DT2: Our firm is integrating digital technologies such as social media, big data, analytics, cloud, and mobile technologies to drive change. DT3: Our business operations are shifting toward making use of digital technologies such as big data, analytics, cloud, mobile, and social media platform. | Aral and Weill [62] |
| Supply Chain Procurement (SCP) SCP1. Our company selects the most appropriate supplier through the information system. SCP2. Our company gathers the demand proposals about procurement information or related information through the information system. SCP3. Our company releases the company requirements or rules via the information system. SCP4. Our company notifies the supplier on the arrival of an authorized procurement contract via the information system. SCP5. Our company documents past purchasing information in an electronic form. SCP6. Our company sets up a database about procurement and utilizes it in the purchasing process. SCP7 Our company evaluates the performance of suppliers from past purchasing information in the information system. | Croom [54]; Croom and Johnson [55] |
| Competitive Advantage (CAD) Our supply chain has … CAD1 competitive advantage in the efficient procurement operations. CAD2 competitive advantage in the effective procurement operations. CAD3 competitive advantage in differentiating our procurement operations. CAD4 competitive advantage in the reputation of our excellent procurement operations. | Kwak et al. [21] |
References
- Bouncken, R.B.; Kraus, S.; Roig-Tierno, N. Knowledge-and innovation-based business models for future growth: Digitalized business models and portfolio considerations. Rev. Manag. Sci. 2021, 15, 1–14. [Google Scholar] [CrossRef]
- Kraus, S.; Jones, P.; Kailer, N.; Weinmann, A.; Chaparro-Banegas, N.; Roig-Tierno, N. Digital transformation: An overview of the current state of the art of research. SAGE Open 2021, 11, 1–15. [Google Scholar] [CrossRef]
- Tabrizi, B.; Lam, E.; Girard, K.; Irvin, V. Digital transformation is not about technology. Harv. Bus. Rev. 2019, 13, 1–6. [Google Scholar]
- Loonam, J.; Eaves, S.; Kumar, V.; Parry, G. Towards digital transformation: Lessons learned from traditional organizations. Strat. Chang. 2018, 27, 101–109. [Google Scholar] [CrossRef]
- Hartley, J.L.; Sawaya, W.J. Tortoise, not the hare: Digital transformation of supply chain business processes. Bus. Horiz. 2019, 62, 707–715. [Google Scholar] [CrossRef]
- Hallikas, J.; Immonen, M.; Brax, S. Digitalizing procurement: The impact of data analytics on supply chain performance. Supply Chain. Manag. Int. J. 2021, 26, 629–646. [Google Scholar] [CrossRef]
- Viale, L.; Zouari, D. Impact of digitalization on procurement: The case of robotic process automation. Supply Chain Forum Int. J. 2020, 21, 185–195. [Google Scholar] [CrossRef]
- Sousa-Zomer, T.T.; Neely, A.; Martinez, V. Digital transforming capability and performance: A microfoundational perspective. Int. J. Oper. Prod. Manag. 2020, 40, 1095–1128. [Google Scholar] [CrossRef]
- Scuotto, V.; Caputo, F.; Villasalero, M.; Del Giudice, M. A multiple buyer–supplier relationship in the context of SMEs’ digital supply chain management. Prod. Plan. Control 2017, 28, 1378–1388. [Google Scholar] [CrossRef]
- Sarkis, J. Supply chain sustainability: Learning from the COVID-19 pandemic. Int. J. Oper. Prod. Manag. 2020, 21, 63–73. [Google Scholar] [CrossRef]
- Salam, M.A.; Bajaba, S. The role of supply chain resilience and absorptive capacity in the relationship between marketing–supply chain management alignment and firm performance: A moderated-mediation analysis. J. Bus. Ind. Mark. 2022. ahead-of-print. [Google Scholar]
- Li, G.; Liu, M.; Zheng, H. Subsidization or Diversification? Mitigating Supply Disruption with Manufacturer Information Sharing. Omega 2022, 112, 102670. [Google Scholar] [CrossRef]
- Li, G.; Xue, J.; Li, N.; Ivanov, D. Blockchain-Supported Business Model Design, Supply Chain Resilience, and Firm Performance. Transp. Res. Part E Logist. Transp. Rev. 2022, 163, 102773. [Google Scholar] [CrossRef]
- Barney, J.B. Purchasing, supply chain management and sustained competitive advantage: The relevance of resource-based theory. J. Supply Chain. Manag. 2012, 48, 3–6. [Google Scholar] [CrossRef]
- Kosmol, T.; Reimann, F.; Kaufmann, L. You’ll never walk alone: Why we need a supply chain practice view on digital procurement. J. Purch. Supply Manag. 2019, 25, 100553. [Google Scholar] [CrossRef]
- Malhotra, A.; Gosain, S.; Sawy, O.A.E. Absorptive capacity configurations in supply chains: Gearing for partner-enabled market knowledge creation. MIS Quart. 2005, 29, 145–187. [Google Scholar] [CrossRef]
- Frederico, G.F.; Garza-Reyes, J.A.; Anosike, A.; Kumar, V. Supply Chain 4.0: Concepts, maturity and research agenda. Supply Chain. Manag. Int. J. 2019, 25, 262–282. [Google Scholar] [CrossRef]
- Soto-Acosta, P. COVID-19 pandemic: Shifting digital transformation to a high-speed gear. Inf. Syst. Manag. 2020, 37, 260–266. [Google Scholar] [CrossRef]
- Verhoef, P.C.; Broekhuizen, T.; Bart, Y.; Bhattacharya, A.; Dong, J.Q.; Fabian, N.; Haenlein, M. Digital transformation: A multidisciplinary reflection and research agenda. J. Bus. Res. 2021, 122, 889–901. [Google Scholar] [CrossRef]
- Weerabahu, W.S.K.; Samaranayake, P.; Nakandala, D.; Hurriyet, H. Digital supply chain research trends: A systematic review and a maturity model for adoption. Benchmarking Int. J. 2022. ahead-of-print. [Google Scholar] [CrossRef]
- Kwak, D.W.; Seo, Y.J.; Mason, R. Investigating the relationship between supply chain innovation, risk management capabilities and competitive advantage in global supply chains. Int. J. Oper. Prod. Manag. 2018, 38, 2–21. [Google Scholar] [CrossRef]
- Gold, A.H.; Malhotra, A.; Segars, A.H. Knowledge management: An organizational capabilities perspective. J. Manag. Inf. Syst. 2001, 18, 185–214. [Google Scholar] [CrossRef]
- Bowersox, D.J.; Closs, D.J.; Drayer, R.W. The digital transformation: Technology and beyond. Supply Chain Manag. Rev. 2005, 9, 22–29. [Google Scholar]
- Hahn, G.J. Industry 4.0: A supply chain innovation perspective. Int. J. Prod. Res. 2020, 58, 1425–1441. [Google Scholar] [CrossRef]
- Jahani, N.; Sepehri, A.; Vandchali, H.R.; Tirkolaee, E.B. Application of industry 4.0 in the procurement processes of supply chains: A systematic literature review. Sustainability 2021, 13, 7520. [Google Scholar] [CrossRef]
- Grant, R.M. Toward a knowledge-based theory of the firm. Strat. Manag. J. 1996, 17, 109–122. [Google Scholar] [CrossRef]
- Barney, J.B. Resource-based theories of competitive advantage: A ten-year retrospective on the resource-based view. J. Manag. 2001, 27, 643–650. [Google Scholar] [CrossRef]
- Teece, D.J.; Pisano, G.; Shuen, A. Dynamic capabilities and strategic management. Strat. Manag. J. 1997, 18, 509–533. [Google Scholar] [CrossRef]
- Malhotra, A.; Gosain, S.; El Sawy, O.A. Leveraging standard electronic business interfaces to enable adaptive supply chain partnerships. Inf. Syst. Res. 2007, 18, 260–279. [Google Scholar] [CrossRef]
- Ye, F.; Liu, K.; Li, L.; Lai, K.H.; Zhan, Y.; Kumar, A. Digital supply chain management in the COVID-19 crisis: An asset orchestration perspective. Int. J. Prod. Econ. 2022, 245, 108396. [Google Scholar] [CrossRef]
- Bonnet, D.; Westerman, G. The new elements of digital transformation. MIT Sloan Manag. Rev. 2021, 62, 82–89. [Google Scholar]
- Leonhardt, D.; Haffke, I.; Kranz, J.; Benlian, A. Reinventing the IT function: The Role of IT Agility and IT Ambidexterity in Supporting Digital Business Transformation. ECIS 2017, 63, 968–984. [Google Scholar]
- Seyedghorban, Z.; Samson, D.; Tahernejad, H. Digitalization opportunities for the procurement function: Pathways to maturity. Int. J. Oper. Prod. Manag. 2020, 40, 1685–1693. [Google Scholar] [CrossRef]
- Koh, L.; Orzes, G.; Jia, F. The fourth industrial revolution (Industry 4.0): Technologies’ disruption on operations and supply chain management. Int. J. Oper. Prod. Manag. 2019, 39, 817–828. [Google Scholar] [CrossRef]
- Tortorella, G.L.; Giglio, R.; Van Dun, D.H. Industry 4.0 adoption as a moderator of the impact of lean production practices on operational performance improvement. Int. J. Oper. Prod. Manag. 2019, 39, 860–886. [Google Scholar] [CrossRef]
- Schrauf, S.; Berttram, P. Industry 4.0: How digitization makes the supply chain more efficient, agile, and customer-focused. Strat. Tech. 2016, 1–32. Available online: https://www.strategyand.pwc.com/gx/en/insights/2016/industry-4-digitization/industry40.pdf (accessed on 19 June 2022).
- Rubbio, I.; Bruccoleri, M.; Pietrosi, A.; Ragonese, B. Digital health technology enhances resilient behaviour: Evidence from the ward. Int. J. Oper. Prod. Manag. 2019, 40, 34–67. [Google Scholar] [CrossRef]
- Hastig, G.M.; Sodhi, M.S. Blockchain for supply chain traceability: Business requirements and critical success factors. Prod. Oper. Manag. 2020, 29, 935–954. [Google Scholar] [CrossRef]
- Martinez, V.; Zhao, M.; Blujdea, C.; Han, X.; Neely, A.; Albores, P. Blockchain-driven customer order management. Int. J. Oper. Prod. Manag. 2019, 39, 993–1022. [Google Scholar] [CrossRef]
- Kumar, N.; Ganguly, K.K. External diffusion of B2B e-procurement and firm financial performance: Role of information transparency and supply chain coordination. J. Enterp. Inf. Manag. 2020, 34, 1037–1060. [Google Scholar] [CrossRef]
- Khan, M.; Parvaiz, G.S.; Ali, A.; Jehangir, M.; Hassan, N.; Bae, J. A Model for Understanding the Mediating Association of Transparency between Emerging Technologies and Humanitarian Logistics Sustainability. Sustainability 2022, 14, 6917. [Google Scholar] [CrossRef]
- Khan, M.; Khan, M.; Ali, A.; Khan, M.I.; Ullah, I.; Iqbal, M. Digitalization for Fast, Fair, and Safe Humanitarian Logistics. Logistics 2022, 6, 31. [Google Scholar] [CrossRef]
- Bienhaus, F.; Haddud, A. Procurement 4.0: Factors influencing the digitisation of procurement and supply chains. Bus. Process Manag. J. 2018, 24, 965–984. [Google Scholar] [CrossRef]
- Chen, S.S.; Chuang, Y.W.; Chen, P.Y. Behavioral intention formation in knowledge sharing: Examining the roles of KMS quality, KMS self-efficacy, and organizational climate. Knowl. Based Syst. 2012, 31, 106–118. [Google Scholar] [CrossRef]
- Preindl, R.; Nikolopoulos, K.; Litsiou, K. Transformation strategies for the supply chain: The impact of industry 4.0 and digital transformation. Supply Chain Forum Int. J. 2020, 21, 26–34. [Google Scholar] [CrossRef]
- Ghadge, A.; Kidd, E.; Bhattacharjee, A.; Tiwari, M.K. Sustainable procurement performance of large enterprises across supply chain tiers and geographic regions. Int. J. Prod. Res. 2019, 57, 764–778. [Google Scholar] [CrossRef]
- Bag, S.; Wood, L.C.; Mangla, S.K.; Luthra, S. Procurement 4.0 and its implications on business process performance in a circular economy. Resourc. Cons. Recyc. 2020, 152, 104502. [Google Scholar] [CrossRef]
- Accenture.com. The Future of Procurement|Accenture. Available online: https://www.accenture.com/us-en/insights/operations/future-procurement (accessed on 13 April 2022).
- Mehrabian, A.; Russell, J.A. An Approach to Environmental Psychology; MIT Press: Cambridge, MA, USA, 1974. [Google Scholar]
- Eroglu, S.A.; Machleit, K.A.; Davis, L.M. Atmospheric qualities of online retailing: A conceptual model and implications. J. Bus. Res. 2001, 54, 177–184. [Google Scholar] [CrossRef]
- Barney, J. Firm resources and sustained competitive advantage. J. Manag. 1991, 17, 99–120. [Google Scholar] [CrossRef]
- Hall, R. A framework linking intangible resources and capabilities to sustainable competitive advantage. Strat. Manag. J. 1993, 14, 607–618. [Google Scholar] [CrossRef]
- Yang, C.C.; Marlow, P.B.; Lu, C.S. Assessing resources, logistics service capabilities, innovation capabilities and the performance of container shipping services in Taiwan. Int. J. Prod. Econ. 2009, 122, 4–20. [Google Scholar] [CrossRef]
- Croom, S. The impact of web-based procurement on the management of operating resources supply. J. Supply Chain Manag. 2000, 36, 4–13. [Google Scholar] [CrossRef]
- Croom, S.; Johnson, R. E-service: Enhancing internal customer service through e-procurement. Int. J. Serv. Ind. Manag. 2003, 14, 539–555. [Google Scholar] [CrossRef]
- David, R.J.; Han, S.-K. A systematic assessment of the empirical support for transaction cost economics. Strat. Manag. J. 2004, 25, 39–58. [Google Scholar] [CrossRef]
- Creswell, J.W. Research Design: Qualitative, Quantitative, and Mixed Methods Approach, 3rd ed.; Sage Publications, Inc.: London, UK, 2009. [Google Scholar]
- Saunders, M.L.; Lewis, P.P.; Thornhill, A. Research Methods for Business Students; Pearson: London, UK, 2019. [Google Scholar]
- Remenyi, D.; Williams, B.; Money, A.; Swartz, E. Doing Research in Business and Management: An Introduction to Process and Method; Sage Publications Ltd.: London, UK, 1998. [Google Scholar]
- Taherdoost, H. Sampling methods in research methodology: How to choose a sampling technique for research. Soc. Sci. Res. Net. 2016. [Google Scholar] [CrossRef]
- Hair, J.F.; Risher, J.J.; Sarstedt, M.; Ringle, C.M. When to use and how to report the results of PLS-SEM. Eur. Bus. Rev. 2019, 31, 2–24. [Google Scholar] [CrossRef]
- Aral, S.; Weill, P. IT assets, organizational capabilities, and firm performance: How resource allocations and organizational differences explain performance variation. Org. Sci. 2007, 18, 763–780. [Google Scholar] [CrossRef]
- Li, L.; Su, F.; Zhang, W.; Mao, J.Y. Digital transformation by SME entrepreneurs: A capability perspective. Inf. Syst. J. 2018, 28, 1129–1157. [Google Scholar] [CrossRef]
- Anim-Yeboah, S.; Boateng, R.; Odoom, R.; Kolog, E.A. Digital transformation process and the capability and capacity implications for small and medium enterprises. Int. J. E Entrep. Innovat. 2020, 10, 26–44. [Google Scholar] [CrossRef]
- Chang, H.H.; Tsai, Y.C.; Hsu, C.H. E-procurement and supply chain performance. Supply Chain Manag. Int. J. 2013, 18, 34–51. [Google Scholar] [CrossRef]
- Afraz, M.F.; Bhatti, S.H.; Ferraris, A.; Couturier, J. The impact of supply chain innovation on competitive advantage in the construction industry: Evidence from a moderated multi-mediation model. Tech. Forecast. Soc. Chang. 2021, 162, 120370. [Google Scholar] [CrossRef]
- Dubey, R.; Gunasekaran, A.; Childe, S.J.; Wamba, S.F.; Roubaud, D.; Foropon, C. Empirical investigation of data analytics capability and organizational flexibility as complements to supply chain resilience. Int. J. Prod. Res. 2021, 59, 110–128. [Google Scholar] [CrossRef]
- Brislin, R.W. Back-translation for cross-cultural research. J. Cross Cult. Psych. 1970, 1, 185–216. [Google Scholar] [CrossRef]
- Dawes, J. Do data characteristics change according to the number of scale points used? An experiment using 5-point, 7-point and 10-point scales. Int. J. Market Res. 2008, 50, 61–104. [Google Scholar] [CrossRef]
- Vagias, W.M. Clemson International Institute for Tourism Research Development, Department of Parks, Recreation and Tourism Management; Clemson University: Clemson, SC, USA, 2006. [Google Scholar]
- Joshi, A.; Kale, S.; Chandel, S.; Pal, D.K. Likert scale: Explored and explained. Br. J. Appl. Sci. Technol. 2015, 7, 396–403. [Google Scholar] [CrossRef]
- Sekaran, U.; Bougie, R. Research Methods for Business: A Skill-Building Approach; Wiley: Hoboken, NJ, USA, 2016. [Google Scholar]
- Yew, W.C.; Kong, S.M.; Awang, A.H.; Yi, G.R. Developing a Conceptual Model for the Causal Effects of Outdoor Play in Preschools Using PLS-SEM. Sustainability 2022, 14, 3365. [Google Scholar] [CrossRef]
- Hair, J.F., Jr.; Hult, G.T.M.; Ringle, C.M.; Sarstedt, M. A Primer on Partial Least Squares Structural Equation Modeling (PLS-SEM); Sage Publications: London, UK, 2021. [Google Scholar]
- Logistics Bureau. Women in Supply Chain: Why So Few? Available online: https://www.logisticsbureau.com/women-in-supply-chain-why-so-few (accessed on 20 April 2022).
- Gartner. Gartner Survey Finds Women Comprise 41% of the Supply Chain Workforce. Available online: https://www.gartner.com/en/newsroom/press-releases/2021-06-16-gartner-survey-finds-women-comprise-41-percent-of-the-supply-chain-workforce (accessed on 30 April 2022).
- Sarstedt, M.; Radomir, L.; Moisescu, O.I.; Ringle, C.M. Latent class analysis in PLS-SEM: A review and recommendations for future applications. J. Bus. Res. 2022, 138, 398–407. [Google Scholar] [CrossRef]
- Podsakoff, P.M.; MacKenzie, S.B.; Lee, J.Y.; Podsakoff, N.P. Common method biases in behavioral research: A critical review of the literature and recommended remedies. J. Appl. Psych. 2003, 88, 879. [Google Scholar] [CrossRef]
- Chin, W.W.; Thatcher, J.B.; Wright, R.T.; Steel, D. Controlling for common method variance in PLS analysis: The measured latent marker variable approach. In New Perspectives in Partial Least Squares and Related Methods; Springer: New York, NY, USA, 2013; pp. 231–239. [Google Scholar]
- Hair, J.F.; Black, W.C.; Babin, B.J.; Anderson, R.E. Multivariate Data Analysis, 7th ed.; Pearson: London, UK, 2017. [Google Scholar]
- Nunnally, J.C. An overview of psychological measurement. In Clinical Diagnosis of Mental Disorders; Springer: Berlin/Heidelberg, Germany, 1978; pp. 97–146. [Google Scholar]
- Franke, G.; Sarstedt, M. Heuristics versus statistics in discriminant validity testing: A comparison of four procedures. Internet Research. 2019, 29, 430–447. [Google Scholar] [CrossRef]
- Narzary, S. Anthony Larsson and Robin Teigland (Eds.), The Digital Transformation of Labor: Automation, The Gig Economy, and Welfare. NHRD Netw. J. 2022, 15, 124–126. [Google Scholar] [CrossRef]
- Stone, M. Cross-validatory choice and assessment of statistical predictions. J. R. Stat. Soc. Ser. B Methodol. 1974, 36, 111–133. [Google Scholar] [CrossRef]
- Kline, R.B. Principles and Practice of Structural Equation Modelling; Guilford Press: New York, NY, USA, 2005. [Google Scholar]
- Cohen, L.J. The Probable and the Provable (Vol. 384); Clarendon Library of Logic and Philosophy, Oxford University Press: Northants, UK, 1977; (accessed on 8 April 2022). [Google Scholar] [CrossRef]
Figure 1.
Conceptual model—adopted from Gold et al. [22] and Barney [14,51] and extended from Kwak et al. [21].

Figure 2.
The research methodology adopted from the research onion developed by Saunders et al. [58] and summarised by the authors.
Figure 2.
The research methodology adopted from the research onion developed by Saunders et al. [58] and summarised by the authors.

Figure 3.
Analysed model. DT = digital transformation, SCP = supply chain procurement, CAD = competitive advantage.
Figure 3.
Analysed model. DT = digital transformation, SCP = supply chain procurement, CAD = competitive advantage.

Figure 4.
Response chart.

Table 1.
Analysis of respondents’ demographic profiles.
| Participants’ Details (n = 221) | Frequency | Percentage |
|---|---|---|
| Region | ||
| Saudi Arabia | 214 | 97% |
| Other | 7 | 3% |
| Gender | ||
| Male | 191 | 86% |
| Female | 30 | 14% |
| Age (years) | ||
| <22 | 1 | 0.5% |
| 23–28 | 2 | 0.9% |
| 29–35 | 32 | 14.5% |
| 36–45 | 74 | 33.5% |
| 46–55 | 80 | 36.2% |
| 56–60 | 28 | 12.7% |
| 61+ | 4 | 1.8% |
| Year of Experience (years) | ||
| ≤1 | 5 | 2% |
| 2–5 | 43 | 19% |
| 6–10 | 53 | 24% |
| 11–15 | 47 | 21% |
| 16–20 | 36 | 16% |
| 21–25 | 25 | 11% |
| 26+ | 12 | 5% |
| Education Level | ||
| High school or less | 2 | 1% |
| Diploma | 7 | 3% |
| Bachelor | 142 | 64% |
| Higher education | 70 | 32% |
| Occupational Level | ||
| Entry | 12 | 5% |
| Specialist/supervisor | 66 | 30% |
| Manager/senior | 77 | 35% |
| Director | 52 | 24% |
| Leadership | 14 | 6% |
| Supply Chain Speciality | ||
| Planning | 33 | 15% |
| Procurement | 56 | 25% |
| Warehousing | 11 | 5% |
| Log and Trans | 40 | 18% |
| General supply chain | 81 | 37% |
Table 2.
Descriptive analysis and normality assessment.
| Items | Mean | SD | Kurtosis | Skewness |
|---|---|---|---|---|
| DT1 | 4.955 | 1.789 | −0.281 | −0.790 |
| DT2 | 4.448 | 1.745 | −0.664 | −0.425 |
| DT3 | 4.986 | 1.816 | −0.341 | −0.796 |
| SCP1 | 4.484 | 1.75 | −0.769 | −0.404 |
| SCP2 | 4.661 | 1.751 | −0.600 | −0.601 |
| SCP3 | 4.95 | 1.73 | −0.055 | −0.885 |
| SCP4 | 4.615 | 1.941 | −0.929 | −0.539 |
| SCP5 | 5.407 | 1.685 | 0.987 | −1.282 |
| SCP6 | 5.362 | 1.768 | 0.538 | −1.179 |
| SCP7 | 4.846 | 1.808 | −0.523 | −0.633 |
| CAD1 | 4.855 | 1.647 | −0.199 | −0.691 |
| CAD2 | 4.833 | 1.74 | 0.003 | −0.867 |
| CAD3 | 4.765 | 1.762 | −0.193 | −0.813 |
| CAD4 | 4.923 | 1.707 | 0.082 | −0.853 |
Table 3.
Common method bias/variance (CMB/CMV).
| R2 Without Marker Variable | R2 With Marker Variable | |
|---|---|---|
| SCP | 0.736 | 0.736 |
| CAD | 0.445 | 0.448 |
Table 4.
Measurement model.
| Construct | Item | Loading | CA | rho_A | CR | AVE |
|---|---|---|---|---|---|---|
| DT | DT1 | 0.938 | 0.914 | 0.918 | 0.946 | 0.853 |
| DT2 | 0.932 | |||||
| DT3 | 0.900 | |||||
| SCP | SCP1 | 0.797 | 0.917 | 0.919 | 0.934 | 0.669 |
| SCP2 | 0.846 | |||||
| SCP3 | 0.885 | |||||
| SCP4 | 0.750 | |||||
| SCP5 | 0.811 | |||||
| SCP6 | 0.846 | |||||
| SCP7 | 0.783 | |||||
| CAD | CAD1 | 0.932 | 0.952 | 0.953 | 0.966 | 0.875 |
| CAD2 | 0.951 | |||||
| CAD3 | 0.955 | |||||
| CAD4 | 0.904 |
CA = Cronbach’s alpha, CR = composite reliability, AVE = average variance extracted, DT = digital transformation, SCP = supply chain procurement, CAD = competitive advantage.
Table 5.
Discriminant validity (Fornel–Larcker criterion) and heterotrait–monotrait ratio (HTMT) h.
| CAD | DT | SCP | |
|---|---|---|---|
| CAD | 0.936 | 0.669 h | 0.847 h |
| DT | 0.624 | 0.924 | 0.666 h |
| SCP | 0.792 | 0.613 | 0.818 |
Table 6.
Cross-loading.
| CAD | DT | SCP | |
|---|---|---|---|
| CAD1 | 0.932 | 0.570 | 0.755 |
| CAD2 | 0.950 | 0.563 | 0.744 |
| CAD3 | 0.955 | 0.628 | 0.756 |
| CAD4 | 0.904 | 0.574 | 0.709 |
| DT1 | 0.578 | 0.936 | 0.604 |
| DT2 | 0.575 | 0.932 | 0.558 |
| DT3 | 0.577 | 0.903 | 0.532 |
| SCP1 | 0.570 | 0.505 | 0.797 |
| SCP2 | 0.680 | 0.543 | 0.846 |
| SCP3 | 0.645 | 0.532 | 0.885 |
| SCP4 | 0.628 | 0.399 | 0.750 |
| SCP5 | 0.625 | 0.488 | 0.811 |
| SCP6 | 0.703 | 0.496 | 0.846 |
| SCP7 | 0.674 | 0.529 | 0.783 |
Table 7.
Collinearity assessment, VIF inner model.
| CAD | SCP | |
|---|---|---|
| DT | 1.599 | 1.000 |
| SCP | 1.599 |
Table 8.
Structural model.
| Relationship | Std Beta | Std Error | |t-value|^ | f2 | p-Value | CI 2.5% | CI 97.5% | Decision |
|---|---|---|---|---|---|---|---|---|
| DT → SCP | 0.615 | 0.057 | 10.759 | 0.803 | 0.000 *** | 0.097 | 0.342 | Supported |
| SCP → CAD | 0.793 | 0.03 | 26.615 | 0.788 | 0.000 *** | 0.49 | 0.706 | Supported |
| DT → CAD | 0.489 | 0.057 | 8.476 | 0.091 | 0.000 *** | 0.562 | 0.752 | Supported |
| Indirect relationship | ||||||||
| DT → SCP → CAD | 0.487 | 0.070 | 6.894 | 0.000 *** | 0.367 | 0.639 | Supported | |
Table 9.
Model fit.
| Saturated Model | 95% | 99% | Estimated Model | 95% | 99% | |
|---|---|---|---|---|---|---|
| SRMR | 0.037 | 0.044 | 0.048 | 0.037 | 0.044 | 0.048 |
| dULS | 0.147 | 0.206 | 0.240 | 0.147 | 0.206 | 0.240 |
| dG | 0.162 | 0.215 | 0.245 | 0.162 | 0.215 | 0.246 |
Publisher’s Note: MDPI stays neutral with regard to jurisdictional claims in published maps and institutional affiliations. |
© 2022 by the authors. Licensee MDPI, Basel, Switzerland. This article is an open access article distributed under the terms and conditions of the Creative Commons Attribution (CC BY) license (https://creativecommons.org/licenses/by/4.0/).
Share and Cite
MDPI and ACS Style
Alabdali, M.A.; Salam, M.A. The Impact of Digital Transformation on Supply Chain Procurement for Creating Competitive Advantage: An Empirical Study. Sustainability 2022, 14, 12269. https://0-doi-org.brum.beds.ac.uk/10.3390/su141912269
AMA Style
Alabdali MA, Salam MA. The Impact of Digital Transformation on Supply Chain Procurement for Creating Competitive Advantage: An Empirical Study. Sustainability. 2022; 14(19):12269. https://0-doi-org.brum.beds.ac.uk/10.3390/su141912269
Chicago/Turabian StyleAlabdali, Mahmoud Abdulhadi, and Mohammad Asif Salam. 2022. "The Impact of Digital Transformation on Supply Chain Procurement for Creating Competitive Advantage: An Empirical Study" Sustainability 14, no. 19: 12269. https://0-doi-org.brum.beds.ac.uk/10.3390/su141912269
Note that from the first issue of 2016, this journal uses article numbers instead of page numbers. See further details here.