
Innovative Management of Vegetable Outgrades as a Means of Food Loss and Waste Reduction

Institute of Agriculture and Food Biotechnology, State Research Institute, 02-532 Warsaw, Poland
*
Author to whom correspondence should be addressed.
Sustainability 2022, 14(19), 12363; https://0-doi-org.brum.beds.ac.uk/10.3390/su141912363
Submission received: 1 September 2022
/
Revised: 13 September 2022
/
Accepted: 21 September 2022
/
Published: 28 September 2022
(This article belongs to the Special Issue Sustainable Food Waste Management in Foodservice Establishments)
Abstract
:The present research focuses on using plant waste from agricultural production chains (vegetable outgrades) as ingredient sources for innovative food strategy developments. The quality of multi-vegetable products made from frozen vegetable outgrades (broccoli, cauliflower, green and yellow cut beans) for serving in gastronomy was evaluated. Vegetable outgrades were found to be low-cost sources of nutritional components. The dietary fiber content varied from 2.35 (cauliflower Giewont cultivar) to 4.40 g/100 g (green bean Rimember cultivar). The protein content varied from 1.41 (green bean Opportune cultivar) to 2.58 g/100 g (broccoli Porthenon cultivar). Bioactive compounds, including polyphenols and vitamin C, varied significantly depending on the vegetable. The content of carotenoids (β-carotene and zeaxanthin) in vegetables, in particular broccoli (Larson cultivar) and green beans (Rimember and Opportune cultivars), was lower than in outgrades. Due to the high nutrient quality of outgrades, the preparation of mechanically-formed vegetable patties and paste proceeded. According to recommendations of NRF, NAS, NDS nutrient density indices, both patties and pastes were classified as products with rich nutritional value and full-valuable components of the human diet. Moreover, food production technology utilizing vegetable outgrades can be potential solutions for food loss and waste management in gastronomy and in the food production industry.
1. Introduction
In recent years, implementation of sustainable development has been a dominating worldwide trend (the important part of which is the limitation of biodegradable food waste). Current attention is focused on the prevention and avoidance of food waste generation; however, food is an inevitable aspect for humanity and its production requires significant resources. Thus, food loss and waste reduction are approaches to decrease financial and industrial production costs. Both loss and gains are generated in the food supply chain system, starting at the production and processing stage, transportation, distribution, wholesale, retail, and finally the consumption [1].
At the very preliminary stage of agricultural food chain, i.e., basic production, ‘food waste’ is considered as every material that is disposed of, or which the owner is obligated to dispose of. The term biowaste refers to biodegradable waste from gardens and parks, households, warehouses, catering services, retail, as well as from food processing manufactures [2].
In the European Union member states, it is estimated that approximately 88 million tons of food waste are generated annually [3] and most come from the consumers [4]. Nearly 47 million tons are wasted in households, and another 11 million tons in the sector connected with food consumption, which accounts for around EUR 134 billions [3]. In 2014, it was found that only 14.3% of food waste was ‘being recycled’, whereas edible leftovers covered only 1.4% of food production [4].
Significant losses and discarded materials in unprocessed products and in the processing industry have become serious nutrition, economic, and environmental problems. The Food and Agriculture Organization of the United Nations (FAO) estimated that fruit and vegetables losses were the greatest among all kinds of foods, reaching up to 60% [5]. Fruit and vegetable processing generates relatively large amounts of byproducts, which constitute around 25–30% of that food group. The major content includes seeds, peels, and pomace, which contain, inter alia, potentially bioactive substances, such as carotenoids, polyphenols, dietary fiber, vitamins, enzymes, and plant oils. These phytochemicals can be potentially used in various industries, including the food industry, in terms of functional or fortified food development, medicine, and pharmaceuticals preparation, as well as textile applications [5].
Food waste in the gastronomy sector is considered part of a global character (it has a worldwide impact). One of the 17 new sustainable development goals (for the years 2015–2030) is to provide sustainable consumption and production [6]. According to FUSIONS research (Food use for Social Innovation by Optimizing Waste Prevention Strategies), the European Union member states’ gastronomy sector generates around 12% of total amount of discarded food and, thus, is ranked in third place, right after households (53%) and the food industry (19%) in food waste.
In the European Union member states, food waste accounts for around 89 million tons annually. This is expected to increase by 40% in the next four years [3]. According to the Food and Agriculture Organization of the United Nations [4] and the International Food Policy Research Institute [7], an estimated one-third of food produced globally (thus 1.3 billion tons) is thrown away each year. Over half is generated at the final consumption stage in food services (e.g., restaurants, school canteens) and households [8,9].
In Great Britain alone, the hospitality sector generated approximately 3 million tons of food waste, while in Scandinavia, over 0.45 million tons of food waste were generated in over a year [10]. Current estimations claim that Italian restaurants account for 21% of total food waste, whereas in Eastern Australia hotels, the amount of wasted food reaches 4377 tons daily [11]. The gastronomy sector of the United States of America produces nearly 16 million tons of food waste annually, constituting approximately 25.4% of the food supply chain [12]. The gastronomy and hospitality sector developments result in more intense waste production, which includes food waste that emerges from storage and food processing in catering places and on-site from the consumers as discarded food [11].
The solutions for food waste and food loss management play important roles in enhancing not only sustainable development and food safety but also environmental awareness related to the exploitation of natural resources, including water and soil. Simultaneously, waste production increases greenhouse gas (GHG) emissions, including biogenic gases, which contribute to greenhouse effects and climate change [13,14]. Everyday food waste materials are taken to landfills for disposal; however, their storage generates anoxic environments that affect greenhouse gas emissions, in particular methane and carbon dioxide. In Europe, food waste accounts for 15–16% of impacts on the whole food chain supply environment; additionally, it generates around 186 million tons of CO2 equivalent annually. Current estimations show that food waste is responsible for a 23% loss of purchased value [15].
In the last few decades, market globalization has induced the extension and sophistication of the food supply chain, which is directly connected with a greater distance between the producer and the consumer, a longer cold food chain (CFC), greater broker numbers, and increased food loss risks. Additional aspects involve increased demand and consumer expectations on product diversity and quality. Factors contributing to food loss and waste are presented in Table 1.
Emerging ideologies e.g., ‘zero waste’ create new perspectives for food waste management and its maximum usage, as well as minimization and its negative impact on the environment. Considerably significant limitations of food waste (as a key factor in terms of sustainable development for the hospitality sector and gastronomy) underline the unbalanced production system and food consumption. The development of innovative and environment-friendly technologies, using waste generated during the industrial production of frozen vegetables, facilitates the reduction of raw material losses and, thus, the rational management of natural resources. Vegetable waste and ‘outgrades’ generation is an impulse for the cooperation between scientific units and the industry.
The objective of the present study was to estimate the quality of full-valuable frozen vegetable outgrades and their potential appliances for the enrichment and preparation of ready-to-eat food products. The vegetable outgrades, which were supposed to be used in gastronomy, were prepared in the form of either multi-vegetable paste or formed multi-vegetable patties.
2. Materials and Methods
2.1. Materials
Fresh potatoes, frozen vegetables (carrot, onion), and frozen vegetable outgrades, considered as waste material from the industrial production of calibrated cauliflower and broccoli (40–60 mm) and beans (20–40 mm), were used for the experiment. Frozen vegetable outgrades included: cauliflower (5–20 mm; Dawid, Giewont cultivars), broccoli (5–20 mm; Larson, Portheon, Titanium cultivars), green beans (<20 mm; Rimember, Opportune cultivars), and yellow beans (<20 mm; Orinoko, Golden goal cultivars). Frozen vegetables were purchased from Unifreeze Sp. z o.o. (Miesiączkowo, Poland) company. Vegetable cultivars were especially selected for the industrial usage during frozen product manufacturing.
Fresh potatoes, fiber (bamboo, flax, apple), inulin, potato flour, wheat flour, salt, and spices were obtained from retail and used in the formation of vegetable patties and vegetable paste.
2.2. Physicochemical Analysis of Raw Materials, Paste, and Vegetable Patties
Dry matter content [19], fat content according to AOAC International (2000), total protein content according to the Kjeldahl method [19], ash content [19], and pH value by potentiometry were determined in vegetable outgrades and vegetables [20]. Dry matter content was determined using a Sartorius MA 40 dryer (Sartorius, Göttingen, Germany) for 180 min at 105 ± 2 °C. The determination of the total protein content according to the Kjeldahl method [19] was performed using a K−425 digestion oven (BÜCHI Labortechnik AG, Flawil, Switzerland) and a B−324 steam distiller (BÜCHI Labortechnik AG, Flawil, Switzerland). Fat content according to AOAC International (2000) was determined using a B−811 device (BÜCHI Labortechnik AG, Flawil, Switzerland). Determination of ash content was carried out [19] using a muffle furnace (type FCF22M model SM2002, CZYLOK, Jastrzębie-Zdrój, Poland) and pH value was determined by the potentiometric method using the CX−505 device (ELMETRON Sp.j., Zabrze, Poland) [20]. The dietary fiber content was determined by the enzymatic method of the Sigma-Aldrich TDF 100A test based on AOAC985.29 (1997).
In vegetables and vegetable outgrades, the content of ascorbic acid was determined [21]. The total polyphenol content was evaluated with the Folin–Ciocalteu method according to Singleton and Rossi [22] with Gao et al. [23] modifications. The results are expressed in gallic acid equivalents (GAE) per 100 g of vegetable sample weight (mg GAE/100 g).
Antioxidant activity determination (ABTS) was conducted according to Re et al. [24]. Preparation of the sample was carried out as described by Przygoński and Wojtowicz [25]. The obtained results are expressed in micromoles of Trolox equivalents per 100 g of vegetable sample weight (μmol Trolox/100 g).
2.3. Color Determination of Raw Materials
The color (CIE L*a*b*) was determined using a Konica Minolta CM−5 spectrophotometer, in accordance with the research methodology recommended by the device manufacturer. A D65 illuminant (daylight at noon), a standard colorimetric observer with a 10° field of view and a 30 mm aperture, were applied for color measurements. The following were also calculated:
L*—lightness (from 0 (black) to 100 (white)).
a*, b*: -a* (green), +a* (red); b*: -b* (blue), +b* (yellow).
The color saturation degree was C* and was determined according to the following equation [28]:
C* = [a2 + b2]0.5
Additionally, the hue (h) value [29], which determines the dominant wavelength in the spectrum of that color, was evaluated. In the CIE Lab system, hue was the angle formed by a straight line passing through the center of the system and a point with coordinates a*, b* with the axis a.
2.4. Texture Determination of Raw Materials
The texture analysis was conducted using a CT3 TA texture analyzer (Brookfield Ametek, Berwyn, PA, USA) by a compression test in the Ottawa chamber. Vegetables were placed up to 3/4 of the chamber height (40–42 g) and compressed with a steel probe (40 × 40 mm) to a 10 mm penetration depth. The applied trigger force load was 3.0 N and the probe speed was 1.0 mm/s. The maximum peak load occurring during the test cycle was considered as the hardness of a sample [30]. The samples were tested in triplicates. Measurement control and data processing were performed using the computer program TexturePro CT V 1.2 Build 9.
2.5. Development of Vegetable Patties
The formulation of vegetable patties (Table 2) was modeled considering the type and amount of vegetables in the final product as well as the degree of plant material preparation, so that the production process was easy and repeatable, while the product did not deform and disintegrate. The preparation process was done according to the methodology presented by the authors in the article on the usage of a model-forming device [31].
2.6. Development of Vegetable Paste
The vegetable paste compositions were vegetable outgrades: broccoli (35.0%), cauliflower (35.0%), cut beans—green (5.0%), yellow (5.0%), and fresh potato (20.0%). Frozen vegetable outgrades (−25 °C) were thawed to the temperature −1.5 °C ± 0.5° and taken for mechanical shredding (shredding device, Ø 4 mm). The temperature of vegetable pulp after shredding was in the range of −0.8 °C to −0.5 °C. Vegetable pulp together with water (22 °C) were put in a pasteurizing device (Technogel mixpasto110, Bergamo, Italy) to undergo mixing and pasteurization at +80 °C for 20 min.
2.7. Nutrient Density Profiles for Vegetable Patties and Paste
The following nutrient density models were chosen for the determination of profiling indicators for vegetable patties and vegetable paste (Table 3).
- Naturally nutrient rich score (NNR) defines to what extent the product (which covers the energy needs at the level of 2000 kcal) simultaneously covers the demand for 14 or 16 (extended version) nutrients [32],
- Nutrient adequacy score (NAS) indicates how good the sources of the selected 16 nutrients are 100 g of the edible parts of the products [33],
- Nutrient density score (NDS) presents the values for 100 kcal [34],
- Nutrient rich food index (NRF) extends the assessment of the nutritional density of the product by reducing the results by ingredients that are considered unfavorable; it is recommended to limit their consumption [35].
In the abovementioned models, foods that provide substantial amounts of nutrients are ranked higher, whereas foods that supply calories, but small amounts of nutrients, score lower.
Models and their variants take into account various sets of nutrients. Scores are comparable only within specific models (variants) [36,37,38,39,40,41].
Algorithms adopted:
- Naturally nutrient rich score (NNR)
NNR = Σ1–14((Nutrient/DV) × 100)/14
NNR = Σ1–16((Nutrient/DV) × 100)/16
- Nutrient rich food index (NRF)
NRn100 kcal = (Σ1–n (Nutrient/DV) × 100)/ED
LIM3100 kcal = (Σ1–n (Nutrient/DV) × 100)/ED
NRF n.3100 kcal = NRn100 kcal − LIM3100 kcal
- Nutrient adequacy score (NAS)
NAS = (Σ(Nutrient/DV) × 100)/16
- Nutrient density score (NDS)
NARn = Σ((Nutrient/DV) × 100)/n
NDSn = NARn/ED × 100
- DV (daily value)—daily average reference values of nutrients for adult men and women (18–59 years old) with low active lifestyles (sedentary).
- ED (energy density)—energy density; amount of energy available from mass units of food (kcal/100 g of edible parts).
- Nutrients—amount of nutrients (g, mg, or µg) in 100 g of edible parts of the product or provided by the product in 100 kcal portions.
2.8. Statistical Analysis
One-way analysis of variance (ANOVA) was performed, using Statistica® 10.0 PL software (StatSoft Poland Sp. z o.o., Krakow, Poland). Statistical significance was given as the p-value; differences at 95% confidence level (p < 0.05) were considered statistically important. The final results are expressed as mean values ± standard deviation.
3. Results and Discussion
3.1. Raw Material Quality Analysis
Vegetable outgrades and vegetables used as sources in this research were characterized by parameters presented in Table 4. Dietary guidelines suggest increased consumption of plant-based food, including fruits and vegetables, because they are excellent sources of bioactive phytochemicals [42].
The results prove that vegetables form, i.e., calibrated or shredded (outgrades), possess different levels of nutrients. The highest content of dry matter was observed for cut yellow beans (9–12 g/100 g) while the lowest value corresponded to cauliflower (approximately 6 g/100 g). The kind of plant material and the cultivar did not affect the pH (Table 4). According to the research, dry matter content in vegetable outgrades was lower in comparison to that identified in vegetables. This trend was also identified in protein, fiber, and ash content. The highest protein amount was found in broccoli, both outgrades and calibrated vegetables (2.30–3.13 g/100 g). The differences between dry matter content and biologically active compounds may originate from the specificity of plant material as well as its biodiversity or the cultivar. For example, the dry matter content of raw cauliflower with white florets was 8.42 g/100 g [43]. Lower dry matter values were obtained by Rutkowska et al. [44] (6.96–7.22%) and Gębczyński et al. [45] (7.3 g/100 g). Furthermore, a variable dry substance content in Romanesco cauliflower was reported by Florkiewicz [46] and Osińska et al. [47]. In studies conducted by Gajewski [48], the dry matter content in cauliflowers with green florets was equal to 9.1 g/100 g. The amount of fat in all investigated samples was very low, not exceeding 0.3 g/100 g.
Reis et al. [49] reported that organic cauliflower (Brassica oleracea var. Alphina) inflorescences dry matter content was equal to 7.77 g/100 g dry weight, which included 18.40 g/100 g proteins, 0.90 g/100 g fat, 11.37 g/100 g ash, 22.00 g/100 g carbohydrates, 46.00 g/100 g insoluble fiber, and 1.43 g/100 g soluble fiber. Lower contents of ash (9.19 g/100 g), carbohydrates (19.53 g/100 g), and total fiber (46.93 g/100 g) were observed in organic broccoli (Brassica oleracea var. Avenger) florets [49].
According to the definition by the American Association of Cereal Chemists (AACC) [50], the term ‘dietary fiber’ includes all the non-starch polysaccharides, such as celluloses, hemicelluloses, pectins, modified cellulose, polyfructans (inulin, oligofructans), indigestible dextrin, polydextrose, methylcellulose and hydroxypropyl methylcellulose (hypromellose, HPMC), resistant starch, gums, and mucilage. In the presented research, a variety of dietary fiber in vegetables was observed. The yellow bean Golden Goal cultivar contained 4.92 g fiber per 100 g while cauliflower Giewont cultivar contained 2.31 g fiber per 100 g (Table 4). From all examined vegetables, the highest content of fiber was observed in cut beans. It was found that the identified fiber content was not dependent of the form of analyzed vegetables. In the case of frozen vegetables, the quality and presence of bioactive compounds were of high importance, especially after the thermal processing (boiling, steaming, baking, frying, etc.).
Traditional cooking (boiling) contributed to the decrease in the total dietary fiber content in white cauliflower, cauliflower Romanesco type, broccoli, and Brussels sprouts [46]. In broccoli cooked by steam and sous-vide, and the white-floret cauliflower cooked with sous-vide, the increase of total dietary fiber content in comparison to fresh vegetables was observed.
Elkner et al. [51] proved that boiling carrots and beetroots increased the total dietary fiber content in the final products. Komolka et al. [52] claimed, as a result of thermal treatment, the content of dietary fiber changed both quantitatively and qualitatively. Vegetable type and the cultivar appeared to be important as well. According to the report by Komolka et al. [53], the preliminary thermal treatment applied to carrots and potatoes; boiling significantly influenced the changes of dietary fiber content in the product.
Regarding the water-boiling of carrots, it was found that in unpeeled (a) ones and peeled and shredded (b) ones, the content of fiber decreased compared to raw vegetables, whereas in peeled and non-shredded carrots, an increase in fiber content was observed.
Technological techniques impact the amount of bioactive compounds. The level of ascorbic acid (vitamin C) in plant material was various while comparing outgrades and vegetables of different cultivars. The highest amount (47.92 ÷ 86.77 mg/100 g dry matter) was found in broccoli while the lowest one (4.41 ÷ 11.51 mg/100 g dry matter) in green beans (Figure 1). Vegetable outgrades were characterized by significantly lower levels of ascorbic acid. This could be explained by technological conditions, including blanching, which strongly affects smaller vegetable parts, resulting in ascorbic acid reduction. Variations in ascorbic acid content in the range 44 ÷ 123 mg/100 g were also identified in the waste material of seven types of vegetables—beetroots, turnips, carrots, sweet potatoes, radishes, potatoes, and ginger [54].
In the research by Severini et al. [55], it was found that ascorbic acid content in raw broccoli was equal to 151.32 mg/100 g of dry matter and the blanching process in hot water and steam significantly decreased its level to 80.13 and 112.92 mg/100 g, respectively. The concentration of ascorbic acid in vegetables depends on their maturity, different growing conditions, soil conditions, and post-harvest storage [56]. Extended blanching time results in higher losses of ascorbic acid and nutrients from vegetables through washing out. Blanching by immersion in hot water causes even greater losses of ascorbic acid than steaming [57,58]. These losses should be taken into consideration when calculating the nutrient intake with the cooked broccoli diet [59,60].
On the contrary, microwave thermal treatment resulted in the increase of several organic compounds, such as glucosylans [61,62]. In the presented research, a similar trend was observed for polyphenols present in vegetables and the outgrades (Figure 2). The probable reason for this phenomenon is the biodiversity of raw materials and their individual characteristics. Polyphenols in the analyzed vegetables was the highest in broccoli, in particular Porthenon and Titanium cultivars. Broccoli outgrades (Larson and Portheon cultivars) were characterized by lower contents of polyphenols than vegetables. Interestingly, the amount of present polyphenols in green beans was higher in outgrades than in vegetables (but the differences were not statistically important).
According to Severini et al. [55] the content of polyphenols present in broccoli did not change significantly upon various thermal treatment time intervals. On the other hand, microwave blanching resulted in their moderate increase. Similar results were obtained in previous studies concerning green beans, pepper, and broccoli subjected to steam and microwave blanching. Such an increase in polyphenol content was explained by Stewart et al. [63] as the response of those compounds to heating.
Figure 3 represents the carotenoid profile of vegetables and vegetable outgrades. β-carotene dominates in broccoli while zeaxanthin dominates in green beans. Moreover, the presence of zeaxanthin in two broccoli cultivars (Portheon, Titanium) was not identified.
Thermal treatment, including cooking, might improve the availability of bioactive compounds [64,65,66,67,68]. In the study by Mazzeo et al. [67], the authors proved the increase of quercetin with a simultaneous decrease of kaempferol in steam-boiled cauliflower. Sikora et al. [68] analyzed the impacts of cooking on flavonoid content in different subspecies and cultivars of Brassicaceae family, including broccoli (Brassica oleracea var. Botrytis Italica cv. Sebastian), white cauliflower (B. oleracea var. Botrytis cv. Rober), and green cauliflower (B. oleracea var. Botrytis cv. Amphora). The content of quercetin and kaempferol in all analyzed vegetable inflorescences differed substantially. Moreover, fresh vegetable samples exhibited higher amounts of those bioactive compounds than boiled vegetables.
Reis et al. [49] claimed that in the case of broccoli, thermal treatment (sous-vide or microwave cooking) had a positive impact on the phenolic compound content when compared to fresh vegetables. Similar conclusions were made by Martínez-Hernández et al. [66].
In the case of cauliflower, the content of phenolic compounds after microwave cooking was similar to what was observed in fresh vegetables [49]. According to Mazzeo et al. [67], the analysis of polyphenol content in fresh, water-boiled, and steamed cauliflower proved that the steaming process results in a 17% increase of polyphenols. Similar research was conducted by Wachtel-Galor et al. [68] concerning fresh broccoli and cauliflower, steamed, and cooked in the microwave. The authors claimed that the highest level of polyphenols was observed for vegetable samples subjected to steaming. Zhang and Hamauzu [69] evaluated the content of carotenoids (lutein, vioxanthin, β-carotene) in broccoli (fresh and subjected to thermal treatment). It was found that only the lutein content increased while cooking had a negative effect on the total carotenoid content. Gębczynski and Kmiecik [63] showed that blanching caused a decrease in vitamin C content (by 21%) in white cauliflower and 26% in green cauliflower. Antioxidant activity decreased by 13% in both types of cauliflower, and dry matter content by about 10%. Carotenoid levels in the green type decreased by about 14%. These results are similar to those obtained for blanched broccoli [70,71,72].
The results obtained for the antioxidant activity of selected vegetables are presented in Figure 4. According to the ABTS+ method, vegetables possessed stronger antioxidant activity compared to outgrades, except for green bean Opportune and Rimember cultivars. For those two vegetables, the difference in ABTS+ test results was insignificant. The highest antioxidant potential (approximately 300 µM/100 g) was noted for broccoli Larson and Portheon cultivars.
In the study by Martínez-Hernández et al. [66], thermal treatment applied to broccoli, sous-vide, in particular, had increased antioxidant activity. Mazzeo et al. [67] observed a negative effect of traditional cooking and steaming on cauliflower inflorescences as the total antioxidant activity was lower than in fresh vegetables. Wachtel-Galor et al. [70] analyzed the antioxidant activities of fresh, water boiled, steamed, and microwave-cooked (5–10 min.) broccoli and cauliflower using the FRAP method. The authors observed the highest antioxidant activity for vegetables subjected to five minutes of steaming. Moreover, the longer the cooking time was, the lower the antioxidant activities of vegetables.
Fruits and vegetables are the main sources of bioactive compounds. In a majority of cases, waste and by-products generated by the food industry contain a similar or even higher content of antioxidant compounds [73,74].
An important feature of plant material is its color (Table 5).
The technological process for outgrade production, including blanching, shredding, and freezing, had no negative effect on its color. Vegetables and outgrade colors were similar and characteristic for each cultivar. As expected, cauliflower was characterized by the greater brightness, with the highest L* coefficient value. Samples of broccoli and green beans had typical green color characteristics for those vegetable types. Few identified differences in the broccoli Portheon cultivar coloring resulted from botanical properties.
The parametric analysis showed that the saturations of outgrade colors were similar or slightly stronger compared to vegetables. The variable measurement results could be explained by the natural vegetable colors, which originate from the presence of natural pigments in plant material tissues. The kind and concentration of pigments can change upon several factors, such as the plant cultivar, growing stage, or plant maturation. The basic pigments responsible for plant coloring include chlorophylls (green), carotenoids (yellow, orange, red), anthocyanins (red, blue), flavonoids (yellow), and betalains (red). Furthermore, enzymatic and non-enzymatic browning reactions induce the development of brown, grey, and black pigments. Industrial processes applied to vegetables and fruits also contribute to color changes. Chlorophylls are prone to heating and acids, however, their stability in alkaline environments remains unharmed. Carotenoids are susceptible to light and oxidation but they exhibit a moderate resistance to elevated temperatures. On the contrary, anthocyanins are sensitive to pH and temperature, whereas flavonoids remain prone to oxidation and are relatively stable in higher temperatures [75].
Technological processing involving thermal treatments influence vegetable coloring to various extents [76]. Literature data indicate that chlorophyll “a”, which is responsible for the green color in plants, possesses a low stability in increased temperatures [77,78,79]. Yuan et al. [80] observed that both cooking broccoli in hot water and in the microwave has a negative effect on chlorophyll content, resulting in its high losses, whereas steaming does not change chlorophyll content significantly. Additionally, fresh broccoli inflorescences exhibited greater brightness of L* parameters than after heating. Short boiling times in hot water caused an increase in the redness parameter (a*) resulting from intensification of red–green pigments.
On the contrary, green peas subjected to blanching were visually brighter compared to raw and frozen ones [81]. Lau et al. [82] reported an initial increase of the a* (redness) parameter in green asparagus heated up to 70–98 °C. Analogous results were obtained for broccoli blanched in hot water and steam [55]. Vegetable blanching processes change their colorings, but the degree of changes depends on the type of blanching. It was proven that vegetables blanched with steam exhibited less intense changes than vegetables blanched in hot water. According to Florkiewicz et al. [43], all analyzed cruciferous vegetables prepared via the sous-vide method had colors similar to raw vegetables, with the exception of cauliflower.
Simultaneously, the greatest color changes were noted for broccoli, cauliflower Romanesco type, and Brussels sprouts boiled in hot water, which probably resulted from negative chlorophyll transformations. Greve et al. [83] and Heaton and Marangoni [84] indicate that high temperatures during the hydrothermal treatments of green vegetables induced chlorophyll pigment degradation as well as plant tissue deformation, which facilitate the deterioration of a product’s structure. In the case of broccoli and cauliflower with white florets, all tested thermal treatments resulted in a decrease of brightness (L*) when compared to raw material samples. These results are consistent with research by Reis et al. [49], who observed a significant (p < 0.05) reduction of the L* parameter of broccoli and cauliflower after boiling, steaming, sous-vide, or microwave treatments.
3.2. Vegetable Patties and Paste Properties
The applied technological solutions, including the introduction or modification of technologies and practices, aim for the prevention of food wasting [31,85,86,87,88]. Current strategies and techniques for the prevention of food waste are the subjects of scientific research and gastronomy companies [10,11,89]. The activities implemented in selected gastronomy companies, i.e., identification systems and quantitative food waste measurements, resulted in an approximate 44% reduction of discarded food [90]. Eriksson et al. [91] conducted a data analysis, and obtained information from 735 hotels, restaurants, and canteens; they reported that due to monitoring systems for waste management, 61% of catering units reduced the amount of waste. Constantly growing awareness on food quality forces food producers to meet the requirements of customers (who are more demanding every year). To meet their needs, fruits and vegetables are carefully selected in order to supply the customers with products that are attractive (in terms of sensory and organoleptic features). The consequences of fruit and vegetable selections are waste and outgrades, which should be managed to avoid adverse effects on the environment and to minimize food wasting, in which there has been intense growth in recent years. Food waste is generated from various steps of the food production chain and food storage, from agricultural to household consumption. According to a WRAP Report [92], the reduction in food waste during the early preparation stage is equal to 45% and Sustainable Restaurant Association (SRA) [93] estimations claim that possible avoidance of food waste at this step could be 65%. Many catering units offer their customers seasonal menus that are rich in fruits, vegetables, and mushrooms, and are available only during certain seasons of the year. To maintain high standards of served food, frozen food is a great alternative to fresh and seasonal products. As crops are prepared and subjected to the freezing process immediately after harvesting, the preservation of their nutritional values is allowed. Thus, similarly to their fresh equivalents, they enrich the tastes and flavors of dishes. Vegetable blanching prior to packaging significantly accelerates the processing in the restaurant’s kitchen.
Manufacturers and producers are attempting to find new solutions for full usage of the available products, including post-production residues, which remain a great source of nutrients and health-promoting elements [94]. Special attention is paid to food product quality, especially in restaurants. Choosing low-quality products can result in great losses due to insufficient customer satisfaction. Apart from food quality, other key factors are the availability of resources and regular and on-time deliveries, which contribute to the profits of particular catering units.
Vegetable outgrades are reported to contain as many beneficial components as the original products and can be transformed into new functional types of food. Vegetable patties and vegetable pastes are examples of such solutions. New sources of dietary fiber, e.g., fruit and vegetable by-products, can serve as cheap and low-calorie substances used as food additives in the partial replacement of flour, fat, or sugar [95]. The majority of fruit and vegetable by-products possess very high nutritional values, which are useful in new product developments.
As a part of the BIOSTRATEG III project, technologies for the preparation of new full-valuable nutritional products (vegetable patties and vegetable pastes) were developed. Similar to the previous research [31], the recipe for both proposed products involved the use of vegetable outgrades (Table 6). Both vegetable patties and vegetable pastes appeared to be great sources of essential vitamins, minerals, proteins, and dietary fiber that contained low amounts of fat. They appeared to be attractive alternatives for meat-based products. On the dietary level, replacing a portion of meat in the daily diet could reduce the negative impact on the environment and simultaneously improve sustainable consumption [96,97,98].
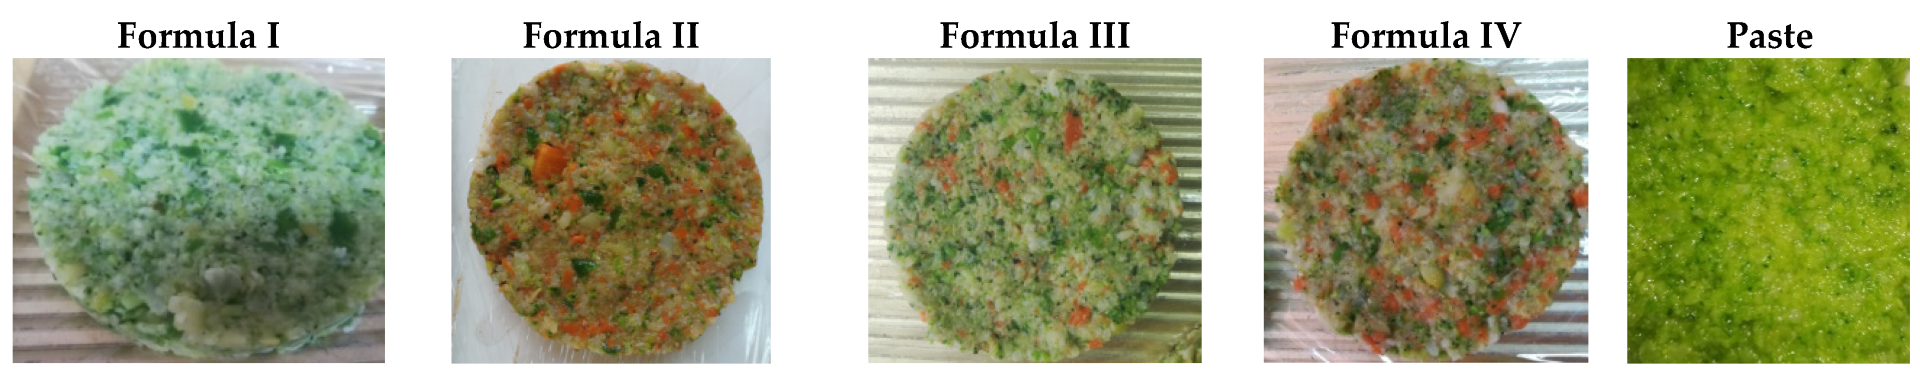
The technological preparation process involved the usage of vegetables and whole vegetable outgrades; therefore, the final products were perceived as visually attractive by the consumers (Figure 5).
Efficient meal serving in gastronomy can be greatly facilitated by the use of frozen fruits and vegetables. Apart from swift preparation, they allow serving dishes that require seasonal agriculture produce (independent of the season). Additionally, they retain the taste and nutritional values. Both vegetable patties and paste were found to be nutrient dense (Table 7).
Nutrient density is the key attribute in describing the nutritional quality of food and an essential concept in dietary guideline formulations [32]. In recent years, nutrient density has become the connecting factor between nutritional science and environmental aspects [39,40,41,99]. Nutritional quality, expressed as the content and quality of individual nutrients (i.e., quantity and quality of protein) or as a nutritional density assessment, is considered a promising approach to better represent the functions of food.
Different food groups contribute different nutrients to the total diet. Quantitative methods for the nutrient density assessment, implementing a range of models, are used in food profiling [32]. One objective of nutrient profiling (NP) is to identify and differentiate foods that are nutrient-rich from those of lesser nutritional value [36,39]. Calculations are based on 100 kcal, 100 g, or the serving size [35,100]. A healthy diet profile includes whole grain products, low fat dairy, fruits, vegetables, as well as a variety of protein foods, such as seafood, lean meats, poultry, eggs, legumes, nuts, seeds, and soy, along with healthy oils [38,40]. NP models provide the scientific basis for labeling information, health, and nutrition claims for different groups of consumers [101,102,103,104,105,106].
According to Sluik et al. [37], vegetables represent a food group with the highest NRF9.3 index score (Table 7). Food items that had the lowest NRF9.3 index scores were sugar, confectionary items, cakes, biscuits, condiments. and sauces.
Hess and Slavin’s research [107] regarding the comparison of the nutrient densities of popular snacks confirmed that vegetables and coffee/tea scored best in both NRF9.3 and NRF15.3 indices, while cakes/cookies/confectionary and sweets scored the lowest (Table 8). The NRF results can help the consumer identify more nutritious options. The differences between the results of NRF 9.3 and NRF 15.3 generated for the same food, and the limitations of these indices, underline the need to carefully consider which nutrient density profiling should be included in food labels, as well as the necessity for consumer education. Assigning food to a category based on its nutritional composition will allow consumers to identify and choose foods that are high in nutrients [32,39]. The nutrient density approach may find applications in nutritional policy making, nutrition labeling, health claims, marketing, and advertising. Nutrient profiling can also be used to monitor and improve the quality of products from large companies [108].
Outgrades as by-products of frozen vegetables may be utilized directly as snacks and salad ingredients without additional processing (shredding), in a paste form as a soup or sauce base, or shaped as vegetable patties. The multi-vegetable pastes and vegetable patties introduced as part of the BIOSTRATEG III project are interesting offers for mass catering, bars, and restaurants. Considering how difficult it is to foresee the amount of sales, the ready-to-eat pieces of vegetable patties or multi-vegetable paste units are attractive proposals for thoughtful meal planning/preparing dishes in a short time, and can contribute to minimizing the risk of product deficiency. Food banks report that the most common fresh food waste are salads and lettuce (40.9%). Cold or hot snacks (34.4%) and dishes made of potatoes and vegetables (34.2%) are less often discarded. Soups, broths, and sauces (20.2%), as well as flour products (25.8%) are the least wasted [11]. The losses may be reduced by employing outgrades and their premade dishes. Salads prepared from fresh ingredients and in advance are mostly defined as products of worse quality or are discarded after a whole day of storage in the workplace. Incorporating the proposed products in gastronomic practices may constitute an alternative for forward buying. According to the report by the Federation of Polish Food Banks, for the year 2020, more than 1/5 of restaurateurs (22%) bought products “in stock”. Over-stocking is also one of the main causes of food waste [11]. Having the gastronomic offer products from the outgrades may reduce the amount of waste. Products made of outgrades can lead to the utilization of fresh, perishable vegetables with hidden defects that are invisible at the time of delivery. According to the owners of gastronomic establishments, peelings, skins and other parts of vegetables and fruits that cannot be used in the kitchen are the most commonly thrown away [11,13]. The use of frozen outgrades in the form of ready-to-use vegetables or products (vegetable patties, paste) eliminates the steps of peeling and grinding with simultaneous workload reductions.
4. Summary and Conclusions
Food loss and waste takes place at every step of the global food value chain, from agricultural production to consumption. Consumption, including gastronomy and households, generates as much as 40% of total food losses. Thus, waste management has become a priority, relating to all activities connected with waste avoidance, reduction, or recycling along the entire production and consumption chain. The technologies for food waste management may prove beneficial for industries and gastronomy, significantly reducing water consumption, waste disposal, and energy costs, and improving access to healthy foods of high nutritional value. This research contributes to the control of the negative impacts of food production processing on climate change, together with the reduction of carbon dioxide emissions by the industry. Technology surrounding post-production outgrade utilization is a systemic solution that can potentially induce positive impacts on public health by increasing vegetable intake. According to the research, vegetable outgrades are valuable components of vegetable food products (vegetable patties and vegetable paste), with high nutrient densities. Products in this form fulfill the requirements of “clean label” trends, are attractive for the consumers, and constitute high nutritional components of healthy diets. Moreover, they provide the catering industry with wholesome products for versatile use in fast and easy handling forms. The results of the presented study can be put into practice for sustainable environmental and social development, to reduce agricultural and food waste.
Author Contributions
J.M.: conceptualization, data curation, validation, methodology, supervision, investigation, writing—original draft preparation, writing—review and editing. E.P.: conceptualization, supervision, writing—original draft preparation, writing—review and editing. A.D.: data curation, methodology, writing—original draft preparation. A.T.: data curation, methodology, writing—original draft preparation. All authors have read and agreed to the published version of the manuscript.
Funding
This research was funded by National Center for Research and Development, grant number BIOSTRATEG3/343817/17/NCBR/2018.
Institutional Review Board Statement
Not applicable.
Informed Consent Statement
Informed consent was obtained from all subjects involved in the study.
Data Availability Statement
Data are not publicly available, although the data may be made available upon request from the corresponding author.
Acknowledgments
The investigation results presented in this paper are part of the results obtained in a National Center for Research and Development (NCBR) project, as part of III BIOSTRATEG, entitled ‘The development of an innovative carbon footprint calculation method for the basic basket of food products’. The report was a task in the project ‘Development of healthy food production technologies taking into consideration nutritious food waste management and carbon footprint calculation methodology’, BIOSTRATEG3/343817/17/NCBR/2018.
Conflicts of Interest
The authors declare no conflict of interest.
References
- MacDonald, A.J. Minimizing Terminal Food Waste within the Food Supply Chain; Dalhousie University Halifax: Halifax, NS, Canada, 2019. [Google Scholar]
- Directive (EU) 2018/851 of the European Parliament and of the Council of 30 May 2018 amending Directive 2008/98/EC on waste. Off. J. Eur. Union. 2018, 14, L 150/109.
- Stenmarck, Â.; Jensen, C.; Quested, T.; Moates, G.; Buksti, M.; Cseh, B.; Juul, S.; Parry, A.; Politano, A.; Redlingshofer, B. Estimates of European Food Waste Levels; IVL Swedish Environmental Research Institute: Stockholm, Sweden, 2016. [Google Scholar]
- FAO. The State of Food and Agriculture 2019: Moving forward on Food Loss and Waste Reduction; FAO: Rome, Italy, 2019; pp. 2–13. [Google Scholar]
- Sagar, N.A.; Pareek, S.; Sharma, S.; Yahia, E.M.; Lobo, M.G. Fruit and vegetable waste: Bioactive compounds, their extraction and possible use. Compr. Rev. Food Sci. Food Saf. 2018, 17, 512–531. [Google Scholar] [CrossRef] [PubMed]
- Bilska, B.; Piecek, M.; Kołożyn-Krajewska, D.A. Multifaceted Evaluation of Food Waste in a Polish Supermarket—Case Study. Sustainability 2018, 10, 3175. [Google Scholar] [CrossRef]
- International Food Policy Research Institute. 2019 Global Food Policy Report; International Food Policy Research Institute: Washington, DC, USA, 2019. [Google Scholar]
- Fiore, M.; Pellegrini, G.; Sala, P.L.; Conte, A.; Liu, B. Attitude toward food waste reduction: The case of Italian consumers. Int. J. Glob. Small Bus. 2017, 9, 185–201. [Google Scholar] [CrossRef]
- Mc Carthy, U.; Uysal, I.; Badia-Melis, R.; Mercier, S.; O’Donnell, C.; Ktenioudaki, A. Global food security—Issues, challenges and technological solutions. Trends Food Sci. Technol. 2018, 77, 11–20. [Google Scholar] [CrossRef]
- Tomaszewska, M.; Bilska, B.; Tul-Krzyszczuk, A.; Kołożyn-Krajewska, D. Estimation of the Scale of Food Waste in Hotel Food Services—A Case Study. Sustainability 2021, 13, 421. [Google Scholar] [CrossRef]
- Bilska, B.; Tomaszewska, M.; Kołożyn-Krajewska, D. Managing the Risk of Food Waste in Foodservice Establishments. Sustainability 2020, 12, 2050. [Google Scholar] [CrossRef]
- Foodservice Food Waste Action Guide, ReFED—Rething Food Waste Through Economics and Data; ReFed: Long Island City, NY, USA, 2018.
- Jaglo, K.; Kenny, S.; Stephenson, J. Part 1 From Farm to Kitchen: The Environmental Impacts of U.S; Food Waste U.S. Environmental Protection Agency Office of Research and Development: Washington, DC, USA, 2021. [Google Scholar]
- Tonini, D.; Albizzati, P.F.; Astrup, T.F. Environmental impacts of food waste: Learnings and challenges from a case study on UK. Waste Manag. 2018, 76, 744–766. [Google Scholar] [CrossRef]
- Scherhaufer, S.; Moates, G.; Hartikainen, H.; Waldron, K.; Obersteiner, G. Environmental impacts of food waste in Europe. Waste Manag. 2018, 77, 98–113. [Google Scholar] [CrossRef]
- Priefer, C.; Jörissen, J.; Bräutigam, K.-R. Food waste prevention in Europe—A cause-driven approach to identify the most relevant leverage points for action. Resour. Conserv. Recycl. 2016, 109, 155–165. [Google Scholar] [CrossRef]
- Karczun, Z.; Kozyra, J. Impact of Climate Change on Poland's Food Security; Issue 1; Publishing SGGW: Warsaw, Poland, 2020. [Google Scholar]
- Rogala, A. Contemporary food consumption-trapped in the paradox of a postmodern world. J. Agribus. Rural Dev. 2015, 3, 513–520. [Google Scholar]
- Horwitz, W. AOAC International. Official Methods of Analysis of AOAC International, 17th ed.; Association of Analytical Communities: Gaithersburg, MD, USA, 2000. [Google Scholar]
- Technical Authority, Fruit and Vegetable Products PN-EN 1132:1999 Fruit and Vegetable Juices-Determination of the PH-Value; Polish Committee for Standardization: Warsaw, Poland, 2013.
- Technical Authority. Food Products-Determination of Vitamin C Content PN-A-04019:1998; Polish Committee for Standardization: Warsaw, Poland, 1998. [Google Scholar]
- Singleton, V.L.; Rossi, J.A. Colorimetry of total phenolics with phosphomolybdic-phosphotungstic acid reagents. Am. J. Enol. Vitic. 1965, 16, 144–153. [Google Scholar]
- Gao, X.; Ohlander, M.; Jeppson, N.; Bjork, L.; Trajkovski, V. Changes in Antioxidant Effect and Their Relationship to Phytonutrients in Fruit of Sea Buckthorn (Hippophae rhamnoides L.) during Maturation. J. Agric. Food Chem. 2000, 48, 1845–1890. [Google Scholar] [CrossRef]
- Przygoński, K.; Wojtowicz, E. The optimization of extraction process of white mulberry leaves and the characteristic bioactive properties its powder extract. Herba Pol. 2019, 65, 12–19. [Google Scholar] [CrossRef]
- Re, R.; Pellegrini, N.; Proteggente, A.; Pannala, A.; Yang, M.; Rice-Evans, C. Antioxidant activity applying an improved ABTS radical cation decolorization assay. Free Radic. Biol. Med. 1999, 26, 1231–1237. [Google Scholar] [CrossRef]
- Melendez-Martinez, A.J.; Stinco, C.M.; Liu, C.; Wang, X.-D. A simple HPLC method for the comprehensive analysis off cis/trans (Z/E) geometrical isomers of carotenoids for nutritional studies. Food Chem. 2013, 138, 1341–1350. [Google Scholar] [CrossRef]
- Mapelli-Brahm, P.; Corte-Real, J.; Meléndez, A.J.; Bohn, T. Bioaccessibility of phytoene and phytofluene is superior to other carotenoids from selected fruit and vegetable juices. Food Chem. 2017, 229, 309–311. [Google Scholar] [CrossRef]
- Dobrzańska, A.; Cais-Sokolińska, D. Assessment of the suitability of color measurement systems for testing milk and whey protein preparations. Res. Teach. Appar. 2014, 3, 267–272. [Google Scholar]
- Chudy, S.; Gierałtowska, U.; Krzywdzińska-Bartkowiak, M.; Piątek, M. Color measurement of products. In Contemporary Trends in Shaping the Quality of Food; Piasecka-Kwiatkowska, D., Cegielska-Radziejewska, R., Eds.; Faculty of Food Sciences and Nutrition, Poznan University of Life Sciences: Poznan, Poland, 2016; pp. 85–95. [Google Scholar]
- Nishinari, K.; Kohyama, K.; Kumagai, H.; Funami, T.; Bourne, M.C. Parameters of Texture Profile Analysis. Food Sci. Technol. Res. 2013, 19, 519–521. [Google Scholar] [CrossRef]
- Wróbel-Jędrzejewska, M.; Markowska, J.; Bieńczak, A.; Woźniak, P.; Ignasiak, Ł.; Polak, E.; Kozłowicz, K.; Różyło, R. Carbon Footprint in Vegeburger Production Technology Using a Prototype Forming and Breading Device. Sustainability 2021, 13, 9093. [Google Scholar] [CrossRef]
- Drewnowski, A. Concept of a nutritious food: Toward a nutrient density score. Am. J. Clin. Nutr. 2005, 82, 721–732. [Google Scholar] [CrossRef] [PubMed]
- Darmon, N.; Darmon, M.; Maillot, M.; Drewnowski, A. A Nutrient Density Standard for Vegetables and Fruits: Nutrients per Calorie and Nutrients per Unit Cost. J. Am. Diet. Assoc. 2005, 105, 1881–1887. [Google Scholar] [CrossRef] [PubMed]
- Maillot, M.; Darmon, N.; Darmon, M.; Lafay, L.; Drewnowski, A. Nutrient-Dense Food Groups Have High Energy Costs: An Econometric Approach to Nutrient Profiling. J. Nutr. 2007, 137, 1815–1820. [Google Scholar] [CrossRef] [PubMed]
- Fulgoni, V.L.; Keast, D.R.; Drewnowski, A. Development and Validation of the Nutrient-Rich Foods Index: A Tool to Measure Nutritional Quality of Foods. J. Nutr. 2009, 139, 1549–1554. [Google Scholar] [CrossRef] [Green Version]
- Drewnowski, A.; Fulgoni, V. L. Nutrient density: Principles and evaluation tools. Am. J. Clin. Nutr. 2014, 99, 1223S–1228S. [Google Scholar] [CrossRef]
- Sluik, D.; Streppel, M.; Van Lee, L.; Geelen, A.; Feskens, E. Evaluation of a nutrient-rich food index score in the Netherlands. J. Nutr. Sci. 2015, 4, E14. [Google Scholar] [CrossRef]
- U.S. Department of Health Human Services. U.S. Department of Agriculture. Dietary Guidelines for Americans 2015–2020, 8th ed.; US Department of Agriculture and US Department of Health and Humans Services: Washington, DC, USA, 2015. [Google Scholar]
- Drewnowski, A. Uses of nutrient profiling to address public health needs: From regulation to reformulation. Proc Nutr Soc. 2017, 76, 220–229. [Google Scholar] [CrossRef]
- World Health Organization; WHO Regional Office for Europe. Nutrient Profile Model; World Health Organization: Geneva, Switzerland, 2015; pp. 1–7. Available online: https://www.euro.who.int/__data/assets/pdf_file/0005/270716/Nutrient-children_web-new.pdf (accessed on 1 February 2021).
- Drewnowski, A.; Fulgoni, V. Nutrient profiling of foods: Creating a nutrient-rich food index. Nutr. Rev. 2008, 66, 23–39. [Google Scholar] [CrossRef]
- Rao, A.V.; Rao, L.G. Carotenoids and human health. Pharmacol. Res. 2007, 55, 205–207. [Google Scholar] [CrossRef]
- Florkiewicz, A.; Bączkowicz, M.; Pietrzyk, S. Sensory Quality of Brassica Vegetables Cooked by Sous-Vide and Traditional Hydrothermal Processing Techniques. Food Sci. Technol. Qual. 2018, 25, 150–171. [Google Scholar]
- Rutkowska, G. Testing the suitability of new cauliflower varieties for freezing. Refrigeration 1997, 32, 40–41. [Google Scholar]
- Gębczyński, P.; Kmiecik, W. Effects of traditional and modified technology, in the production of frozen cauliflower, on the contents of selected antioxidative compounds. Food Chem. 2007, 101, 229–235. [Google Scholar] [CrossRef]
- Florkiewicz, A. Sous-vide Method as Alternative to Traditional Cooking of Cruciferous Vegetables in the Context of Reducing Losses of Nutrients and Dietary Fibre. Food Sci. Technol. Qual. 2018, 25, 45–57. [Google Scholar]
- Osińska, M.; Kołota, E.; Biesiadna, A.; Michalak, K.; Bednarz, E. Possibilities of growing green rose cauliflower in Poland. In Proceedings of the 2nd National Symposium New Plants and Technologies in Horticulture; Academy of Agriculture Publishing House: Poznań, Poland, 1996; pp. 203–207. [Google Scholar]
- Gajewski, M. Effect of controlled atmosphere on the quality of cauliflower with green roses. Folia Horticult. Ann. 2001, 13, 267–272. [Google Scholar]
- dos Reis, L.C.R.; de Ruffo, O.V.; Kienzle, H.E.M.; Jabłoński, A.; Hickmann, F.S.; Riosa, A.O. Carotenoids, flavonoids, chlorophylls, phenolic compounds and antioxidant activity in fresh and cooked broccoli (Brassica oleracea var. Avenger) and cauliflower (Brassica oleracea var. Alphina F1). LWT Food Sci. Technol. 2015, 63, 177–183. [Google Scholar] [CrossRef]
- American Association of Cereal Chemist (AACC). The definition of dietary fiber. CFW 2001, 46, 112–129. [Google Scholar]
- Elkner, K. Effect of heat treatment method on the physical and chemical properties of dietary fiber of carrots and beets. Acta Agrobot. 2001, 54, 151–159. [Google Scholar] [CrossRef]
- Komolka, P.; Górecka, D.; Dziedzic, K. The effect of thermal processing of cruciferous vegetables on their content of dietary fiber and its fraction. Acta Sci. Pol. Technol. Aliment. 2012, 11, 347–354. [Google Scholar]
- Komolka, P.; Górecka, D.; Dudziak, M. The effect of thermal processing of carrot and potato on their content of dietary fiber and its fractions. Technol. Prog. Food Process. 2014, 2, 51–55. [Google Scholar]
- Khattak, K.F.; Rahman, T.U. Analysis of vegetable’s peels as a natural source of vitamins and minerals. Int. Food Res. J. 2017, 24, 292–297. [Google Scholar]
- Severini, C.; Giuliani, R.; De Filippis, A.; Derossi, A.; De Pilli, T. Influence of different blanching methods on colour, ascorbic acid and phenolics content of broccoli. J. Food Sci. Technol. 2016, 53, 501–510. [Google Scholar] [CrossRef]
- Podsedek, A.; Sosnowska, D.; Redzynia, M.; Anders, B. Antioxidant capacity and content of Brassica oleracea dietary antioxidants. Int. J. Food Sci. Technol. 2006, 41, 49–58. [Google Scholar] [CrossRef]
- Arroqui, C.; Rumsey, T.R.; Lopez, A.; Virseda, P. Effect of differentsoluble solids in the water on the ascorbic acid losses during blanching of potato tissue. J. Food Eng. 2001, 47, 123–126. [Google Scholar] [CrossRef]
- Vallejo, F.; Tomas-Barberan, F.A.; Garcia-Viguera, C. Glucosinolates and vitamin C content in edible parts of broccoli florets after domestic cooking. Eur. Food Res. Technol. 2002, 215, 310–316. [Google Scholar]
- Liu, J.J.; Bi, D.J.; McClements, X.; Liu, J.; Yi, J.L. Impacts of thermal and non-thermal processing on structure and functionality of pectin in fruit-and vegetable-based products: A review. Carbohydr. Polym. 2020, 250, 116890. [Google Scholar] [CrossRef]
- Palermo, M.; Pellegrini, N.; Fogliano, V. The effect of cooking on the phytochemical content of vegetables J. Sci. Food Agric. 2014, 94, 1057–1070. [Google Scholar] [CrossRef]
- Verkerk, R.; Dekker, M. Glucosinolate and myrosinase activity in red cabbage (Brassica oleracea L. Var. Capitata f. rubra DC.) after different microwave treatments. J. Agric. Food Chem. 2004, 52, 7318–7323. [Google Scholar]
- Oerlemans, C.; Barett, D.M.; Bosh, S.C.; Verkerk, R.; Dekker, M. Thermal degradation of glucosinolates in red cabbage. Food Chem. 2006, 95, 19–29. [Google Scholar] [CrossRef]
- Stewart, A.J.; Bozonnet, S.; Mullen, W.; Jenkins, G.I.; Michael, E.J.; Crozier, A. Occurrence of flavonols in tomatoes and tomato-based products. J. Agric. Food Chem. 2000, 48, 2663–2669. [Google Scholar] [CrossRef]
- Gębczyński, P. Content of selected antioxidative compounds in green asparagus depending on processing before freezing and on the period and conditions of storage. Pol. J. Food Ntr. Sci. 2007, 57, 209–214. [Google Scholar]
- Martínez-Hernández, G.B.; Artés-Hernández, F.; Gómez, P.A.; Artés, F. Induced changes in bioactive compounds of kailan-hybrid broccoli after innovative processing and storage. J. Funct. Foods 2013, 5, 33–43. [Google Scholar] [CrossRef]
- Martínez-Hernández, G.B.; Artés-Hernández, F.; Gómez, P.A.; Artés, F. Innovative cooking techniques for improving the overall quality of a kailanhybrid broccoli. Food Bioprocess. Technol. 2013, 6, 2135–2149. [Google Scholar] [CrossRef]
- Mazzeo, T.; N'Dri, D.; Chiavaro, E.; Visconti, A.; Fogliano, V.; Pellegrini, N. Effect of two cooking procedures on phytochemical compounds, total antioxidant capacity and colour of selected frozen vegetables. Food Chem. 2011, 28, 627–633. [Google Scholar] [CrossRef]
- Wachtel-Galor, S.; Wong, K.W.; Benzie, I.F.F. The effect of cooking on Brassica vegetables. Food Chem. 2008, 110, 706–710. [Google Scholar] [CrossRef]
- Zhang, D.; Hamauzu, Y. Phenolics, ascorbic acid, carotenoids and antioxidant activity of broccoli and their changes during conventional and microwave cooking. Food Chem. 2004, 88, 503–509. [Google Scholar] [CrossRef]
- Barret, D.M.; Garcia, E.L.; Russel, G.F.; Ramirez, E.; Shirazi, A. Blanch time and cultivar effects on quality of frozen and stored corn and broccoli. J. Food Sci. 2000, 65, 534–540. [Google Scholar] [CrossRef]
- Sikora, E.; Cieślik, E.; Filipiak-Florkiewicz, A.; Leszczyńska, T. Effect of hydrothermal processing on phenolic acids and flavonols contents in selected brassica vegetables. Acta Sci. Pol. Technol. Aliment. 2012, 11, 45–51. [Google Scholar]
- Gębczyński, P. Quantitative changes of selected chemical components during freezing and storage of primary and secendary broccoli inflorescences. Acta Sci. Pol. Technol. Aliment. 2003, 2, 31–39. [Google Scholar]
- Trombino, S.; Cassano, R.; Procopio, D.; Di Gioia, M.L.; Barone, E. Valorization of Tomato Waste as a Source of Carotenoids. Molecules 2021, 26, 5062. [Google Scholar] [CrossRef]
- Silva, L.M.R.; Figueiredo, E.A.T.; Ricardo, N.M.P.S.; Vieira, I.G.P.; Figueiredo, R.W.; Brasil, I.M.; Gomes, C.L. Quantification of bioactive compounds in pulps and by-products of tropical fruits from Brazil. Food Chem. 2014, 143, 398–404. [Google Scholar] [CrossRef]
- Clydesdale, F.M.; Francis, F.J. Principles of Food Science, Part I. In Food Chemistry; Fennema, O.R., Ed.; Marcel Dekker: New York, NY, USA, 1976. [Google Scholar]
- Krokida, M.K.; Tsami, E.; Maroulis, Z.B. Kinetics on color changes drying of some fruits and vegetables. Dry Technol. 1998, 16, 667–685. [Google Scholar] [CrossRef]
- Sweeney, J.P.; Martin, M.E. Stability of chlorophyll in vegetables as affected by pH. Food Technol. 1961, 15, 263–266. [Google Scholar]
- Buckle, K.A.; Edwards, R.A. Chlorophyll colour and pH changes in HTST processed green pea puree. J. Food Technol. 1970, 5, 173–178. [Google Scholar] [CrossRef]
- Steet, J.A.; Tong, C.H. Degradation kinetics of green color and chlorophylls in peas by colorimetry and HPLC. J. Food Sci. 1996, 61, 924–927. [Google Scholar] [CrossRef]
- Yuan, G.F.; Sun, B.; Yuan, J.; Wang, Q.M. Effects of different cooking methods on health-promoting compounds of broccoli. J. Zhejiang Univ. Sci. B 2009, 10, 580–588. [Google Scholar] [CrossRef]
- Lin, S.; Brewer, M.S. Effects of blanching method on the quality characteristics of frozen peas. J. Food Qual. 2005, 28, 350–360. [Google Scholar] [CrossRef]
- Lau, M.H.; Tang, J.; Swanson, B.G. Kinetics of textural and color changes in green asparagus during thermal treatments. J. Food Eng. 2000, 45, 231–236. [Google Scholar] [CrossRef]
- Greve, L.C.; Shackel, K.A.; Ahmadi, H.; McArdle, R.N.; Gohlke, J.M.; Labavitch, J.M. Impact of heating on carrot firmness: Contribution of cellular Turgor. J. Agric. Food Chem. 1994, 42, 2896–2899. [Google Scholar] [CrossRef]
- Heaton, J.W.; Marangoni, A.G. Chlorophyll degradation in processed foods and senescent plant tissues. Trends Food Sci. Technol. 1996, 7, 8–15. [Google Scholar] [CrossRef]
- Devaney, L.; Davies, A.R. Disrupting household food consumption through experimental HomeLabs: Outcomes, connections, contexts. J. Consum. Cult. 2017, 17, 823–844. [Google Scholar] [CrossRef]
- Lim, V.; Funk, M.; Marcenaro, L.; Regazzoni, C.; Rauterberg, M. Designing for action: An evaluation of Social Recipes in reducing food waste. Int. J. Hum. Comput. Stud. 2017, 100, 18–32. [Google Scholar] [CrossRef]
- Young, W.; Russell, S.V.; Robinson, C.A.; Barkemeyer, R. Can social media be a tool for reducing consumers’ food waste? A behaviour change experiment by a UK retailer, Resour. Conserv. Recycl. 2017, 117, 195–203. [Google Scholar] [CrossRef]
- Williamson, S.; Block, L.G.; Keller, P.A. Of waste and waists: The effect of plate material on food consumption and waste. J. Assoc. Consum. Res. 2016, 1, 147–160. [Google Scholar] [CrossRef]
- Eriksson, M.; Osowski, C.P.; Malefors, C.; Björkman, J.; Eriksson, E. Quantification of food waste in public catering services—A case study from a Swedish municipality. Waste Manag. 2017, 61, 415–422. [Google Scholar] [CrossRef]
- Beretta, C.; Hellweg, S. Potential environmental benefits from food waste prevention in the food service sector Resources, Conserv. Recycl. 2019, 147, 169–178. [Google Scholar] [CrossRef]
- Eriksson, M.; Malefors, C.; Callewaert, P.; Hartikainen, H.; Pietiläinen, O.; Strid, I. What gets measured gets managed—Or does it? Connection between food waste quantification and food waste reduction in the hospitality sector. Resour. Conserv. Recycl. 2019, 10, 4. [Google Scholar] [CrossRef]
- Overview of Waste in the UK Hospitality and Food Service Sector; WRAP: Oxon, UK, 2013.
- Sustainable Restaurant Association (SRA). Too Good to Waste: Restaurant Food Waste Survey Report; SRA: London, UK, 2010. [Google Scholar]
- Baiano, A. Recovery of Biomolecules from Food Wastes—A Review. Molecules 2014, 19, 14821–14842. [Google Scholar] [CrossRef]
- Rodriguez, G.; Moreno, L.A. Is dietary intake able to explain differences in body fatness in children and adolescents? Nutr. Metab. Cardiovasc. Dis. 2006, 16, 294–301. [Google Scholar] [CrossRef]
- Schanes, K.; Dobernig, K.; Gözet, B. Food waste matters-A systematic review of household food waste practices and their policy implications. J. Clean. Prod. 2018, 182, 978–991. [Google Scholar] [CrossRef]
- Borsato, E.; Tarolli, P.; Marinello, F. Sustainable patterns of main agricultural products combining different footprint parameters. J. Clean. Prod. 2018, 179, 357–367. [Google Scholar] [CrossRef]
- KOBiZE. National Center for Balancing and Management of Emissions-Calorific Values (CO) and CO2 Emission Factors (EC) in 2011 to be Reported under the Community Emission Trading Scheme. Warsaw, Poland. 2013. Available online: https://www.kobize.pl/ (accessed on 1 February 2021).
- Drewnowski, A. What’s next for nutrition labeling and health claims: An update of nutrient profiling in the European Union and the US. Nutr Today 2007, 42, 206–214. [Google Scholar] [CrossRef]
- Drewnowski, A.; Maillot, M.; Darmon, N. Should nutrient profiles be based on 100 g, 100 kcal or serving size? Eur. J. Clin. Nutr. 2009, 63, 898–904. [Google Scholar] [CrossRef] [PubMed]
- Péneau, J.C.S.; Buscail, C.; Gonzalez, R.; Touvier, M.; Hercberg, S.; Guyot, E.; Julia, C. Perception of different formats of front-of-pack nutrition labels according to sociodemographic, lifestyle and dietary factors in a French population: Cross sectional study among the NutriNet-Santé cohort participants. BMJ Open 2017, 7, 016108. [Google Scholar]
- Pan American Health Organization Nutrient Profile Model. Pan American Health Organization Nutrient Profile Model; PAHO: Washington, DC, USA, 2016. [Google Scholar]
- Dickie, S.; Woods, J.L.; Lawrence, M. Analysing the use of the Australian Health Star Rating system by level of food processing. Int. J. Behav. Nutr. Phys. Act 2018, 15, 128. [Google Scholar] [CrossRef]
- L’Abbé, M.R.; Dumais, L.; Chao, E.; Junkins, B. Health claims on foods in Canada. J. Nutr. 2008, 138, 1221S–1227S. [Google Scholar] [CrossRef]
- Vlassopoulos, A.; Masset, G.; Charles, V.R.; Hoover, C.; Chesneau-Guillemont, C.; Leroy, F.; Lehmann, U.; Spieldenner, J.; Tee, E.-S.; Gibney, M.; et al. A nutrient profiling system for the (re)formulation of a global food and beverage portfolio. Eur. J. Nutr. 2017, 56, 1105–1122. [Google Scholar] [CrossRef]
- Masset, G.; Mathias, K.C.; Vlassopoulos, A.; Mölenberg, F.; Lehmann, U.; Gibney, M.; Problemu Instytut Ochrony, M. Modeled dietary impact of pizza reformulations in US children and adolescents. PLoS ONE 2016, 11, 0164197. [Google Scholar] [CrossRef]
- Hess, J.M.; Slavin, J.L. Healthy Snacks: Using Nutrient Profiling to Evaluate the Nutrient-Density of Common Snacks in the United States. J. Food Sci. 2017, 82, 2213–2220. [Google Scholar] [CrossRef]
- Nijman, C.A.J.; Zijp, I.M.; Sierksma, A.; Roodenburg, A.J.C.; Leenen, R.; Van den Kerkhoff, C.; Weststrate, J.A.; Meijer, G.W. A method to improve the nutritional quality of foods and beverages based on dietary recommendations. Eur. J. Clin. Nutr. 2006, 61, 461–471. [Google Scholar] [CrossRef] [Green Version]
Figure 1.
The content of ascorbic acid (vitamin C) in vegetables and outgrades. Mean values with different letters (a, b, c, d, e, f) in the row are statistically different (p-value < 0.5).
Figure 1.
The content of ascorbic acid (vitamin C) in vegetables and outgrades. Mean values with different letters (a, b, c, d, e, f) in the row are statistically different (p-value < 0.5).

Figure 2.
The content of polyphenolic compounds in vegetables and outgrades. Mean values with different letters (a, b, c) in the row are statistically different (p-value < 0.5).
Figure 2.
The content of polyphenolic compounds in vegetables and outgrades. Mean values with different letters (a, b, c) in the row are statistically different (p-value < 0.5).

Figure 3.
The content of carotenoids in vegetables and outgrades. Mean values with different letters (a, b, c) in the row are statistically different (p-value < 0.5).
Figure 3.
The content of carotenoids in vegetables and outgrades. Mean values with different letters (a, b, c) in the row are statistically different (p-value < 0.5).

Figure 4.
Antioxidant activities of vegetables and outgrades. Mean values with different letters (a, b, c) in the row are statistically different (p-value < 0.5).
Figure 4.
Antioxidant activities of vegetables and outgrades. Mean values with different letters (a, b, c) in the row are statistically different (p-value < 0.5).

Figure 5.
A photographic representation of vegetable patties and vegetable paste.


| Food Supply Chain Stages | Factors |
|---|---|
| Agricultural production |
|
| Manufacturing |
|
| Distribution and wholesale/retail |
|
| Hospitality industry |
|
| Households |
|
Table 2.
The compositions of vegetable patties.
| Ingredients | Formula | |||
|---|---|---|---|---|
| I | II | III | IV | |
| Content [%] | ||||
| Potatoes | 0.0 | 9.0 | 10.0 | 10.0 |
| Bean (green/yellow) * | 30.0 | 26.0 | 24.0 | 22.0 |
| Broccoli * | 26.0 | 22.0 | 25.0 | 25.0 |
| Cauliflower * | 26.0 | 22.0 | 25.0 | 25.0 |
| Carrot | 0.0 | 13.0 | 8.0 | 8.0 |
| Onion * | 8.0 | 0.0 | 0.0 | 1.0 |
| Potato flour | 3.0 | 3.0 | 4.0 | 4.0 |
| Wheat flour type 500 t | 3.0 | 0.0 | 0.0 | 0.0 |
| Bamboo fiber | 3.0 | 0.0 | 0.0 | 0.0 |
| Flax fiber | 0.0 | 3.0 | 1.5 | 0.0 |
| Apple fiber | 0.0 | 0.0 | 1.5 | 0.0 |
| Inulin | 0.0 | 0.0 | 0.0 | 4.0 |
| Salt | 0.9 | 0.8 | 0.9 | 0.8 |
| Spices | 0.1 | 0.2 | 0.1 | 0.2 |
* Vegetable outgrades.
Table 3.
Summary of the selected models of nutrient density profiling.
| Model | Variants | Nutrients Covered by the Model | Characteristics of the Model | |||
|---|---|---|---|---|---|---|
| Macronutrients | Vitamins | Minerals | Nutrients to Limit | |||
| NNR | - | Protein, monounsaturated fatty acids,fiber | A, C, D, E, B1, B6, B12, folate/folic acid, B5 | Ca, Fe, Zn, K | - | Arithmetic mean based on 14 nutrients in 8368 kJ (2000 kcal) and truncated at 2000% DV for respective nutrients; the version with 16 nutrients adds vit. B5 and fiber |
| NRF | NRF6 (n = 6) | Protein, fiber | A, C | Ca, Fe | - | Arithmetic mean of %DV for n nutrients; based on nutrient content in 418 kJ (100 kcal) portion; NRn, nutrient-rich score based on n desirable nutrients (n depends on the subindex); LIM3, limited nutrient score, consists of three nutrients to limit |
| NRF9 (n = 9) | Protein, fiber | A, C, E | Ca, Fe, Mg, K | - | ||
| NRF11 (n = 11) | Protein, fiber | A, C, D, E, B12 | Ca, Fe, Mg, Zn, K | - | ||
| NRF15 (n = 15) | Protein, fiber monounsaturated fatty acids (MUFA) | A, C, D, E, thiamin, riboflavin, B12, folate | Ca, Fe, Zn, K | - | ||
| LIM3- | - | - | - | Saturated fatty acids (SFA), total sugar, Na | ||
| - | - | - | - | - | ||
| NAS | - | Protein, fiber | A, C, D, E, thiamin, riboflavin, B6, B12, niacin, folate, pantothenic acid | Ca, Fe, Mg | - | Mean of %DV for 16 nutrients in 100 g of edible parts |
| NDS | NDS5 (n = 5) | Protein, fiber | C | Ca, Fe | - | Index based on calculations for nutrients in 418 kJ (100 kcal) portion. NARn, nutrient adequacy ratio for n nutrients |
| NDS6 (n = 6) | Protein, fiber | A,C | Ca, Fe | - | ||
| NDS9 (n = 9) | Protein, fiber | A,C,E | Ca, Fe, Mg, K | - | ||
| NDS16 (n = 16) | Protein, fiber | A, C, D, E, thiamin, riboflavin, niacin, pantothenic acid, B6, B12, folate | Ca, Fe, Mg | - | ||
Table 4.
Physicochemical parameters of vegetable outgrades and vegetables.
| (A) Physicochemical Parameters of Broccoli and its Cultivars | |||||||||
|---|---|---|---|---|---|---|---|---|---|
| Parameter | Broccoli | ||||||||
| Cultivars | |||||||||
| Larson | Portheon | Titanium | |||||||
| Outgrades | Vegetables | Outgrades | Vegetables | Outgrades | Vegetables | ||||
| Dry matter | g/100 g | 7.85 ± 0.07 b | 8.10 ± 0.14 b | 7.70 ± 0.04 ab | 8.85 ± 0.07 d | 7.25 ± 0.21 ac | 7.70 ± 0.14 ab | ||
| Fat | 0.16 ± 0.02 a | 0.17 ± 0.00 a | 0.24 ± 0.01 b | 0.27 ± 0.02 c | 0.23 ± 0.02 b | 016 ± 0.02 a | |||
| Protein | 2.52 ± 0.01 a | 2.82 ± 0.01 d | 2.58 ± 0.01 c | 3.13 ± 0.01 e | 2.50 ± 0.02 a | 2.30 ± 0.02 b | |||
| Fiber | 2.50 ± 0.02 a | 2.88 ± 0.01 c | 2.78 ± 0.01 bc | 3.47 ± 0.01 d | 2.74 ± 0.04 b | 2.56 ± 0.03 a | |||
| Ash | 0.46 ± 0.05 a | 0.70 ± 0.05 e | 0.34 ± 0.01 b | 0.40 ± 0.02 c | 0.54 ± 0.01 d | 0.47 ± 0.01 a | |||
| Carbohydrates * | 1.20 | 1.54 | 1.76 | 1.58 | 1.24 | 2.21 | |||
| Total acidity | 0.16 ± 0.01 a | 0.16 ± 0.01 a | 0.16 ± 0.02 a | 0.16 ± 0.01 a | 0.17 ± 0.02 a | 0.17 ± 0.01 a | |||
| pH | - | 6.05 ± 0.02 a | 6.07 ± 0.01 a | 6.08 ± 0.01 a | 6.08 ± 0.01 a | 6.08 ± 0.02 a | 6.08 ± 0.02 a | ||
| Hardness | N | 22.73 ± 4.43 a | 41.3 ± 6.53 b | 20.81 ± 3.97 a | 34.42 ± 2.30 c | 28.47 ± 4.09 c | 32.03 ± 3.76 c | ||
| (B) Physicochemical Parameters of Cauliflower and its Cultivars | |||||||||
| Parameter | Cauliflower | ||||||||
| Cultivars | |||||||||
| Dawid | Giewont | ||||||||
| Outgrades | Vegetables | Outgrades | Vegetables | ||||||
| Dry matter | g/100 g | 5.95 ± 0.05 b | 6.20 ± 0.02 a | 6.05 ± 0.07 b | 6.05 ± 0.07 b | ||||
| Fat | 0.20 ± 0.01 a | 0.18 ± 0.01 a | 0.19 ± 0.01 a | 0.18 ± 0.01 a | |||||
| Protein | 1.94 ± 0.02 a | 2.02 ± 0.02 a | 2.00 ± 0.03 a | 2.00 ± 0.01 a | |||||
| Fiber | 2.35 ± 0.03 a | 2.32 ± 0.04 a | 2.43 ± 0.06 a | 2.31 ± 0.03 a | |||||
| Ash | 0.56 ± 0.01 a | 0.55 ± 0.01 a | 0.45 ± 0.02 b | 0.62 ± 0.01 c | |||||
| Carbohydrates * | 0.89 | 1.13 | 0.98 | 0.94 | |||||
| Total acidity | 0.10 ± 0.02 a | 0.10 ± 0.01 a | 0.10 ± 0.01 a | 0.10 ± 0.01 a | |||||
| pH | - | 5.85 ± 0.03 a | 5.89 ± 0.02 a | 5.90 ± 0.02 a | 5.95 ± 0.02 a | ||||
| Hardness | N | 22.05 ± 4.46 a | 37.92 ± 2.36 b | 21.87 ± 1.22 a | 30.99 ± 1.07 c | ||||
| (C) Physicochemical Parameters of the Beans and its Cultivars | |||||||||
| Parameter | Yellow Beans | Green Beans | |||||||
| Cultivars | |||||||||
| Orinoko | Golden Goal | Rimember | Opportune | ||||||
| Outgrades | Vegetables | Outgrades | Vegetables | Outgrades | Vegetables | Outgrades | Vegetables | ||
| Dry matter | g/100 g | 9.25 ± 0.21 a | 10.25 ± 0.07 c | 9.65 ± 0.21 b | 11.25 ± 0.07 d | 9.65 ± 0.21 a | 10.35 ± 0.21 b | 6.65 ± 0.21 c | 7.95 ± 0.21 d |
| Fat | 0.07 ± 0.01 a | 0.06 ± 0.01 a | 0.06 ± 0.01 a | 0.08 ± 0.01 a | 0.06 ± 0.01 a | 0.06 ± 0.01 a | 0.04 ± 0.00 a | 0.05 ± 0.00 a | |
| Protein | 2.20 ± 0.01 a | 2.16 ± 0.01 a | 2.00 ± 0.01 b | 2.30 ± 0.01 c | 2.08 ± 0.03 a | 2.34 ± 0.01 b | 1.41 ± 0.01 c | 1.76 ± 0.01 d | |
| Fiber | 3.49 ± 0.03 a | 3.71 ± 0.03 b | 3.60 ± 0.01 ab | 4.92 ± 0.05 c | 4.40 ±0.04 a | 4.63 ± 0.06 c | 2.93 ± 0.03 b | 3.16 ±0.04 d | |
| Ash | 0.75 ± 0.04 c | 0.63 ± 0.04 b | 0.50 ± 0.03 a | 0.43 ± 0.02 a | 0.43 ± 0.03 a | 0.65 ± 0.02 b | 0.57 ± 0.03 b | 0.57 ± 0.02 b | |
| Carbohydrate * | 2.74 | 3.69 | 3.49 | 4.02 | 2.68 | 2.64 | 1.70 | 2.41 | |
| Total acidity | 0.11 ± 0.01 a | 0.11 ± 0.01 a | 0.13 ± 0.02 a | 0.11 ± 0.01 a | 0.16 ± 0.02 a | 0.17 ± 0.01 a | 0.16 ± 0.01 a | 0.16 ± 0.01 a | |
| pH | - | 6.34 ± 0.01 a | 6.35 ± 0.01 a | 6.39 ± 0.01 a | 6.39 ± 0.01 a | 6.10 ± 0.02 a | 6.09 ± 0.01 a | 6.11 ± 0.01 a | 6.12 ± 0.01 a |
| Hardness | N | 15.37 ± 2.33 a | 23.98 ± 4.45 b | 13.75 ± 1.28 a | 21.44 ± 0.77 b | 16.26 ± 1.10 a | 21.39 ± 4.10 b | 17.03 ± 1.00 a | 20.52 ± 3.32 b |
(A)—* carbohydrates (dry matter–protein–ash–fat–fiber); ni—not identified. Values are expressed as means (n = 3) ± standard deviations. Mean values with different letters (a, b, c, d, e) in the row are statistically different (p-value < 0.5); (B)—* carbohydrates (dry matter–protein–ash–fat–fiber), ni—not identified. Values are expressed as means (n = 3) ± standard deviations. Mean values with different letters (a, b, c) in the row are statistically different (p-value < 0.5); (C)—* carbohydrates (d.m.–protein–ash–fat–fiber), ni—not identified. Values are expressed as means (n = 3) ± standard deviations. Mean values with different letters (a, b, c, d) in the row are statistically different (p-value < 0.5).
Table 5.
Color parameters of vegetable outgrades and vegetables.
| (A) Color Parameters of Broccoli and its cultivars | ||||||||
| Parameter | Broccoli | |||||||
| Cultivars | ||||||||
| Larson | Portheon | Titanium | ||||||
| Outgrades | Vegetables | Outgrades | Vegetables | Outgrades | Vegetables | Outgrades | Vegetables | |
| Florets with Buds | Florets with Buds | Florets with Buds | ||||||
| Green Part | Yellow Part | |||||||
| L* | 39.25 ± 0.15 a | 40.65 ± 1.78 a | 38.90 ± 0.09 a | 38.90 ± 0.50 a | 58.85 ± 0.24 b | 62.25 ± 1.40 b | 39.87 ± 0.99 a | 40.27 ± 2.40 a |
| a* | −5.72 ± 0.25 ab | −5.73 ± 0.63 ab | −7.00 ± 0.96 ac | −6.29 ± 0.39 abc | −5.18 ± 0.73 bd | −4.15 ± 0.31 d | −7.67 ± 0.26 c | −5.49 ± 0.45 abd |
| b* | 8.43 ± 0.46 a | 10.27 ± 1.37 a | 9.82 ± 1.77 a | 11.39 ± 1.18 a | 27.84 ± 0.64 b | 34.85 ± 2.64 c | 11.95 ± 0.55 a | 10.37 ± 2.27 a |
| C* | 10.19 ± 0.44 a | 11.77 ± 1.37 a | 12.06 ± 1.96 a | 13.02 ± 1.23 a | 28.32 ± 0.76 b | 35.10 ± 2.59 c | 14.20 ± 0.59 a | 11.75 ± 2.16 a |
| h | 124.18 ± 1.55 ab | 119.30 ± 3.07 ab | 125.62 ± 2.12 b | 118.99 ± 0.98 a | 100.51 ± 1.24 c | 96.84 ± 1.03 c | 122.70 ± 0.40 ab | 118.40 ± 4.23 a |
| Stems | ||||||||
| L* | 61.21 ± 1.99 b | 64.38 ± 2.65 b | 66.23 ± 1.57 b | 62.25 ± 1.40 b | 66.23 ± 1.57 b | 62.25 ± 1.40 b | 53.12 ± 2.34 a | 54.62 ± 0.38 a |
| a* | −3.75 ± 0.75 b | −2.34 ± 0.84 b | −3.44 ± 0.15 b | −4.15 ± 0.31 a | −3.44 ± 0.15 b | −4.15 ± 0.31 a | −9.09 ± 0.49 c | −8.62 ± 1.34 c |
| b* | 21.86 ± 0.70 a | 20.15 ± 0.91 a | 21.06 ± 0.24 a | 34.85 ± 2.64 b | 21.06 ± 0.24 a | 34.85 ± 2.64 b | 23.04 ± 0.89 a | 20.62 ± 1.27 a |
| C* | 22.19 ± 0.77 a | 20.30 ± 0.84 a | 21.34 ± 0.26 a | 35.10 ± 2.59 b | 21.34 ± 0.26 a | 35.10 ± 2.59 b | 25.05 ± 1.00 c | 22.36 ± 1.67 ac |
| h | 99.71 ± 1.77 a | 96.68 ± 2.54 a | 99.28 ± 0.30 a | 96.84 ± 1.03 a | 99.28 ± 0.30 a | 96.84 ± 1.03 a | 111.25 ± 0.31 b | 112.60 ± 2.09 b |
| (B) Color parameters of cauliflower and its cultivars | ||||||||
| Parameter | Cauliflower | |||||||
| cultivars | ||||||||
| Dawid | Giewont | |||||||
| outgrades | vegetables | outgrades | vegetables | |||||
| Florets | ||||||||
| L* | 71.32 ± 0.76 a | 79.52 ± 1.31 b | 73.53 ± 0.38 a | 80.58 ± 1.13 b | ||||
| a* | −2.23 ± 0.18 a | −1.73 ± 0.28 ab | −1.16 ± 0.32 bc | −0.62 ± 0.28 c | ||||
| b* | 18.51 ± 0.22 ab | 20.49 ± 1.49 a | 15.60 ± 0.74 b | 21.01 ± 1.35 a | ||||
| C* | 18.65 ± 0.20 ab | 20.57 ± 1.47 a | 15.65 ± 0.72 b | 21.02 ± 1.35 a | ||||
| h | 96.97 ± 0.14 c | 94.87± 1.09 a | 94.28 ± 1.32 ab | 91.69 ± 0.73 a | ||||
| Stems | ||||||||
| L* | 70.30 ± 0.46 b | 73.80 ± 1.15 a | 76.33 ± 0.90 a | 74.36 ± 1.89 a | ||||
| a* | −3.25 ± 0.31 a | −2.80 ± 0.10 a | −2.09 ± 0.06 b | −1.59 ± 0.02 c | ||||
| b* | 16.36 ± 0.31 c | 12.64 ± 0.28 b | 14.03 ± 0.33 a | 14.82 ± 0.79 a | ||||
| C* | 16.68 ± 0.34 c | 12.95 ± 0.26 b | 14.18 ± 0.32 a | 14.91 ± 0.78 a | ||||
| h | 101.24 ± 0.97 a | 102.51 ± 0.68 a | 98.46 ± 0.41 c | 96.13 ± 0.33 b | ||||
| (C) Color parameters of the beans and its cultivars | ||||||||
| Parameter | Yellow Beans | Green Beans | ||||||
| cultivars | ||||||||
| Orinoko | Golden Goal | Rimember | Opportune | |||||
| outgrades | vegetables | outgrades | vegetables | outgrades | vegetables | outgrades | vegetables | |
| L* | 61.30 ± 1.00 b | 64.56 ± 1.47 a | 66.97 ± 0.95 c | 64.52 ± 0.64 a | 34.49 ± 1.33 b | 32.54 ± 1.26 b | 44.86 ± 0.80 a | 45.14 ± 2.29 a |
| a* | −0.94 ± 0.44 a | −1.45 ± 0.18 ab | −2.41 ± 0.42 c | −0.86 ± 0.35 a | −12.89 ± 0.87 a | −12.65 ± 0.27 a | −9.71 ± 0.63 b | −9.07 ± 1.26 b |
| b* | 41.45 ± 3.37 c | 30.09 ± 0.63 b | 26.19 ± 0.76 a | 28.96 ± 0.49 b | 20.39 ± 2.00 a | 19.07 ± 0.35 a | 15.59 ± 0.89 b | 14.99 ± 2.66 b |
| C* | 41.46 ± 3.36 c | 30.13 ± 0.63 b | 26.80 ± 0.75 a | 28.98 ± 0.49 ab | 24.13 ± 2.11 b | 22.88 ± 0.43 b | 18.37 ± 1.07 b | 17.53 ± 2.91 b |
| h | 90.89 ± 0.93 a | 92.75 ± 0.33 b | 95.17 ± 0.95 c | 91.71 ± 0.69 ab | 122.37 ± 1.21 a | 123.57 ± 0.27 a | 121.89 ± 0.59 a | 121.41 ± 1.67 a |
(A)—Values are expressed as means (n = 3) ± standard deviations. Mean values with different letters (a, b, c) in the row are statistically different (p-value < 0.5); (B)—Values are expressed as means (n = 3) ± standard deviations. Mean values with different letters (a, b, c) in the row are statistically different (p-value < 0.5); (C)—Values are expressed as means (n = 3) ± standard deviations. Mean values with different letters (a, b, c) in the row are statistically different (p-value < 0.5).
Table 6.
Parameters of prepared vegetable patties and vegetable paste.
| Parameter | Formula I | Formula II | Formula III | Formula IV | Paste |
|---|---|---|---|---|---|
|
Fat (g/100 g) | 0.32 ± 0.02 | 0.50 ± 0.03 | 0.28 ± 0.03 | 0.20 ± 0.05 | 0.09 ± 0.02 |
|
Protein (g/100 g) | 2.28 ± 0.04 | 2.70 ± 0.03 | 2.41 ± 0.44 | 2.02 ± 0.03 | 1.37 ± 0.02 |
|
Fiber (g/100 g) | 4.90 ± 0.05 | 3.55 ± 0.07 | 3.62 ± 0.05 | 5.51 ± 0.05 | 1.70 ± 0.01 |
|
Total carbohydrates (g/100 g) * | 6.93 | 5.19 | 8.40 | 7.80 | 3.99 |
*—carbohydrates (dry matter–protein–ash–fat–fiber); Values are expressed as means (n = 3) ± standard deviations.
Table 7.
Results of the algorithms for the selected nutrient profiling methods.
| Model | Paste | Vegetable Patty Formula | |||
|---|---|---|---|---|---|
| I | II | III | IV | ||
| Naturally nutrient rich score (NNR) | |||||
| NNR14 | 491.73 | 323.59 | 417.38 | 366.43 | 364.96 |
| NNR16 | 474.50 | 337.10 | 410.72 | 364.38 | 382.27 |
| Nutrient-rich foods (NRF) | |||||
| NRF6.3 | 203.46 | 122.68 | 180.58 | 146.86 | 163.69 |
| NRF9.3 | 247.01 | 150.24 | 210.80 | 175.69 | 192.58 |
| NRF11.3 | 254.70 | 156.30 | 216.93 | 181.36 | 198.21 |
| NRF15.3 | 348.07 | 220.52 | 276.74 | 239.64 | 256.39 |
| Nutrient adequacy score (NAS) | |||||
| NAS | 7.22 | 9.22 | 10.69 | 10.10 | 10.41 |
| Nutrient density score (NDS) | |||||
| NDS5 | 36.70 | 28.53 | 25.81 | 25.30 | 28.02 |
| NDS6 | 33.31 | 25.06 | 35.03 | 29.65 | 31.96 |
| NDS9 | 28.29 | 21.05 | 27.65 | 23.84 | 25.42 |
| NDS16 | 24.66 | 17.51 | 21.19 | 18.37 | 19.76 |
| Food Groups | Mean Index Scores | ||
|---|---|---|---|
| NR9 | NRF9.3 | NRF15.3 | |
| Potatoes and tubers | 56.9 | 53.6 | - |
| Potatoes | - | 35.0 | 43.0 |
| Vegetables | 224.7 | 193.1 | - |
| Onion | - | 126.0 | - |
| Lettuce | - | 226.0 | 302.0 |
| Whole fruit | - | 44.0 | 51.0 |
| Fruits, nuts and olives | 72.8 | 51.2 | - |
| Fruit juice | - | 128.0 | 144.0 |
| Fruit drinks | - | 39.0 | 41.0 |
| Ice cream | - | -8.0 | 14.0 |
| Milk desserts | - | -11.0 | 13.0 |
| Cereal products | 28.7 | 7.4 | - |
| Meat and meat products | 52.6 | −0.2 | - |
| Beef | - | 10.0 | 67.0 |
| Total fish | 69.4 | 25.4 | - |
| Eggs and egg products | 87.5 | 48.7 | - |
| Fats | 41.3 | 6.4 | - |
| Sugar and confectionery products | 14.1 | −13.4 | - |
| Cake, cookies and biscuits | 20.0 | −10.1 | - |
Publisher’s Note: MDPI stays neutral with regard to jurisdictional claims in published maps and institutional affiliations. |
© 2022 by the authors. Licensee MDPI, Basel, Switzerland. This article is an open access article distributed under the terms and conditions of the Creative Commons Attribution (CC BY) license (https://creativecommons.org/licenses/by/4.0/).
Share and Cite
MDPI and ACS Style
Markowska, J.; Polak, E.; Drabent, A.; Tyfa, A. Innovative Management of Vegetable Outgrades as a Means of Food Loss and Waste Reduction. Sustainability 2022, 14, 12363. https://0-doi-org.brum.beds.ac.uk/10.3390/su141912363
AMA Style
Markowska J, Polak E, Drabent A, Tyfa A. Innovative Management of Vegetable Outgrades as a Means of Food Loss and Waste Reduction. Sustainability. 2022; 14(19):12363. https://0-doi-org.brum.beds.ac.uk/10.3390/su141912363
Chicago/Turabian StyleMarkowska, Joanna, Elżbieta Polak, Anna Drabent, and Agnieszka Tyfa. 2022. "Innovative Management of Vegetable Outgrades as a Means of Food Loss and Waste Reduction" Sustainability 14, no. 19: 12363. https://0-doi-org.brum.beds.ac.uk/10.3390/su141912363
Note that from the first issue of 2016, this journal uses article numbers instead of page numbers. See further details here.