

Technical Feasibility Assessment for a Novel Fifth-Generation District Heating Model of Interconnected Operation with a Large-Scale Building

Abstract
:1. Introduction
2. Model Description
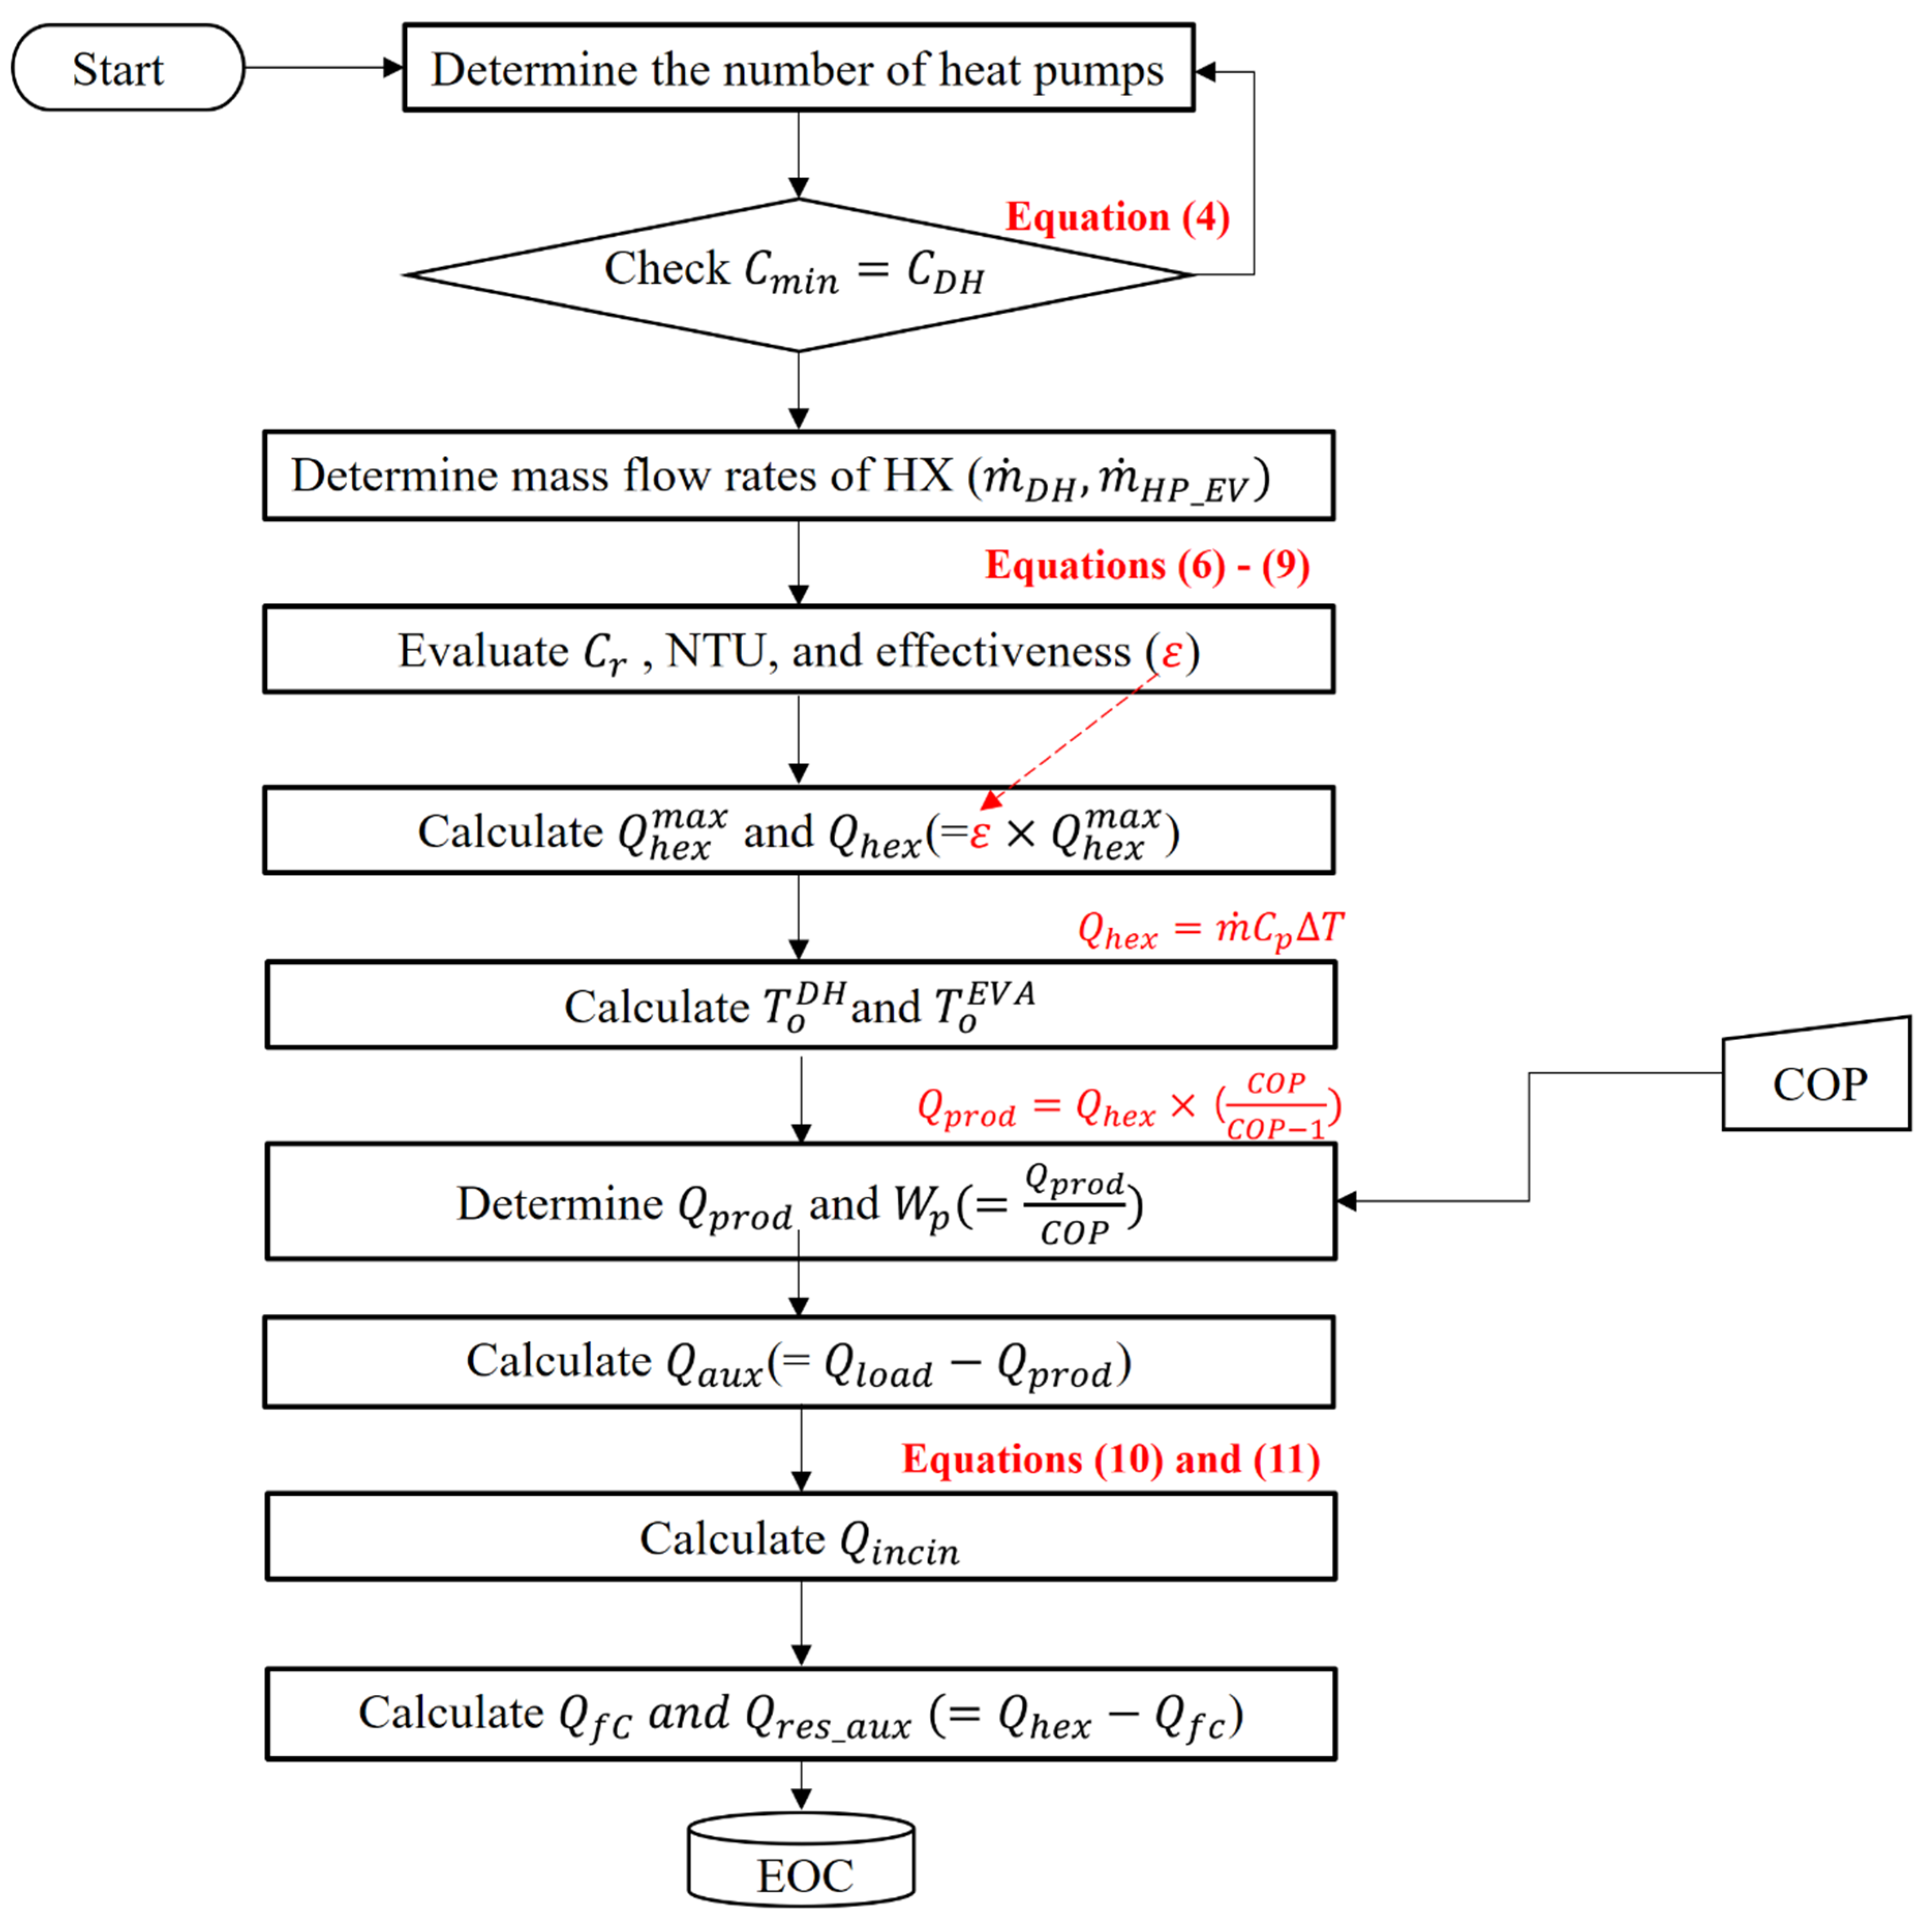
2.1. Modeling of Heat Pump System
2.2. Modeling of Heat Trade Process
3. Operation Simulation and Performance Analysis
3.1. Building Load Forecasting
3.2. Operational Simulation of BHT Process
3.2.1. Operational Mode I: Heat Load Tracing Operation (HLTO) Mode
3.2.2. Operational Mode II: Power Load Tracing Operation (PLTO) Mode
4. Discussions
5. Conclusions
- Compared to the stand-alone model of the FC CGS for the building, the proposed model of interactive operation with the DHN can provide a more flexible technical environment to improve the system utilization rate by about 40%.
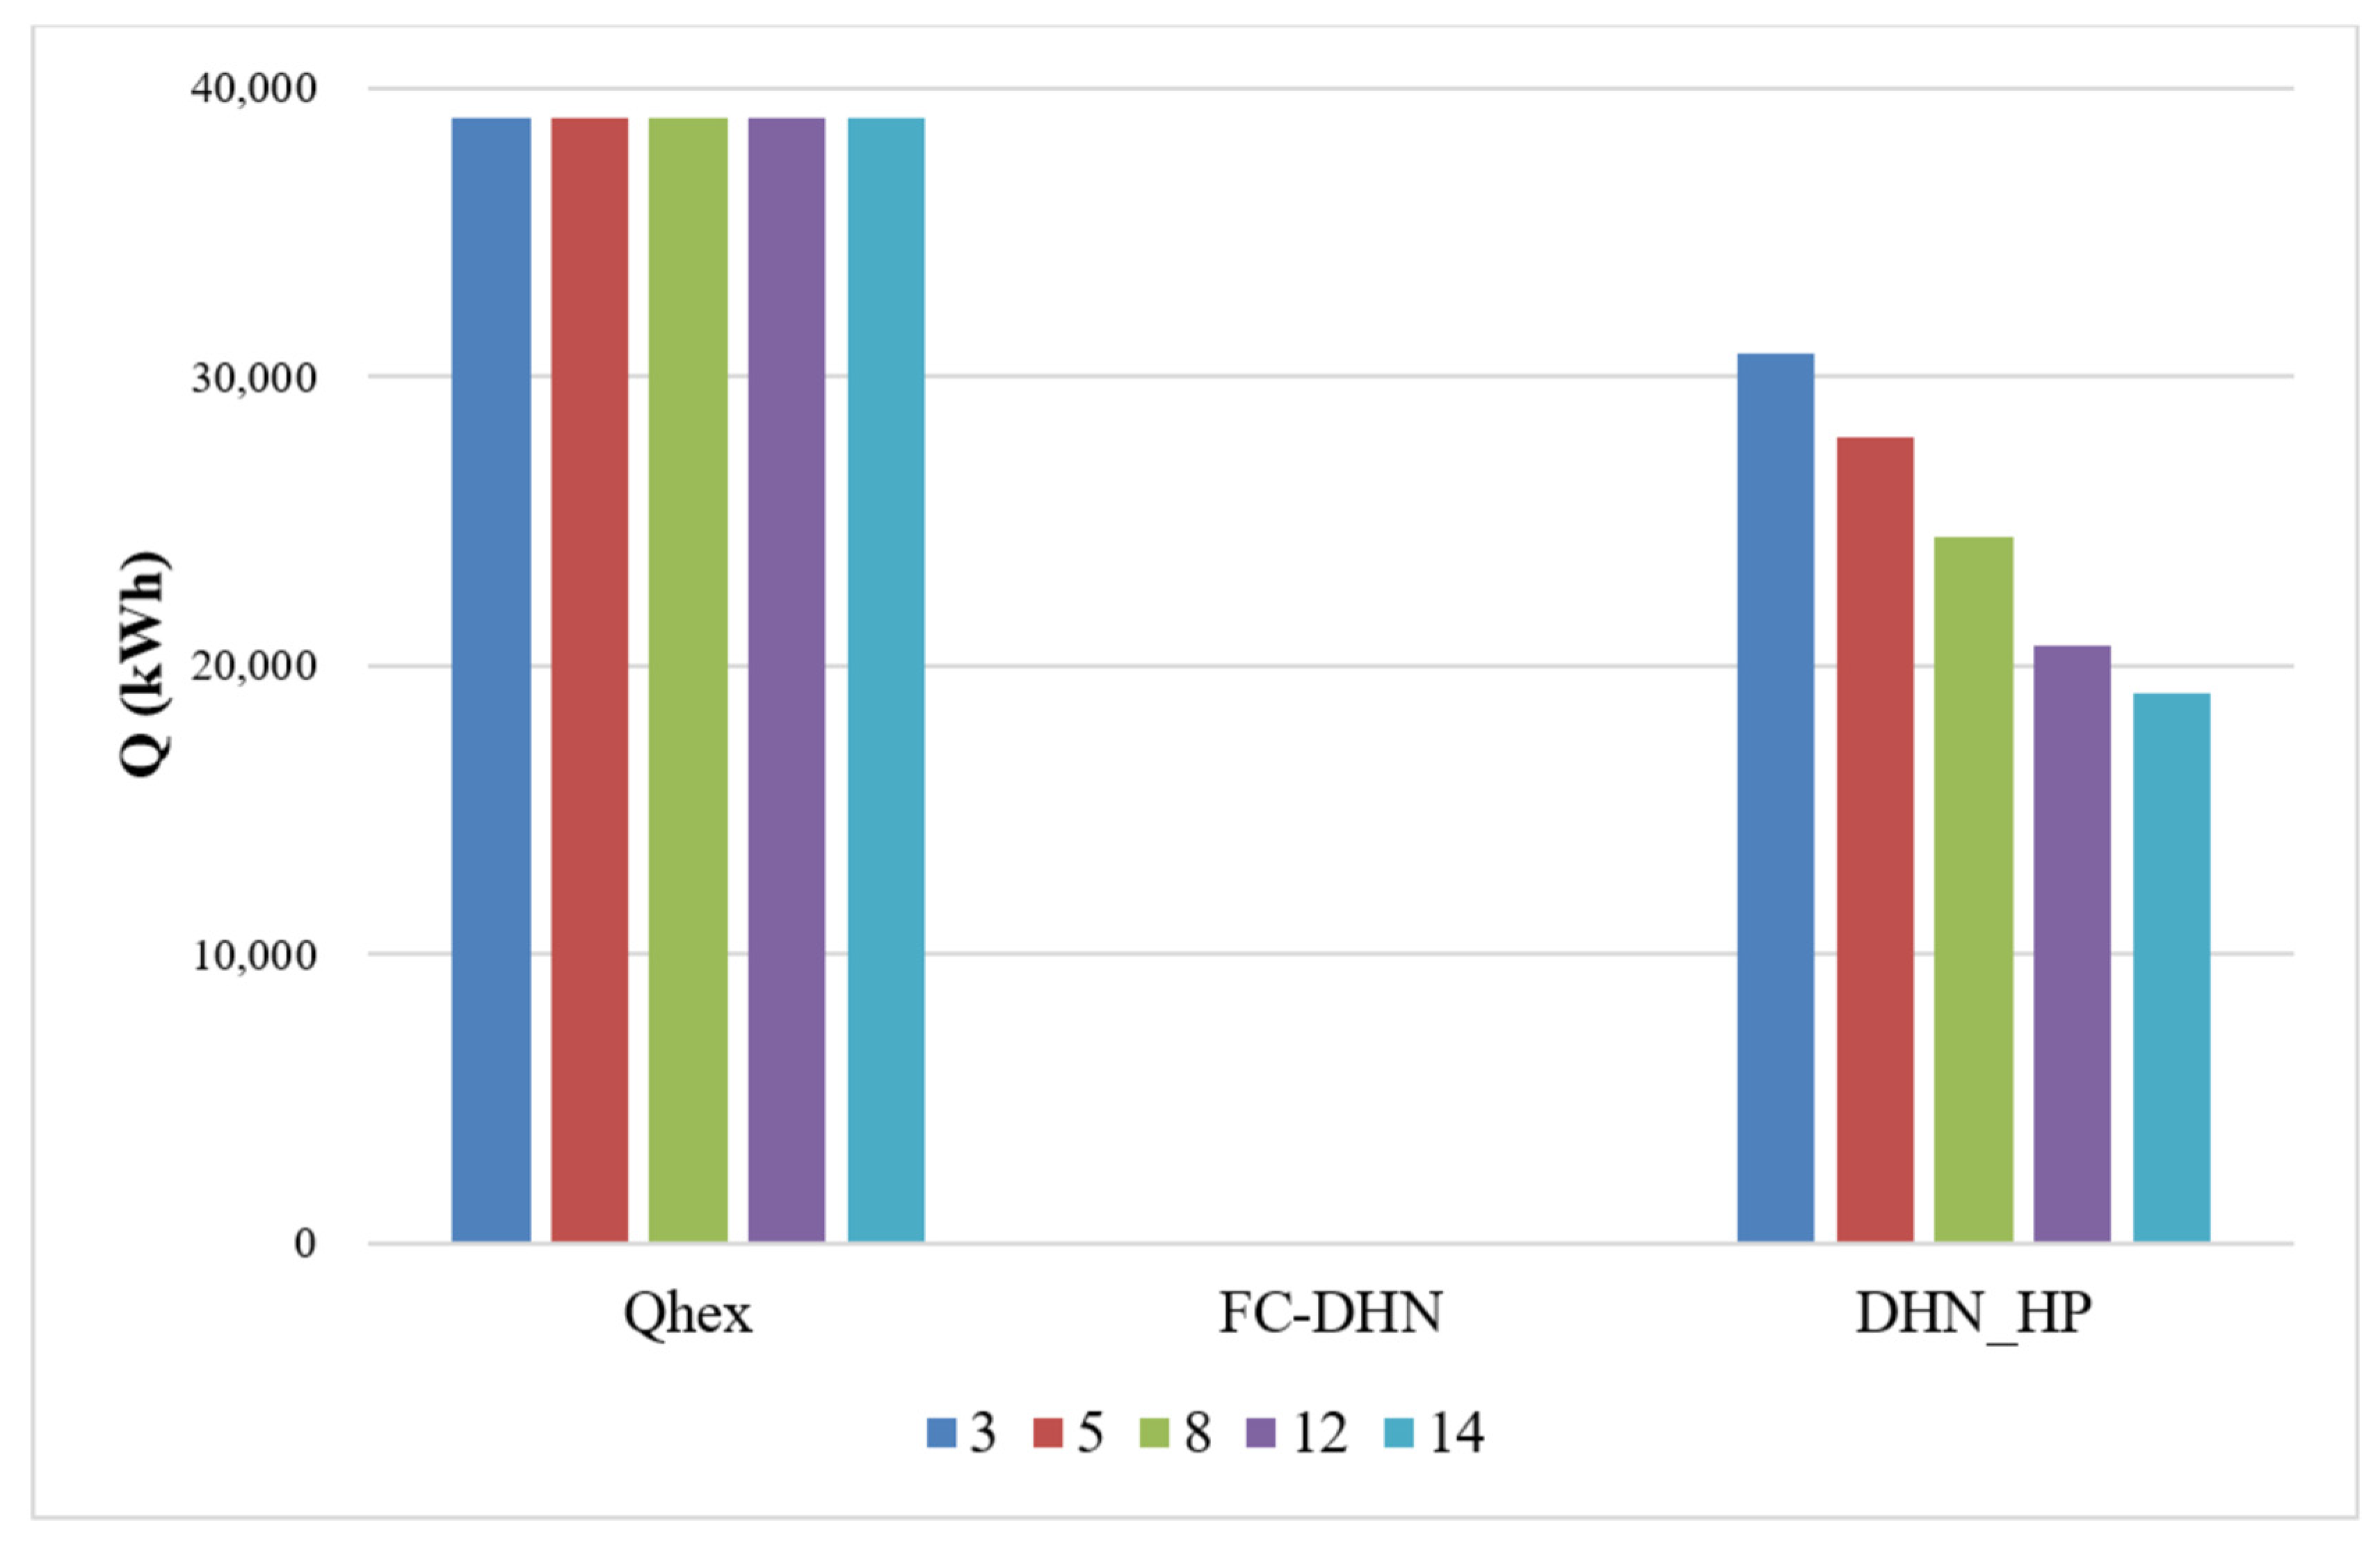
- In terms of the heat source management for stable and efficient operation of heat pumps, it was confirmed that considerable operational benefit, more than 30%, in terms of primary energy savings can be achieved by using the DHN return pipe hot water as a heat source for heat pumps.
- The proposed model has been proven to be quite attractive in terms of new demand development for existing DHNs, in that the new heating demand for large-scale buildings is about 3% of the existing DHN total heat demand.
Author Contributions
Funding
Conflicts of Interest
Nomenclature
| BHT | Bilateral Heat Trade |
| CHP | Combined Heat and Power |
| COP | Coefficient of Performance |
| DHC | District Heating and Cooling |
| DHN | District Heating Network |
| DHN_HP | From District Heating Network to Heat Pumps |
| DHN_SP | District Heating Network Supplying Pipe |
| DHN_RP | District Heating Network Return Pipe |
| FC CGS | Fuel Cell Cogeneration System |
| FC_DHN | From Fuel Cell to District Heating Network |
| HLTO | Heat Load Tracing Operation |
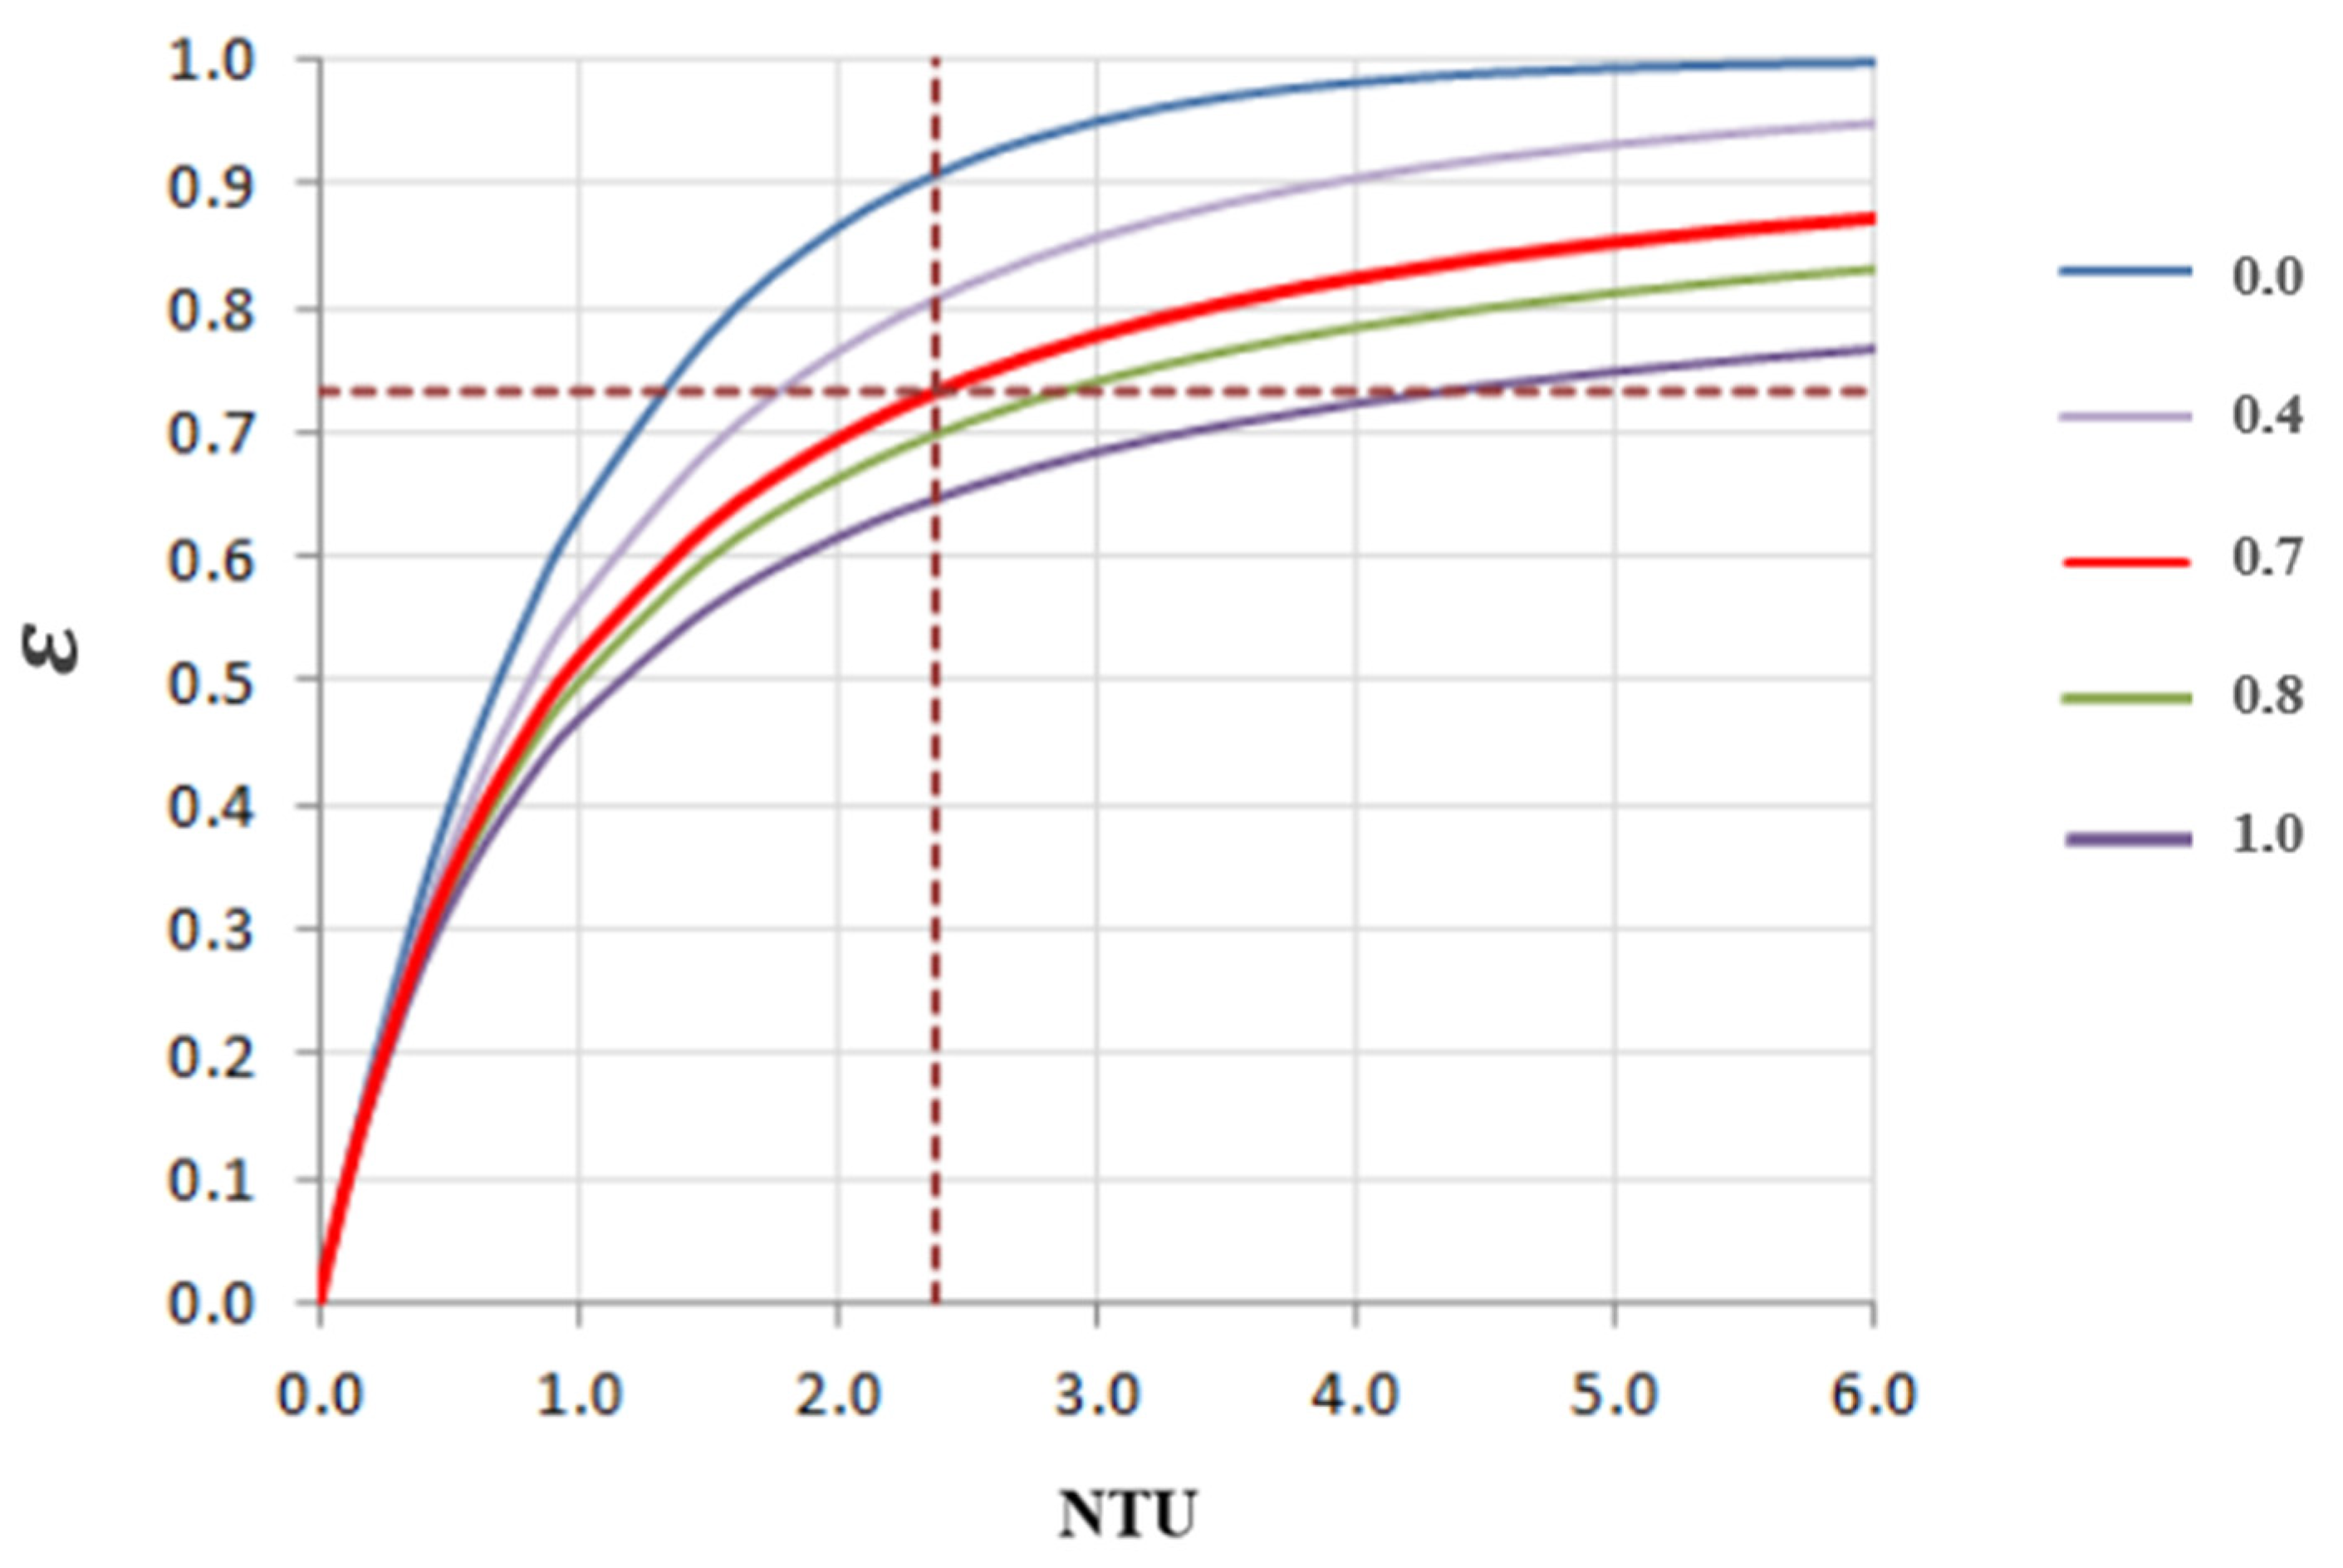
| NTU | Number of Transfer Units |
| PLB | Peak Load Boiler |
| PLTO | Power Load Tracing Operation |
| PtH | Power-to-Heat |
| Q | Rate of Heat Flow (kW) |
| RPES | Relative Primary Energy Savings |
| SOFC | Solid Oxide Fuel Cell |
| UPS | Uninterruptible Power Supply |
| °C | Degree Celsius |
| Capacity Ratio | |
| Mass Flow Rate (kg/s) | |
| T | Temperature of water (℃) |
| Greek symbols | |
| Effectiveness | |
| Sub(super)scripts | |
| aux | Auxiliary Heat (from DHN) |
| DH | District Heating |
| EVA | Evaporator |
| fc | Fuel Cell |
| HP | Heat Pump |
| hex | Heat Exchanger |
| incin | Incinerator |
| res_aux | Auxiliary Heat Source for Heat Pumps (from DHN) |
References
- Kirppu, H.; Lahdelma, R.; Salminen, R. Multicriteria Evaluation of carbon-neutral heat-only production technologies for district heating. Appl. Therm. Eng. 2018, 130, 466–476. [Google Scholar] [CrossRef] [Green Version]
- Hast, A.; Syri, S.; Lekavicius, V.; Galinis, A. District heating in cities as a part of low-carbon energy system. Energy 2018, 152, 627–639. [Google Scholar] [CrossRef]
- Ziemele, J.; Dace, E. An analytical framework for assessing the integration of the waste heat into a district heating system: Case of the city of Riga. Energy 2022, 254, 124285. [Google Scholar] [CrossRef]
- Pilpola, S.; Arabzadeh, V.; Mikkola, J.; Lund, P.D. Analyzing national and local pathway to carbon-neutrality from technology, emissions, and resilience perspectives—Case of Finland. Energies 2019, 12, 949. [Google Scholar] [CrossRef] [Green Version]
- Wirtz, M.; Kivilip, L.; Remmen, R.; Muller, D. 5th Generation district heating: A novel design approach based on mathematical optimization. Appl. Energy 2020, 260, 114185. [Google Scholar] [CrossRef]
- Lund, H.; Østergaard, P.A.; Nielsen, T.B.; Werner, S.; Thorsen, J.E.; Gudmundsson, O.; Arabkoohsar, A.; Mathiesen, B.V. Perspective on fourth and fifth generation district heating. Energy 2021, 227, 120520. [Google Scholar] [CrossRef]
- Topal, H.İ.; Tol, H.İ.; Kopaç, M.; Arabkoohsar, A. Energy, exergy and economic investigation of operating temperature impacts on district heating systems: Transition from high to low-temperature networks. Energy 2022, 251, 123845. [Google Scholar] [CrossRef]
- Lindhe, J.; Javed, S.; Johansson, D.; Bagge, H. A review of the current status and development of 5GDHC and characterization of a novel shared energy system. Sci. Technol. Built Environ. 2022, 28, 595–609. [Google Scholar] [CrossRef]
- Revesz, A.; Jones, P.; Dunham, C.; Davies, G.; Marques, C.; Matabuena, R.; Scott, J.; Maidment, G. Developing novel 5th generation district energy networks. Energy 2020, 201, 117389. [Google Scholar] [CrossRef]
- Ziemele, J.; Gravelsins, A.; Blumberga, A.; Blumberga, D. Combined energy efficiency at source and at consumer to reach 4th generation district heating: Economic and system dynamics analysis. Energy 2017, 137, 595–606. [Google Scholar] [CrossRef]
- Averfalk, H.; Ingvarsson, P.; Persson, U.; Gong, M.; Werner, S. Large heat pumps in Swedish district heating systems. Renew. Sustain. Energy Rev. 2017, 79, 1275–1284. [Google Scholar] [CrossRef]
- Paiho, S.; Reda, F. Towards next generation district heating in Finland. Renew. Sustain. Energy Rev. 2016, 65, 915–924. [Google Scholar] [CrossRef]
- Arabkoohsar, A.; Alsagri, A.S. Thermodynamic analysis of ultralow-temperature district heating system with shared power heat pumps and triple-pipes. Energy 2020, 192, 116918. [Google Scholar] [CrossRef]
- Best, I. Economic comparison of low-temperature and ultra-low-temperature district heating for new building developments with low heat demand densities in Germany. Int. J. Sustain. Energy Plan. Manag. 2018, 16, 46–60. [Google Scholar]
- Ostergaard, P.A.; Andersen, A.N. Economic feasibility of booster heat pumps in heat pump-based district heating systems. Energy 2018, 155, 921–929. [Google Scholar] [CrossRef]
- Calise, F.; Cappiello, F.L.; Cimmino, L.; Vicidomini, M. Optimal design of a 5th generation district heating and cooling network based on seawater heat pumps. Energy Convers. Manag. 2022, 267, 115912. [Google Scholar] [CrossRef]
- Jodeiri, A.M.; Goldsworthy, M.J.; Buffa, S.; Cozzini, M. Role of sustainable heat sources in transition towards fourth generation district heating—A review. Renew. Sustain. Energy Rev. 2022, 158, 112156. [Google Scholar] [CrossRef]
- Pieper, H.; Ommen, T.; Elmegaard, B.; Markussen, W.B. Assessment of a combination of three heat sources for heat pumps to supply district heating. Energy 2019, 176, 156–170. [Google Scholar] [CrossRef]
- Barco-burgos, J.; Bruno, J.C.; Eicker, U.; Saldaña-Robles, A.L.; Alcantar-Camarena, V. Review on the integration of high-temperature heat pumps in district heating and cooling networks. Energy 2022, 239, 122378. [Google Scholar] [CrossRef]
- Arabkoohsar, A.; Sadi, M.; Behzadi, A.; Rahbari, H.R. Techno-economic analysis and multi-objective optimization of a novel proposal for addressing summer-supply challenges of district heating systems. Energy Convers. Manag. 2021, 236, 113985. [Google Scholar] [CrossRef]
- Sayegh, M.A.; Brys, K.; Jouhara, H. Heat pump placement, connection and operational modes in European district heating. Energy Build. 2018, 166, 122–144. [Google Scholar] [CrossRef]
- Alns, A.; Sleiti, A.K. Combined heat and power system based on Solid Oxide Fuel Cells for low energy commercial bulidings in Qatar. Sustain. Energy Technol. Assess. 2021, 48, 101615. [Google Scholar]
- Ellamla, H.R.; Staffell, I.; Bujlo, P.; Pollet, B.G. Current status of fuel cell based combined heat and power systems for residential sector. J. Power Sources 2015, 293, 312–328. [Google Scholar] [CrossRef]
- Accurso, F.; Gandiglio, M.; Santarelli, M.; Buunk, J.; Hakala, T.; Kiviaho, J.; Modena, S.; Münch, M.; Varkaraki, E. Installation of fuel cell-based cogeneration systems in the commercial and retail sector: Assessment in the framework of the COMSOS project. Energy Convers. Manag. 2021, 239, 114202. [Google Scholar] [CrossRef]
- Pastore, L.M.; Basso, G.L. Can the renewable energy share increase in electricity and gas grids takes out the competitiveness of gas-driven CHP plants for distributed generation? Energy 2022, 256, 124659. [Google Scholar] [CrossRef]
- Im, Y.H. Assessment of the technological sustainability of the tri-generation model in the era of climate change: A case study of terminal complexes. Energies 2022, 15, 4959. [Google Scholar] [CrossRef]
- Cengel, Y.A.; Ghajar, A. Heat and Mass Transfer, 5th ed.; Mcgrawhill: New York, NY, USA, 2011. [Google Scholar]
- Chung, M.; Park, H.C. Building energy demand patterns for department stores in Korea. Appl. Energy 2012, 90, 241–249. [Google Scholar] [CrossRef]
- Chung, M.; Lee, S.G.; Park, C.; Park, H.-C.; Im, Y.H. Development of a combined energy-demands calculator for urban building communities in Korea. Environ. Plan. B Plan. Des. 2013, 40, 289–309. [Google Scholar] [CrossRef]


| Unit | Designed Value | Operating Value | |
|---|---|---|---|
| Evaporator inlet temp. | °C | 60 | 51.7 |
| Evaporator outlet temp. | °C | 32 | 29.3 |
| Condenser inlet temp. | °C | 55 | 51.3 |
| Condenser outlet temp. | °C | 70 | 64.8 |
| Mass flow rate for cooling medium (evaporator side) | m3/h | 230 | 250 |
| Mass flow rate for DHN (condenser side) | m3/h | 100 | 112.6 |
| Rated power of compressor | kW | 770 | 664 |
| COP | - | 5.23 | 5.9 |
| Heating capacity of heat pump | RT | 1145 | 1110 |
| Build. Type | Department Store | Officetel | Office | Exhibition | Shopping Center | Hotel |
|---|---|---|---|---|---|---|
| Floor area (m2) | 79,422 | 100,195 | 114,228 | 106,029 | 155,235 | 79,575 |
| Heating | Cooling | Power | |
|---|---|---|---|
| Max (MWh) | 76.8 | 127.4 | 19.7 |
| Total (GWh) | 71.3 | 129 | 81.5 |
| Cf. | ||||
|---|---|---|---|---|
| 0 | Summer | |||
| 0 | Winter | |||
Publisher’s Note: MDPI stays neutral with regard to jurisdictional claims in published maps and institutional affiliations. |
© 2022 by the authors. Licensee MDPI, Basel, Switzerland. This article is an open access article distributed under the terms and conditions of the Creative Commons Attribution (CC BY) license (https://creativecommons.org/licenses/by/4.0/).
Share and Cite
Youn, Y.-J.; Im, Y.-H. Technical Feasibility Assessment for a Novel Fifth-Generation District Heating Model of Interconnected Operation with a Large-Scale Building. Sustainability 2022, 14, 12857. https://0-doi-org.brum.beds.ac.uk/10.3390/su141912857
Youn Y-J, Im Y-H. Technical Feasibility Assessment for a Novel Fifth-Generation District Heating Model of Interconnected Operation with a Large-Scale Building. Sustainability. 2022; 14(19):12857. https://0-doi-org.brum.beds.ac.uk/10.3390/su141912857
Chicago/Turabian StyleYoun, Young-Jik, and Yong-Hoon Im. 2022. "Technical Feasibility Assessment for a Novel Fifth-Generation District Heating Model of Interconnected Operation with a Large-Scale Building" Sustainability 14, no. 19: 12857. https://0-doi-org.brum.beds.ac.uk/10.3390/su141912857