
Long-Term Assessment of Temperature Management in an Industrial Scale Biogas Plant


Circular Resource Engineering, Economy and Management, Hamburg University of Technology, Blohmstr. 15, 21079 Hamburg, Germany
*
Author to whom correspondence should be addressed.
Sustainability 2022, 14(2), 612; https://doi.org/10.3390/su14020612
Submission received: 24 November 2021
/
Revised: 28 December 2021
/
Accepted: 29 December 2021
/
Published: 6 January 2022
(This article belongs to the Special Issue Bioenergy and Environment)
Abstract
:Temperature management is one of the primary considerations of biogas plant operation, and influences physical and biochemical processes. An increase in the temperature leads to an increase in the hydrolysis rate of the feedstock, while it can inhibit microorganisms taking part in different stages of anaerobic digestion. Because of the complexity of the biochemical processes within the anaerobic digestion process, there is a lack of knowledge about the effects of temperature and temperature change on efficiency. Moreover, the impact of stirring directly affects the temperature distribution in the anaerobic digestion reactors. In this study, the temperature management in an industrial-scale biogas plant was examined, and the effect of small temperature changes (from the operation temperature 42 °C) on the efficiency was studied in a laboratory under two different conditions: with stirring (at 40 and 44 °C) and without stirring (at 40 and 44 °C). The examination results from the biogas plant showed that heat transfer in the reactor was not sufficient at the bottom of the digester. Adaptation of the post-digester samples to the temperature changes was more challenging than that of the digester samples. From digestate samples, higher biomethane generation could be obtained, resulting from sufficient contact between microorganisms, enzymes, and substrates. Overall, differences between these changing conditions (approx. 6 NmL CH4 g VS−1) were not significant and could be adapted by the process.
1. Introduction
The number of anaerobic digestion plants has increased in recent decades due to their enormous benefits for the environment: reduction in greenhouse gas (GHG) emissions, provision of sustainable energy resources (assisting the reduction in the dependence on fossil fuels), reduction in the negative impacts of the bio-fractions in waste, and the supply of by-products that can be used in agriculture [1,2,3]. Germany’s subsidies and renewable energy acts and laws have assisted in an enormous increase in the electricity generated from biogas, to account for at least one-third of the electricity generated worldwide from biogas since 2007 [3].
The key greenhouse gases emitted by humans are CO2 (76%), CH4 (16%), N2O (6%) and fluorinated gases (2%). These emissions are produced from economic activities, such as electricity and heat production (25%); agriculture, forestry and other land use (24%); industry (21%); transportation (14%); buildings (6%); and other energy (10%) [4]. Greenhouse gas emissions, which amounted to approximately 6000 Mt CO2 eq. year−1 in 1990, decreased 23% in 2018 compared to 1990. In addition, the target for 2050 is an 80% decrease in greenhouse gas emissions [5]. In Germany, it has been shown that the CO2 emissions from biogas plants with a capacity size of more than 150 kWel were in the range of 0.16–0.17 kg kWhel−1, whereas this value was 0.4 kg kWhel−1 for the whole grid, including renewable energy resources, in 2019 [6].
In the biological process of anaerobic digestion, microorganisms break complex organic matter into simpler elements under anaerobic conditions, producing biogas and fertilizer [7,8,9,10]. Hydrolysis, acidogenesis, acetogenesis, and methanogenesis are the four main steps of the anaerobic process [7,8]. In the hydrolysis stage, water is utilized to break the bonds of carbohydrates, proteins, and lipids, converting them to monosaccharides, amino acids, and long chain fatty acids (LCFAs). This stage is performed by strict anaerobes with the help of extracellular enzymes [9]. The products of the hydrolysis stage (soluble compounds) are converted to short-chain organic acids by facultative and obligatory anaerobic microorganisms. In the acetogenesis process, methanogic substrates are produced, e.g., acetate, hydrogen, and carbon dioxide [10]. In the last stage (methanogenesis), methane and carbon dioxide are produced by methanogenic bacteria in strictly anaerobic conditions [11]. Therefore, optimum conditions for the microorganisms and the process should be ensured to enhance the quantity and quality of the biogas. The main conditions (and factors) are: the temperature, pH value, organic loading rate (OLR), hydraulic retention time (HRT), feeding pattern, inoculum, pre-treatment, stirring, quality of substrates, oxygen absence and nutrients. In addition, it is important to avoid reaching the inhibiting limits for ammonia, metals, sulfide, organics, and secondary metabolites [7,12,13,14,15].
Based on the optimum living temperature of the microorganism groups taking part in the process, the temperature at biogas plants can be kept under psychrophilic (<25 °C), mesophilic (37–42 °C), and thermophilic conditions (50–60 °C) [8]. Compared to thermophilic conditions, mesophilic conditions can result in better stability, less energy consumption for heating, and less sensitivity for ammonia inhibition [16,17]. By comparison, thermophilic temperature results in the destruction of pathogens, reduction in the hydraulic retention time (HRT), better degradation of solid substrates, and simplified mixing due to the low viscosity [18,19]. In general, the temperature of the digestion reactor should be kept stable, and fluctuations of more than ±3 °C under mesophilic conditions, or more than ±1 °C under thermophilic conditions, should be avoided [19,20,21,22,23]. Moreover, the thermophilic process is more sensitive to temperature fluctuations than the mesophilic process [24].
In this study, a long-term evaluation of the temperature management in an industrial-scale biogas plant was performed, with consideration of other parameters affecting and affected by temperature management. In addition, temperature homogeneity in the biogas digester was examined, and the impact of changing temperatures on the process efficiency was analyzed with laboratory experiments. Thus, this study demonstrates the challenges associated with the temperature management of an industrial-scale biogas plant and the possible impacts of the temperature fluctuations.
2. Materials and Methods
The materials and methods of this paper are presented in two sections, i.e., the study performed in the industrial-scale biogas plant and laboratory analyses.
2.1. The Industrial-Scale Biogas Plant
2.1.1. Overview and Operation of the Biogas Plant
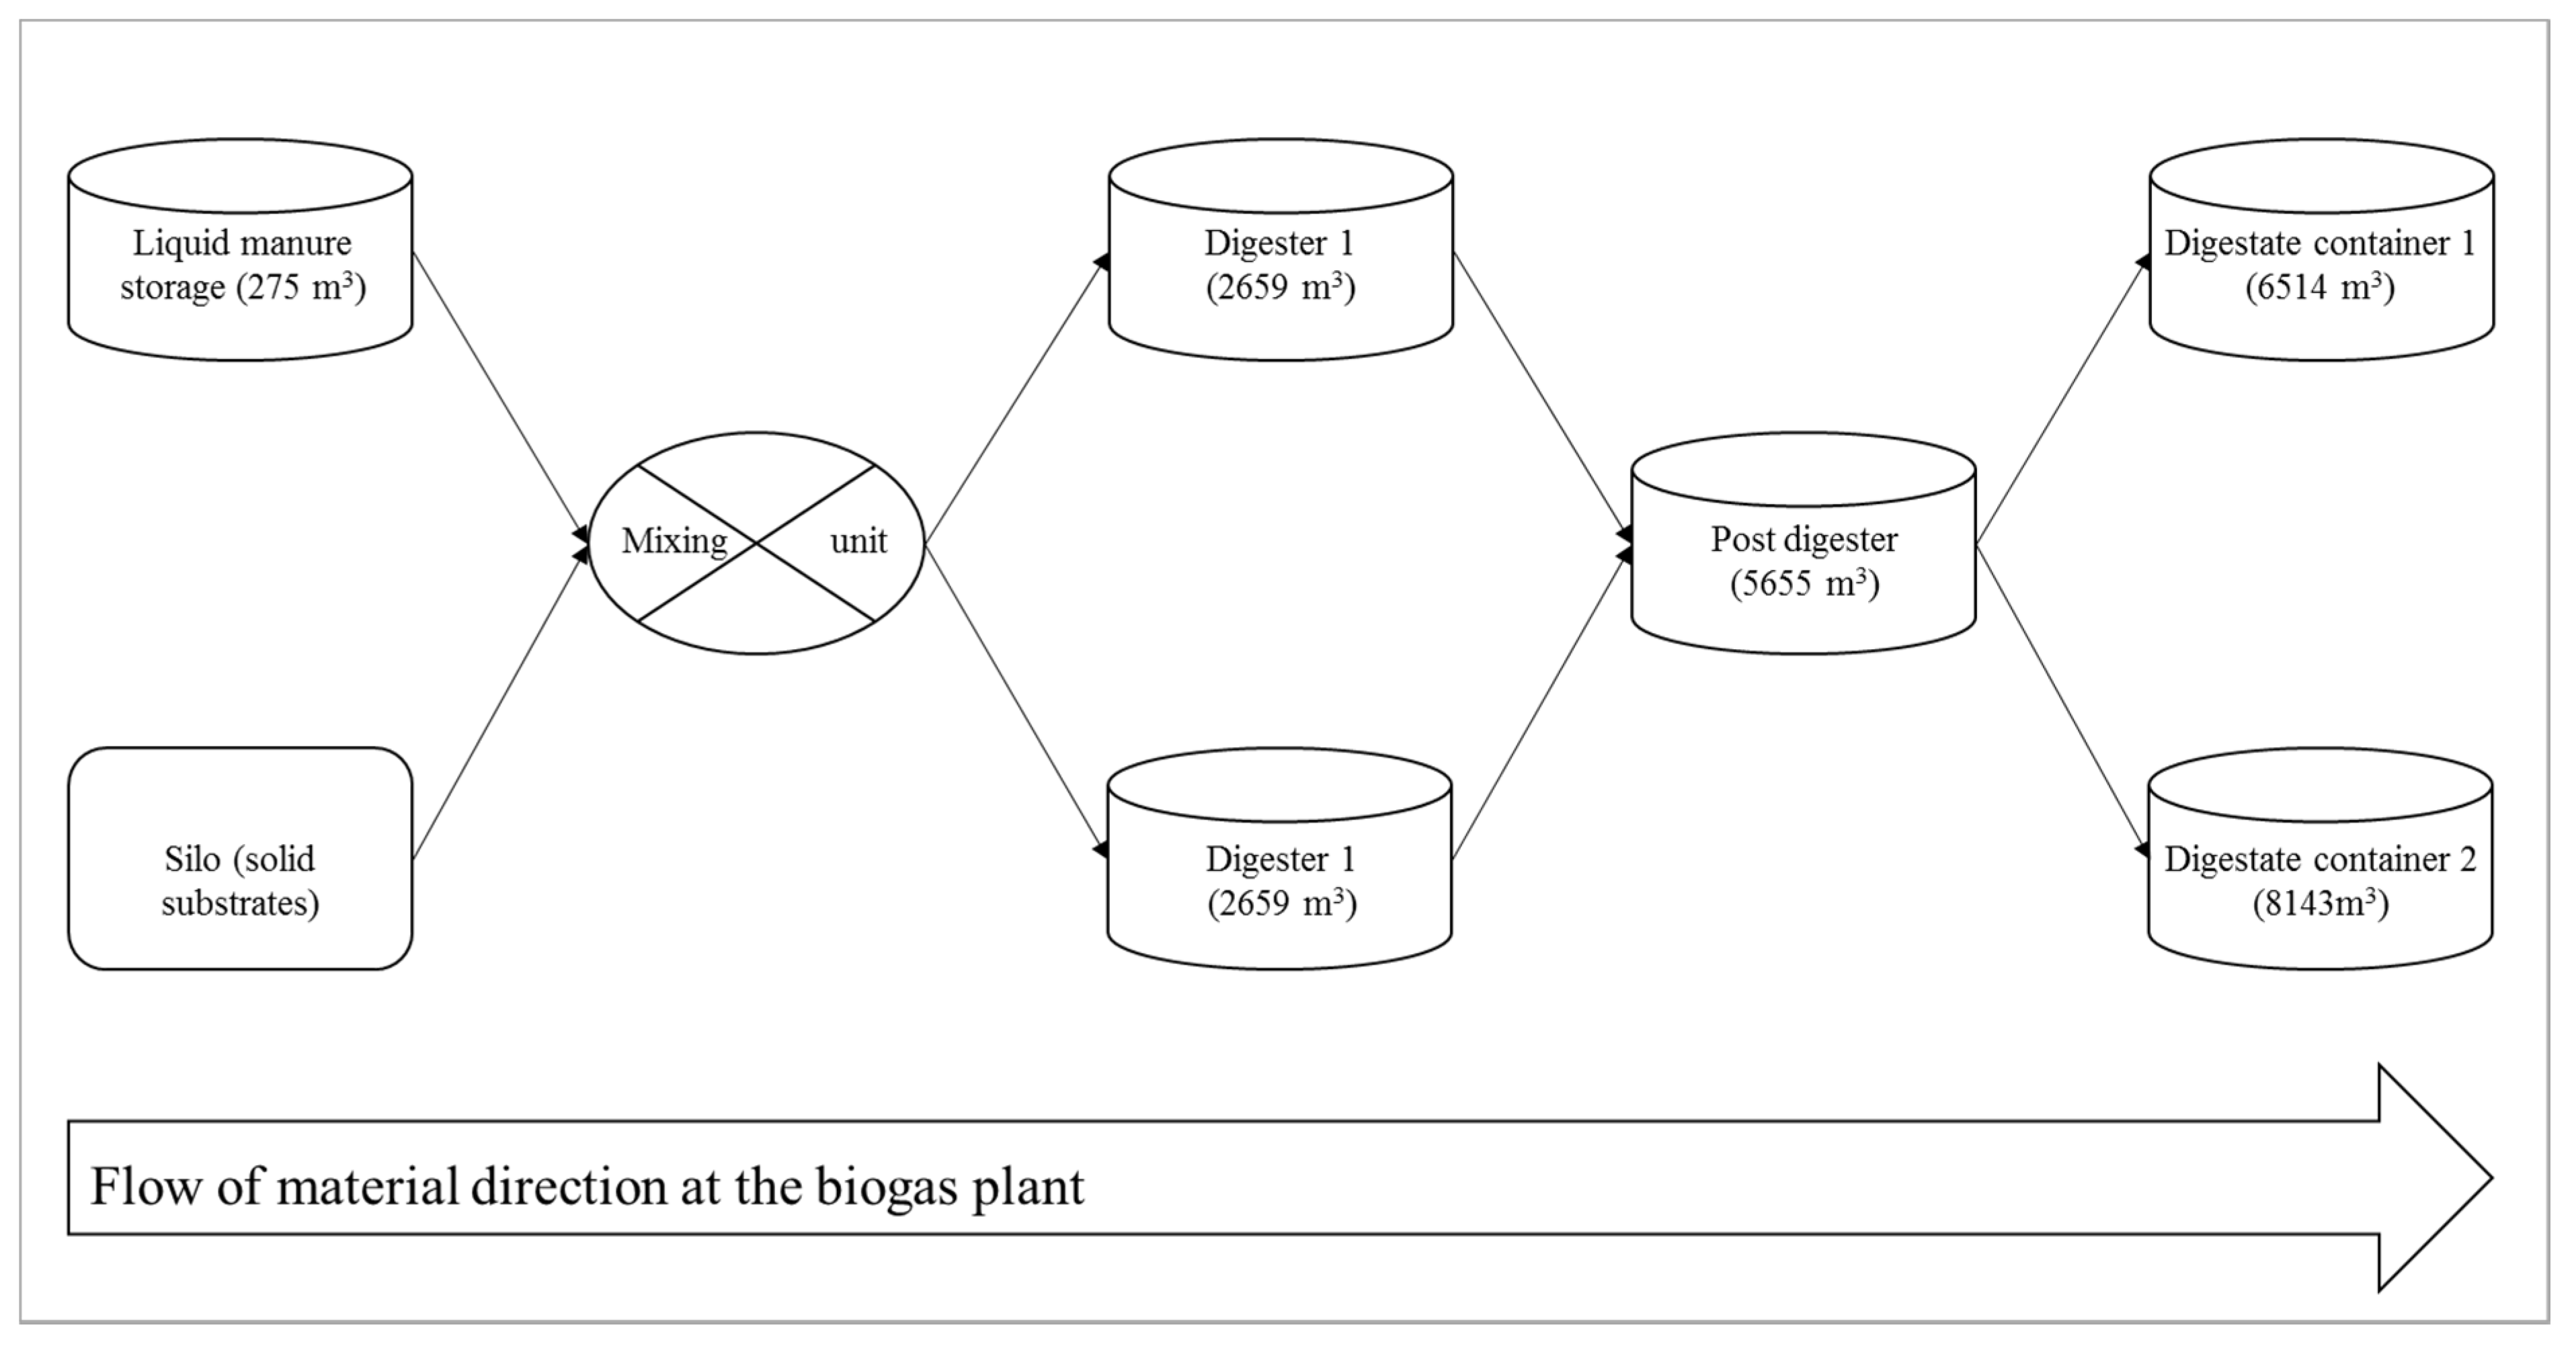
The industrial-scale biogas plant, where one part of the analyses was performed, is located in Lower Saxony in northern Germany. The plant has been under operation since November 2011. However, this study covered five years (September 2015–August 2020) because an enlargement was undertaken in summer 2015, and the plant reached the stability phase again in September 2015. The main components of the biogas plant are silos for solids substrates, liquid manure storage (LM), a pre-treatment and mixing unit, two identical digesters (D1 and D2), a post digester (PD), two digestate containers (DG1 and DG2), and four combined heat and power (CHP) units with a 1.6 MWel capacity, as represented in Figure 1. The biogas plant was designed to process the above-mentioned substrates. The following limitations are to be observed for a stable process. In the case of silage usage, chop length is not allowed to exceed 10 mm to prevent clogging in the feeding equipment. In addition, the total solid content of the substrate should not exceed 10% to prevent possible damage to the pumping and agitation units. The pre-treatment process at this biogas plant consists of mixer and indirect feeding. The mixer contains two pushing areas with two crushers, which transport the solid material from one side to the other. In the indirect feeding, the feedstock is conveyed via a discharge screw into the mixing pump, which conveys the feedstock into the digester. The execution of the screw system is adapted to the conditions of the biogas plant.
The amount of produced heat shows a similar trend to that of the amount produced by the CHP unit, as shown in the study performed by Rutz et al. (2015) [25]. The obtained heat from the CHP unit is used for digester heating (digester 1, digester 2, and post-digester), district heating, and swimming pool heating.
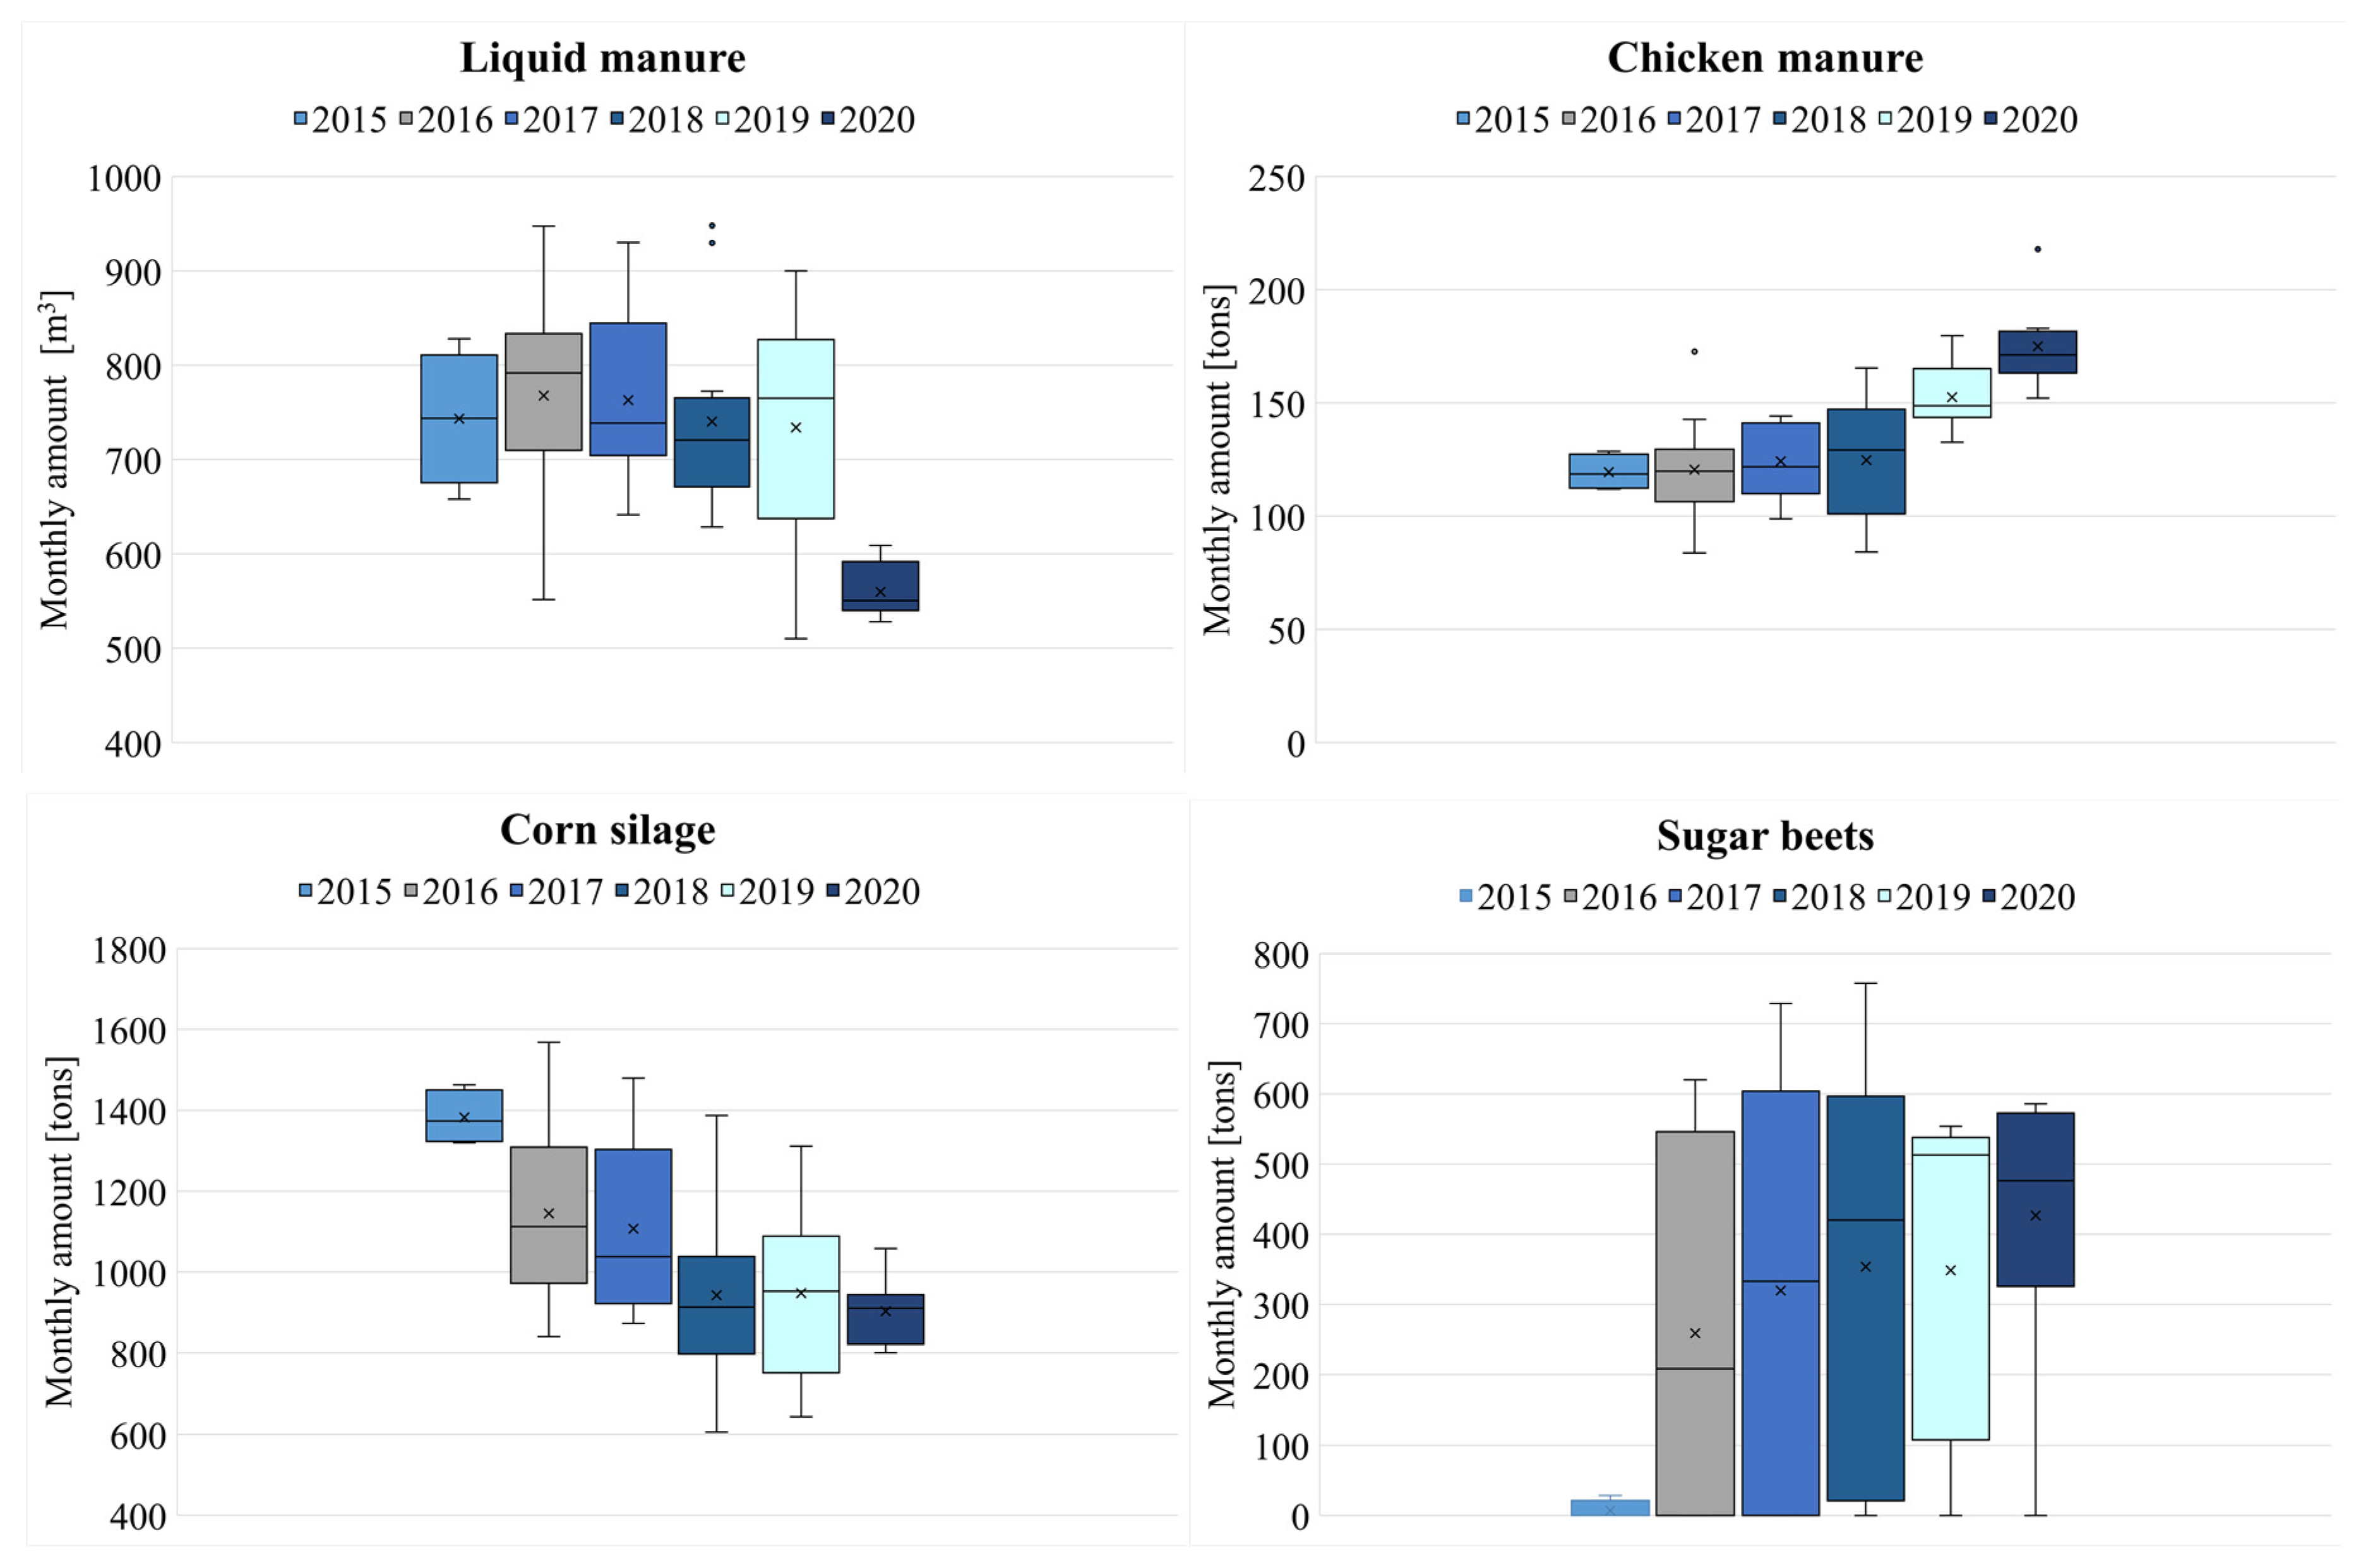
During the mentioned operation period, the biogas plant was fed daily with liquid manure, chicken dung, and maize silage, and was provided seasonally with sugar beet. The range of average monthly liquid manure fed to the biogas plant was between 510 and 948 m3, with an average value of 725 ± 113.2 m3. The monthly amount of chicken dung feed was in the range of 84–218 tons, with an average of 136 ± 27.1 tons. The monthly amount of maize silage fed to the biogas plant was in the range of 606–1568 tons, with an average of 1041 ± 227.2 tons. The fourth substrate, which was used seasonally in feeding the biogas plant, was sugar beet. Figure 2 summarizes the monthly quantity of the substrates fed to the biogas plant.
All containers are equipped with stirrers to ensure homogeneity inside these tanks. The following stirrers are used: one propeller in the liquid manure storage; two propellers and one hydro-mixer inside each digester; and three propellers inside the post digester and the digestate containers. Operation time changes have occurred at the plant, as summarized in Table 1. In this paper, these three periods are named period 1 (September 2015–June 2016), period 2 (July 2016–December 2017), and period 3 (January 2018–August 2020).
Digestate samples were regularly analyzed to determine the total solid content (TS), the volatile solids content (VS), the volatile fatty acids (VFA), the ratio volatile organic acids/total inorganic carbon (VOA/TIC; in German FOS/TAC), and hydrogen carbonate HCO3, based on the methods and standards summarized in the study conducted by Nsair et al. (2019) [12]. Furthermore, to ensure the homogeneity inside the digesters, it was possible to take samples from the heights of 1 and 3 m from the two digesters. In addition, the operational data of the biogas plant were recorded in the software used for biogas plant monitoring, and the recorded daily feeding amounts were used for analyzing operational results from the biogas plant.
2.1.2. Installation of PT100 Sensors and Temperature Measurements
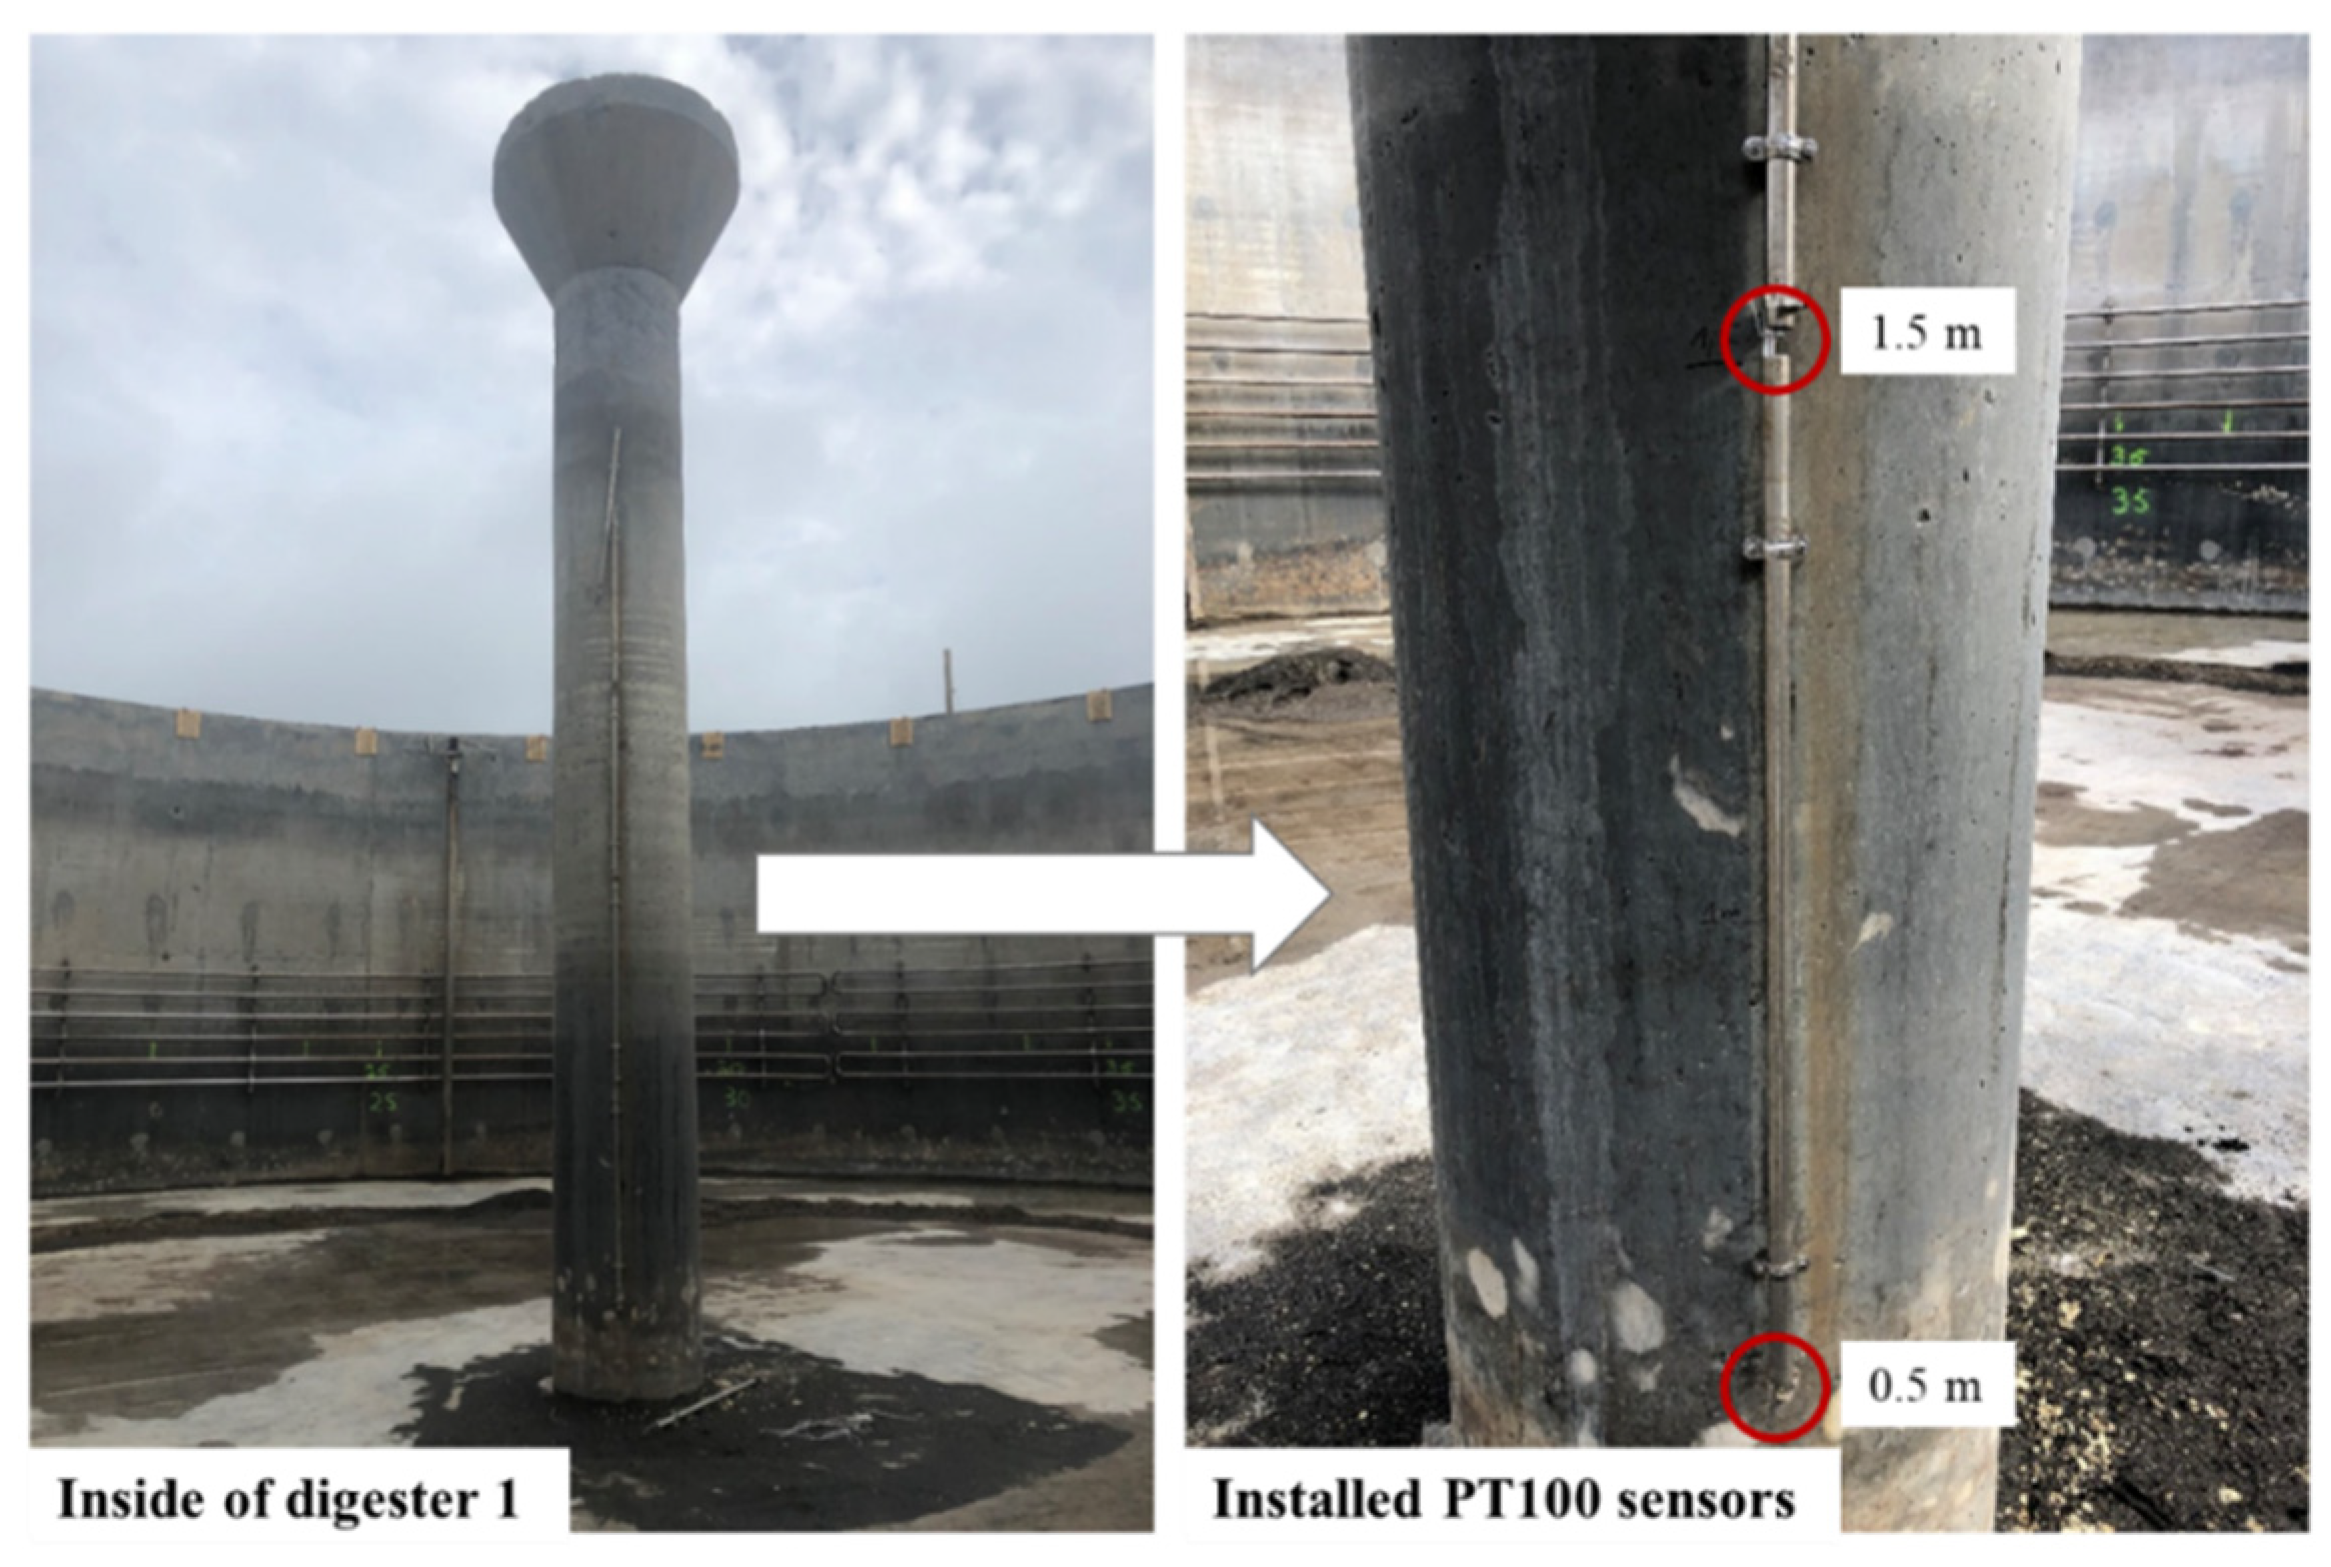
Due to the sedimentation in digester 1 during approximately eight years of operation, digester 1 was emptied and cleaned in August–September 2019. As a result, temperature sensors were installed inside the first digester to examine the temperature distribution inside the digester at different heights. As represented in Figure 3, PT100 sensors were installed on the concrete column in the middle of the digester at different heights; 0.5, 1.5, 2.5, 3.5, and 4.5 m. PT100 thermometers were calibrated before the usage, and used to perform temperature measurements at the biogas plant during period 3 (see Figure 3). The operation time of the stirrers was as follows: the hydro mixer was under operation after each feeding (every one hour) 12 min on/48 min off, and two propellers were running for 10 min on and 30 min off.
The effect of the stirring on the temperature values inside the biogas plant and the homogeneity of the temperature values at different levels was examined in the following five scenarios:
- Scenario I: normal operational conditions: The temperature was measured at the previous points while the stirrers were operating with their standard operating conditions (period 3). The hydro-mixer was turned on for 12 min at 00:00, then turned off for 48 min, repeated every hour. In addition, propellers started operation at 00:05 for 10 min, then off for 30 min, which was repeated during the measurements. The ambient air temperature was 21 °C.
- Scenario II: without stirring: the hydro-mixer was turned off and, 100 min later, the propellers were turned off. The measurements took place directly after turning the propellers off. The ambient air temperature was 19 °C.
- Scenarios III, IV and V: effect of the propellers:
Scenario III: the first propeller was turned off during the measurements. The measurements were started directly after turning the hydro-mixer on. This hydro-mixer was operated normally (12 min on, 48 min off). The ambient air temperature was 19 °C.
Scenario IV: the second propeller was turned off during the measurements. The measurements were started directly after turning the hydro-mixer on. This hydro-mixer was operated normally (12 min on, 48 min off). The ambient air temperature was 19 °C.
Scenario V: both propellers were turned off during the measurements. The measurements were started 8 min after turning the hydro-mixer on. This hydro-mixer was operated normally (12 min on, 48 min off). The ambient air temperature was 19 °C.
2.2. Laboratory Analysis
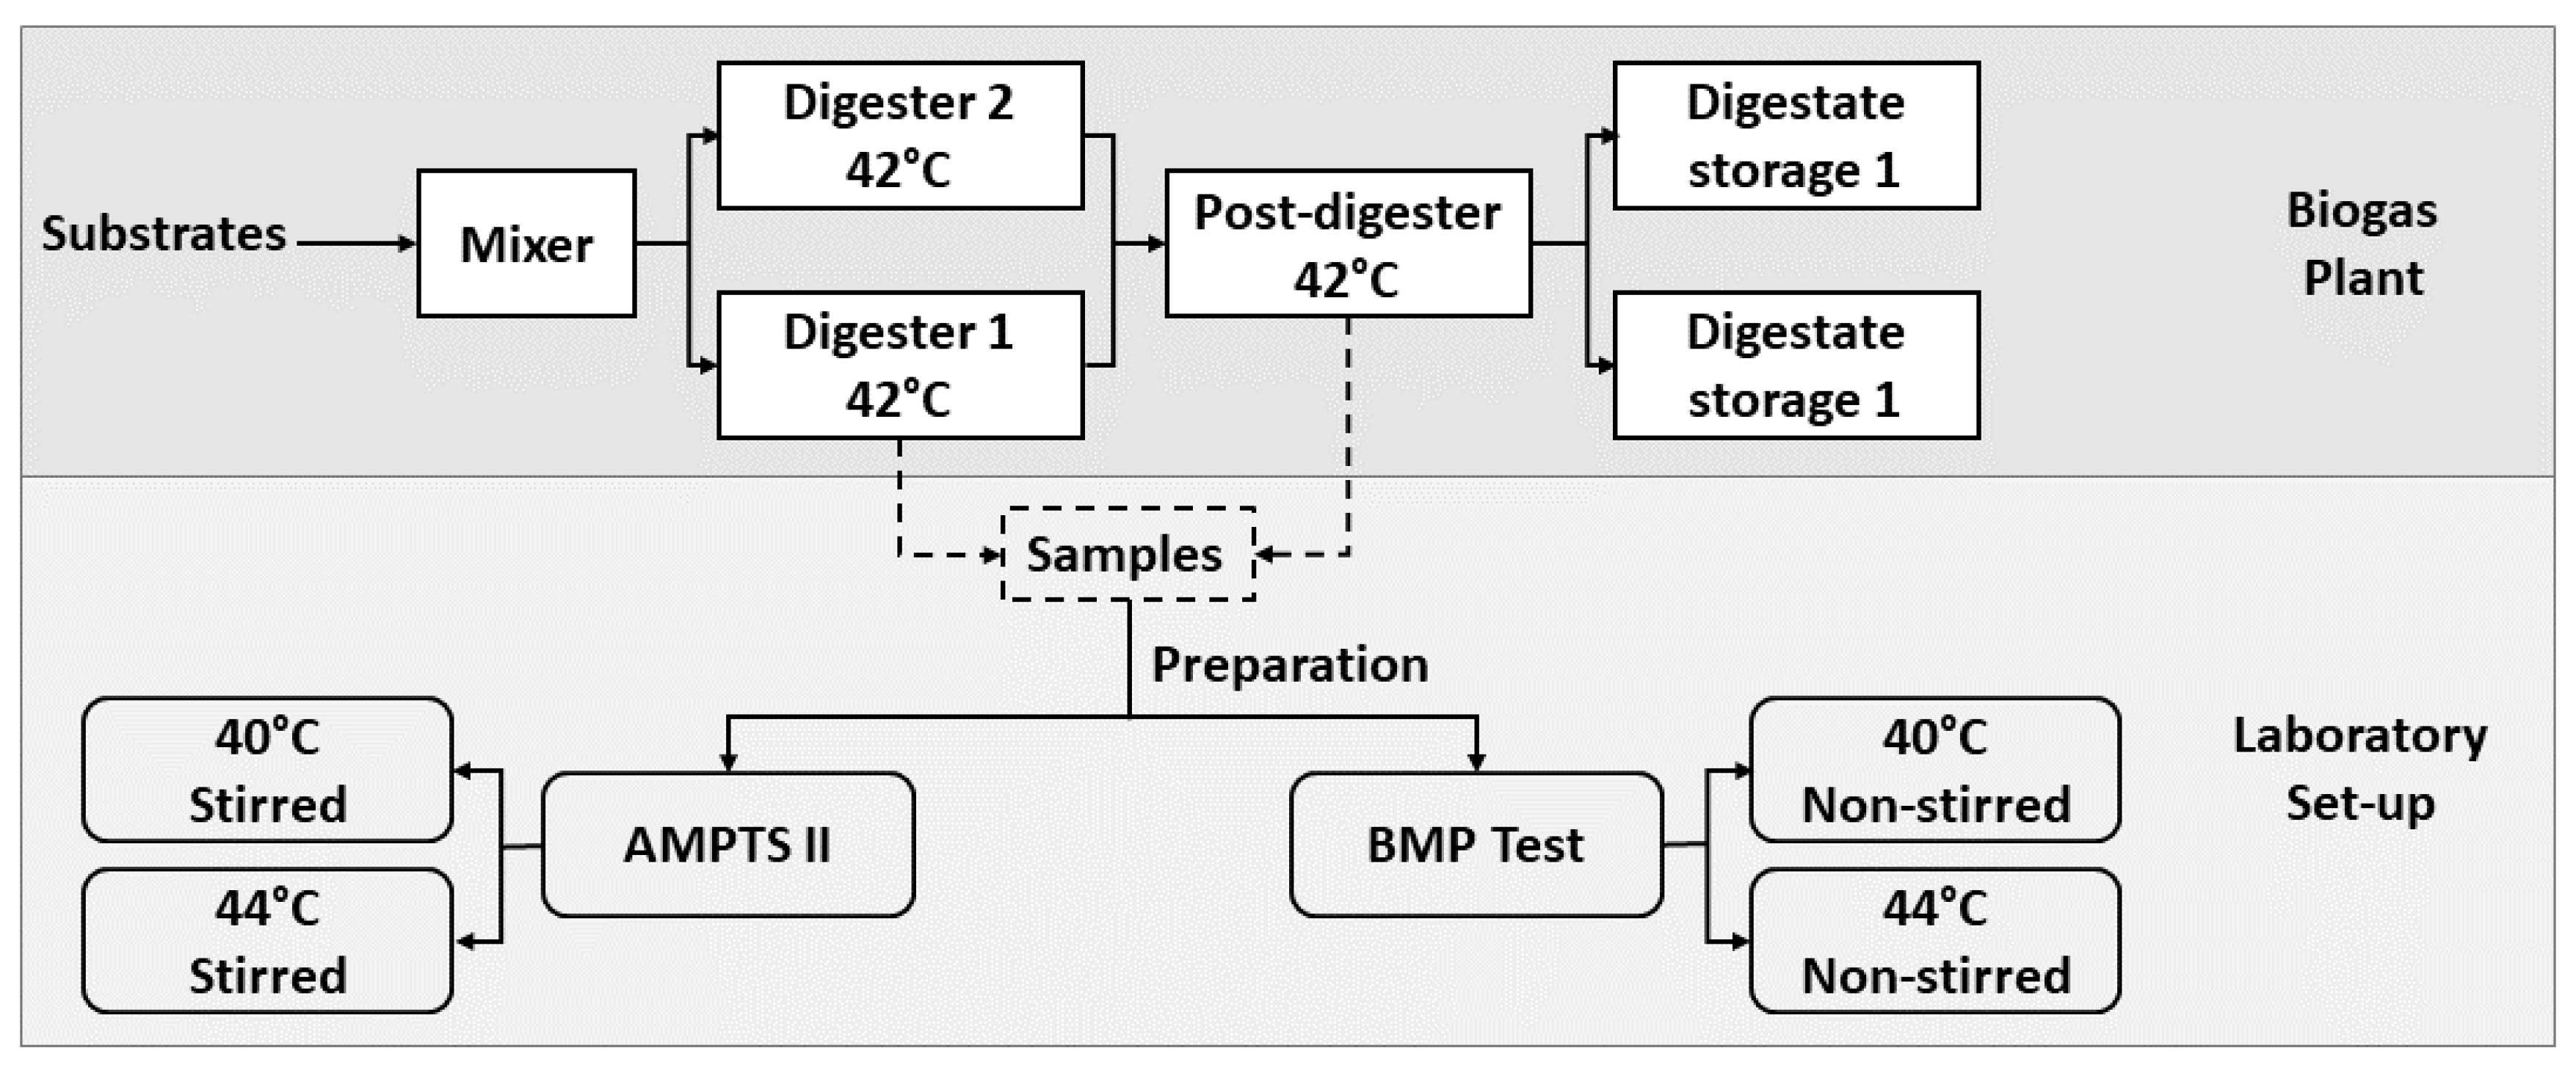
In order to determine the biomethane potential of the digestate samples from industrial-scale biogas plants at different temperatures and stirring conditions, laboratory analyses were performed in two separate batches:
- at 40 °C with stirring (5 min on 30 min off);
- at 44 °C with stirring (5 min on 30 min off);
- at 40 °C without stirring;
- at 44 °C without stirring.
In this section, first, feedstock preparation is explained, and then the experimental set-up is discussed.
2.2.1. Feedstock Preparation
To perform batch biomethane potential tests in the laboratory, digestate samples were taken from the digester and post-digester of the industrial-scale biogas plant. The samples were taken from the sampling taps located at 1 m height at both digesters. The digesters were continuously mixed, and the first samples were discharged to prevent accumulated digestate in the pipe of the tap. After the sampling, the samples were stored in 2 L airtight bottles and transported to the laboratory directly for testing. TS and VS values for the samples from digester 1 and the post-digester were as follows respectively: 8.0% TS, 76.8% VS, and 7.2% TS and 73.5% VS.
In order to ensure suitable TS content (according to VDI4630, dry residue in the bottle should be less than 10%) for the laboratory equipment used for the batch tests, distilled water was added to the samples from the first digester [26]. Approximately 300 g of digestate and 100 g of distilled water were mixed for preparing the reactors from the first digester. The samples from the post-digester were filled directly into the reactors due to their low total solid content.
Total solid content and volatile solid content of the material filled into the reactors were determined to calculate specific biomethane production. In addition, before starting the experiments and after finishing the analyses, pH values were determined for each reactor.
2.2.2. Experimental Set-Up
Two different experimental set-ups were used within the test: AMPTS II for the continuously stirred batch and the Bio Methane Potential (BMP) test for the batch without stirring, as represented in the study performed my Onen and Kuchta (2020) and AMPTS II Manuel (2021) [27,28]. The AMPTS II system includes continuous measurement and recording of both biogas amount and biogas content. In order to determine the biomethane content in the BMP test, Gas Chromatography (GC) measurements were performed two times per week, and moisture correction was implemented on the results to exclude water content in the biogas.
Glass reactors having a volume of 500 mL were used with 400 mL working volume for each experimental set-up. Operational temperatures were chosen as 2 °C (44 °C) higher and 2 °C (40 °C) lower than the operating temperature of the reactors (42 °C).
As a summary of the methodology and materials, Figure 4 presents the sampling plan, experiment plan, and implemented temperatures and stirring scenarios.
Because the biogas and biomethane production amounts were determined with wet gas, these amounts were converted to dry gas volume, as represented in the following equation:
where is the volume of dry gas at normal state (NmL), is the volume of gas at the read off (mL), is the pressure of the gas at the read off (mL), is the water pressure of the water as a function of the temperature of ambient space (hPa), is the normal temperature (273 °K), is the normal pressure (1013 hPa), and is the temperature of the fermentation gas in the ambient space (°K).
Specific biomethane production from the batch analyses was performed as follows.
where is the specific fermentation gas production (NL kg VS−1), is the net gas volume of the substrate during the test period (NmL), m is the mass of weighted substrate (g), TS is the total solid content of the substrate or inoculum (%), and VS is the volatile solid content of the substrate or inoculum (%) [26].
3. Results
The results of this study are presented under two categories: results from the industrial-scale biogas plant and results from the analyses performed in the laboratory.
3.1. Results from Biogas Plant
The industrial-scale biogas plant results were examined after the capacity extension, which encompassed the period of September 2015–August 2020. In addition, the first digester was not under operation for two months (August and September) in 2019. Therefore, the organic loading rate (OLR) in this biogas plant was calculated within three different periods using data recorded daily by the software, feeding records, and laboratory analyses. As a result, the OLR in these months fluctuated between a minimum value of 1.26 kg VS (m3 d)−1 in December 2018 and a maximum value of 2.26 kg VS (m3 d)−1 in June 2016.
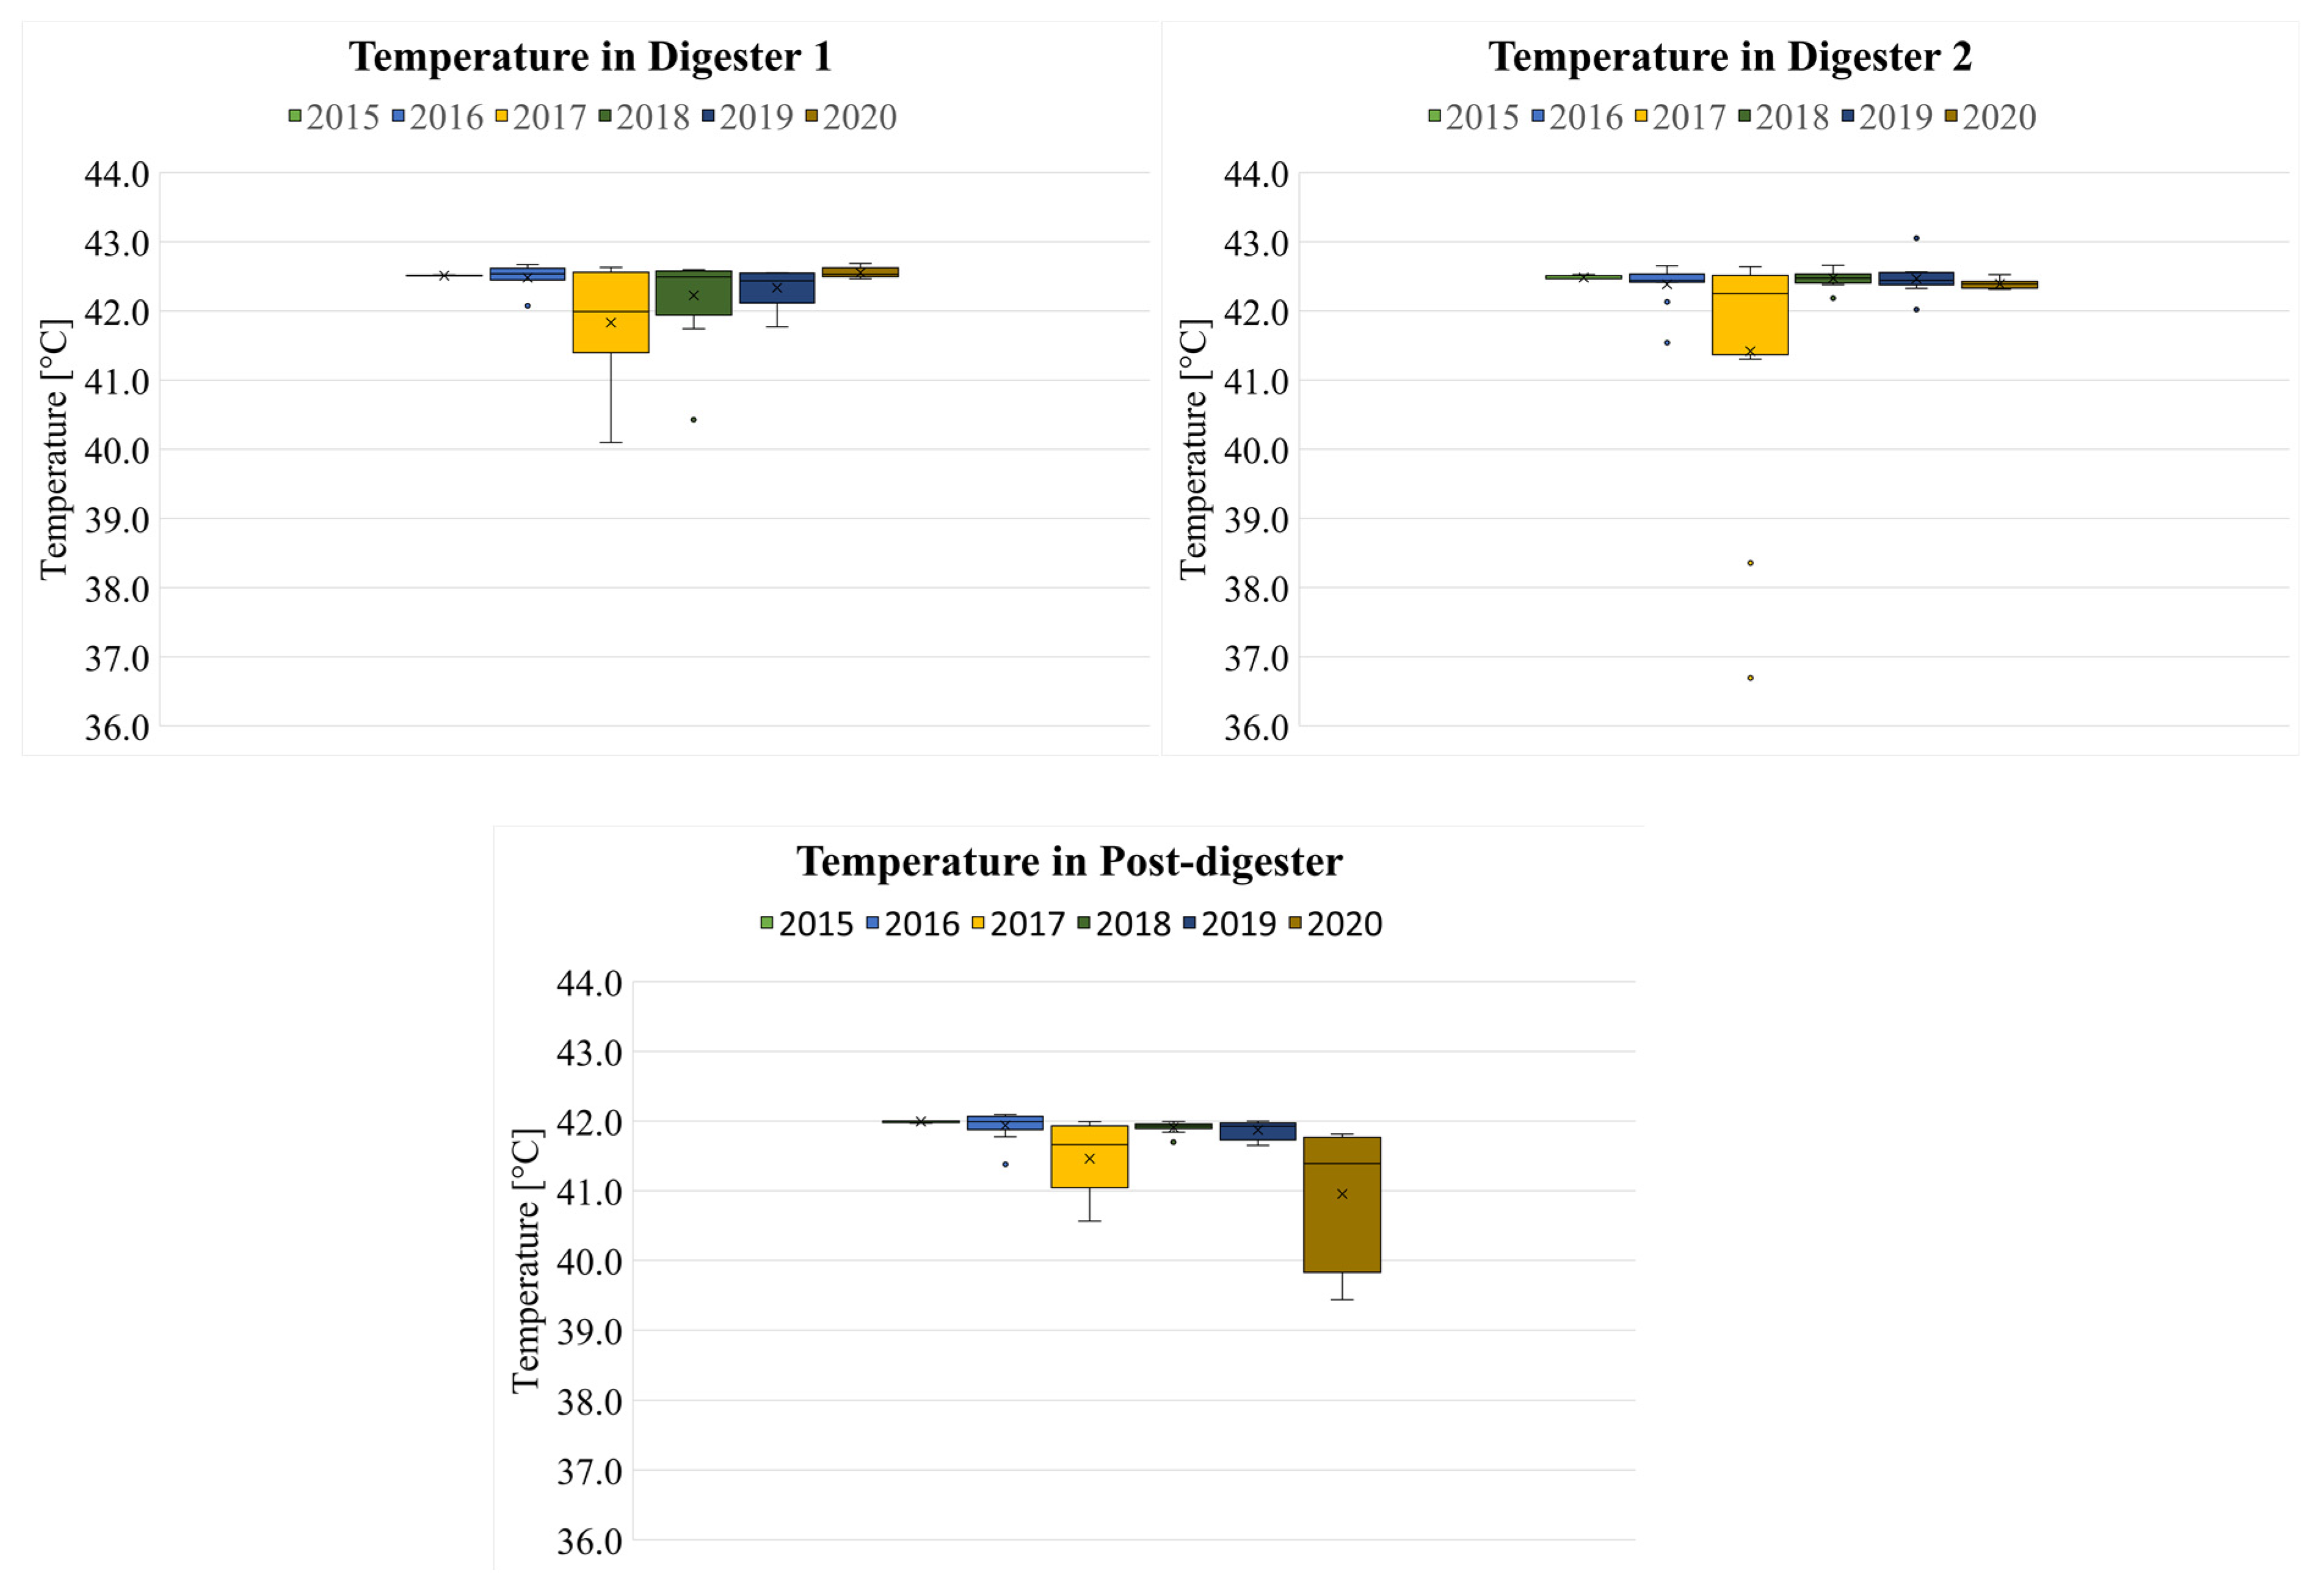
The chosen temperature to operate the biogas plant was 42.0 °C. Nevertheless, there were some variations in the temperature, as can be seen in Figure 5. As a summary of the temperatures inside the digesters and post-digester:
- Digester 1: the temperatures inside digester 1 were in the ranges 42.5 ± 0.05 °C, 42.0 ± 0.71 °C, and 42.4 ± 0.44 °C in periods 1, 2, and 3 respectively;
- Digester 2: the temperatures inside digester 2 were in the ranges 42.5 ± 0.07 °C, 41.7 ± 1.55 °C, and 42.5 ± 0.16 °C in periods 1, 2 and 3 respectively. The reason for the higher differences in the second period was the sedimentation, which covered part of the heater and prevented the transfer of heat in the digester by mixing.
- Post digester: the temperatures inside the post digester were in the ranges 42.0 ± 0.08 °C, 41.6 ± 0.48 °C, and 41.7 ± 0.62 °C in the periods 1, 2, and 3 respectively. Controlling the target temperature in the post-digester is more complicated than in both digesters due to the size of the former. In 2020, the temperatures in the post digester were 41.0 ± 0.91 °C.
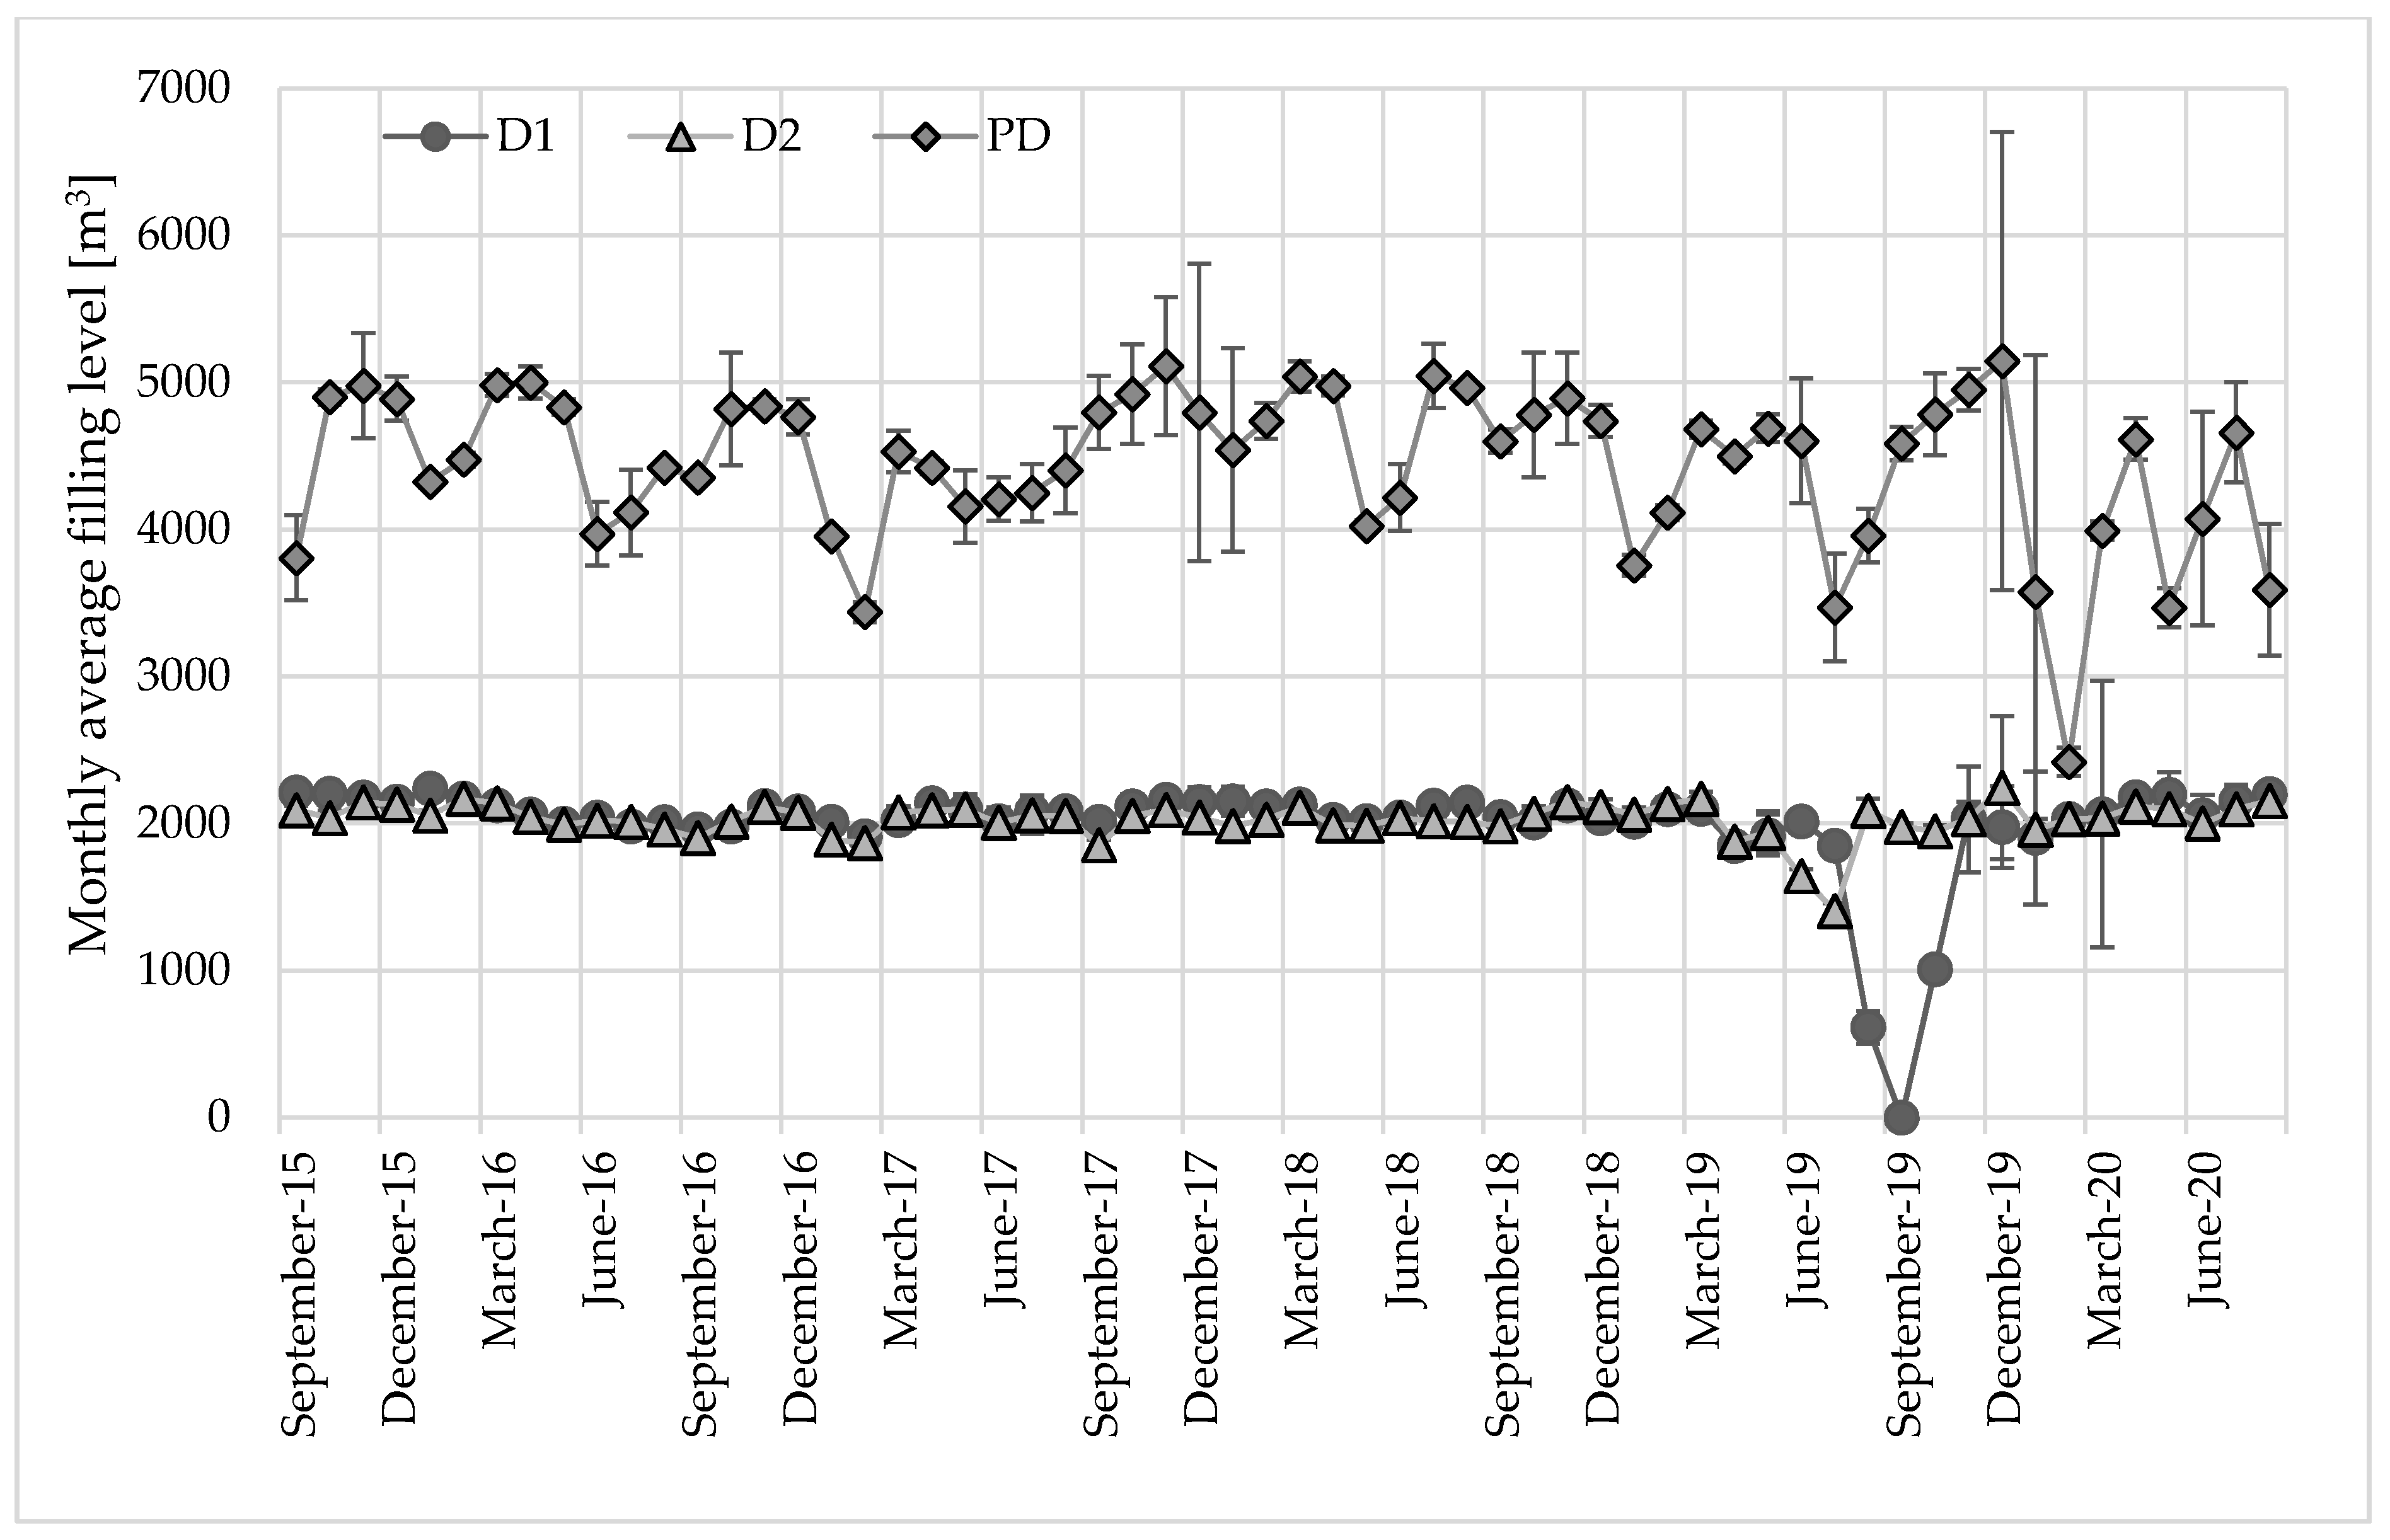
The filling volume of the digesters and the post-digester is an important parameter that affects heat flows in the reactor and eventually impacts the reactor temperature. As represented in Figure 6, the biggest volume fluctuations were observed in the post-digester in these operation years. The highest volumes in the digesters were obtained in the months of October and November because of the high feeding rates in these months. Moreover, the Fertilizer Regulation of Germany prohibits the application of digestion residues in arable areas from the main crop harvest until January 31. Another ban applies for permanent grassland and permanent forage crops between 1 November and 31 January [29]. Before these bans were implemented, the volume of the post-digester was decreased to create enough storage capacity for the following months of operation. The drop in the filling level of digester 1 was due to its cleaning process.
In addition to the reactor temperature, the temperature of the heating medium entering the system was recorded. Although the heating medium temperature followed the changes in the ambient air temperature (which increased with the decreases in the ambient air temperature), the temperature of the digesters could not be kept stable in extreme weather conditions. For example, the temperature of digester 2 dropped to 38.36 °C in October and 36.69 °C in November 2017 due to the high fluctuations in digester volume. Moreover, increases in the feeding rate led to increases in the heat requirement of digesters, which resulted in temperature drops.
A low ambient air temperature in winter 2017 led to higher fluctuations in the digester temperature, as represented in Figure 5. As mentioned above, several factors are responsible for fluctuations in the temperature of a biogas digester. Accordingly, a more stable process requires a detailed examination of temperature management in biogas plants and temperature homogeneity in biogas reactors.
3.1.1. Effect of the Temperature and Stirring on the Energy Production
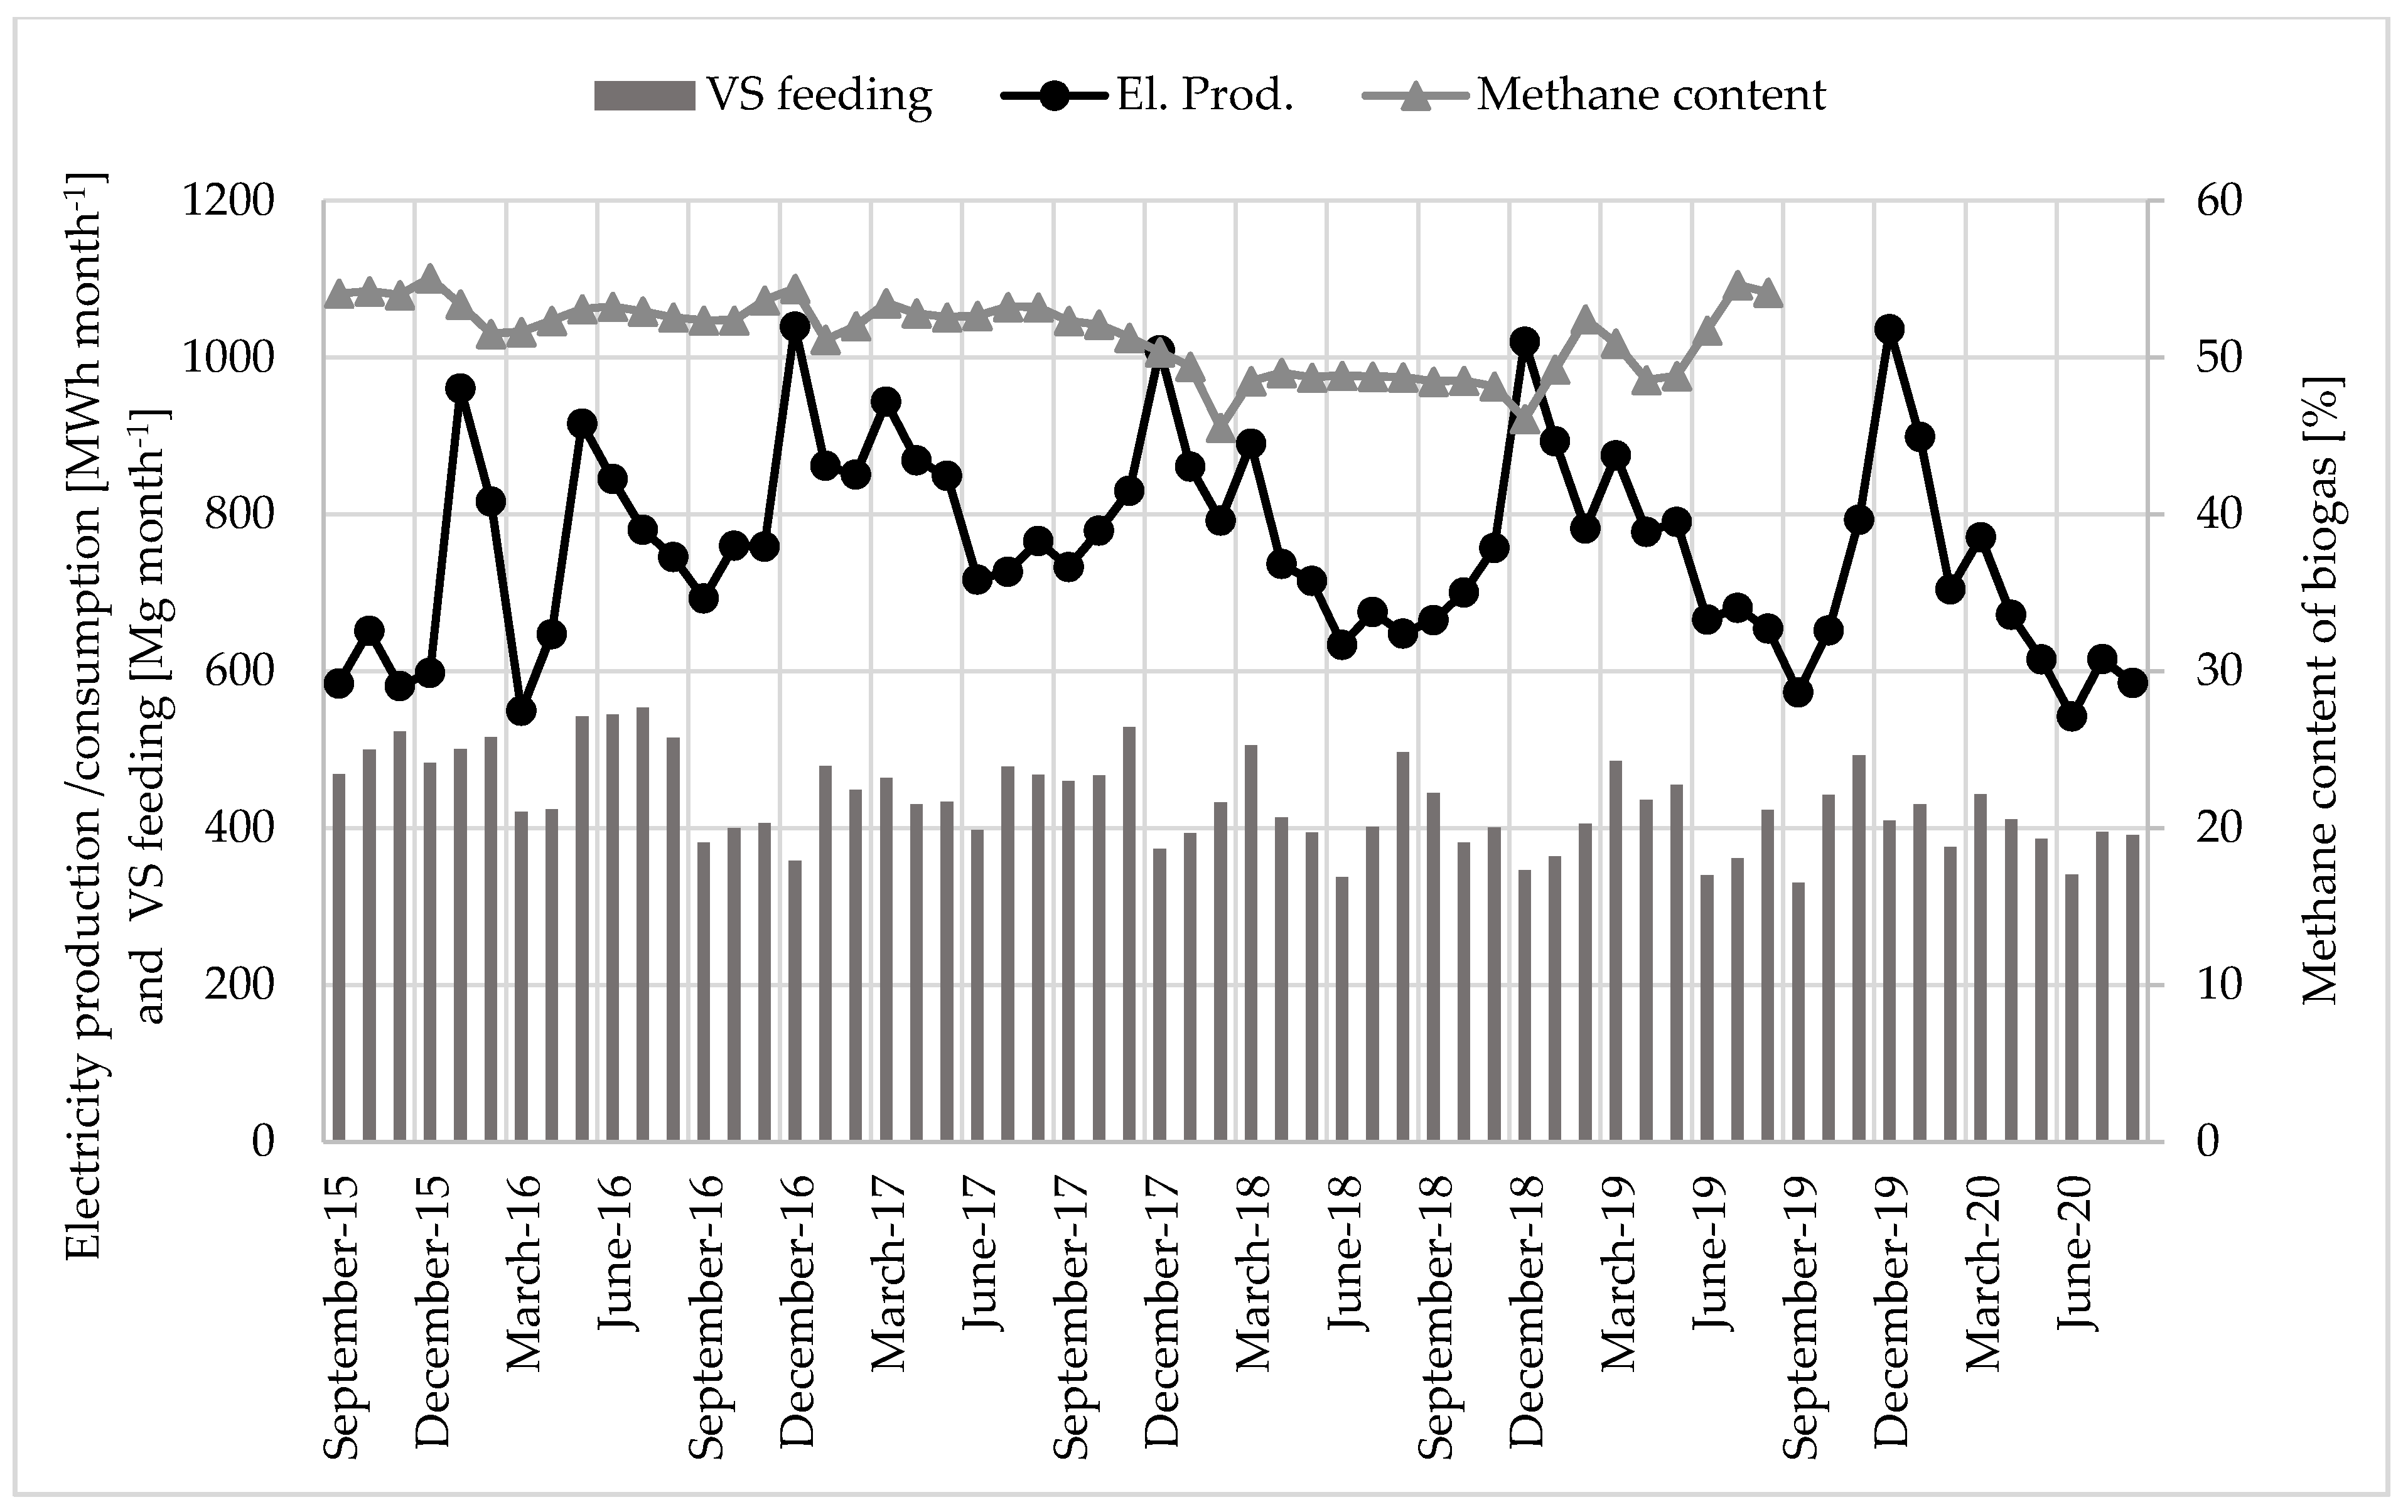
The methane concentration of the produced biogas was determined at a single measurement point, which measured the content of biogas coming from all digesters and digestate storage. The methane content of the biogas was 53.26 ± 1.10%, 52.53 ± 0.93% and 49.47 ± 2.23% in periods 1, 2, and 3, respectively. The variations were caused mainly by the changes in the feeding substrates, temperature, and working volume of the digesters (see Figure 7). Drops in the produced electricity were obtained in the summer months due to the lower feeding rate. Due to a failure of the methane sensor between July 2019 to August 2020, the received data were not reliable.
Although the total capacity of CHP units is around 1.6 MWel, the monthly electricity yield for this biogas plant was 404–1025 MWel during the five-year study period. In total, four CHP units can be used for electricity production (two in the biogas plant and two satellite units). Electricity production at the biogas plant depended mainly on the VS feeding, as represented in Figure 7, which was not enough to operate the biogas plant at full capacity. The specific electricity yield was calculated for the three mentioned periods, resulting in the following values: 1.45 ± 0.23 kWel (kgVS)−1, 1.86 ± 0.38 23 kWel (kgVS)−1, and 1.83 ± 0.33 23 kWel (kgVS)−1 for the periods 1, 2, and 3, respectively. In the case of this biogas plant, it is essential to mention that the hydraulic retention time (HRT) varied in the range of 150–210 days (including volumes of digestate storage), which is considered to be very long. The values for the first period were lower than those for the second and third periods because a new operation began after the expansion and time was required to fill the reactor volumes before electricity production was increased.
3.1.2. Results of the PT100 Measurement
The temperature was measured at five different levels in digester 1. The results of the previously mentioned five scenarios are shown in Table 2. Inside this digester, heating pipeline technology is used. Here, six pipes are hung on the inner wall of the digester, and a mixture of water and glycol flows inside them. The distance between the pipes is 30 cm, and the lowest pipe is located at a height of 138 cm. The table clearly shows that the temperature value at the level of 0.5 m is lower than that at the other heights due to the location of the heating pipes. The results showed that the temperature remains constant 3 h after turning off the stirrers.
3.1.3. Digestate Sample Analyses
Regular analyses were performed with digestate samples collected from digester 1, digester 2, and the post-digester, and the results are presented in Table 3 for the period 2017 to 2020. The fluctuations in the feed materials mainly cause changes in the parameters. In the first stage of the digestion process, TS fluctuated between 6.6% and 9.9%, and was approximately 3% lower in the post-digester samples. The pH of digestate samples fluctuated between 7.71 and 7.86, with higher pH in post-digester samples. As a result, lower VFA, lower VOA/TIC, and higher NH4-N+ results were obtained from post-digester samples than digester samples. In addition to these results, the results for the years prior to 2017 were shown in Nsair et al. (2019) [14].
3.2. Laboratory Scale Analyses
Laboratory-scale analyses were performed in two different experimental set-ups, implementing stirring and without stirring at two different temperatures: 40 and 44 °C for the sample from digester 1 and the post-digester. The results of these two studies are presented in the following two sections.
3.2.1. Analyses with Stirring
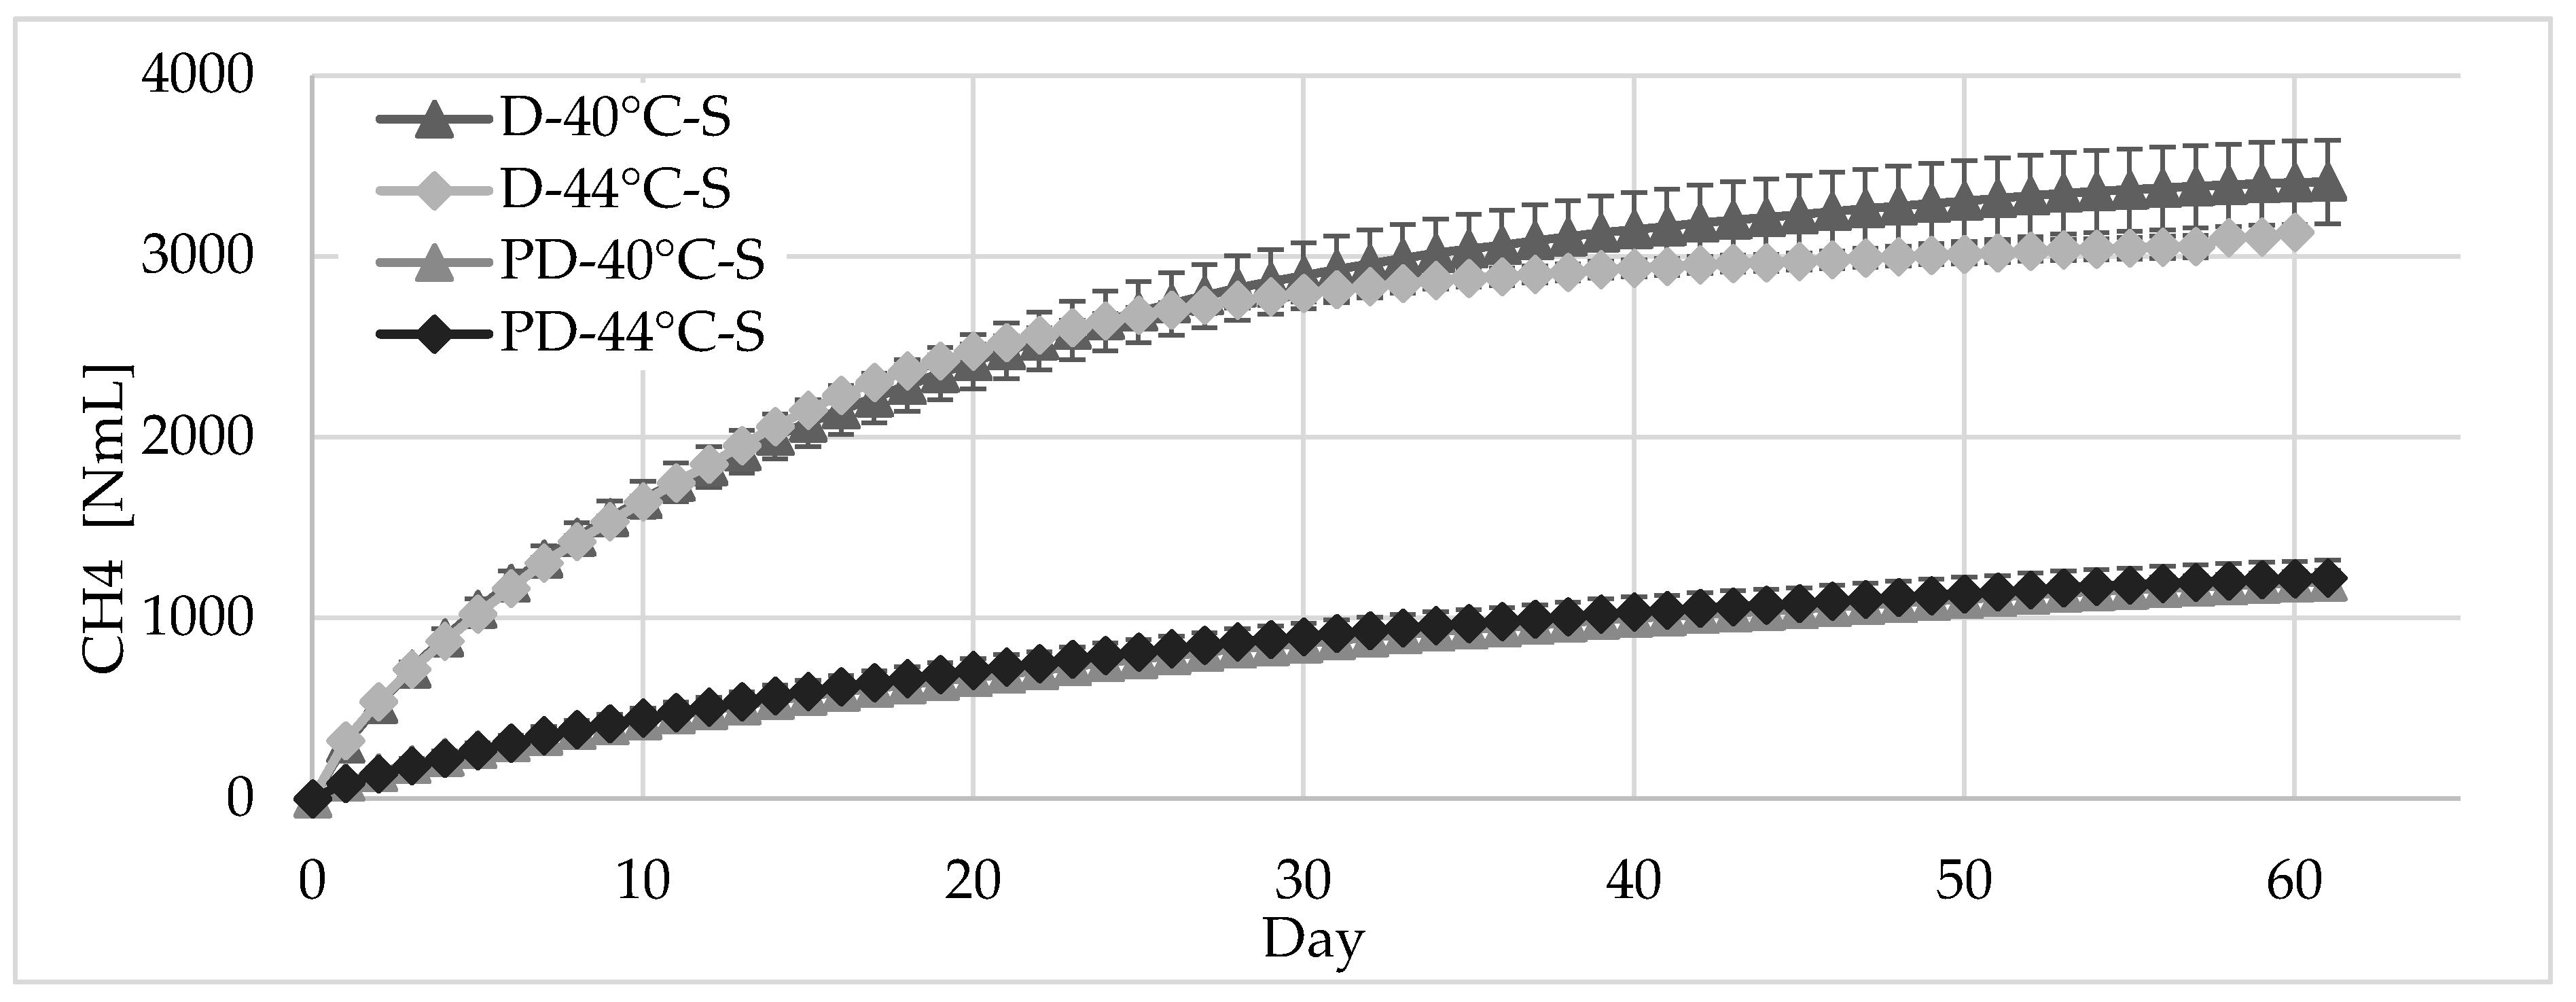
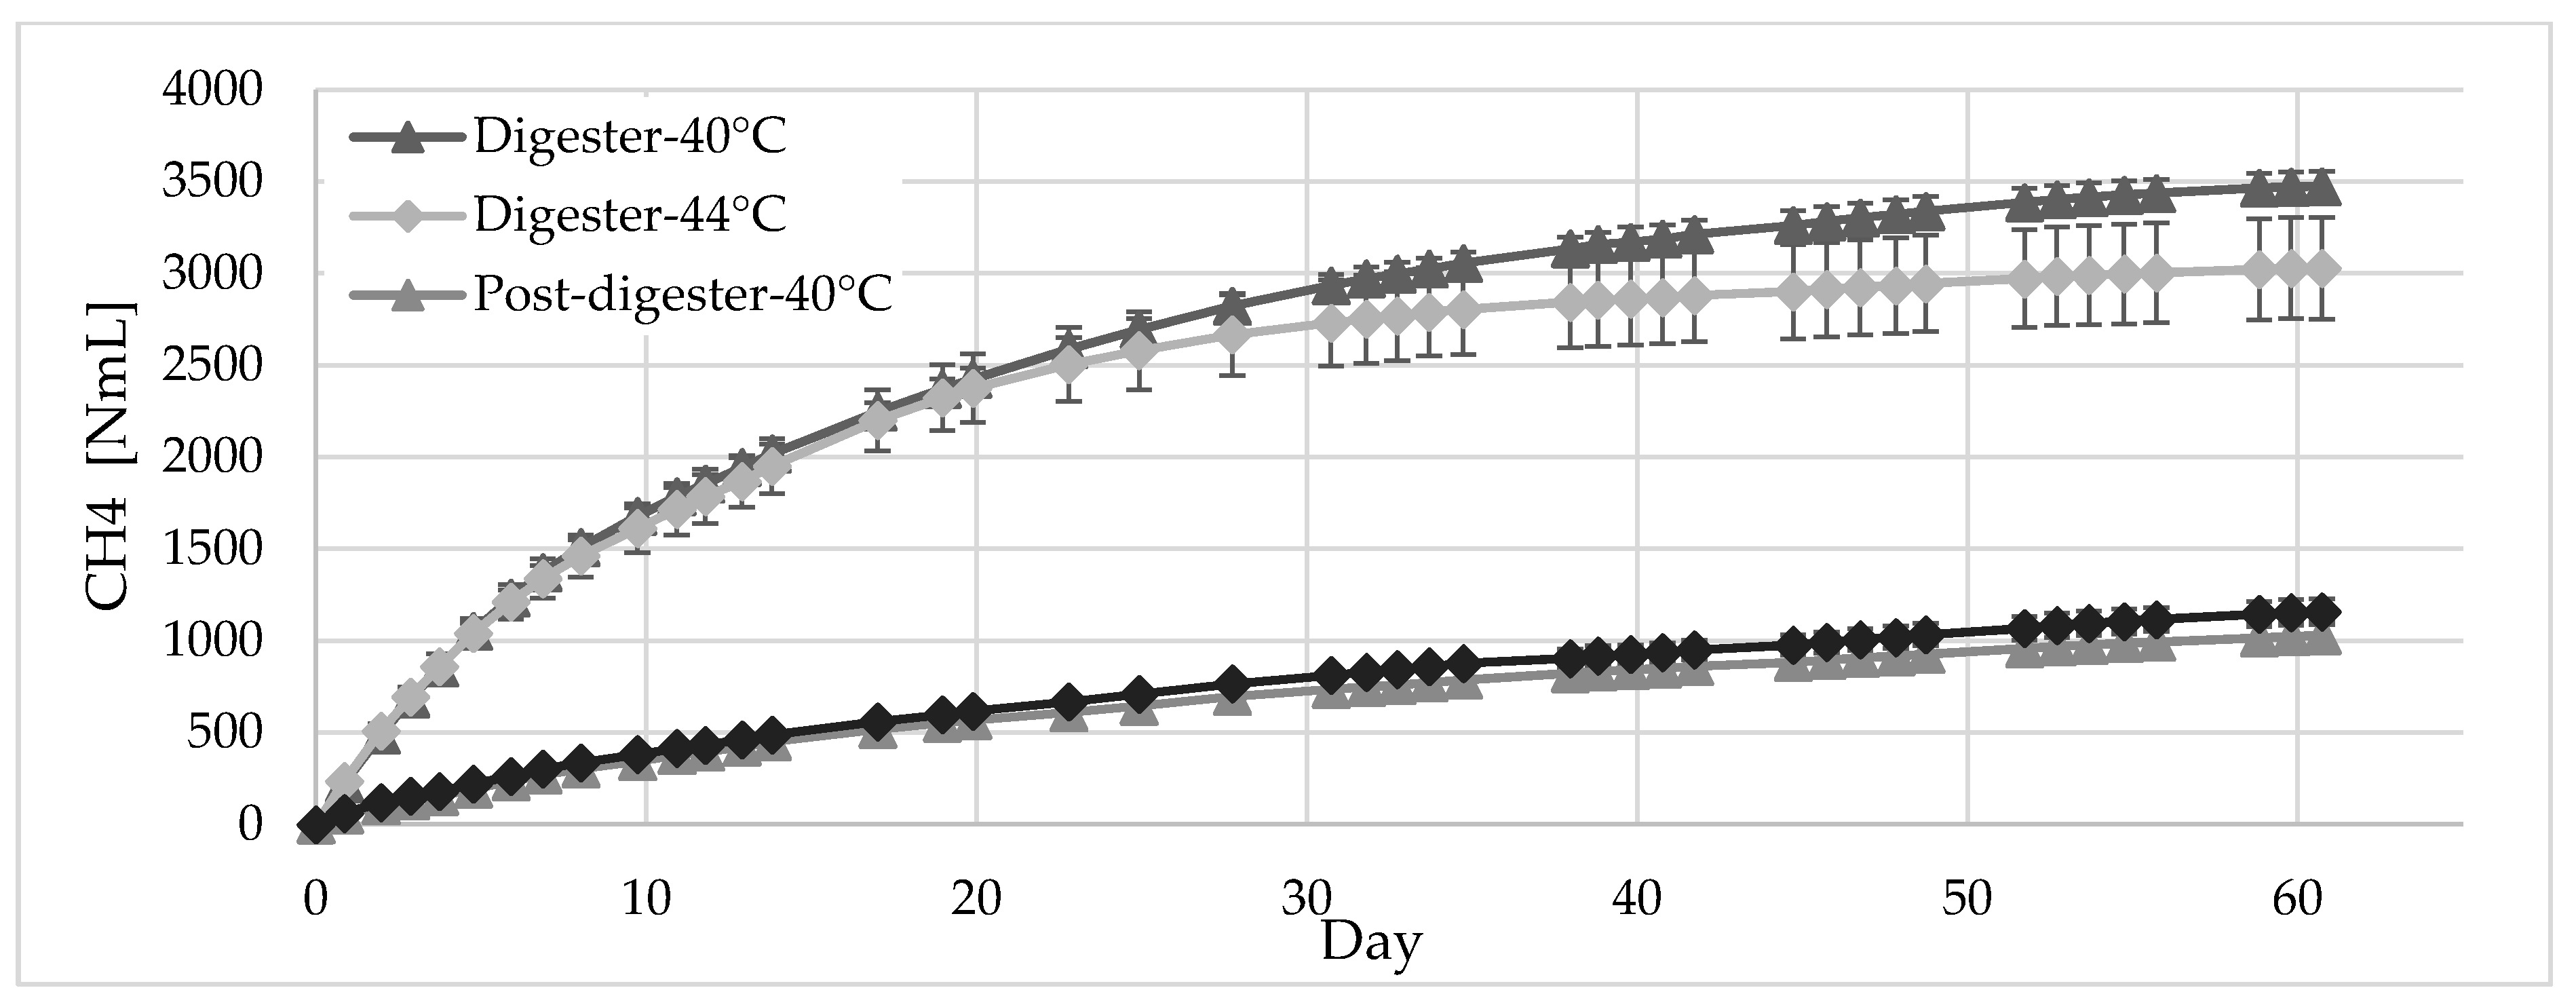
The biomethane generation results were obtained from AMPTS II test system software as the dry gas amount in NmL, and the cumulative biomethane production is represented in Figure 8. From the beginning of the test until day 25, the same amount of biomethane was obtained from the samples at different temperatures. After day 25, the methane generation varied for the samples from the digester at different temperatures. At the end of the experiment, a higher amount of biomethane was obtained at 40 °C. The cumulative biomethane produced from the samples from the digesters at the temperature of 40 °C were 10% higher than those at the temperature of 44 °C, having the value of 188.62 NmL CH4 g VS−1. In contrast, the results for the post-digester showed similarities for the different temperatures. The specific biomethane generation (NmL CH4 g VS−1) obtained from the digester samples was 188.62 ± 0.41 NmL CH4 g VS−1 at 40 °C and 170.48 ± 4.21 NmL CH4 g VS−1 at 44 °C, and from the post-digester samples the generation was 50.31 ± 2.43 NmL CH4 g VS−1 at 40 °C and 51.71 ± 3.69 at 44 °C.
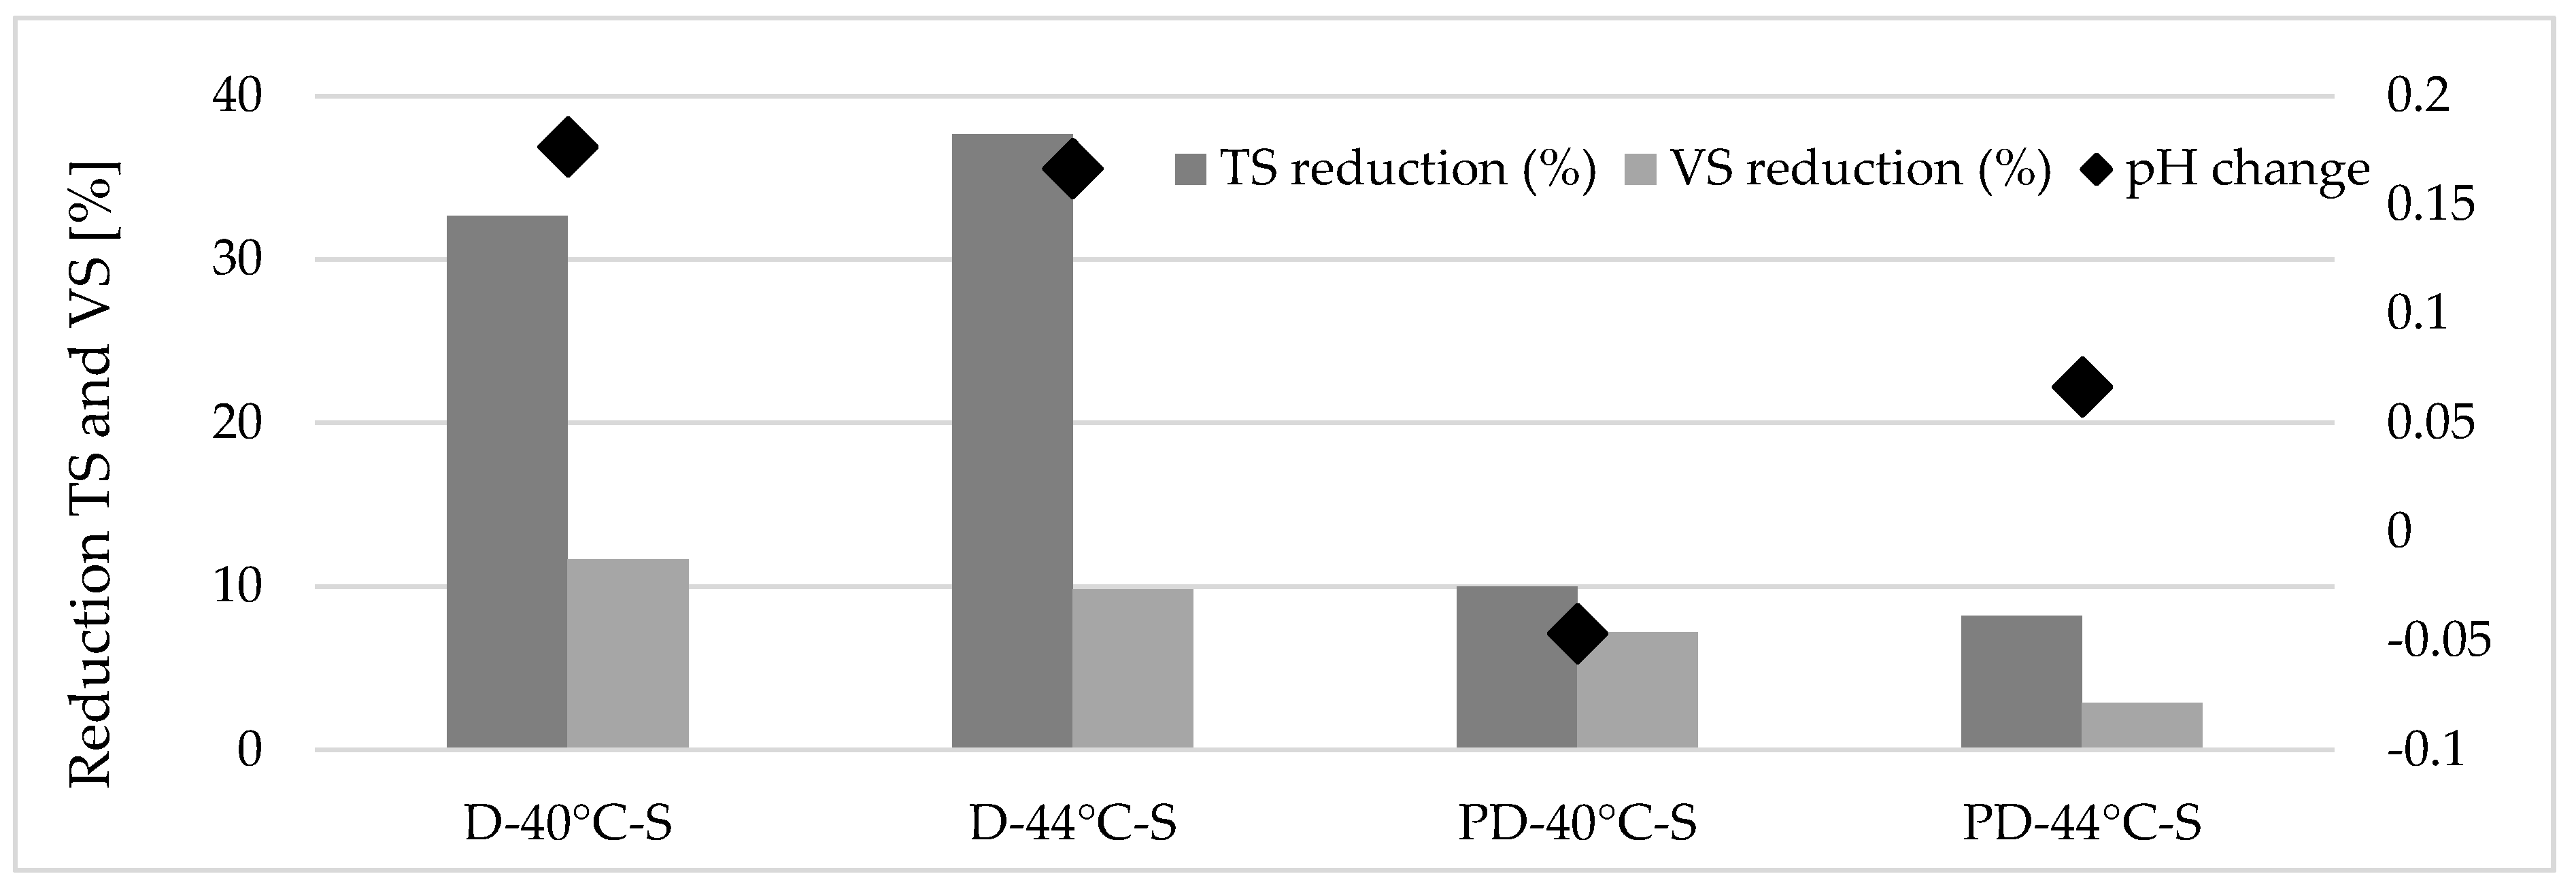
For the samples from the digester, the reduction in the TS was higher at 44 °C than for the samples at 44 °C, whereas the VS reduction showed similarities. For the samples from the post-digester, the decrease in TS and VS values showed a small increase for the samples at 40 °C in comparison with the samples at 44 °C (see Figure 9). The pH measurements before and after the test showed that there was an increase in each reactor, with the exception of the post-digester samples at 40 °C.
3.2.2. Analysis without Stirring
In these analyses, the biogas formation potential was measured, and the methane content of the biogas was analyzed to display the results as the amount of biomethane generation.
At 40 °C, the biogas (and biomethane) formation potential of digester samples was higher than for the samples at 44 °C, whereas higher biomethane was obtained from the post-digester samples at 44 °C. Thus, the specific biomethane production of the digester samples was 194.88 ± 4.59 NmL CH4 g VS−1 at 40 °C and 166.03 ± 13.79 NmL CH4 g VS−1 at 40 °C, whereas for the post-digester it was 43.91 ± 3.26 NmL CH4 g VS−1 at 40 °C and 49.03 ± 3.31 NmL CH4 g VS−1 at 44 °C.
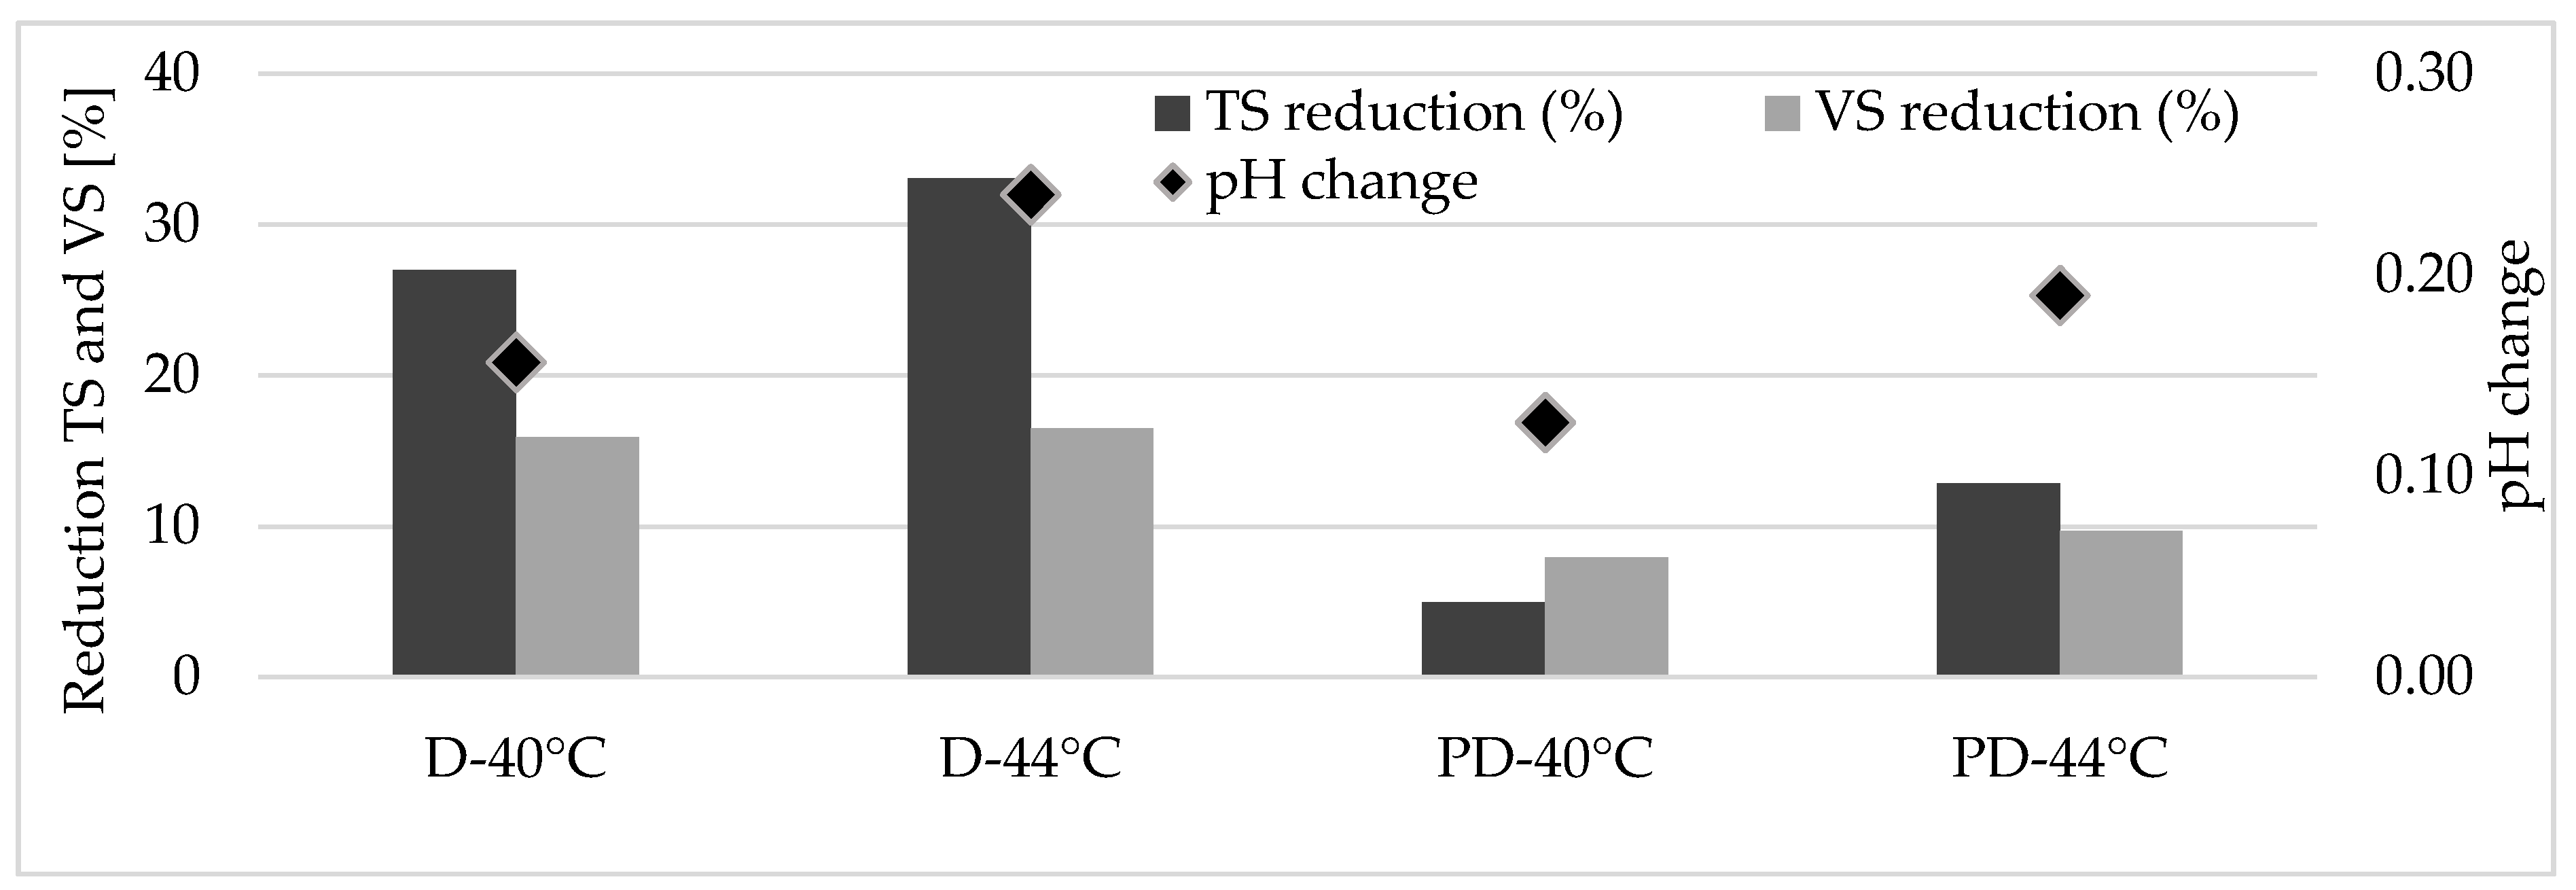
The quality of the biogas (methane content) increased for the digester samples at 40 °C from 55.8% to reach 66.1% after 60 days, whereas it decreased for the samples at 44 °C from 63.7% to 58.3% after 60 days. The TS reduction at 44 °C was higher than that at 40 °C, whereas the values of the VS reduction were almost the same.
The samples from the post-digester showed greater similarities in the values for the two different temperatures (40 and 44 °C) for the biomethane production, and the reduction in TS and VS as represented in Figure 10. The methane content from the biogas was in the ranges of 60.3–67.4% and 56.8–62.0% for the samples at 40 and 44 °C, respectively.
The daily amount of methane production from digester samples started to differ from day 5, and at day 20 for the post-digester samples, as represented in Figure 11.
4. Discussion
4.1. Discussion of the Results from Biogas Plant Analyses
The discussion is presented according to two main topics: the biogas plant’s operation and evaluation of temperature homogeneity inside the digester.
4.1.1. Operational Results from the Biogas Plant
As explained in the Section 2, the results are discussed for three periods in the following.
Period 1 (September 2015–June 2016)
During this period, the temperatures inside the digesters and post-digester did not change. The stirring was the same throughout the period. Due to the stability of the temperature and the stirring, differences in the amount of generated electricity in this period were minimized. Therefore, the small changes in the quality and quantity of the biogas that occurred in this period were caused mainly by the substrates used for feeding; for example, the decrease in the amount of the maize silage led to a decrease in the amount of biogas produced (electricity yield) in April 2016. In comparison, the increase in the amount of liquid manure led to a reduction in the CH4 content; for example, in the months of February and March 2016. The C:N ratio should always be controlled, in addition to the ammonia concertation. A decrease in the VS feeding in the months of March–April 2016 led to slight decrease in the VOA/TIC value, which showed that the biogas plant has the capacity to process a greater quantity of feed [30].
Period 2 (July 2016–December 2017)
During this period, the temperatures inside the digesters and the post-digester were less stable than the temperatures during period 1, and were 42.5 ± 0.1 °C, 42.5 ± 0.4 °C, and 42.0 ± 0.1 °C in digester 1, digester 2, and the post-digester, respectively. However, these fluctuations were small and had a minor effect on the fluctuations in the biogas quality and quantity. As a result, the specific electricity yield in this period was in the range of 1.86 ± 0.38 kWhel kgVS−1, and the methane content from the produced biogas was 52.53 ± 0.93%.
The main observation for this period is that a decrease in the temperatures occurred in the period of September 2017–December 2017 (41.7 ± 0.64 °C, 39.8 ± 2.23 °C, and 40.9 ± 0.29 °C in digester 1, digester 2, and the post-digester, respectively), and this drop in the temperatures led to a decrease in the methane content of the biogas by 2%. The decrease in the methane content was low due to the reduction in the feeding of manure and the increased feeding of maize silage at this time compared to the other months.
Period 3 (January 2018–August 2020)
For this period, the temperatures inside digester 1 (42.2 ± 0.6 °C), digester 2 (42.2 ± 1.0 °C), and the post-digester (41.6 ± 0.6 °C) changed in different months of the year. The specific electricity for the whole period was 1.8 ± 0.33 kWhel kgVS−1. Between June and August in period 3, high temperatures were observed in the digesters and the post-digester, resulting in higher methane content in the biogas. High fluctuations in the filling volume of the post-digester led to an approximately 1 °C temperature decrease by the end of the operation period.
The greatest quantity of heat in a biogas digester is lost from its roof. This is a particular problem in winter months [20,31]. A study performed by Teleszewski and Zukowski (2018) showed that there is a clear difference between the measurements in summer and in winter. Other parameters affecting the heat losses/gains in biogas plants are the heat gain from dissipation of stirrers and the heat gain from changes in the desulphurization process, which depend on the amount of biogas produced and the type of substrate, and, in turn, affect the type of chemical decomposition reaction (exothermic or endothermic) [20,32].
The changes in the temperature, in addition to the changes in the feedstock used, led to similar observations in this period to those in the previous periods:
- The decrease in the temperature leads to an increase in the electricity yield (biogas quantity), but lowers the methane content (methane quality);
- The higher quantity of manure feeding leads to a reduction in biogas quality.
4.1.2. Temperature Homogeneity in Digester 1
Homogeneity inside the digester is a critical parameter to ensure the stability and high efficiency of the anaerobic digestion process. The temperature measurements showed that the digester temperature is lower (by approximately 2 °C) at 0.5 m than at other heights. Due to the cleaning of the digester before the measurement, this low temperature cannot be the result of sedimentation. Nevertheless, it may show early detection of material accumulation with different thermal characteristics than those of digester, thus affecting the heat transfer in the digester. Consequently, pre-treatment for inorganic material removal, relocating the heating pipelines, or improvement of the stirring management may be possible solutions. Sand–manure separators can be used to remove bedding sand from manure and to supply reusable sand bedding [33]. Another option is heavy fraction separation from the substrate mixture. A ball mill can be used in pre-treatment to crush glass and stones [34]. If a pre-treatment is not implemented or not efficient, integrated self-cleaning systems can be used in the digester for sediment removal [35].
Examination of the stirring performance in the same digester via CFD simulation was performed by Nsair et al. (2019), and showed that the mixing velocity is lower in the area where sensors are installed [14]. Another option for better heat distribution is the combination of an agitation unit with a heat exchanger, as represented in the study of Fiapshev et al. (2018) [36].
4.2. Discussion of the Results from Laboratory Analyses
The two experiments with/without stirring showed that the production of biomethane is higher for the samples from the digester at 40 °C than at 44 °C. In contrast, a slightly greater amount of biomethane was obtained from post-digester samples at 44 °C. Adaptation of microorganisms in the process was more manageable at 40 °C than at 44 °C due to the dramatic decrease in methanogens above 42 °C [37]. The reaction of the digester and post-digester samples to the temperature changes was different because of the concentration of methanogens in these stages [38]. Due to the high concentration of methanogens in the post-digestion stage, adapting these samples to 44 °C was easier than adapting the samples from the first stage. In addition, ensuring homogeneity inside the post-digester reactors is easier than in the digester reactors due to the lower TS content and smaller particle size in the post-digester samples. The behavior of the cumulative biogas production at different temperatures was similar to the comparison of biogas production under mesophilic and thermophilic conditions: at higher temperatures, the quantity of generated biogas in the early days was higher but, thereafter, lower cumulative biogas generation was obtained. Higher biomethane generation from the samples without stirrers can result from enough contact time between substrates and microorganisms [14]. In addition, increasing the temperature to 44 °C can lead to the disruption of the enzymes taking part in the process [39].
The results also showed that the effect of temperature increases in the case of no-stirring, where the number of factors affecting the biogas formation potential decreases. Nevertheless, the temperature influences the viscosity of the digestate. The viscosity of the digestate decreases with the increase in the temperature. This leads to the conclusion that the stirring inside the fermenters minimizes the effect of the temperature changes on the productivity of biogas. In addition, the temperature plays a significant role in determining the effect of the stirrers on anaerobic digestion.
5. Conclusions
Temperature is one of the most critical design and process parameters in the anaerobic digestion process. Furthermore, the distribution of temperature inside the reactor strongly depends on the agitation. The outcomes of this study proved that the stability of the temperature inside digesters can be affected by a number of factors, such as ambient air temperature, reactor volume, feed material, and sedimentation. In addition, temperature measurements at different heights during the operation demonstrated the unequal distribution of the temperature inside the reactor. However, overall, the effect of these small temperature fluctuations (±2 °C) on the biogas production efficiency was not significant and did not differ during the different stages of the anaerobic digestion process. Therefore, redesigning the heating and mixing systems, and implementing different temperatures at different stages of anaerobic digestion, can improve efficiency. Furthermore, flexible and substrate-specific management alternatives may be an innovative solution for biogas plants in the future.
Author Contributions
Conceptualization, S.O.C. and A.N.; methodology, S.O.C., A.N. and N.W.; validation, N.W. and K.K.; formal analysis, S.O.C.; resources, K.K.; data curation, S.O.C. and A.N.; writing—original draft preparation, S.O.C., A.N., N.W. and K.K.; writing—review and editing, S.O.C., A.N., N.W. and K.K.; visualization, S.O.C. and A.N.; supervision, N.W. and K.K.; project administration, K.K. All authors have read and agreed to the published version of the manuscript.
Funding
This research received no external funding.
Acknowledgments
Publishing fees were supported by the Funding Programme “Open Access Publishing” of the Hamburg University of Technology. We would like to thank the German Academic Exchange Service (DAAD) for their scholarship to Senem Önen Cinar.
Conflicts of Interest
The authors declare no conflict of interest.
References
- Paolini, V.; Petracchini, F.; Segreto, M.; Tomassetti, L.; Naja, N.; Cecinato, A. Environmental impact of biogas: A short review of current knowledge. J. Environ. Sci. Health Part A 2018, 53, 899–906. [Google Scholar] [CrossRef] [PubMed] [Green Version]
- Sarika, J.; Newman, D.; Nzihou, A.; Dekker, H.; Le Feuvre, P.; Richter, H.; Gobe, F.; Morton, C.; Thompson, R. Global Potential of Biogas; The World Biogas Association: London, UK, 2019. [Google Scholar]
- International Energy Agency. Data and Statistics: Explore Energy Data by Category, Indicator, Country or Region. Available online: https://www.iea.org/data-and-statistics?country=GERMANY&fuel=Renewables%20and%20waste&indicator=Electricity%20generation%20from%20biofuels%20and%20waste%20by%20source (accessed on 23 September 2020).
- EPA—United States Environmental Protection Agency. Global Greenhouse Gas Emmissions Data. Available online: https://www.epa.gov/ghgemissions/global-greenhouse-gas-emissions-data (accessed on 28 September 2020).
- European Environmental Agency. Total Greenhouse Gas Emmison Trends and Projections in Europe. Available online: https://www.eea.europa.eu/data-and-maps/indicators/greenhouse-gas-emission-trends-6/assessment-3 (accessed on 28 September 2020).
- Fachagentur Nachwachsende Rohstoffe e. V. THG-Emissionen von Biogasanlagen im Vergleich zum Deutschen Strommix. Available online: https://mediathek.fnr.de/grafiken/daten-und-fakten/bioenergie/biogas/thg-emissionen-von-biogasanlagen-im-vergleich-zum-deutschen-strommix.html (accessed on 23 September 2020).
- Nsair, A.; Onen Cinar, S.; Alassali, A.; Abu Qdais, H.; Kuchta, K. Operational Parameters of Biogas Plants: A Review and Evaluation Study. Energies 2020, 13, 3761. [Google Scholar] [CrossRef]
- Fachagentur Nachwachsende Rohstoffe e. V. Guide to Biogas from Production to Use; Fachagentur Nachwachsende Rohstoffe e. V.: Gülzow-Prüzen, Germany, 2012. [Google Scholar]
- Adekunle, K.F.; Okolie, J.A. A review of biochemical process of anaerobic digestion. Adv. Biosci. Biotechnol. 2015, 6, 205. [Google Scholar] [CrossRef] [Green Version]
- Anukam, A.; Mohammadi, A.; Naqvi, M.; Granström, K. A review of the chemistry of anaerobic digestion: Methods of accelerating and optimizing process efficiency. Processes 2019, 7, 504. [Google Scholar] [CrossRef] [Green Version]
- Brock, T.D.; Madigan, M.T.; Martinko, J.M.; Parker, J. Brock Biology of Microorganisms; Prentice-Hall: Upper Saddle River, NJ, USA, 2003; ISBN 0130491470. [Google Scholar]
- Al-Wahaibi, A.; Osman, A.I.; Al-Muhtaseb, A.H.; Alqaisi, O.; Baawain, M.; Fawzy, S.; Rooney, D.W. Techno-economic evaluation of biogas production from food waste via anaerobic digestion. Sci. Rep. 2020, 10, 15719. [Google Scholar] [CrossRef] [PubMed]
- Önen, S.; Nsair, A.; Kuchta, K. Innovative operational strategies for biogas plant including temperature and stirring management. Waste Manag. Res. 2019, 37, 237–246. [Google Scholar] [CrossRef] [PubMed]
- Nsair, A.; Cinar, S.Ö.; Qdais, H.A.; Kuchta, K. Optimizing the performance of a large scale biogas plant by controlling stirring process: A case study. Energy Convers. Manag. 2019, 198, 111931. [Google Scholar] [CrossRef]
- Ganidi, N.; Tyrrel, S.; Cartmell, E. Anaerobic digestion foaming causes—A review. Bioresour. Technol. 2009, 100, 5546–5554. [Google Scholar] [CrossRef] [PubMed] [Green Version]
- Rajagopal, R.; Massé, D.I.; Singh, G. A critical review on inhibition of anaerobic digestion process by excess ammonia. Bioresour. Technol. 2013, 143, 632–641. [Google Scholar] [CrossRef] [PubMed]
- Fachagentur Nachwachsende Rohstoffe e. V. Leitfaden Biogas von der Gewinnung zur Nutzung: Von der Gewinnung zur Nutzung; Fachagentur Nachwachsende Rohstoffe e. V.: Gülzow-Prüzen, Germany, 2016. [Google Scholar]
- Fernández-Rodríguez, J.; Pérez, M.; Romero, L.I. Dry thermophilic anaerobic digestion of the organic fraction of municipal solid wastes: Solid retention time optimization. Chem. Eng. J. 2014, 251, 435–440. [Google Scholar] [CrossRef]
- Al Seadi, T.; Rutz, D.; Prassl, H.; Köttner, M.; Finsterwalder, T.; Volk, S.; Janssen, R. Biogas Handbook; University of Southern Denmark Esbjerg: Esbjerg, Denmark, 2008. [Google Scholar]
- Gerber, M. Ganzheitliche stoffliche und energetische Modellierung des Biogasbildungsprozesses. 2010. Available online: https://docplayer.org/530190-Ganzheitliche-stoffliche-und-energetische-modellierung-des-biogasbildungsprozesses.html (accessed on 20 December 2021).
- Wang, B. Factors That Influence the Biochemical Methane Potential (BMP) Test; Lund University: Lund, Sweden, 2016. [Google Scholar]
- Besgen, S. Energie-Und Stoffumsetzung in Biogasanlagen-Ergebnisse Messtechnischer Untersuchungen an Landwirtschaftlichen Biogasanlagen im Rheinland; Universitäts-und Landesbibliothek Bonn: Bonn, Gremany, 2005. [Google Scholar]
- Gerardi, M.H. The Microbiology of Anaerobic Digesters; John Wiley & Sons: Hoboken, NJ, USA, 2003; ISBN 0471468959. [Google Scholar]
- Zhang, J.; Sun, K.; Wu, M.; Zhang, L. Influence of temperature on performance of anaerobic digestion of municipal solid waste. J. Environ. Sci. 2006, 18, 810–815. [Google Scholar]
- Rutz, D.; Mergner, R.; Janssen, R. Sustainable Heat Use of Biogas Plants: A Handbook; WIP Renewable Energies: Munich, Germany, 2015; ISBN 3936338353. [Google Scholar]
- VDI. VDI 4630 Fermentation of organic materials. In Characterization of the Substrate, Sampling, Collection of Material Data, Fermentation Tests; Beuth Verlag: Berlin, Germany, 2009. [Google Scholar]
- Bioprocess Control. AMPTS II and AMPTS II Light Automatic Methane Potential Test System, Operation and Maintenance Manuel. Available online: https://bioprocesscontrol.com/wp-content/uploads/2020/08/bioprocess-control-manual-ampts-ii-ampts-ii-light.pdf (accessed on 10 December 2021).
- Cinar, S.Ö.; Kuchta, K. Evaluation of Temperature Changes in Anaerobic Digestion Process. Detritus 2020, 10, 11–18. [Google Scholar] [CrossRef]
- Landwirtschaftkammer Nordrhein-Westfallen. Die Neue Düngeverordnung 2020-Was Ändert Sich? Available online: https://www.landwirtschaftskammer.de/landwirtschaft/ackerbau/duengung/duengeverordnung/duev-2020.htm (accessed on 26 October 2021).
- Al-Addous, M.; Alnaief, M.; Class, C.; Nsair, A.; Kuchta, K.; Alkasrawi, M. Technical possibilities of biogas production from olive and date waste in Jordan. BioResources 2017, 12, 9383–9395. [Google Scholar] [CrossRef]
- Teleszewski, T.J.; Żukowski, M. Analysis of heat loss of a biogas anaerobic digester in weather conditions in Poland. J. Ecol. Eng. 2018, 19, 242–250. [Google Scholar] [CrossRef]
- Lindorfer, H.; Braun, R.; Kirchmayr, R. Self-heating of anaerobic digesters using energy crops. Water Sci. Technol. 2006, 53, 159–166. [Google Scholar] [CrossRef] [PubMed]
- Gooch, C.A.; Wedel, A.W.; Karszes, J. Economic Analysis of Mechanical Sand-Manure Separation of Flushed Sand-Laden Dairy Manure. In Proceedings of the 2003 ASAE Annual Meeting, Las Vegas, NV, USA, 27–30 July 2003; American Society of Agricultural and Biological Engineers: St. Joseph, MI, USA, 2003. [Google Scholar]
- Schu, K.; Schu, R. Sand im Getriebe der Vergärung. In Internationale Tagung MBA; Weidemeier, K., Ed.; Cuvillier Verlag: Göttingen, Germany, 2007; pp. 494–506. [Google Scholar]
- Finsterwalder Umwelttechnik. Self Cleaning Digester-Sediment Removal. Available online: https://www.fitec.com/wp-content/uploads/2018/12/B06E_Self-Cleaning-Digester-Sediment-Removal.pdf (accessed on 17 December 2021).
- Fiapshev, A.; Kilchukova, O.; Shekikhachev, Y.; Khamokov, M.; Khazhmetov, L. Mathematical model of thermal processes in a biogas plant. In MATEC Web of Conferences; EDP Sciences: Les Ulis, France, 2018. [Google Scholar]
- Jabłoński, S.; Rodowicz, P.; Łukaszewicz, M. Methanogenic archaea database containing physiological and biochemical characteristics. Int. J. Syst. Evol. Microbiol. 2015, 65, 1360–1368. [Google Scholar] [CrossRef] [PubMed]
- Van, D.P.; Takeshi, F.; Minh, G.H.; Phu, S.T.P. Comparison between single and two-stage anaerobic digestion of vegetable waste: Kinetics of methanogenesis and carbon flow. Waste Biomass Valorization 2020, 11, 6095–6103. [Google Scholar]
- Caballero-Arzápalo, N. Untersuchungen zum Anaeroben Abbauprozess Ausgewählter Abfallsubstrate mit Hilfe Spezieller Mikroorganismen und Enzyme; Technische Universität München: Munich, Germany, 2015. [Google Scholar]
Figure 1.
Components of the industrial-scale biogas plant and the mass flow.

Figure 2.
Monthly total feeding quantities of the substrates at the biogas plant.

Figure 3.
PT100 sensor installation inside digester 1.

Figure 4.
Schematic representation of laboratory analyses.

Figure 5.
Distribution of monthly average operation temperatures in digester 1, digester 2, and the post-digester.
Figure 5.
Distribution of monthly average operation temperatures in digester 1, digester 2, and the post-digester.

Figure 6.
Average filling levels of digester 1 (D1), digester 2 (D2), and the post-digester (PD).

Figure 7.
Monthly total VS feeding, electricity production, and average methane content of biogas during 2015–2020.
Figure 7.
Monthly total VS feeding, electricity production, and average methane content of biogas during 2015–2020.

Figure 8.
Cumulative bio-methane generation curves in stirred batch reactors (stirred).

Figure 9.
Results of analytical analysis at the beginning and the end of the test (stirred).

Figure 10.
Results of analytical analysis at the beginning and end of the test (non-stirred).

Figure 11.
Cumulative bio-methane generation curves in stirred batch reactors (non-stirred).


Table 1.
Operation time and electricity consumption of the stirrers at the industrial-scale biogas plant.
Table 1.
Operation time and electricity consumption of the stirrers at the industrial-scale biogas plant.
| Stirrer | LM | D1 | D2 | PD | DG1 | DG2 | ||
|---|---|---|---|---|---|---|---|---|
| Period 1 | Propellers | Total operating (hours/day) | 0.20 | 3.43 | 2.4 | 3.20 | 0.80 | 0.53 |
| Hydro-mixers | Total operating (hours/day) | 3.43 | 2.40 | |||||
| Daily total consumed electricity = 367.5 kWh | ||||||||
| Period 2 | Propellers | Total operating (hours/day) | 0.33 | 2.40 | 2.40 | 3.20 | 0.33 | 0.53 |
| Hydro-mixers | Total operating (hours/day) | 1.20 | 1.20 | |||||
| Daily total consumed electricity = 279.5 kWh | ||||||||
| Period 3 | Propellers | Total operating (hours/day) | 0.33 | 6 | 6 | 3.2 | 0.33 | 0.53 |
| Hydro-mixers | Total operating (hours/day) | 4.8 | 4.8 | |||||
| Daily total consumed electricity = 545.6 kWh | ||||||||
Table 2.
Results of PT100 temperature management.
| Situation | Scenario I | Scenario II | ||||||||||
| Measurement Point (m)/Time | 00:20 | 00:35 | 00:50 | 01:05 | 01:20 | 01:40 | 01:55 | 02:10 | 02:25 | 02:40 | 02:55 | |
| 4.5 | 42.3 | 42.3 | 42.2 | 42.2 | 42.2 | 42.6 | 42.5 | 42.5 | 42.5 | 42.5 | 42.6 | |
| 3.5 | 42.3 | 42.3 | 42.3 | 42.2 | 42.2 | 42.6 | 42.6 | 42.6 | 42.6 | 42.6 | 42.6 | |
| 2.5 | 42.3 | 42.2 | 42.2 | 42.2 | 42.2 | 42.6 | 42.6 | 42.6 | 42.6 | 42.6 | 42.6 | |
| 1.5 | 42.4 | 42.3 | 42.4 | 42.3 | 42.3 | 42.7 | 42.7 | 42.7 | 42.7 | 42.7 | 42.7 | |
| 0.5 | 40.8 | 40.7 | 40.7 | 40.8 | 40.7 | 40.7 | 40.6 | 40.4 | 40.6 | 40.5 | 40.7 | |
| Situation | Scenario III | Scenario IV | Scenario V | |||||||||
| Measurement point (m) | 00:00 | 00:15 | 00:30 | 00:45 | 00:00 | 00:15 | 00:30 | 00:45 | 00:08 | 00:23 | 00:38 | 00:53 |
| 4.5 | 42.3 | 42.3 | 42.3 | 42.3 | 42.3 | 42.3 | 42.2 | 42.3 | 42.3 | 42.3 | 42.3 | 42.3 |
| 3.5 | 42.3 | 42.4 | 42.3 | 42.3 | 42.3 | 42.3 | 42.3 | 42.3 | 42.3 | 42.3 | 42.4 | 42.3 |
| 2.5 | 42.3 | 42.3 | 42.3 | 42.3 | 42.3 | 42.3 | 42.3 | 42.3 | 42.3 | 42.2 | 42.3 | 42.3 |
| 1.5 | 42.4 | 42.4 | 42.4 | 42.4 | 42.4 | 42.4 | 42.4 | 42.4 | 42.4 | 42.4 | 42.4 | 42.4 |
| 0.5 | 40.7 | 40.4 | 40.7 | 40.7 | 40.4 | 40.5 | 40.5 | 40.4 | 40.5 | 40.5 | 40.5 | 40.7 |
Table 3.
Results of digestate sample analyses between 2017 and 2020.
| Year | Digester * | TS (%) | VS (%TS) | pH | VFAs (mg L−1) | HCO3− (mg L−1) | NH4-N+ (mg L−1) | VOA/TIC |
|---|---|---|---|---|---|---|---|---|
| 2017 | D1 | 9.0 | 64.9 | 7.79 | 858 | 22,568 | 2964 | 0.192 |
| D2 | 9.5 | 63.0 | 7.82 | 1048 | 22,226 | 2502 | 0.194 | |
| PD | 6.3 | 66.8 | 7.96 | 483 | 22,650 | 2810 | 0.143 | |
| 2018 | D1 | 6.7 | 73.9 | 7.69 | 646 | 19,233 | 2160 | 0.221 |
| D2 | 6.6 | 73.2 | 7.70 | 571 | 19,037 | 2424 | 0.203 | |
| PD | 4.9 | 68.7 | 8.06 | 401 | 20,111 | 2824 | 0.158 | |
| 2019 | D1 | 9.2 | 71.9 | 7.71 | 867 | 21,019 | 2306 | 0.230 |
| D2 | 8.4 | 73.7 | 7.72 | 598 | 21,575 | 2464 | 0.210 | |
| PD | 6.3 | 71.1 | 7.98 | 412 | 23,407 | 2967 | 0.190 | |
| 2020 | D1 | 9.5 | 70.9 | 7.86 | 698 | 24,055 | 3043 | 0.219 |
| D2 | 9.9 | 73.3 | 7.87 | 737 | 23,040 | 3043 | 0.210 | |
| PD | 6.4 | 69.4 | 7.91 | 387 | 22,430 | 3004 | 0.207 |
* D1: digester 1, D2: digester 2 and PD: post-digester.
Publisher’s Note: MDPI stays neutral with regard to jurisdictional claims in published maps and institutional affiliations. |
© 2022 by the authors. Licensee MDPI, Basel, Switzerland. This article is an open access article distributed under the terms and conditions of the Creative Commons Attribution (CC BY) license (https://creativecommons.org/licenses/by/4.0/).
Share and Cite
MDPI and ACS Style
Onen Cinar, S.; Nsair, A.; Wieczorek, N.; Kuchta, K. Long-Term Assessment of Temperature Management in an Industrial Scale Biogas Plant. Sustainability 2022, 14, 612. https://0-doi-org.brum.beds.ac.uk/10.3390/su14020612
AMA Style
Onen Cinar S, Nsair A, Wieczorek N, Kuchta K. Long-Term Assessment of Temperature Management in an Industrial Scale Biogas Plant. Sustainability. 2022; 14(2):612. https://0-doi-org.brum.beds.ac.uk/10.3390/su14020612
Chicago/Turabian StyleOnen Cinar, Senem, Abdullah Nsair, Nils Wieczorek, and Kerstin Kuchta. 2022. "Long-Term Assessment of Temperature Management in an Industrial Scale Biogas Plant" Sustainability 14, no. 2: 612. https://0-doi-org.brum.beds.ac.uk/10.3390/su14020612
Note that from the first issue of 2016, this journal uses article numbers instead of page numbers. See further details here.