
The Impact of Hotel Customer Experience on Customer Satisfaction through Online Reviews


1
School of Global Studies, Kyungsung University, 309 Suyoungro, Nam-gu, Busan 48434, Korea
2
Wellness & Tourism Big Data Research Institute, Kyungsung University, 309 Suyoungro, Nam-gu, Busan 48434, Korea
3
School of Hospitality & Tourism Management, Kyungsung University, 309 Suyoungro, Nam-gu, Busan 48434, Korea
*
Author to whom correspondence should be addressed.
Sustainability 2022, 14(2), 848; https://0-doi-org.brum.beds.ac.uk/10.3390/su14020848
Submission received: 27 October 2021
/
Revised: 4 January 2022
/
Accepted: 7 January 2022
/
Published: 12 January 2022
(This article belongs to the Special Issue Big Data and Sustainability in the Tourism Industry)
Abstract
:With the growing popularity of the internet, customers can easily share their experiences and information in online reviews. Consumers recognize online reviews as a useful source of information prior to consumption, and many online reviews influence consumer purchasing decisions. Understanding the customer experience in online reviews is thus necessary to maintain customer satisfaction and repurchase intention for the sustainable development of the hotel business. This study assessed the fundamental selection attributes of customers from online reviews reflecting the hotel customer experience, and investigated their association with customer satisfaction. A total of 8229 reviews were collected from Google travel websites from December 2019 to July 2021. Text mining and semantic network analysis were adopted for big data analysis. Factor and regression analyses were then used for quantitative analysis. Based on linear regression analysis, the Service and Dining factors significantly affected customer satisfaction. Service is a critical selection attribute for customers, and the provision of more particular services is necessary, especially after COVID-19. These results indicate that understanding online reviews can provide theoretical and practical implications for developing sustainable strategies for the hotel industry.
1. Introduction
When tourists plan to travel and book accommodations, they often search for hotels they have never been to before. Acquisition of hotel information can reduce the risk of choosing poorly. Traditionally, word of mouth (WOM) from friends has been used to reduce risks, and with the popularity of the internet, electronic word of mouth (eWOM) is becoming important [1,2], as consumers begin to trust in WOM transmitted over the internet [3,4]. Commonly, consumers want to express or share their opinions and seek information via digital means [5,6]. Filieri and McLeay [7] found that 96.4% of their respondents (7000) had used the internet as a source of information in the travel planning stage, and 90% referred to other customers’ reviews.
Because the characteristics of the service field are not like those for tangible products, it is difficult to determine the actual situation of a hotel until the customer has experienced it [8]. Here, eWOM provides rich data that reflect consumer characteristics and perceptions of service satisfaction. The experience of the service mentioned in eWOM thus implies the main attributes and quality levels of the product or service considered by the customer [9], and eWOM can significantly affect tourists’ purchase decisions and the business performance of hotels [10].
Many researchers have conducted surveys to investigate customer satisfaction and hotel selection attributes in the hotel and hospitality industry [11,12,13]. Although the survey method has the advantage of being able to elicit answers to the desired questions, there may be limitations due to factors that might cause measurement errors, such as the form of the questionnaire, the survey term, the response category, and the order of the survey [14]. To address this gap, online review mining was conducted to gain more accurate and detailed customer information through the application of big data analytics in the hospitality sector [15,16,17,18,19]. Filieri and Mariani [16] adopted big data analytics to examine how reviews from different countries evaluate the helpfulness of online reviews. Ban and Kim [19] analyzed user reviews to understand various airline passenger satisfaction attributes using text mining analysis.
However, there are still only limited studies on the online reviews of hotel customers that use big data analytics, explore the factors reflecting customer experiences based on these review data, and then verify the relationship between the extracted factors and customer satisfaction. Therefore, this study sought to derive meaningful implications by analyzing online reviews of hotels and exploring which attributes affected customer satisfaction.
2. Literature Review
2.1. Electronic Word of Mouth
E-commerce has a strategic emphasis for business and consumers, and WOM has been reconceptualized as eWOM since traditional, face-to-face WOM is changing into eWOM, as consumers can obtain information regarding products or services online before making a purchase decision [20,21]. When purchasing intangible products or services, consumers tend to rely more on eWOM for products or services they have not used or experienced before [22], as this helps customers obtain specific information influenced by customers’ selection attributes and shared personal experiences, opinions, photos, hotel reviews, and vacation suggestions [23].
Online review websites such as Tripadvisor serve as an essential platform for consumers to share purchasing experiences and express their opinions about products and services [24]. Reviews exchanged among consumers contain information about the user’s experience and how that experience is perceived [25], such that customers are more likely to trust eWOM than information provided by sellers [22]. By reading other people’s reviews, potential consumers better construct their interpretation of the product and become more aware of the risks to their transactions. Vermeulen and Seegers [26] found that consumers’ exposure to online reviews improved the probability of booking a hotel. Stringam, Gerdes, and Vanleeuwen [27] analyzed reviews on Expedia.com, an online travel agency platforms, and found that the overall satisfaction evaluation had a high correlation between recommendation intentions. Ban and Kim [19] analyzed the online reviews on Skytrax.com and quantitatively identified the relationship among six evaluation factors (seat comfort, staff, F&B, entertainment, ground service, and value for money), customer satisfaction, and recommendations.
This study thus investigates customer experience through text-mining analysis of reviews of hotel products, which are representative experience goods greatly affected by online reviews.
2.2. Customer Experience and Satisfaction
Customer experience, which means that an individual has experienced the goods or services of a company as a consumer, was first conceptualized by Schmitt [28] as being composed of sensory, emotional, cognitive, behavioral, and relational experiences. Meyer and Schwager [29] defined customer experience as the customers’ personal/subjective response to direct/indirect contact with a firm in any form. Customer experience is remembered positively or negatively depending on the customer’s situation, which leads to customer satisfaction, and customers who positively evaluate the experience can be said to feel satisfied [29].
Customer satisfaction is a complex experience in the hospitality industry, and assessing what the customer has experienced is complicated [30]. Focusing on customer experience and satisfaction has inevitably increased as the market has changed from a producer-driven market to a buyer-driven one [20]. Customer-satisfaction management is the only strategy that can respond to such market changes. Corporate marketing activities have made it a fundamental goal to focus on customer satisfaction, which, through customer experience, can increase customer loyalty, repurchase intention, positive WOM, and consequently, contribute to higher profitability [31].
Customers prefer and think about hotel selection attributes, which play a critical role in the information search and alternative selection process and is thus a target for evaluating hotel satisfaction and dissatisfaction [32,33]. Identifying the customer’s hotel selection attributes is essential for improving service quality and increasing customer satisfaction to gain a competitive advantage [34].
2.3. Big Data Analysis
Big data analysis of online-generated data to predict consumer behavior and psychological is an emerging topic in the hospitality industry [19]. It is necessary to extract and convert data from online reviews before analysis, and text mining and semantic network analysis play an important role in big data analysis due to the large and unstructured nature of consumer-generated data. This study employed text analytics to deconstruct numerous customer reviews collected from Google.com, which was followed by semantic network analysis to examine the association with extracted keywords [19,22].
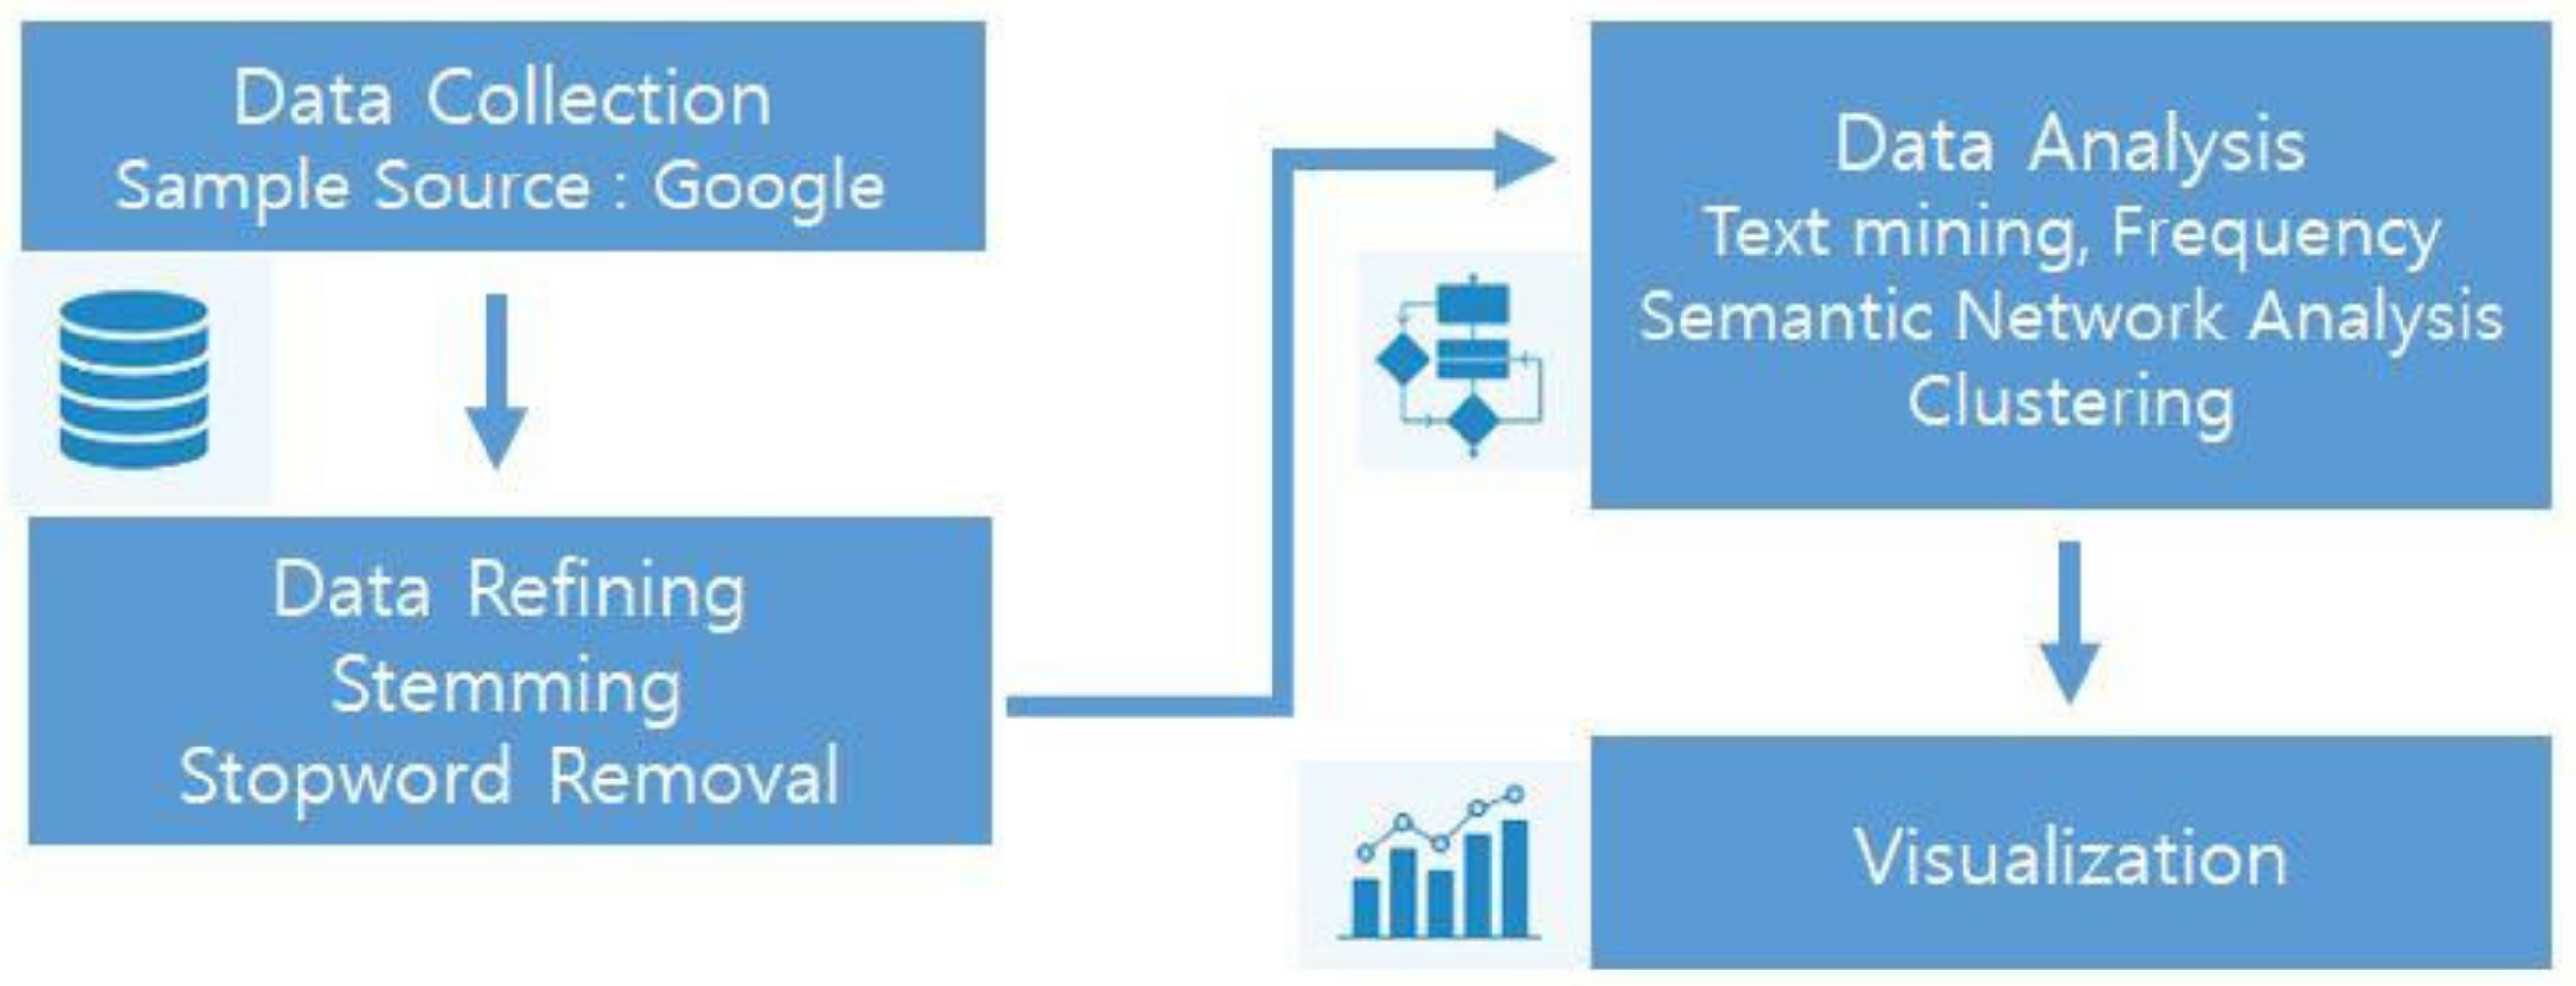
Text mining for knowledge discovery based on text databases was first mentioned by Feldman and Dagan [35], and is the discovery of valuable unknown patterns in text using information retrieval and extraction and natural language processing (NLP) techniques [36]. Text mining involves data collection, data refining, data analysis, a management information system and knowledge generation [37], as shown in Figure 1.
When collecting data, researchers identify the type of information they want, clarify concepts, limit the scope of what they want to collect, and familiarize themselves with the characteristics of the keywords. Data refining and preprocessing involves converting unstructured textual data into structured forms. For accurate results, sophisticated pretreatment is essential. As a step to analyze text-based technologies such as information extraction, document summary, and clustering are involved in the next step for analyzing text-based data, and analysis methods suitable for research purposes are then applied to manage information systems at worksites and to accumulate knowledge [19,38].
Text mining for the hospitality industry has recently been the subject of active research. Boo and Busser [8] qualitatively and quantitatively investigated meeting planners’ online reviews of destination hotels. The results yielded insights to respond to the online reviews and formed the basis for hotel evaluation criteria. Stepchenkova and Morrison [39] analyzed Russia-related texts on 212 websites, measured Russia’s tourist destination image, and identified the differences between US and Russian websites. He, Zha, and Li [40] described an in-depth case study that applied text mining to analyze text on the Facebook and Twitter sites of three pizza chains: Pizza Hut, Domino’s Pizza, and Papa John’s Pizza, which are representative franchises in the industry. The results confirmed the value of social media competitive analysis and the power of text mining as an effective technique for extracting business value from the vast amount of available social media data. The formation of social issues through SNS (Social Networking Service) is accelerating in various fields. With the development of SNS, network analysis is becoming essential to extract different meanings and concepts inherent in text-based messages and to understand their relational characteristics [41]. Semantic network analysis assesses the structure of a semantic network retrieved according to the given text, and it also explores meaning through the structural relationship of words as message components, rather than lexical units [42].
Semantic network analysis uses individual words to clarify network structure and meaning within a text. Selecting a specific term and repeatedly using it when emphasizing a particular meaning is one method for content analysis of the relationship between words that appear simultaneously in a sentence or paragraph. The core of semantic network analysis is indicating the influence of words, and analysis based on structural identity consists of an index for classifying subgroups based on word similarity [19,30,43].
3. Methodology
3.1. Data Collection
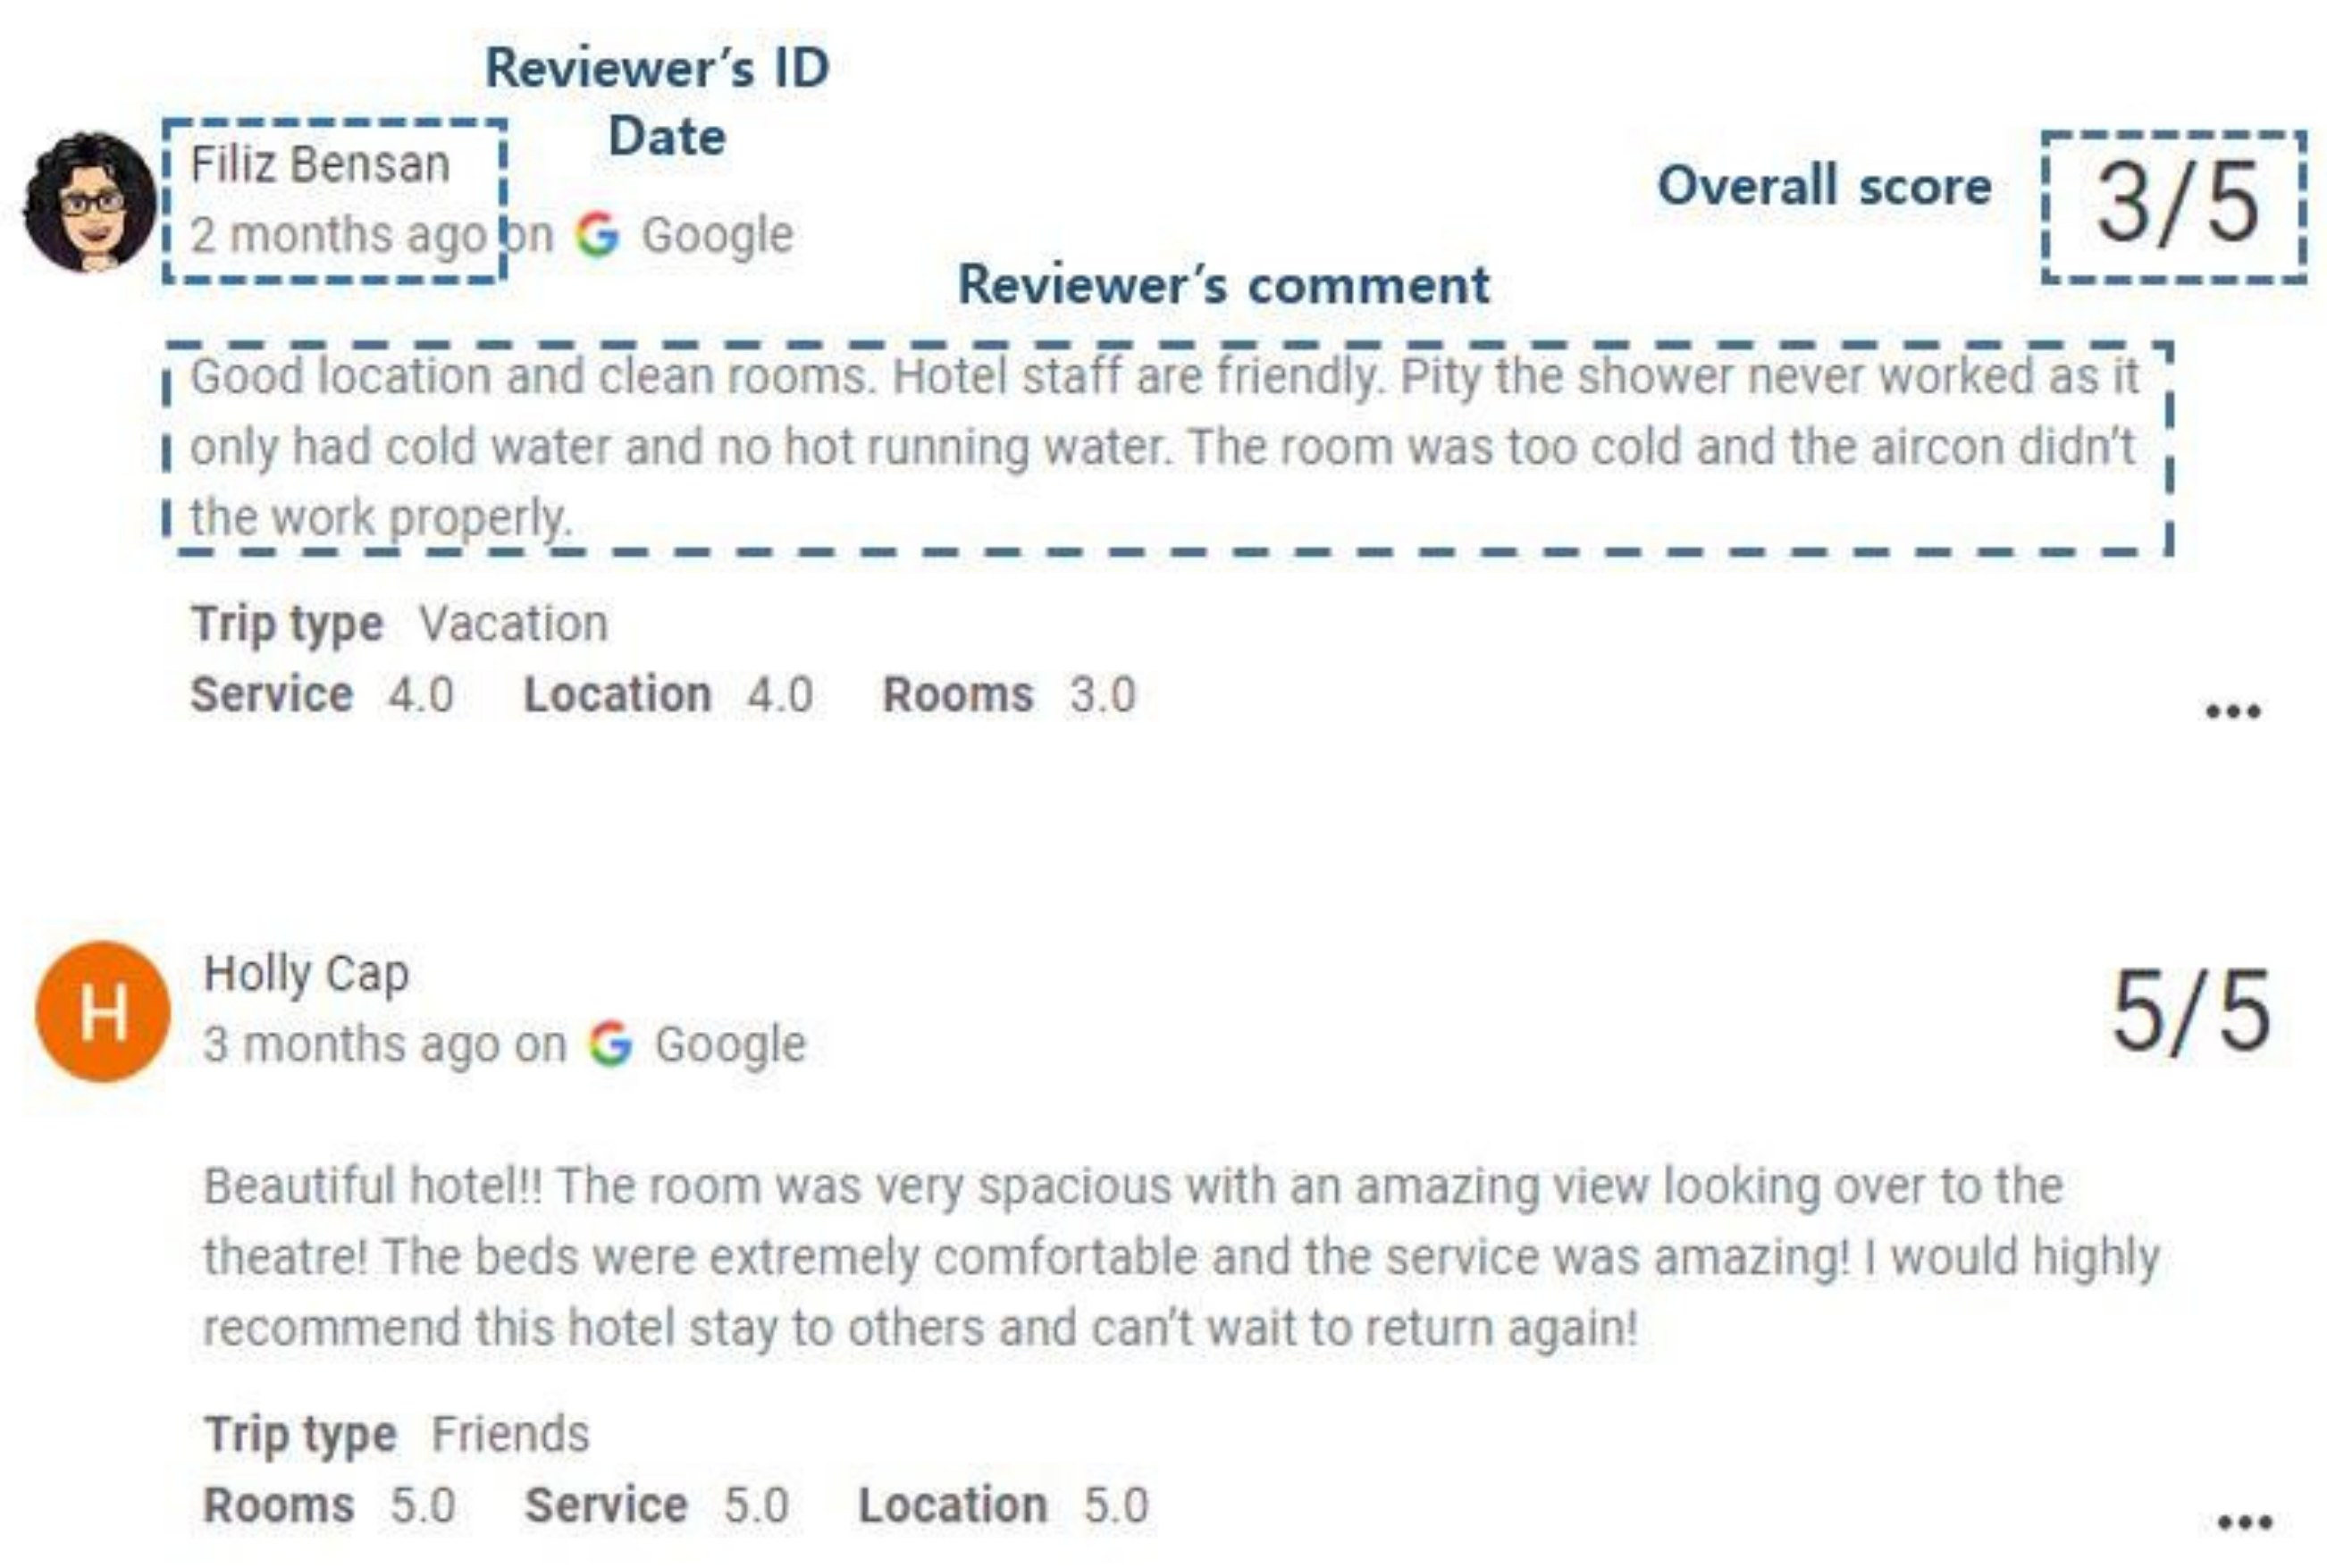
The data collection procedure for this study is as follows. Hotel reviews were collected from Google Travel (www.google.com/travel), the largest search engine globally. Google hotel reviews include detailed information about the hotel brand used by the customer, the reviewer’s ID, review date, comment, rating, and type of trip. Figure 2 shows a specific example from Google Online Reviews. SCTM (Smart Crawling & Text Mining, developed by the Wellness and Tourism Big Data Research Institute at Kyungsung University) and TEXTOM (a big data analysis solution to collect and refine data and generate matrix data) were used to collect and refine online data.
Words were ranked according to the frequency of their occurrence, to analyze the unstructured data. Table 1 shows the 25 recommended hotels and the number of reviews for each hotel. A total of 8448 reviews were collected, and 8229 reviews and 314,813 words were extracted, excluding data that were not readable or had only ratings with no review content. The data collection period was from December 2019, when COVID-19 first appeared, to July 2021, to determine if there were any different implications from a prior study of Ban, Choi, Choi, Lee, and Kim [44], who conducted research using online hotel reviews before the COVID-19 pandemic, making this a longitudinal study.
3.2. Data Analysis
The analysis was conducted according to previous studies [19,30,43,44]. Big data analysis was performed in two parts: text mining and semantic network analysis. Factor and linear regression analyses were then used. First, the top 90 most frequent words were extracted through the text mining refining process. The Python-based Natural Language Toolkit was used. A stop word refers to commonly used word (e.g., “the”, “a”, “an”, “in”). The program ignores stop words both when indexing entries for searching and when retrieving them as the result of a search query. Through the refinement process, pronouns, prepositions, and meaningless words were removed, and the generated data included only words related to the hotel experience. The word matrix (word × word) was then deduced. To assess the overall satisfaction with the hotel experience, a distribution of hotel experience evaluations based on the rating score was used, and this ‘overall rating’ was used as a dependent variable, because the value can be treated as the primary output variable [43].
Second, based on the matrix data, the network of words was visualized using Ucinet 6.0 to clarify the connection structure and connectivity between nodes. Semantic network analysis focused on degree and eigenvector centralities, which are indicators quantified based on the centrality concept arrangement and measurement method. Freeman proposed eigenvector centrality as a measure of the influence of a node in a network [19,30]. Relative weights are assigned to all nodes in the network, based on the idea that connections to high-scoring nodes contribute more to the score of the node in question than an equal number of links to low-scoring nodes [45]. Finally, CONCOR (CONvergence of iterated CORrelation) analysis was conducted to segment the words and acquire the dimensions of hotel customer experience. CONCOR analysis was performed repeatedly to find the connections and relationships between the words and similarity groups by forming clusters including keywords [42]. The results were visualized with Netdraw to provide a more intuitionistic visualization of the segmentation of the top-frequency words used by customers.
Finally, quantitative analysis was performed. By integrating the results of the CONCOR analysis and a comparison of word frequency and centrality, words were selected for further factor and linear regression analyses using dummy variables. Tao and Kim [43] investigated customer experience-related words with the highest explanatory power for customer satisfaction, and conducted a study on words with high frequency. These high-frequency words were ultimately judged to be appropriate because of Freeman’s high centrality in demonstrating word relevance and variables focused on revealing communities in combination with key items in the CONCOR results.
Factor analysis was performed to retrieve the main factors affecting hotel customer satisfaction, using 55 out of the 90 top-frequency words. In addition, linear regression analysis, which consisted of four independent variables derived from the factor analysis and overall ratings as a dependent variable, was performed to verify the following hypothesis: The hotel experience shown in the online review can be used to explain customer satisfaction.
4. Results
4.1. Frequency Analysis
The data were transformed from unstructured information such as sentences to structured data such as single words and their corresponding frequency. A total of 314,813 words were collected. After deleting repeated, unnecessary, and low-frequency words, a total of 90 high-frequency words were extracted. Table 2 shows the 90 highest frequency words with Term Frequency-Inverse Document Frequency (TF-IDF). Figure 3 illustrates the network visibility of these 90 top frequency words.
The TF-IDF weight model evaluates how important words inside a document are in text mining. TF-IDF is a value obtained by multiplying TF and IDF, and the higher the score, the less frequently the word appears in other documents and the more frequently it appears in the document considered. A word with a larger TF-IDF value is more likely to determine the topic or meaning of the document to which it belongs, and this can be used as a measure to extract critical keywords. For example, the words indicating the location or included in hotel brand, such as “ciudad” or “mexico”, which are second and third in the frequency ranking, have a TF-IDF of 2892 and 2882, respectively, and the TF-IDF rankings are also highly ranked, at third and fourth. Words representing the hotel brand or location were meaningful words in the review data.
It is undeniable but surprising that “service” had the highest frequency, and this implies that, for hotel consumers, a hotel’s service is the aspect they mentioned most. There were also words related to service, such as “restaurant”, “experience”, and “staff”, that appeared with high frequency. Referring to the number of online hotel reviews, although the “Gran Hotel Ciudad de México” ranked 20th in the hotel brand among 25 hotels, it recorded the highest number of reviews, at 2064, which suggests that the two words “ciudad” and “mexico” have high web visibility. Words related to location or name of the hotel were also common, such as “ciudad”, “ritz carlton”, “chandy”, “mandapa”, “lisbon”, and “france”, as were words such as “experience”, “trip”, “adventure”, “family”, “security”, and “price”, which could reflect the purpose of the trip.
4.2. Semantic Network Analysis
Semantic network analysis identifies the relationship between words and expresses their connection in the network [44]. The centrality of the top 90 most frequent words was calculated, compared with word frequency, and synthesized in Table 3, in which the top 50 most frequent words are described. As a result, words such as “service”, “hotel”, “restaurant”, “experience”, and “breakfast” are shown to have both high frequency and high centrality. To a great extent, this indicated that these words were frequently used by online users and are closely associated with other nodes in the semantic network.
Words such as “place”, “facility”, and “security” had a relatively lower centrality ranking relative to their high frequency, which suggests that although these words were frequently searched by users, their connection and influence relative to other words is low.
Words such as “room”, “adventure”, and “dinner” appeared in the opposite distribution, as they do not appear as frequently, while they did strongly relate to other terms with relatively high value. The nodes have great significance in the semantic network because of their strong connection to and influence over other nodes. Figure 4 illustrates the result of the CONCOR analysis. Four sets generated from the semantic network analysis were named based on the notable words and related meaning within the online reviews. Table 4 shows the words grouped in each cluster and the notable words.
The group names—destination, physical environment, service, and trip purpose—reflect the characteristics of the words included in each cluster. The destination cluster includes words related to hotel brands or tour spots (e.g., “France” “waldorf”), as well as general terms such as “locate” or “station”. The physical environment cluster contains words related to facilities, such as “balcony” or “garden”. The service cluster contains concepts: food and beverage (F&B) and staff service. F&B contains words such as “buffet” and “restaurant”, while staff service includes words such as “attention” and “hospitality”, and it is important to note that consumers tend to consider staff service and quality of service when choosing a hotel. The final cluster, trip purpose, contains words relating to purpose such as “conference” and “adventure”, as well as including words related to sociality, such as “family” and “friend”. After conducting CONCOR analysis, 55 words were used to determine the main factors affecting hotel customer satisfaction.
4.3. Factor Analysis
Many measurement variables can be reduced to smaller variables using the varimax rotation process through factor analysis. This study adopted the common factorial criteria for factor extraction. In this study, the standard eigenvalue value is 1.0 or higher, and the factor loading value is 0.400 or higher. Variables loading onto two factors simultaneously were dropped. From the results, 10 key words within four factors contributed 18.458% of all variance, and these were used as the independent variables to derive the key factors affecting customer satisfaction. According to Table 5, the KMO index was above 0.6, indicating a high correlation between related variables. In Bartlett’s sphericity test, χ2 was 84,453.902, with the overall significance of the correlation matrix p < 0.001. This means that these data are suitable for exploratory factor analysis. The four factors were named: Service (Factor 1), Physical Environment (Factor 2), Dining (Factor 3), and Location (Factor 4). Factor 1 contains “staff”, “quality”, and “service”, which are related to the core services of the hotel. Factor 2 contains “facility”, “environment”, and “room”, which are related to a tangible part of the hotel. Factor 3 contains “restaurant” and “brunch”. Factor 4 consisted of concrete site names, such as “ciudad” and “mexico”.
4.4. Linear Regression Analysis
Regression analysis was performed to determine how the independent variables affect the dependent variable. The hotel customer satisfaction rating was used as the dependent variable, and the four hotel customer experience factors were used as the independent variables. The results of refining variables through factor analysis yielded four independent variables—Service (S), Physical Environment (P), Dining (D), and Location (L)—and one dependent variable: Customer Satisfaction (CS). As it can be seen in Table 6, the overall variance explained by the four predictors was 10% (R2 = 0.100), and the standard error of the estimated value was 0.70347. The correlation between the independent and dependent variables was relatively low, because the low frequency of online hotel reviews may not have included any of the four factors affecting customer experience and satisfaction. It is impossible to include all relevant variables in regression analysis to estimate output variables, such as opinion, from text-mining data, so the R2 value can be low. According to prior studies using regression and factor analyses on online reviews for washing machines and hotels, the R2 values were 12.5%, and 12%, respectively [30,44]. Here, Service (S, β = 0.027) and Dining (D, β = −0.021) are significant at the p < 0.05 and p < 0.1 level, respectively. Service (S) is positively related to customer satisfaction, and Dining (D) is negatively related to customer satisfaction. Based on these results, the regression equation can be expressed as follows:
CS = 4.733 + 0.019S** + 0.004P − 0.015D* − 0.005L
The Service (S) factor holds the highest standardized coefficients, which means staff service is the essential factor associated with customer satisfaction. The Dining (D) factor was found to negatively influence customer satisfaction, indicating that customers have a negative view of the dining factor, which included words such as restaurant and brunch.
5. Discussion and Conclusions
This study was conducted to assess the customers’ experience and satisfaction based on online reviews. Keywords were derived through text mining, and frequency analysis was then performed. The top 90 most frequent words were extracted, and degree and eigenvector centrality analyses were performed to determine the relationship between keywords. CONCOR analysis was then adopted to generate four clusters: destination, physical environment, service, and trip purpose.
These results are similar to those found in a previous study by Ban et al. [44], who named a similar grouping of four clusters—intangible service, physical environment, location, and purpose. Both that study and the present one found factors related to the hotel’s essential attributes, which suggests that increasing satisfaction with these attributes is paramount to forming positive eWOM. Overall, this work established that dimensions related to various facilities, location, service, and food and beverage significantly contribute to enhancing hotel customer experience. These findings reaffirm the existing arguments about the complexity and diversity of the hotel experience, which spans various encounters with food and beverage prices, quality, safety, improved service, overall feeling, image, comfortable condition, and location [11]. This work adds to the understanding of customer hotel selection attributes that are a prerequisite for improving service quality and enhancing customer satisfaction to gain a competitive advantage. Additionally, the keywords were visualized by drawing networks and nodes using NetDraw in UCINET 6.0. Factor and linear regression analyses were performed to determine the relationships between extracted factors and customer satisfaction.
This study provides five academic and practical implications based on the research results. For the theoretical implications, this study demonstrates the significance of extending the application area of semantic network analysis. This work extends our knowledge and serves as a benchmark for researchers and stakeholders concerning the factors that provide pleasing outcomes within the hotel context. Given the importance of the hotel sector in the tourism industry, this study empirically explored the hotel experience and satisfaction through big data analysis. Understanding online reviews as an expression of customer experience can help the hotel industry identify key attributes needed to achieve positive repurchase intention and increase revenue. Online reviews provide an efficient way for the hotel industry to collect feedback from hotel customers and discover how to generate positive revisit intention after the experience.
Second, the use of a semantic network analysis provides a valuable tool for exploring customers’ comments about their hotel experiences. This method reveals features that explain why customers evaluate their hotel experience positively or negatively. By analyzing customer comments, we can assess the power and meaning of words commonly used by customers when sharing their experiences and how those word choices can inform recommendations through online sources. The power expressed in words contains the customers’ expressions and evaluations of their experiences, and serves as a basis for understanding the reality of their experience.
Third, in terms of practical implications, “service” is an important factor influencing customer satisfaction (as in previous studies [46,47]), and a more remarkable result is that customers expect to receive more attentive service during COVID-19. Thus, managers or operators in the hotel industry should pay more attention to maintaining the standard service quality and providing more proactive or extra service to customers during this pandemic. Offering service with warm and sincere hospitality can create positive eWOM and satisfaction, as shown in the following quotations from online reviews: “José Luis and Víctor were always greeting us with a big smile probably one of the best treatment I have had in a hotel” and “The staff is simply amazing! They make every effort to make you feel comfortable and welcome.” Appropriate staff service at the service point leads to positive reviews, which then form a positive image of the hotel. There is a need for continuous and systematic education and training to motivate employees with customer-centered thinking.
Fourth, it is noteworthy for hotel operators and managers that dining negatively influences customer satisfaction. One customer mentioned the restaurant and brunch within their review and stated they were not pleased with the dining experience. This indicates that customers using the hotel are paying the same cost as before the pandemic, but they are restricted from using some facilities (such as restaurants) due to COVID-19 or cannot receive regular services. Due to COVID-19, restrictions on restaurants that confine many people into a narrow space are unavoidable, but consideration from the hotel is necessary to ensure that customers do not feel uncomfortable. For example, the hotel could provide a service where customers can eat all the menu offerings from the restaurant in the room. Using a mobile app, the hotel could deliver the food ordered to the room without contacting others. If this exceptional dining service is implemented, it could affect customer satisfaction, revisit intention, and positive WOM. There is need for a service that does not cause inconvenience to customers despite the limited availability of F&B services due to COVID-19. If the hotel minimizes contact with employees and provides a service that allows the customer to dine in a private space through a delivery service or to order through a mobile app and watch the cooking process on the screen, no problems with hygiene or cleanliness that customers are particularly concerned about with COVID-19 would arise.
Finally, online reviews are a source of information for potential customers to make decisions. Considering that tourism decision making through the internet is rapidly increasing, this study can guide hotel marketing strategy, facility operation, and complaint management through big data analysis of online reviews.
This study has some limitations, and results should be interpreted with caution; these limitations also provide suggestions for future research. First, online reviews were collected from Google, the world’s largest search engine. However, there is a possibility that using a specific online channel may not capture all customer preferences, so for representativeness, future samples should be based on analysis of various websites and should use data from many years. Second, it is not easy to understand the additional meaning of words when analyzing their frequency. Future research should adopt the further analysis of positives and negatives, and sentimental analysis could better clarify customer experience and satisfaction. Finally, in this study, reviews of 25 hotels recommended by TripAdvisor were collected from Google Travel and analyzed. However, the quantity of review data collected for each hotel differed widely due to the different sizes, types, and average costs of the hotels considered. Future studies should collect and analyze review data from hotels that share the same characteristics to derive more meaningful research results.
Author Contributions
Y.-J.K. and H.-S.K. designed the research model, analyzed online review data and wrote the paper. All authors have read and agreed to the published version of the manuscript.
Funding
This work was supported by the Ministry of Education of the Republic of Korea and the National Research Foundation of Korea (NRF-2019S1A5A2A03049170).
Institutional Review Board Statement
Not applicable.
Informed Consent Statement
Not applicable.
Conflicts of Interest
The authors declare no conflict of interest.
References
- Cheung, C.M.; Lee, M.K. What drives consumers to spread electronic word of mouth in online consumer-opinion platforms. Decis. Support Syst. 2012, 53, 218–225. [Google Scholar] [CrossRef]
- Park, J.; Hyun, H.; Thavisay, T. A study of antecedents and outcomes of social media WOM towards luxury brand purchase intention. J. Retail. Consum. Serv. 2021, 58, 102272. [Google Scholar] [CrossRef]
- Schindler, R.M.; Bickart, B. Characteristics of online consumer comments valued for hedonic and utilitarian shopping tasks. Adv. Consum. Res. 2002, 29, 428–429. [Google Scholar]
- Rosario, A.B.; de Valck, K.; Sotgiu, F. Conceptualizing the electronic word-of-mouth process: What we know and need to know about eWOM creation, exposure, and evaluation. Acad. Mark. Sci. Rev. 2020, 48, 422–448. [Google Scholar] [CrossRef]
- Cheung, C.M.; Thadani, D.R. The impact of electronic word-of-mouth communication: A literature analysis and integrative model. Decis. Support Syst. 2012, 54, 461–470. [Google Scholar] [CrossRef]
- Khoa, B.T.; Khanh, T. The impact of electronic Word-Of-Mouth on admission intention to private university. Test Eng. Manag. 2020, 83, 14956–14970. [Google Scholar]
- Filieri, R.; McLeay, F. E-WOM and accommodation: An analysis of the factors that influence travelers’ adoption of information from online reviews. J. Travel Res. 2014, 53, 44–57. [Google Scholar] [CrossRef]
- Boo, S.; Busser, J.A. Meeting planners’ online reviews of destination hotels: A twofold content analysis approach. Tour. Manag. 2018, 66, 287–301. [Google Scholar] [CrossRef]
- Wang, L.; Wang, X.K.; Peng, J.J.; Wang, J.Q. The differences in hotel selection among various types of travellers: A comparative analysis with a useful bounded rationality behavioral decision support model. Tour. Manag. 2020, 76, 103961. [Google Scholar] [CrossRef]
- Nie, R.X.; Tian, Z.P.; Wang, J.Q.; Chin, K.S. Hotel selection driven by online textual reviews: Applying a semantic partitioned sentiment dictionary and evidence theory. Int. J. Hosp. Manag. 2020, 88, 102495. [Google Scholar] [CrossRef]
- Lewis, R.C. Isolating differences in hotel attributes. Cornell Hotel. Restaur. Adm. Q. 1984, 25, 64–77. [Google Scholar] [CrossRef]
- Chow, K.E.; Garretson, J.A.; Kurtz, D.L. An exploratory study into the purchase decision process used by leisure travelers in hotel selection. J. Hosp. Mark. Manag. 1995, 2, 53–72. [Google Scholar] [CrossRef]
- Shanahan, K.J.; Hyman, M.R. An exploratory study of desired hotel attributes for American tourists vacationing in China and Ireland. J. Vacat. Mark. 2007, 13, 107–118. [Google Scholar] [CrossRef]
- Groves, R.M.; Lyberg, L. Total survey error: Past, present, and future. Public Opin. Q. 2010, 74, 849–879. [Google Scholar] [CrossRef]
- Lee, H.J. Online review analysis on Gyeongbokgung: Using data on tripadvisor.com. Int. J. Tour. Sci. 2017, 32, 297–318. [Google Scholar] [CrossRef]
- Filieri, R.; Mariani, M. The role of cultural values in consumers’ evaluation of online review helpfulness: A big data approach. Int. Mark. Rev. 2021, 38, 1267–1288. [Google Scholar] [CrossRef]
- Mariani, M.; Borghi, M. Environmental discourse in hotel online reviews: A big data analysis. J. Sustain. Tour. 2020, 29, 829–848. [Google Scholar] [CrossRef]
- González-Porras, J.L.; Ruiz-Alba, J.L.; Morales-Mediano, J. Customer orientation and e-WOM in the hotel sector. Int. J. Internet Mark. Advert. 2021, 15, 302–326. [Google Scholar] [CrossRef]
- Ban, H.J.; Kim, H.S. Understanding customer experience and satisfaction through airline passengers’ online review. Sustainability 2019, 11, 4066. [Google Scholar] [CrossRef] [Green Version]
- Aakash, A.; Tandon, A.; Gupta Aggarwal, A. How features embedded in eWOM predict hotel guest satisfaction: An application of artificial neural networks. J. Hosp. Mark. Manag. 2021, 30, 486–507. [Google Scholar] [CrossRef]
- Verma, S.; Yadav, N. Past, present, and future of electronic word of mouth (EWOM). J. Interact. Mark. 2021, 53, 111–128. [Google Scholar] [CrossRef]
- Xiang, Z.; Schwartz, Z.; Gerdes, J.H., Jr.; Uysal, M. What can big data and text analytics tell us about hotel guest experience and satisfaction? Int. J. Hosp. Manag. 2015, 44, 120–130. [Google Scholar] [CrossRef]
- Kim, S.; Kandampully, J.; Bilgihan, A. The influence of eWOM communications: An application of online social network framework. Comput. Hum. Behav. 2018, 80, 243–254. [Google Scholar] [CrossRef]
- Xiang, Z.; Gretzel, U. Role of social media in online travel information search. Tour. Manag. 2010, 31, 179–188. [Google Scholar] [CrossRef]
- De Bruyn, A.; Lilien, G.L. A multi-stage model of word-of-mouth influence through viral marketing. Int. J. Res. Mark. 2008, 25, 151–163. [Google Scholar] [CrossRef]
- Vermeulen, I.E.; Seegers, D. Tried and tested: The impact of online hotel reviews on consumer consideration. Tour. Manag. 2009, 30, 123–127. [Google Scholar] [CrossRef]
- Stringam, B.B.; Gerdes, J., Jr.; Vanleeuwen, D.M. Assessing the importance and relationships of ratings on user-generated traveler reviews. J. Qual. Assur. Hosp. Tour. 2010, 11, 73–92. [Google Scholar] [CrossRef]
- Schmitt, B. Experiential marketing. J. Mark. Manag. 1999, 15, 53–67. [Google Scholar] [CrossRef]
- Meyer, C.; Schwager, A. Understanding customer experience. Harv. Bus. Rev. 2007, 85, 116. [Google Scholar]
- Kim, H.S.; Noh, Y. Elicitation of design factors through big data analysis of online customer reviews for washing machines. J. Mech. Sci. Technol. 2019, 33, 2785–2795. [Google Scholar] [CrossRef]
- Anderson, E.W.; Fornell, C.; Lehmann, D.R. Customer satisfaction, market share, and profitability: Findings from Sweden. J. Mark. 1994, 58, 53–66. [Google Scholar] [CrossRef]
- Kotler, P.; Bowen, P.J.; Makens, J. Marketing for Hospitality and Tourism; PrenticeHall: Hoboken, NJ, USA, 1996. [Google Scholar]
- Knutson, B.J. Ten laws of customer satisfaction. Cornell Hotel Restaur. Adm. Q. 1988, 29, 14–17. [Google Scholar] [CrossRef]
- Verma, V.K.; Chandra, B. Sustainability and customers’ hotel choice behaviour: A choice-based conjoint analysis approach. Environ. Dev. Sustain. 2018, 20, 1347–1363. [Google Scholar] [CrossRef]
- Loh, S.; De Oliveira, J.P.M.; Gastal, F.L. Knowledge discovery in textual documentation: Qualitative and quantitative analyses. J. Doc. 2001, 57, 577–590. [Google Scholar] [CrossRef]
- Hotho, A.; Nürnberger, A.; Paaß, G. A brief survey of text mining. LDV Forum 2005, 20, 19–62. [Google Scholar]
- Fan, W.; Wallace, L.; Rich, S.; Zhang, Z. Tapping the power of text mining. Commun. ACM 2006, 49, 76–82. [Google Scholar] [CrossRef]
- Feldman, R.; Sanger, J. The Text Mining Handbook: Advanced Approaches in Analyzing Unstructured Data; Cambridge University Press: Cambridge, UK, 2007. [Google Scholar]
- Stepchenkova, S.; Morrison, A.M. Russia’s destination image among American pleasure travelers: Revisiting Echtner and Ritchie. Tour. Manag. 2008, 29, 548–560. [Google Scholar] [CrossRef]
- He, W.; Zha, S.; Li, L. Social media competitive analysis and text mining: A case study in the pizza industry. Int. J. Inf. Manag. Sci. 2013, 33, 464–472. [Google Scholar] [CrossRef]
- Esposito, F.; Ferilli, S.; Basile, T.M.; Di Mauro, N. Social networks and statistical relational learning: A survey. Int. J. Soc. Netw. Min. 2012, 1, 185–208. [Google Scholar] [CrossRef] [Green Version]
- Wasserman, S.; Faust, K. Social Network Analysis: Methods and Applications; Cambridge University Press: Cambridge, UK, 1994. [Google Scholar]
- Tao, S.; Kim, H.S. Cruising in Asia: What can we dig from online cruiser reviews to understand their experience and satisfaction. Asia Pac. J. Tour. Res. 2019, 24, 514–528. [Google Scholar] [CrossRef]
- Ban, H.J.; Choi, H.; Choi, E.K.; Lee, S.; Kim, H.S. Investigating key attributes in experience and satisfaction of hotel customer using online review data. Sustainability 2019, 11, 6570. [Google Scholar] [CrossRef] [Green Version]
- Freeman, L.C.; Roeder, D.; Mulholland, R.R. Centrality in social networks: II. Experimental results. Soc. Netw. 1979, 2, 119–141. [Google Scholar] [CrossRef] [Green Version]
- Kim, Y.J.; Kim, H.S.; Kim, H.S. Understanding the effects of COVID-19 on the Starbucks perception through big data analytics: A comparative study. Culin. Sci. Hos. Res. 2021, 27, 1–14. [Google Scholar]
- Ban, H.J.; Kim, H.S. Semantic network analysis of hotel package through the big data. Culin. Sci. Hos. Res. 2019, 25, 110–119. [Google Scholar]
Figure 1.
Text mining process, source Ban and Kim [19].
Figure 1.
Text mining process, source Ban and Kim [19].

Figure 2.
Screenshot of customer review on Google Travel.

Figure 3.
Keyword visualization.

Figure 4.
Visualization of CONvergence of iterated CORrelation analysis.


Table 1.
Number of reviews according to 2021 Hotel ranking source from Tripadvisor website.
| Rank | Hotel | Count | Rank | Hotel | Count |
|---|---|---|---|---|---|
| 1 | Hotel Colline de France | 332 | 14 | The Ritz-carlton Macau | 155 |
| 2 | THE OMNIA | 158 | 15 | Sukhumvit Park, Bangkok Marriott Executive Apartments | 336 |
| 3 | Sani Dunes | 84 | 16 | Hotel Ambiez | 72 |
| 4 | Kandolhu Maldives | 45 | 17 | Hamanasi Adventure & Dive Resort, Belize | 186 |
| 5 | ACHTIS HOTEL | 65 | 18 | Mint House at 70 Pine NYC | 138 |
| 6 | Mandapa, a Ritz-Carlton Reserve | 382 | 19 | Jaya House River Park Hotel | 183 |
| 7 | The Legian Seminyak, Bali | 318 | 20 | Gran Hotel Ciudad de México | 2064 |
| 8 | Gardena Grödnerhof Hotel & Spa | 52 | 21 | The Hari | 210 |
| 9 | Tulemar Bungalows & Villas | 55 | 22 | Waldorf Astoria Amsterdam | 225 |
| 10 | Hacienda Beach Club & Residences | 259 | 23 | Corpo Santo Lisbon Historical Hotel | 333 |
| 11 | Club Prive by Rixos Belek | 38 | 24 | Villa Rosa Kempinski | 2123 |
| 12 | Chandys Windy Woods 5 Star Resort Munnar | 525 | 25 | Tokoriki Island Resort | 83 |
| 13 | Mirihi Island Resort | 27 | Total | 8448 |
Table 2.
Top 90 frequent words with TF-IDF from the online review.
| Rank | Word | Freq. | TF-IDF | Rank | Word | Freq. | TF-IDF | Rank | Word | Freq. | TF-IDF |
|---|---|---|---|---|---|---|---|---|---|---|---|
| 1 | service | 2523 | 4027 | 31 | waldorf | 253 | 908/33 | 61 | option | 120 | 553 |
| 2 | ciudad | 2104 | 2892/3 | 32 | quality | 252 | 967 | 62 | coffee | 120 | 550 |
| 3 | méxico | 2085 | 2882/4 | 33 | astoria | 243 | 873/36 | 63 | window | 119 | 564 |
| 4 | hotel | 1244 | 2899/2 | 34 | family | 238 | 927 | 64 | variety | 119 | 543 |
| 5 | restaurant | 893 | 2412 | 35 | people | 231 | 907 | 65 | night | 118 | 545 |
| 6 | resort | 798 | 2303/6 | 36 | guest | 223 | 893 | 66 | moment | 115 | 555 |
| 7 | place | 701 | 1865 | 37 | hospitality | 216 | 836 | 67 | villa | 114 | 508 |
| 8 | experience | 671 | 1892 | 38 | luxury | 214 | 863 | 68 | brunch | 112 | 555 |
| 9 | breakfast | 651 | 1902 | 39 | belgrave | 212 | 791/43 | 69 | thank | 102 | 471 |
| 10 | locate | 620 | 1792 | 40 | belize | 209 | 794/42 | 70 | holiday | 100 | 471 |
| 11 | ritz carlton | 572 | 1510/14 | 41 | custom | 209 | 822 | 71 | park | 98 | 470 |
| 12 | chandys | 551 | 1509/15 | 42 | island | 202 | 834 | 72 | class | 97 | 449 |
| 13 | staff | 544 | 1595 | 43 | property | 198 | 817 | 73 | entrance | 96 | 473 |
| 14 | everything | 507 | 1618 | 44 | ambience | 194 | 742 | 74 | city | 95 | 453 |
| 15 | trip | 478 | 1364 | 45 | dinner | 177 | 733 | 75 | decorate | 94 | 470 |
| 16 | attention | 458 | 1571 | 46 | reception | 175 | 745 | 76 | Zermatt | 94 | 504/69 |
| 17 | mandapa | 440 | 1350/18 | 47 | architecture | 172 | 751 | 77 | Tokoriki | 93 | 429/81 |
| 18 | lisbon | 412 | 1317/19 | 48 | everyone | 166 | 694 | 78 | amenity | 92 | 430 |
| 19 | serve | 402 | 1228 | 49 | security | 155 | 667 | 79 | conference | 90 | 428 |
| 20 | france | 377 | 1202/23 | 50 | history | 153 | 703 | 80 | employee | 90 | 446 |
| 21 | hamanasi | 377 | 1424/16 | 51 | price | 151 | 667 | 81 | bathroom | 89 | 423 |
| 22 | seminyak | 352 | 1143/25 | 52 | atmosphere | 151 | 657 | 82 | garden | 89 | 431 |
| 23 | terrace | 341 | 1284 | 53 | manage | 150 | 657 | 83 | elevator | 88 | 438 |
| 24 | adventure | 314 | 1179 | 54 | drink | 146 | 636 | 84 | world | 86 | 409 |
| 25 | room | 313 | 1019 | 55 | build | 142 | 643 | 85 | environment | 85 | 408 |
| 26 | buffet | 311 | 1243 | 56 | food | 142 | 596 | 86 | stay | 84 | 389 |
| 27 | facility | 278 | 1037 | 57 | accommodate | 131 | 586 | 87 | excellent | 84 | 384 |
| 28 | residence | 276 | 941 | 58 | view | 129 | 570 | 88 | wait | 83 | 415 |
| 29 | amsterdam | 275 | 987/28 | 59 | friend | 127 | 573 | 89 | afternoon | 82 | 422 |
| 30 | hacienda | 264 | 910/32 | 60 | station | 121 | 577 | 90 | balcony | 82 | 404 |
Table 3.
Comparison of keyword frequency and centrality analysis.
| Frequency | Degree | Eigenvector | Frequency | Degree | Eigenvector | ||||||||
|---|---|---|---|---|---|---|---|---|---|---|---|---|---|
| Freq. | Rank | Coef | Rank | Coef | Rank | Freq. | Rank | Coef | Rank | Coef | Rank | ||
| service | 2523 | 1 | 0.070 | 1 | 1.000 | 1 | buffet | 311 | 26 | 0.012 | 21 | 0.242 | 17 |
| ciudad | 2104 | 2 | 0.037 | 3 | 0.889 | 3 | facility | 278 | 27 | 0.007 | 37 | 0.129 | 33 |
| méxico | 2085 | 3 | 0.037 | 4 | 0.890 | 2 | residence | 276 | 28 | 0.004 | 61 | 0.048 | 80 |
| hotel | 1244 | 4 | 0.036 | 5 | 0.569 | 5 | amsterdam | 275 | 29 | 0.008 | 33 | 0.091 | 48 |
| restaurant | 893 | 5 | 0.035 | 6 | 0.592 | 4 | hacienda | 264 | 30 | 0.004 | 62 | 0.046 | 82 |
| resort | 798 | 6 | 0.039 | 2 | 0.514 | 6 | waldorf | 253 | 31 | 0.007 | 38 | 0.080 | 56 |
| place | 701 | 7 | 0.014 | 15 | 0.271 | 16 | quality | 252 | 32 | 0.010 | 26 | 0.181 | 23 |
| experience | 671 | 8 | 0.025 | 7 | 0.368 | 9 | astoria | 243 | 33 | 0.007 | 39 | 0.076 | 58 |
| breakfast | 651 | 9 | 0.024 | 8 | 0.392 | 7 | family | 238 | 34 | 0.011 | 24 | 0.163 | 24 |
| locate | 620 | 10 | 0.020 | 10 | 0.343 | 10 | people | 231 | 35 | 0.010 | 27 | 0.152 | 27 |
| ritzcarlton | 572 | 11 | 0.012 | 18 | 0.143 | 29 | guest | 223 | 36 | 0.012 | 22 | 0.187 | 21 |
| chandys | 551 | 12 | 0.009 | 28 | 0.134 | 31 | hospitality | 216 | 37 | 0.006 | 43 | 0.091 | 49 |
| staff | 544 | 13 | 0.016 | 14 | 0.239 | 18 | luxury | 214 | 38 | 0.007 | 40 | 0.119 | 39 |
| everything | 507 | 14 | 0.018 | 13 | 0.291 | 14 | belgrave | 212 | 39 | 0.003 | 75 | 0.043 | 86 |
| trip | 478 | 15 | 0.020 | 11 | 0.307 | 12 | belize | 209 | 40 | 0.012 | 23 | 0.197 | 20 |
| attention | 458 | 16 | 0.014 | 16 | 0.300 | 13 | custom | 209 | 41 | 0.009 | 29 | 0.186 | 22 |
| mandapa | 440 | 17 | 0.012 | 19 | 0.138 | 30 | island | 202 | 42 | 0.007 | 41 | 0.094 | 45 |
| lisbon | 412 | 18 | 0.008 | 31 | 0.152 | 26 | property | 198 | 43 | 0.008 | 34 | 0.127 | 34 |
| serve | 402 | 19 | 0.010 | 25 | 0.119 | 38 | ambience | 194 | 44 | 0.003 | 76 | 0.052 | 77 |
| france | 377 | 20 | 0.008 | 32 | 0.146 | 28 | dinner | 177 | 45 | 0.008 | 35 | 0.130 | 32 |
| hamanasi | 377 | 21 | 0.024 | 9 | 0.375 | 8 | reception | 175 | 46 | 0.006 | 44 | 0.116 | 40 |
| seminyak | 352 | 22 | 0.004 | 60 | 0.069 | 64 | architecture | 172 | 47 | 0.005 | 49 | 0.123 | 35 |
| terrace | 341 | 23 | 0.012 | 20 | 0.276 | 15 | everyone | 166 | 48 | 0.009 | 30 | 0.155 | 25 |
| adventure | 314 | 24 | 0.019 | 12 | 0.310 | 11 | security | 155 | 49 | 0.004 | 63 | 0.058 | 73 |
| room | 313 | 25 | 0.013 | 17 | 0.198 | 19 | history | 153 | 50 | 0.005 | 50 | 0.123 | 36 |
Table 4.
Result of CONvergence of iterated CORrelation analysis.
| Extracted Words | Significant Words | |
|---|---|---|
| Destination | astoria/residence/france/villa/world/ amsterdam/island/locate/hamansi/station/ lisbon/mexico/hacienda/city/belgrave/chandys/tokoriki/ zermatt/wardorf/mandapa/belize/seminyak/ ciudad/ritzcarlton/hotel/place/resort | residence/hamansi/locate/ chandys/seminyak/resort/ ritz carlton/hotel/place/ciudad/ mandapa/city/hacienda/ mexico/station |
| Physical Environment | elevator/custom/reception/build/park/ garden/terrace/room/ambience/architecture/ entrance/balcony/bathroom/environment/ window/facility/decorate/atmosphere/property | entrance/property/facility/terrace/ reception/park/architecture/ambience/ room/bathroom/environment/ atmosphere/decorate |
| Service | buffet/everyone/thank/wait/manage/drink/ serve/service/brunch/employee/night/staff/ quality/variety/food/everything/coffee/ breakfast/excellent/attention/option/amenity/ hospitality/restaurant/dinner/guest/class/ security/afternoon | buffet/thank/brunch/restaurant/ breakfast/food/excellent/staff/quality/ service/attention/security/variety/ hospitality/employee/ everyone/everything |
| Trip Purpose | conference/history/moment/adventure/ stay/holiday/price/people/accommodate/ friend/family/view/trip/luxury/ experience | conference/adventure/holiday/ price/accommodate/family/friend/ view/trip/experience/stay |
Table 5.
Result of the factor analysis.
| Words | Factor Loading | Eigen Value | Variance (%) | |
|---|---|---|---|---|
| Service | Staff | 0.982 | 3.214 | 6.839 |
| Quality | 0.968 | |||
| Service | 0.661 | |||
| Physical Environments | Facility | 0.981 | 2.199 | 4.678 |
| Environment | 0.947 | |||
| room | 0.654 | |||
| Dining | Restaurant | 0.943 | 1.645 | 3.500 |
| Brunch | 0.893 | |||
| Location | Ciudad | 0.922 | 1.617 | 3.440 |
| Mexico | 0.878 | |||
| Total Variance (%) = 18.458 | ||||
| KMO = 0.671 | ||||
| Bartlett chi-squared (p) = 84,453.902 (p < 0.001) | ||||
Table 6.
Results of linear regression analysis.
| Model | Unstandardized Coef. | Standardized Coef. | p | t | |
|---|---|---|---|---|---|
| B | Std. Error | Beta | |||
| (Constant) | 4.733 | 0.008 | 0.000 | 610.319 *** | |
| Service (S) | 0.019 | 0.008 | 0.027 | 0.014 | 2.449 ** |
| Physical Environments (P) | 0.004 | 0.008 | 0.005 | 0.620 | 0.496 |
| Dining (D) | −0.015 | 0.008 | −0.021 | 0.055 | −1.916 * |
| Location (L) | −0.005 | 0.008 | −0.007 | 0.521 | −0.642 |
Notes: Dependent variable: Customer Satisfaction (CS); R2 = 0.100; adjusted R2 = 0.100; F = 2.573, p < 0.05. *** p < 0.001, ** p < 0.05, * p < 0.1.
Publisher’s Note: MDPI stays neutral with regard to jurisdictional claims in published maps and institutional affiliations. |
© 2022 by the authors. Licensee MDPI, Basel, Switzerland. This article is an open access article distributed under the terms and conditions of the Creative Commons Attribution (CC BY) license (https://creativecommons.org/licenses/by/4.0/).
Share and Cite
MDPI and ACS Style
Kim, Y.-J.; Kim, H.-S. The Impact of Hotel Customer Experience on Customer Satisfaction through Online Reviews. Sustainability 2022, 14, 848. https://0-doi-org.brum.beds.ac.uk/10.3390/su14020848
AMA Style
Kim Y-J, Kim H-S. The Impact of Hotel Customer Experience on Customer Satisfaction through Online Reviews. Sustainability. 2022; 14(2):848. https://0-doi-org.brum.beds.ac.uk/10.3390/su14020848
Chicago/Turabian StyleKim, Yae-Ji, and Hak-Seon Kim. 2022. "The Impact of Hotel Customer Experience on Customer Satisfaction through Online Reviews" Sustainability 14, no. 2: 848. https://0-doi-org.brum.beds.ac.uk/10.3390/su14020848
Note that from the first issue of 2016, this journal uses article numbers instead of page numbers. See further details here.