
Electricity Substitution Potential Prediction Based on Tent-CSO-CG-SSA-Improved SVM—A Case Study of China


1
School of Urban Geology and Engineering, Hebei GEO University, Shijiazhuang 050031, China
2
School of Management, Hebei GEO University, Shijiazhuang 050031, China
*
Author to whom correspondence should be addressed.
Sustainability 2022, 14(2), 853; https://0-doi-org.brum.beds.ac.uk/10.3390/su14020853
Submission received: 19 November 2021
/
Revised: 25 December 2021
/
Accepted: 30 December 2021
/
Published: 12 January 2022
(This article belongs to the Special Issue Advanced Intelligent Technologies in Sustainable Energy Forecasting and Economical Applications)
Abstract
:Nowadays, fossil energy continues to dominate China’s energy usage; its inefficient use and large crude emissions of coal and fuel oil in its end-consumption have brought about great pressure to reduce emissions. Electrical power substitution as a development strategy is an important step toward achieving sustainable development, the transformation of the end-use energy consumption structure, and double carbon goals. To better guide the broad promotion of electrical power substitution, and to offer theoretical support for its development, this paper quantifies the amount of electrical power substitution and the influencing factors that affect the potential of electrical energy substitution. This paper proposes a hybrid model, combining Tent chaos mapping (Tent), chicken swarm optimization (CSO), Cauchy–Gaussian mutation (CG), the sparrow search algorithm (SSA), and a support vector machine (SVM), as a Tent-CSO-CG-SSA-SVM model, which first uses the method of Tent chaos mapping to initialize the sparrow population in order to increase population diversity and improve the search ability of the algorithm. Then, the CSO is introduced to update the positions of sparrows, and the CG method is introduced to make the algorithm jump out of the local optimum, in order to improve the global search ability of the SSA. Finally, the final electrical power substitution potential prediction model is obtained by optimizing the SVM through a multi-algorithm combination approach. To verify the validity of the model, two regions in China were used as case studies for the prediction analysis of electrical energy substitution potential, and the prediction results were compared with multiple models. The results of the study show that Tent-CSO-CG-SSA-SVM offers a good improvement in prediction accuracy, and that Tent-CSO-CG-SSA-SVM is a promising method for the prediction of electrical power substitution potential.
1. Introduction
China’s economic development has made magnificent progress in recent years, but it has also faced challenges; it currently faces major challenges in terms of resource and environmental issues, as well as energy transition. Today, China’s energy consumption is primarily from fossil energy. Its inefficient use in addition to the large crude emissions of coal and fuel oil in end-consumption have made the problem of resource wastage increasingly prominent and have led to great resistance to the promotion of environmental protection, energy conservation, and emission reduction. Electricity is a clean energy source with the advantages of high efficiency, safety and being green [1,2]. The electric power substitution strategy replaces traditional energy-intensive energy sources such as oil, coal, and natural gas with electric power at the end-use energy consumption stage. Innovation is an important driving force of clean-energy strategies [3], and China has made efforts to improve the approach of electric-powered energy substitution with active innovation. To transform the end-use energy consumption structure and achieve sustainability, in order to positively change its economic structure, China has started to vigorously promote electrical power substitution development strategies, and positively guide enterprises to carry out electrical power substitution and transformation, taking electrical power as an important form of energy-consumption structure transformation. Therefore, the development strategy of electrical substitution will become a critical way for China to achieve its sustainability aims, and it is therefore important to study the potential of regional electrical power substitution development.
Currently, electrical power substitution is a research hotspot in the energy field. The literature [4] has constructed a comprehensive index system of electrical energy substitution potential and evaluated the regional electrical energy substitution potential by using the TOPSIS method. Moreover, the literature [5,6] has elaborated and analyzed the current situation of the promotion and application of electrical energy substitution technology and verified and analyzed [7] the feasibility of a regional renewable-energy local-consumption mode through an arithmetic simulation. Ref. [8] focused on the analysis of the environmental benefits of electrical energy substitution, which is an important way to improve the environment. Ref. [9] used machine learning for the short-term forecasting of energy loads. Among the many studies on electrical power substitution potential, prediction research is founded on the basis of an effective implementation of an electrical power substitution development strategy. The implementation of electrical power substitution requires the forecast of a long-term development trend of electrical power, which provides data support for the promotion and implementation of electrical power substitution strategies. Regional electrical power substitution potential forecasts provide a quantitative evaluation of regional electrical power substitution potential. They provide a scientific decision basis for the promotion of electrical power substitution development strategies and standardize the promotion of electrical power substitution. Therefore, the research on the quantification and prediction of electrical power substitution potential is of strong practical meaning.
Regarding the research on forecasting methods, with the continuous improvement of machine learning and intelligent algorithm models, traditional metering models and algorithms have been unable to meet the current electricity forecasting. Currently, short-term electric load forecasting and long-term electric power replacement volume forecasting with artificial intelligence methods have become new research hotspots, such as intelligent algorithms combined with support vector machines, and neural network models. Ref. [10] used SVM to forecast the electric load, whereas [11] used a multi-algorithm-optimized GRNN model for power-load prediction. Ref. [12] used multiple models of SVM and ELM to forecast the production capacity of photovoltaic materials. The authors of [13] used the Moth–Flame optimization algorithm for the prediction of wind–energy potential. Ref. [14] used a genetic algorithm to improve the gray prediction model to forecast the energy consumption in China, whereas [15] used LSTM for the prediction of short-term energy for households based on blockchain. Ref. [16] predicted and analyzed the potential of electrical energy substitution by means of an electrical energy substitution model with an environmental load and decoupling theory, and the results showed that policy support has a strong driving effect on electrical energy substitution. The authors of [17] used a STIRPAT-ridge regression model based on electrical power substitution potential for prediction; the results showed that environmental factors have a strong influence on the electrical power substitution potential. Ref. [18] used SVM based on particle swarm optimization for the forecasting of electrical power substitution potential, and the results showed that the particle swarm algorithm was helpful in improving the prediction accuracy of the support vector machine, by optimizing the model parameters. Ref. [19] further investigated the optimization model of the particle swarm algorithm by improving the inertia weights of the particle swarm algorithm and using a two-way weighted gray correlation to screen the important influences affecting the electrical power substitution potential. The results indicated that the forecasting ability of the model was improved significantly. Moreover, [20] classified the factors influencing the potential of electrical power substitution into five factors: economic, environmental protection, energy, technology and policy. The forecasting results of the electrical power substitution potential using the combined model showed the steady progress of electrical power substitution in Beijing, Tianjin and Hebei, which played a demonstrative role in promoting energy saving and emission reduction. Ref. [21] used an improved logistic model while setting different energy consumption scenarios to forecast the electrical power substitution in Jiangsu Province, which serves as a medium- and long-term load forecasting model to guide the electrical power substitution planning work. The author of [22] used logistic fitting with an improved BP neural network to forecast the electric power replacement volume. Studies on electric load forecasting showed [23] that the SVM model had a better forecasting ability compared to the neural network model when the sample data size was small. The newly proposed sparrow search algorithm [24], which has started to be applied in many fields in recent years, has a higher capability with regard to solving and finding the optimal solution.
Based on the above research, we aim to improve the prediction accuracy of electrical power substitution’s potential; this paper will consider the whole range of economic, environmental, technological and policy factors influencing electrical power substitution. The prediction accuracy of the model was evaluated using metrics such as RMSE, MAPE and r [25]. The parameter settings of the support vector machine have a large impact on the prediction results, so a multi-algorithm optimization sparrow search algorithm is introduced to improve the support vector machine. Firstly, we optimized the sparrow search algorithm with Tent chaotic mapping, chicken swarm optimization (CSO) and Cauchy–Gaussian mutation (CG), and then optimized the SVM with the improved sparrow search algorithm to establish the ISSA-SVM model for electrical power substitution potential prediction.
The main contributions of this paper are as follows:
- (1)
- From four perspectives—economic development factors, environmental constraints, technological development and policy influence—we analyzed the influencing factors of electrical power substitution potential and give theoretical guidance for the promotion of electrical power substitution. In the meantime, the potential for electricity substitution is quantified and analyzed quantitatively;
- (2)
- Improvements to the sparrow search algorithm: Firstly, Tent chaotic mapping was used to initialize the sparrow population, so that the sparrow population was diversified. Then, a chicken swarm optimization (CSO) was introduced to improve the global search ability of the algorithm in the individual position update, followed by the introduction of the Cauchy–Gaussian (CG) mutation method to improve the individual fitness, and finally the multi-algorithm improved sparrow search algorithm was obtained;
- (3)
- The multi-algorithm improved sparrow search algorithm was used to optimize the SVM model to forecast the electrical power substitution potential. It provides theoretical support and decision support for China to promote the development strategy of electrical power substitution and achieve sustainable development.
In summary, this paper constructs a comprehensively economic, environmental, technological, and policy all-around electrical substitution potential forecast model. The rest of this paper is organized as follows: Section 2 quantifies and analyzes the factors influencing the electrical power substitution potential and the electrical power substitution potential. Section 3 constructs a support vector machine prediction model based on tent chaos mapping and chicken swarm optimization (CSO) with multiple Cauchy–Gaussian (CG) mutation algorithms to improve the optimization of the sparrow search algorithm, and describes the prediction process of the electrical power substitution potential forecast model proposed in this paper and determines the model input and output variables. In Section 4, data from the Jiangsu Province region are selected for empirical analysis to verify the accuracy as well as the validity of the model. Further validation is carried out in Section 5. Section 6 summarizes the research results of this paper.
2. Factors Influencing and Quantifying the Potential for Electricity Substitution
The potential of electrical power substitution is influenced by economic development, environmental constraints, technological development, and policy support. This analyzes the potential of electrical power substitution from four perspectives: economic development factors, environmental constraints, technological development, and policy influence.
2.1. Economic Development Factors
The economic development of a region will drive the growth of local end-use energy consumption and electrical energy consumption. Accordingly, there is high correlation between the economic situation and electrical energy consumption. GDP can well reflect the economic development of a region, which means there is also a significant correlation between GDP and electrical energy consumption [26]. As a result, the economic development indicators that affect the potential of electrical power substitution are quantified as GDP per capita and total regional GDP.
2.2. Environmental Constraintss
In 2020, at the 75th session of the United Nations General Assembly, the Chinese government clearly stated that China is striving to reduce China’s CO2 emissions by 2030 and achieve the goal of carbon neutrality by 2060. This strategic target plan shows China’s determination to achieve a low-carbon green economy. However, the volume of emission reduction required to achieve the “double carbon” target is huge, and the task of emission reduction is rather difficult due to the time constraints. According to the 14th Five-Year Plan, the carbon intensity of 2025 will be reduced by 18%, i.e., CO2 emissions per unit of GDP will be reduced by 18%. Under the condition of a series of environmental constraints, the energy consumption structure will be further improved from traditional fossil energy to alternative energy such as electrical power. Consequently, the environmental constraints are bound to influence the development process of electrical power substitution.
2.3. Technological Progress Factors
With the increasing evolution and advancement of electrical power substitution development technology and its application, the end energy consumption structure will be further optimized. The technical approach in the field of electrical power substitution is cleaner and more efficient compared with traditional energy consumption. Therefore, the continuous advancement of technology contributes to the expansion of the application of electrical power substitution technology. Each technological development originates from the transformation of energy demand, and thus technological progress will also bring about the transformation of energy demand. Due to technological progress, the end-use energy consumption of users will shift more to electric power, and the energy cost also affects the process of electrical power substitution. Energy consumption intensity, i.e., energy consumption per unit of GDP, can indicate the advanced level of technical equipment, the level of utilization of regional energy consumption and the technical level of energy production and consumption. The higher the technological progress factors are, the lower the energy consumption intensity is. Therefore, this paper quantifies the technological progress factors affecting the capacity of electrical power substitution as the regional energy consumption per unit of GDP and total energy consumption.
2.4. Policy Influencing Factors
The early stage of electrical power substitution application promotion requires a lot of economic investment. However, it is often difficult to promote electrical power substitution among enterprises if the benefits are calculated according to the basic investment returns. In order to realize the smooth development and extensive promotion of the electrical power substitution development strategy, the government needs to introduce special measures, including tax policies to support electrical power substitution technology programs and give corresponding subsidies and tax policies. The level of electrical power construction can be reflected by the ratio of investment in electrical power fixed assets to investment in energy fixed assets. The higher the level of the electrical power construction is, the higher the proportion of investment in electrical power fixed assets. Therefore, this paper selects the ratio of regional electrical power fixed asset investment to energy fixed asset investment to quantify the influence of policy support factors on electrical power substitution.
2.5. Electricity Substitution Potential
For the quantitative calculation of the electrical power substitution potential, this paper draws on the definition of electrical power substitution potential from the literature [18] as a scientific basis for the analysis of electrical power substitution potential. Let the electrical power consumption of the region in the base year be and the total terminal energy consumption be . If the terminal energy consumption structure maintains the level of the base year , the proportion of electrical power in the terminal energy consumption between regions is the same as that in the base year , and then the increase in electrical power consumption in the tth year compared with the electrical power consumption in the year is taken as the electrical power substitution amount in the tth year, i.e., the quantified electrical power substitution potential. In this paper, the initial year of sample data is the base year . The formula is as follows:
3. Model Design and Algorithm Flow
3.1. Sparrow Search Algorithm
The sparrow search algorithm has good merit-seeking ability. The explorers in the group are in charge of finding food and determining the location and foraging direction, while the followers forage by obtaining the information shared by the explorers. The foraging behavior of sparrows can be further divided into the following exploratory strategies. Each sparrow in a sparrow population has access to the strategies and behaviors adopted by other sparrows. Aggressors in the population will compete for food resources with their high-intake peers to increase predation rates. Additionally, there are early warning mechanisms in sparrows that allow them to move to safe areas when danger is imminent. Highly adapted explorers will be at a high priority position during the population’s search for food, i.e., they will have priority access to food. Explorers provide food for the whole sparrow population and determine the foraging direction of followers, and thus the location update range of explorers is larger than the followers.
The explorer’s foraging location update formula is as follows:
In Equation (2), is the number of iterations of the population ), is the dimension of the optimization problem , and a are randomly generated random numbers and obeys a normal distribution, while is the all −1 matrix of . denotes the warning value and denotes the safety value. When the warning value is less than the safe value, it means the population is in a safe search area with a large foraging range; when the warning value is greater than or equal to the safe value, it means the population is close to the danger zone and the whole population will urgently forage in other areas.
The follower position update formula is as follows:
denotes the best location found by the current explorers and is the worst location of the current population foraging. is a matrix with a value of 1 or −1. indicates that the th follower with a lower fitness value does not obtain food and is in emergency, when the followers need to go to another location to forage.
When danger comes, the population’s danger warning mechanism is updated with the following equation:
denotes the current sparrow fitness value, denotes the best global fitness value, and denotes the worst global fitness value. means that the population has found vigilance and is required to move closer to other sparrows to reduce the risk of predation, and implies that the sparrows are at the edge of the population and there is an increasing risk of predation. refers to the direction of sparrow movement and the parameter that controls the movement step.
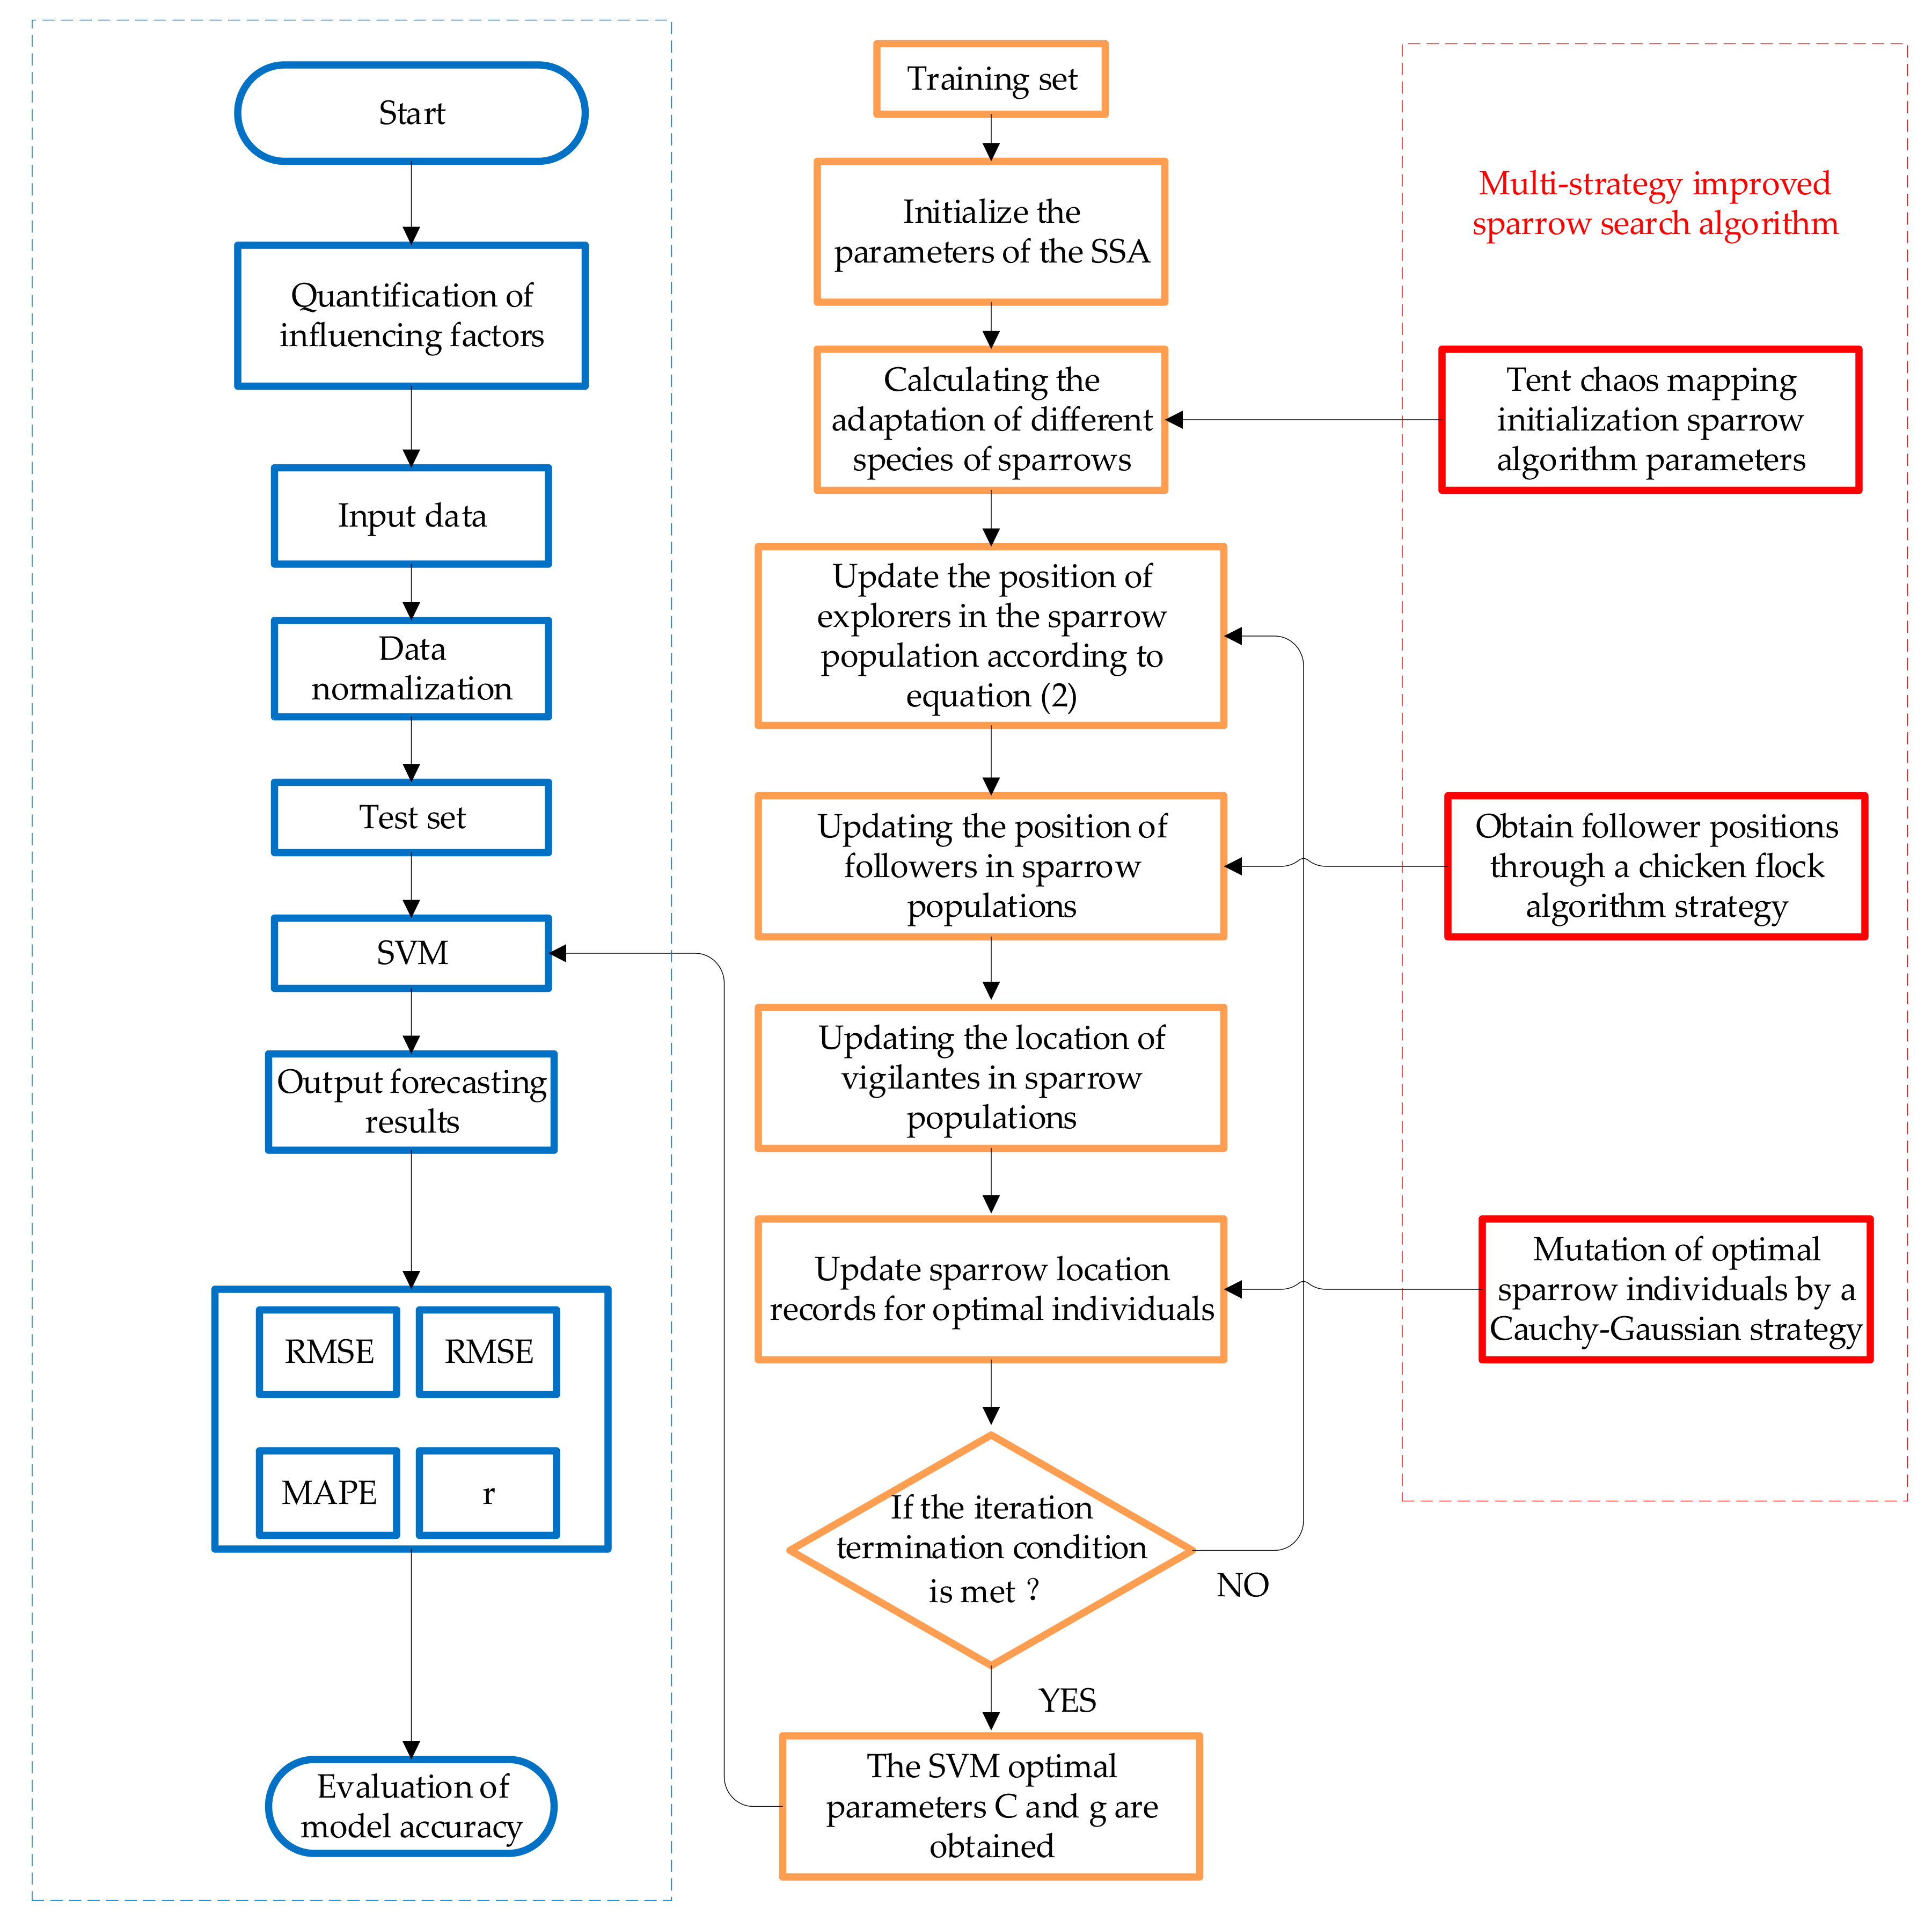
3.2. Multi-Algorithm Improvement of Sparrow Search Algorithm
In this paper, the sparrow search algorithm is optimized in three areas: firstly, the tent chaotic mapping method was applied to initialize the sparrow population parameters, which led to the increasing diversity of the sparrow population and reducing the uncertainty of the initialized population. Secondly, the chicken swarm optimization (CSO) strategy was introduced in the follower position update process to augment the global search capability of the algorithm. Finally, the Cauchy–Gaussian mutation method is applied to improve the situation where the algorithm can easily fall into local optimal stagnation, and give the algorithm better global searchability.
3.2.1. Tent Chaos Mapping Initialization Population
Chaos mapping [27] is a method for generating chaotic sequences, and in the field of optimization algorithm research, chaos mapping improves the algorithm’s optimality seeking ability by exploiting the motion behavior of the nonlinear systems of chaotic systems. The basic principle is to initialize the population by chaotic mapping to improve the ergodicity and optimality of the algorithm.
Tent chaotic mapping, a segmented mapping, is characterized by simple structure, uniform distribution of density population after mapping, high ergodicity, and high computational efficiency. Its formulation is:
The Tent chaos mapping is applied to optimize the sparrow search algorithm, and the data generated by the Tent mapping are used as the location information of the initial sparrow population to make the sparrow population more diverse and reduce the uncertainty of the initialized population.
3.2.2. Chicken Swarm Optimization to Improve Sparrow Search Algorithm
In the traditional sparrow search algorithm for follower position updates, it is easy to fall into dense populations of local sparrows, which makes the algorithm sink into a local optimum situation. To avoid of disadvantages, in this paper, the CSO [28] is introduced for follower position updating. The CSO has excellent global optimality seeking ability, and the algorithm strategy is that the hen approaches the rooster with a certain probability, which can take both local exploitation and global optimality seeking into account. The hen position update equation is as follows:
In Equation (8), denotes anyth rooster in the hen’s mate, f denotes the fitness value in Equation (9), and s denotes any th rooster or hen in the flock.
The random following strategy is introduced in the follower position update process in the sparrow search algorithm to make full use of the position information and probabilistic variation of individuals in the previous generation.
3.2.3. Cauchy–Gaussian Hybrid Mutation
In the traditional sparrow search algorithm, when the sparrow individuals iterate to the late stage, it is easy to ensure the population assimilation is the local optimum. To overcome this drawback, the method of Cauchy–Gaussian mutation [29] is introduced to mutate the individual with the highest current fitness, compare the positions before and after the mutation, and select a better position for iteration. The relevant equation is as follows:
In Equation (11), denotes the position of the optimal individual after variation, denotes the standard deviation of the Cauchy–Gauss mutation, is a random variable satisfying the Cauchy distribution, and is a random variable satisfying the Gauss distribution. and are adjustment parameters with the number of iterations t, aiming to increase the global optimization algorithm’s search capability.
3.3. Support Vector Machine
SVM is a machine learning modeling method whose theoretical basis is derived from statistics. SVM seeks to ensure the minimum structural risk, improves the generalization ability of the model, minimizes the empirical risk and confidence interval, and obtains good statistical rules with few statistical samples.
The SVM regression model evolved from the classification problem of SVM, and the classifier model outputs discrete values while the regression model outputs continuous values. The SVM classification model obtains the regression model of support vector after introducing the insensitive parameter ε. the SVM model has good nonlinear prediction ability and is suitable for small sample data learning. The SVM has been the research hotspot of prediction models, especially in machines. The SVM model has been a research hotspot with regard to prediction models, especially under the high fast-pace development of machine learning and intelligent algorithms, and the SVM model has been continuously optimized. The basic principle is as follows.
Given an -dimension training data set with a sample size of , when the input variables are nonlinearly related to the output variables, the function takes the following form:
In the formula, is the intercept term of the Regression function, is the regression coefficient, and is a nonlinear Kernel function. This function can map the low-dimension nonlinear data directly to a high-dimension space, so the nonlinear operation can be converted to a linear operation. The essence of the supported vector regression (SVR) is to find the regression function so that the deviation of the corresponding function value and target of all training data cannot exceed the insensitive parameter . The objective function and the constraint formula are as follows:
The first part of the objective function is the Euclidean paradigm, which is related to the complexity of the model, and the remaining part is the empirical risk. One of the penalized training errors is the -insensitive loss function, for a given sample, where the difference between the predicted values and actual sample values of the model is represented. The smaller the loss function is, the more accurate the model is for this sample. The empirical risk is calculated once for all training samples , and then the average value is obtained by accumulation. the penalty factor, which is related to the model complexity and empirical risk, indicates the tolerance of the model to errors. The constraints and represent positive relaxation variables; hence, the existence of a solution is guaranteed. The Lagrange multiplier method is used to optimize the function and the first partial derivative of this Lagrange multiplier is given by:
The result is obtained by taking the first-order partial derivative of Equation (8) as zero in Equation (7) and introducing the effective kernel function 𝑀𝑒𝑟𝑐𝑒𝑟 condition 𝐾 to obtain the pairwise problem form of the objective function:
In turn, the final expression of the regression model is obtained as follows:
The kernel function can map the original space inner product to the high-dimension feature space by nonlinear transformation. In this model, the kernel function is chosen as the RBF kernel function, i.e., the Gaussian radial kernel function.
and are the main parameters that affect the prediction performance of support vector machines. is the penalty factor. The larger the penalty factor is, the smaller the tolerance to the training set error will be, which may lead to the overfitting of the training set. Moreover, overfitting will result in a model that predicts well in the training set yet poorly in the test set, and the poor generalization ability of the model. However, if the setting of the penalty factor is small, there will be an extremely large error and failure of the prediction model.
is the parameter setting of the RBF kernel function, which determines the distribution of the data mapped to the new feature space. is the default value , and is the total number of categories. The smaller the value of is, the more support vectors there are. The number of support vectors is related to the speed of model training and prediction.
3.4. Electricity Substitution Potential Prediction Model
Regarding the construction of the regional electrical power substitution potential prediction model, firstly, the input variables of the model are determined as GDP per capita, total regional GDP value, CO2 emission per unit GDP, total CO2 emission value, ratio of fixed asset investment in electrical power construction to fixed asset investment in energy, fixed asset investment in electrical power, total energy consumption and energy consumption per unit GDP, and historical electrical power substitution. The output variables of the model are electrical power substitution potential values.
The main steps for optimizing the SVM model based on the multi-algorithm improved the sparrow search algorithm (SSA) are as follows:
- Step 1: Set the parameters related to the sparrow search algorithm with a maximum number of 100 iterations and a population size of 20.
- Step 2: Generate the sparrow population by using Tent chaotic mapping, including the population ratio of both explorers and followers.
- Step 3: Generate new individuals. By introducing the chicken swarm optimization (CSO) to update the follower positions and the Cauchy–Gaussian mutation strategy (CG) to mutate the individuals, the positions of explorers, followers and sparrows under the early warning mechanism are updated. Meanwhile, new solutions are generated continuously and iteratively, and the current optimal solution for the explorer positions and the global optimal solution are recorded.
- Step 4: The fitness function is evaluated to obtain the best adapted individual. SSA should take appropriate measures to ensure the best parameter settings to improve the prediction accuracy of the model. In the SSA, the -fold cross-validation ( method is used to optimize the model parameters. -fold cross-validation can effectively solve the situation of poor generalization ability of the model overfitting, and the mean square error of the prediction model is selected as the fitness function. -fold cross-validation takes advantages of the no-repeat sampling: each individual has only one chance to be included in the training set or test set in each iteration. Combined with the sample size in this paper, , where the model evaluation index is , the true value, and is the predicted value.
- Step 5: Stop the loop criteria. There are two stopping criteria: one is that the number of iterations reaches the set criteria, and the other is that the model error reaches the expected level. When the iterations meet the stopping criteria, the prediction results are output. Otherwise, repeat the third and fourth steps until the number of iterations reaches the preset value. With cyclic iterations, the best fitness function value is obtained and the best model parameters are obtained. Then, the sparrow search algorithm’s model parameters, and , are updated to the SVM model, and eventually the ISSA-SVM prediction model is obtained.
The flow chart of ISSA-SVM electrical power substitution potential prediction model is in Figure 1.
4. Case Study
4.1. Data Sources and Model Evaluation
With the purpose of analyzing the effectiveness of the prediction model of electrical power substitution potential established in this paper, Jiangsu Province was used as an example (2000–2019), and the data sources were China Statistical Yearbook, China Energy Statistical Yearbook and Jiangsu Statistical Yearbook. All these resources were used to predict the potential of electrical power substitution in Jiangsu Province.
The platform used for this experiment is Matlab 2020b, and the running environment is AMD R7-5800H with 16 G memory and 512 G solid state drives. Simulations were performed in Matlab software using a program written by ourselves. The penalty parameter and kernel function parameters of the model proposed in this paper are optimized. The optimal penalty parameter and kernel function parameters of ISSA optimization results are 840.51 and 0.31.
The variables related to the forecast of electrical power substitution potential in Jiangsu Province (2000–2015) were used as learning samples. ISSA-SVM, SSA-SVM and SVM models were applied to train the electrical power substitution potential in Henan Province. The parameters of the benchmark SVM model were determined by the poor method grid search with parameters of 90 and 0.8, respectively. The optimal penalty parameter and kernel function parameters of SSA optimization results were 922.31 and 0.19. The variables related to the electrical power substitution potential of Jiangsu Province (2016–2019) were used as the test samples to evaluate the superiority of the electrical power substitution potential model prediction ability by comparing the model evaluation indexes.
Since a single error indicator does not fully reflect the reliability of the prediction model, in order to verify the predictive performance of the model, multiple indicators of the correlation coefficient r, root mean square error (RMSE), mean absolute error (MAE) and mean percentage error (MAPE) were used to evaluate the prediction model in this paper. The relevant evaluation indicators are calculated as follows:
In the above equation, is the true value of the sample and is the predicted value of the model. These evaluation indexes can be used to evaluate the accuracy of the prediction model, where the value of correlation coefficient r tending to 1 indicates a higher accuracy of the prediction model, and the value of the rest of the evaluation indexes tending to 0 indicates a higher accuracy of the prediction model and higher reliability of the model. The combined use of multiple model evaluation indexes can evaluate the predictive performances of the models in a more scientific and objective way.
4.2. Analysis of Prediction Results
The forecast input and output variables of electrical power substitution potential in Jiangsu Province were brought to ISSA-SVM, SSA-SVM and SVM models, and the forecast results of different models were obtained as shown in Table 1.
The prediction results of the three electrical power substitution potential forecasting models are shown in Figure 2. As seen intuitively, the predicted value of the electrical power substitution potential of the prediction model selected in this paper has a better fitting with the actual value, and the prediction accuracy has been improved to some extent. Especially in the test sample (2016–2019), the ISSA-SVM determined in this paper is closer to the true value; thus, it can be seen that the multi-algorithm improved sparrow search algorithm optimized model has a better generalization ability.
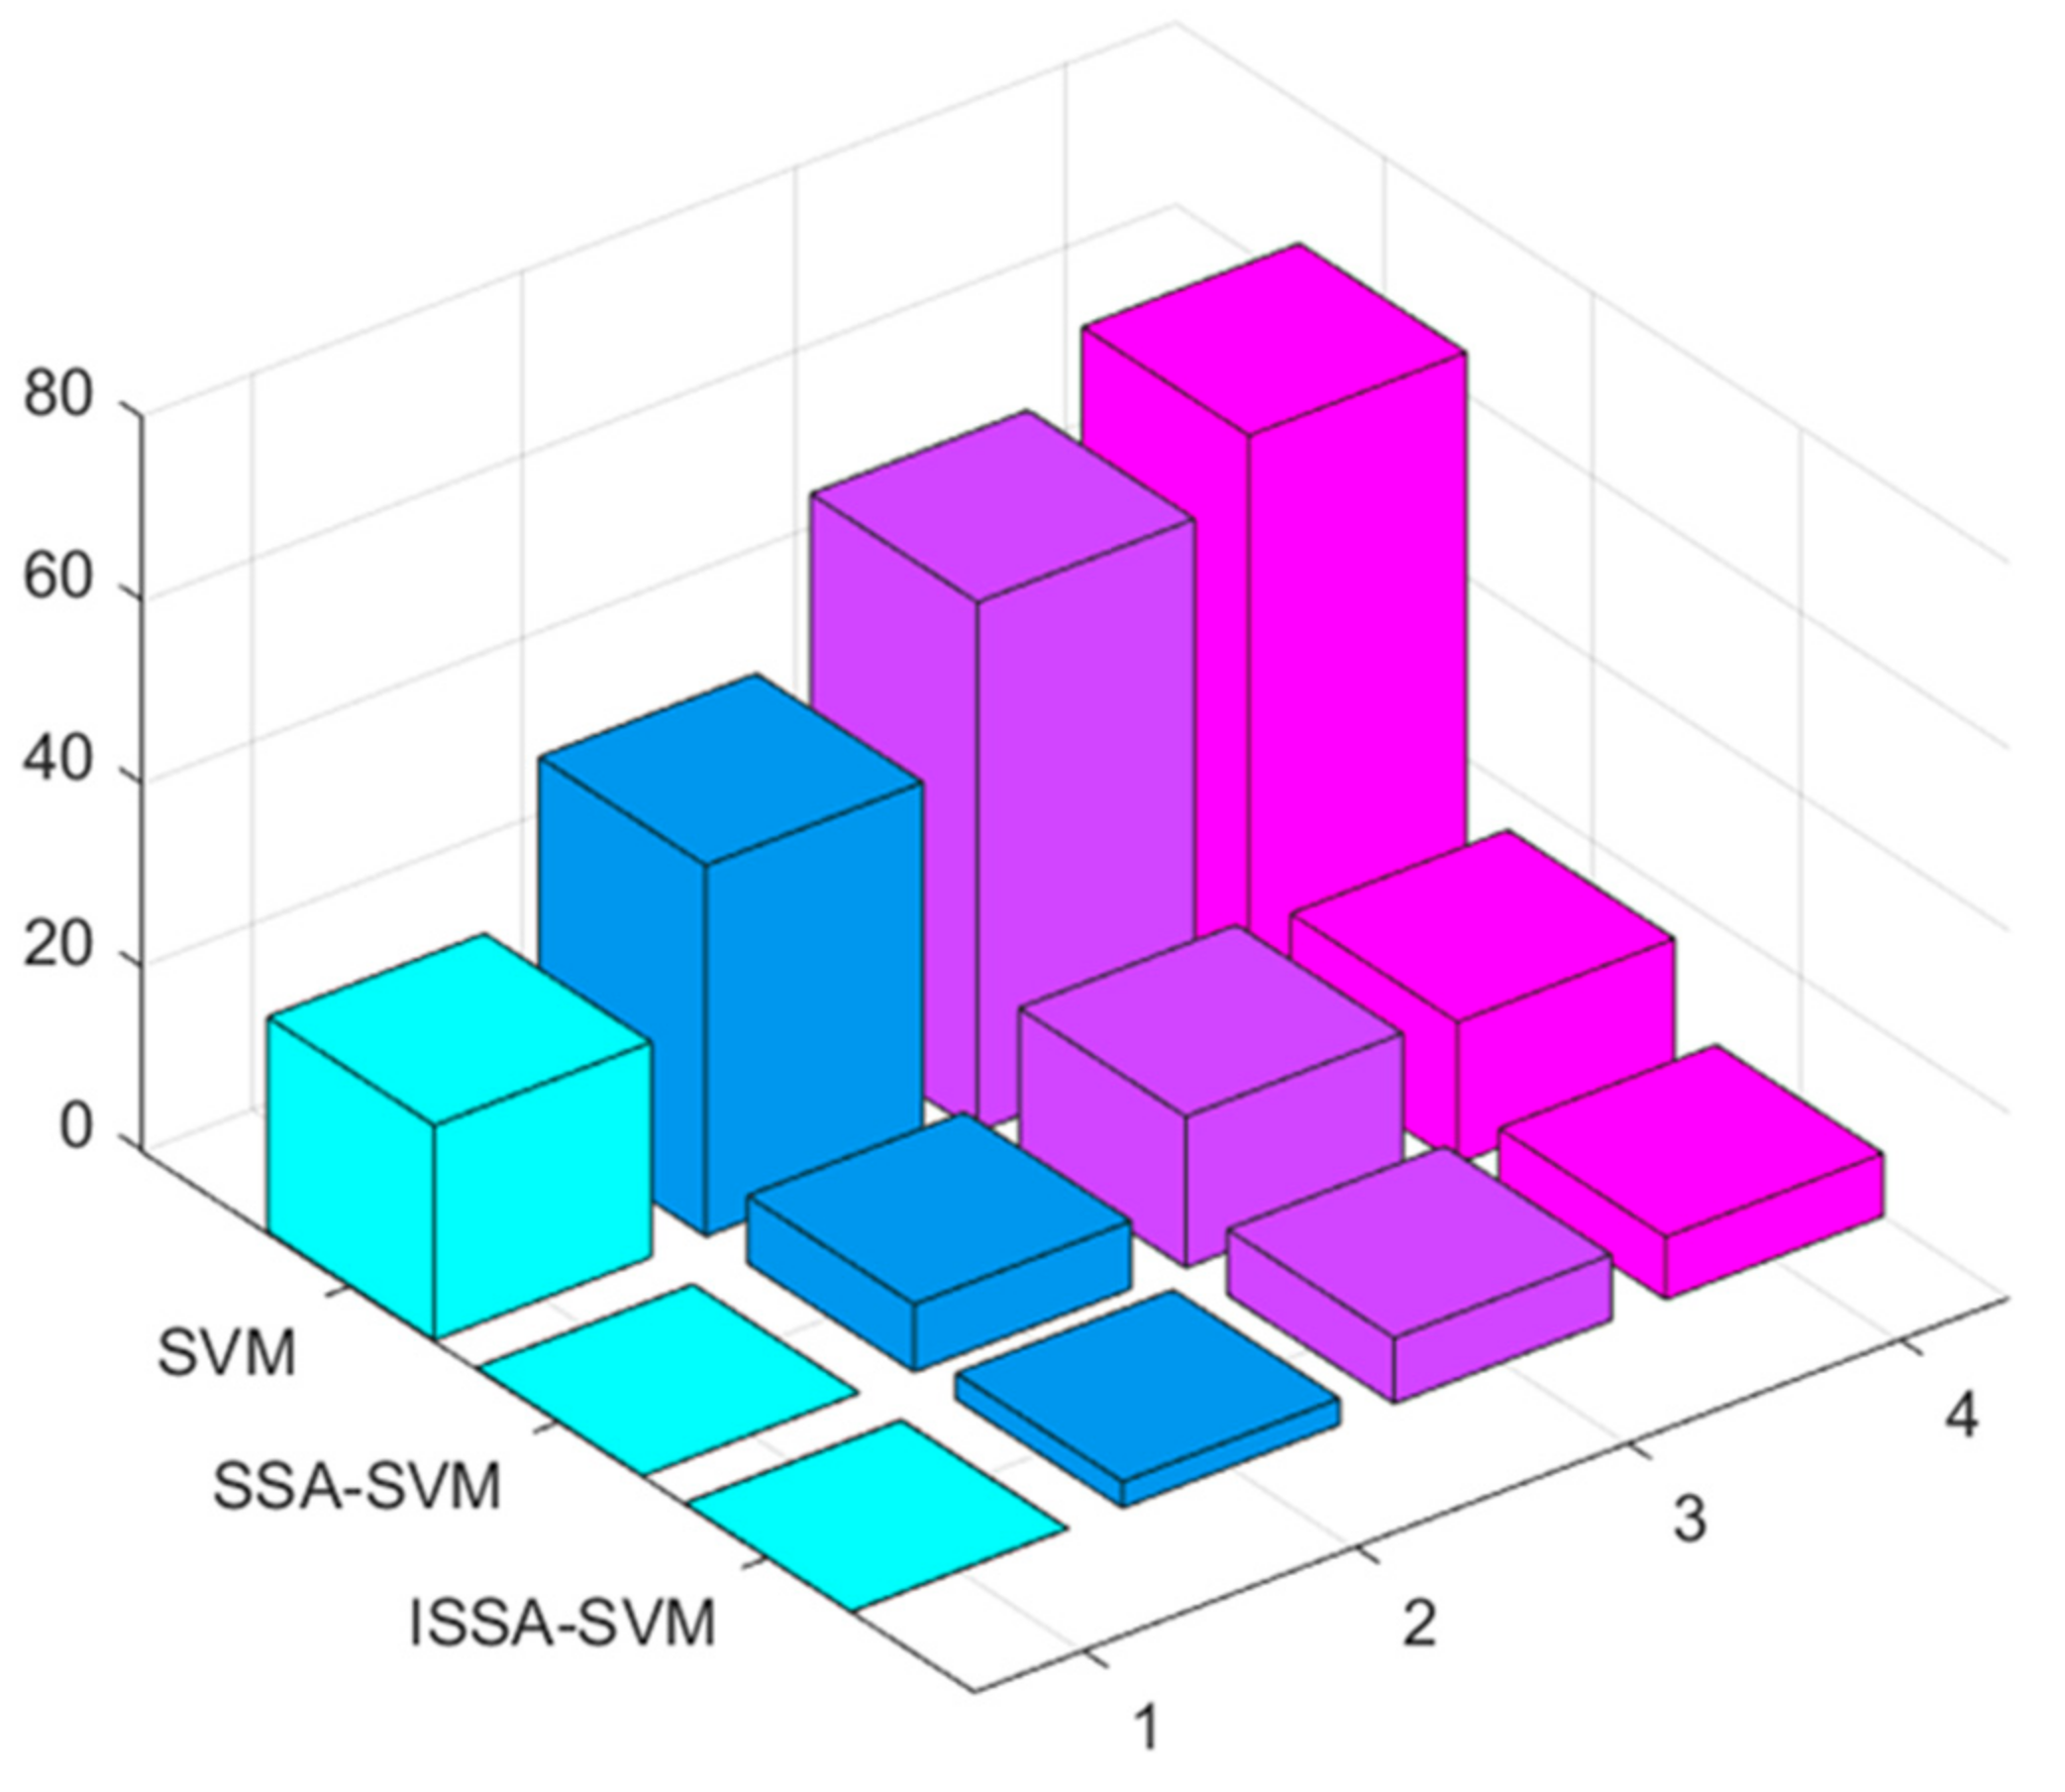
To verify the forecasting performance of the three models in the test set, the evaluation index of relative error is introduced and the predictive ability of the three models is compared. The relative errors of the test sets of the three models are shown in Table 2.
As shown in Table 2 and Figure 3, the multi-algorithm improved sparrow search algorithm (ISSA) optimized SVM has a better prediction accuracy in the test set than the other two comparison models. This indicates that the multi-algorithm improved model proposed in this paper has a better generalization ability and overcomes the over-learning of the model to a certain extent.
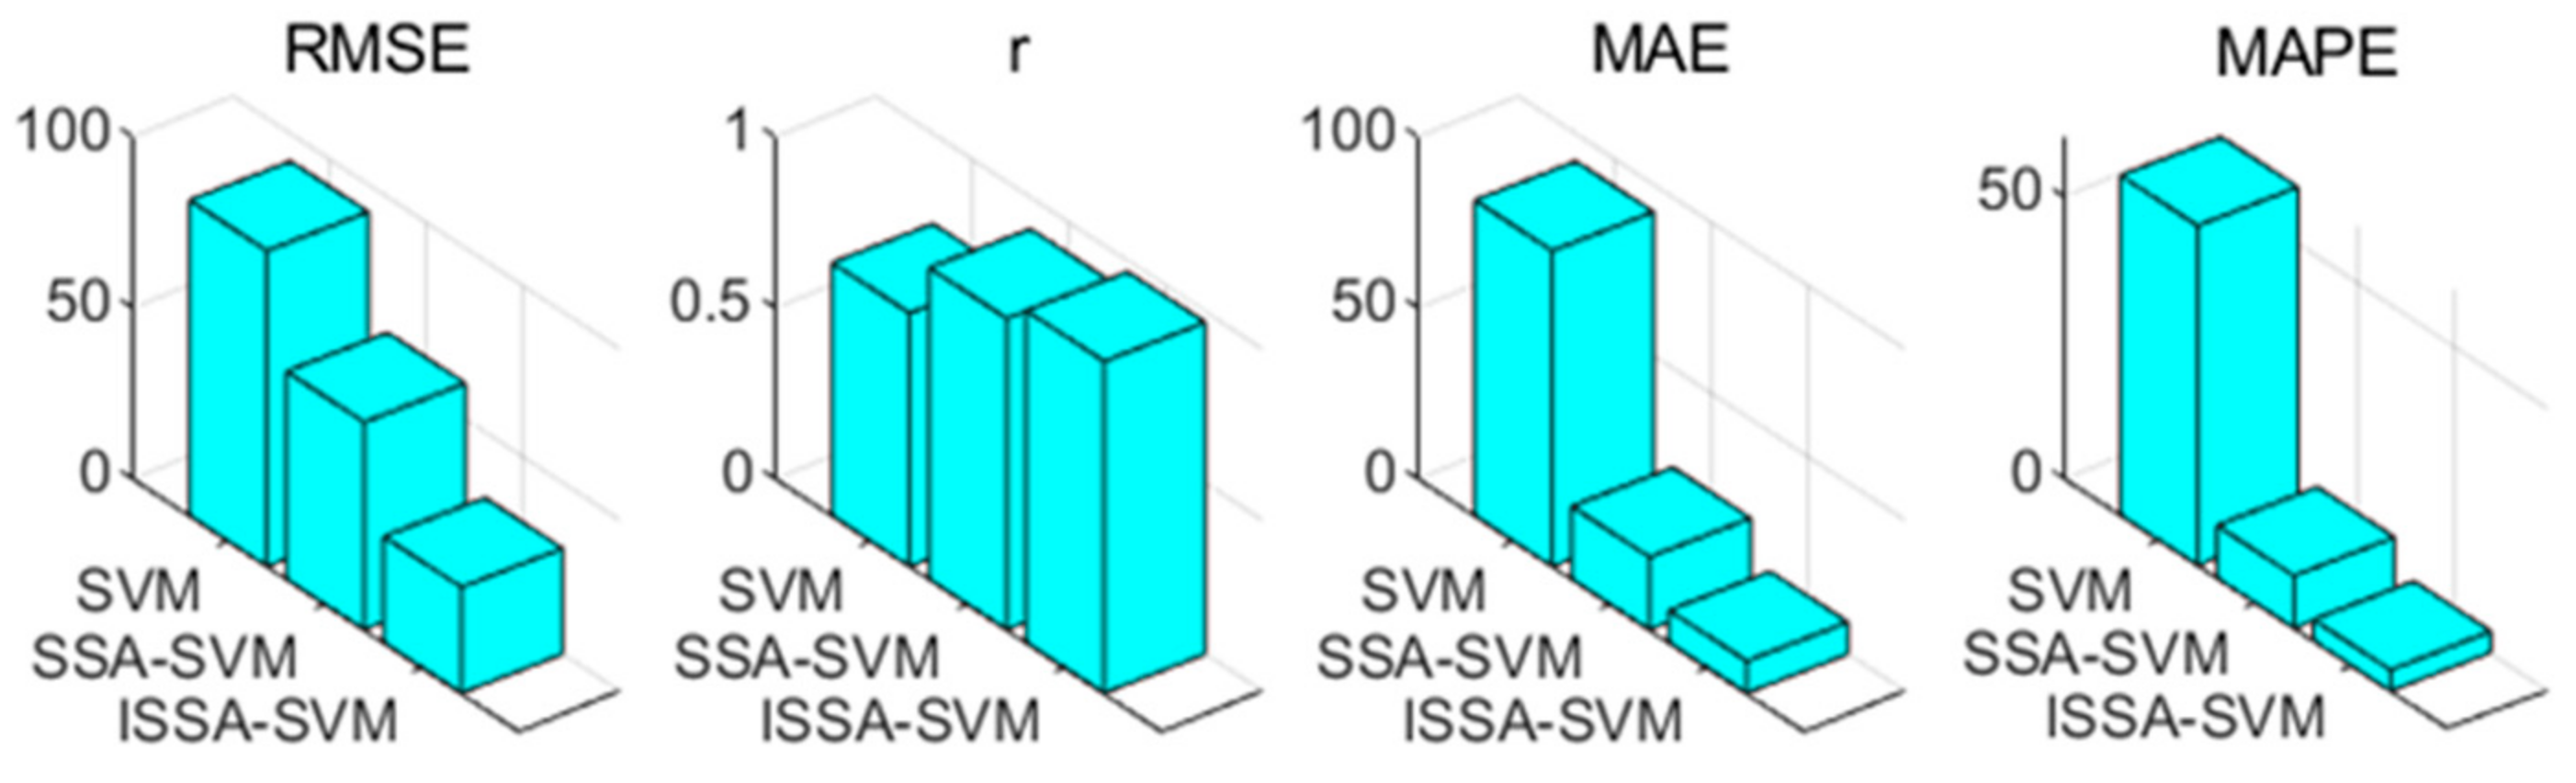
To further study the forecasting accuracy of these three models, this paper will compare and analyze the three models in terms of various indicators of the correlation coefficient r, RMSE, MAPE and MAE. The evaluation results of the three models are shown in Table 3 and Figure 4.
Statistical analysis of the cases: The average percentage error of the model proposed in this paper is reduced by about 5 percent compared with the support vector machine improved by the single sparrow search algorithm and by about 40 percent compared with the unoptimized support vector machine. The average absolute error and root mean square error of the model proposed in this paper are 22.27 and 61.22, compared with 48.11 and 130.25 for the model optimized by the single sparrow search algorithm and 165.97 and 391.68 for the unoptimized support vector machine. In the correlation coefficient between the test sample and the true value, the correlation coefficient r of the proposed model is 0.99, thus indicating that the predicted value of the proposed model fits the true value best. As shown in multiple model evaluation metrics in Figure 3, the predictive ability of the SVM optimized by the sparrow search algorithm is greatly improved compared with the SVM model optimized by the algorithm. In Figure 4 it can be concluded that the Tent chaos mapping with the CSO and the Cauchy–Gaussian mutation improved the Sparrow Search Algorithm in terms of the root mean square error (RMSE), the mean absolute error (MAE), the mean percentage error (MAPE), and Relative Error (RE) on the evaluation metrics of model prediction ability are all improved.
5. Further Study
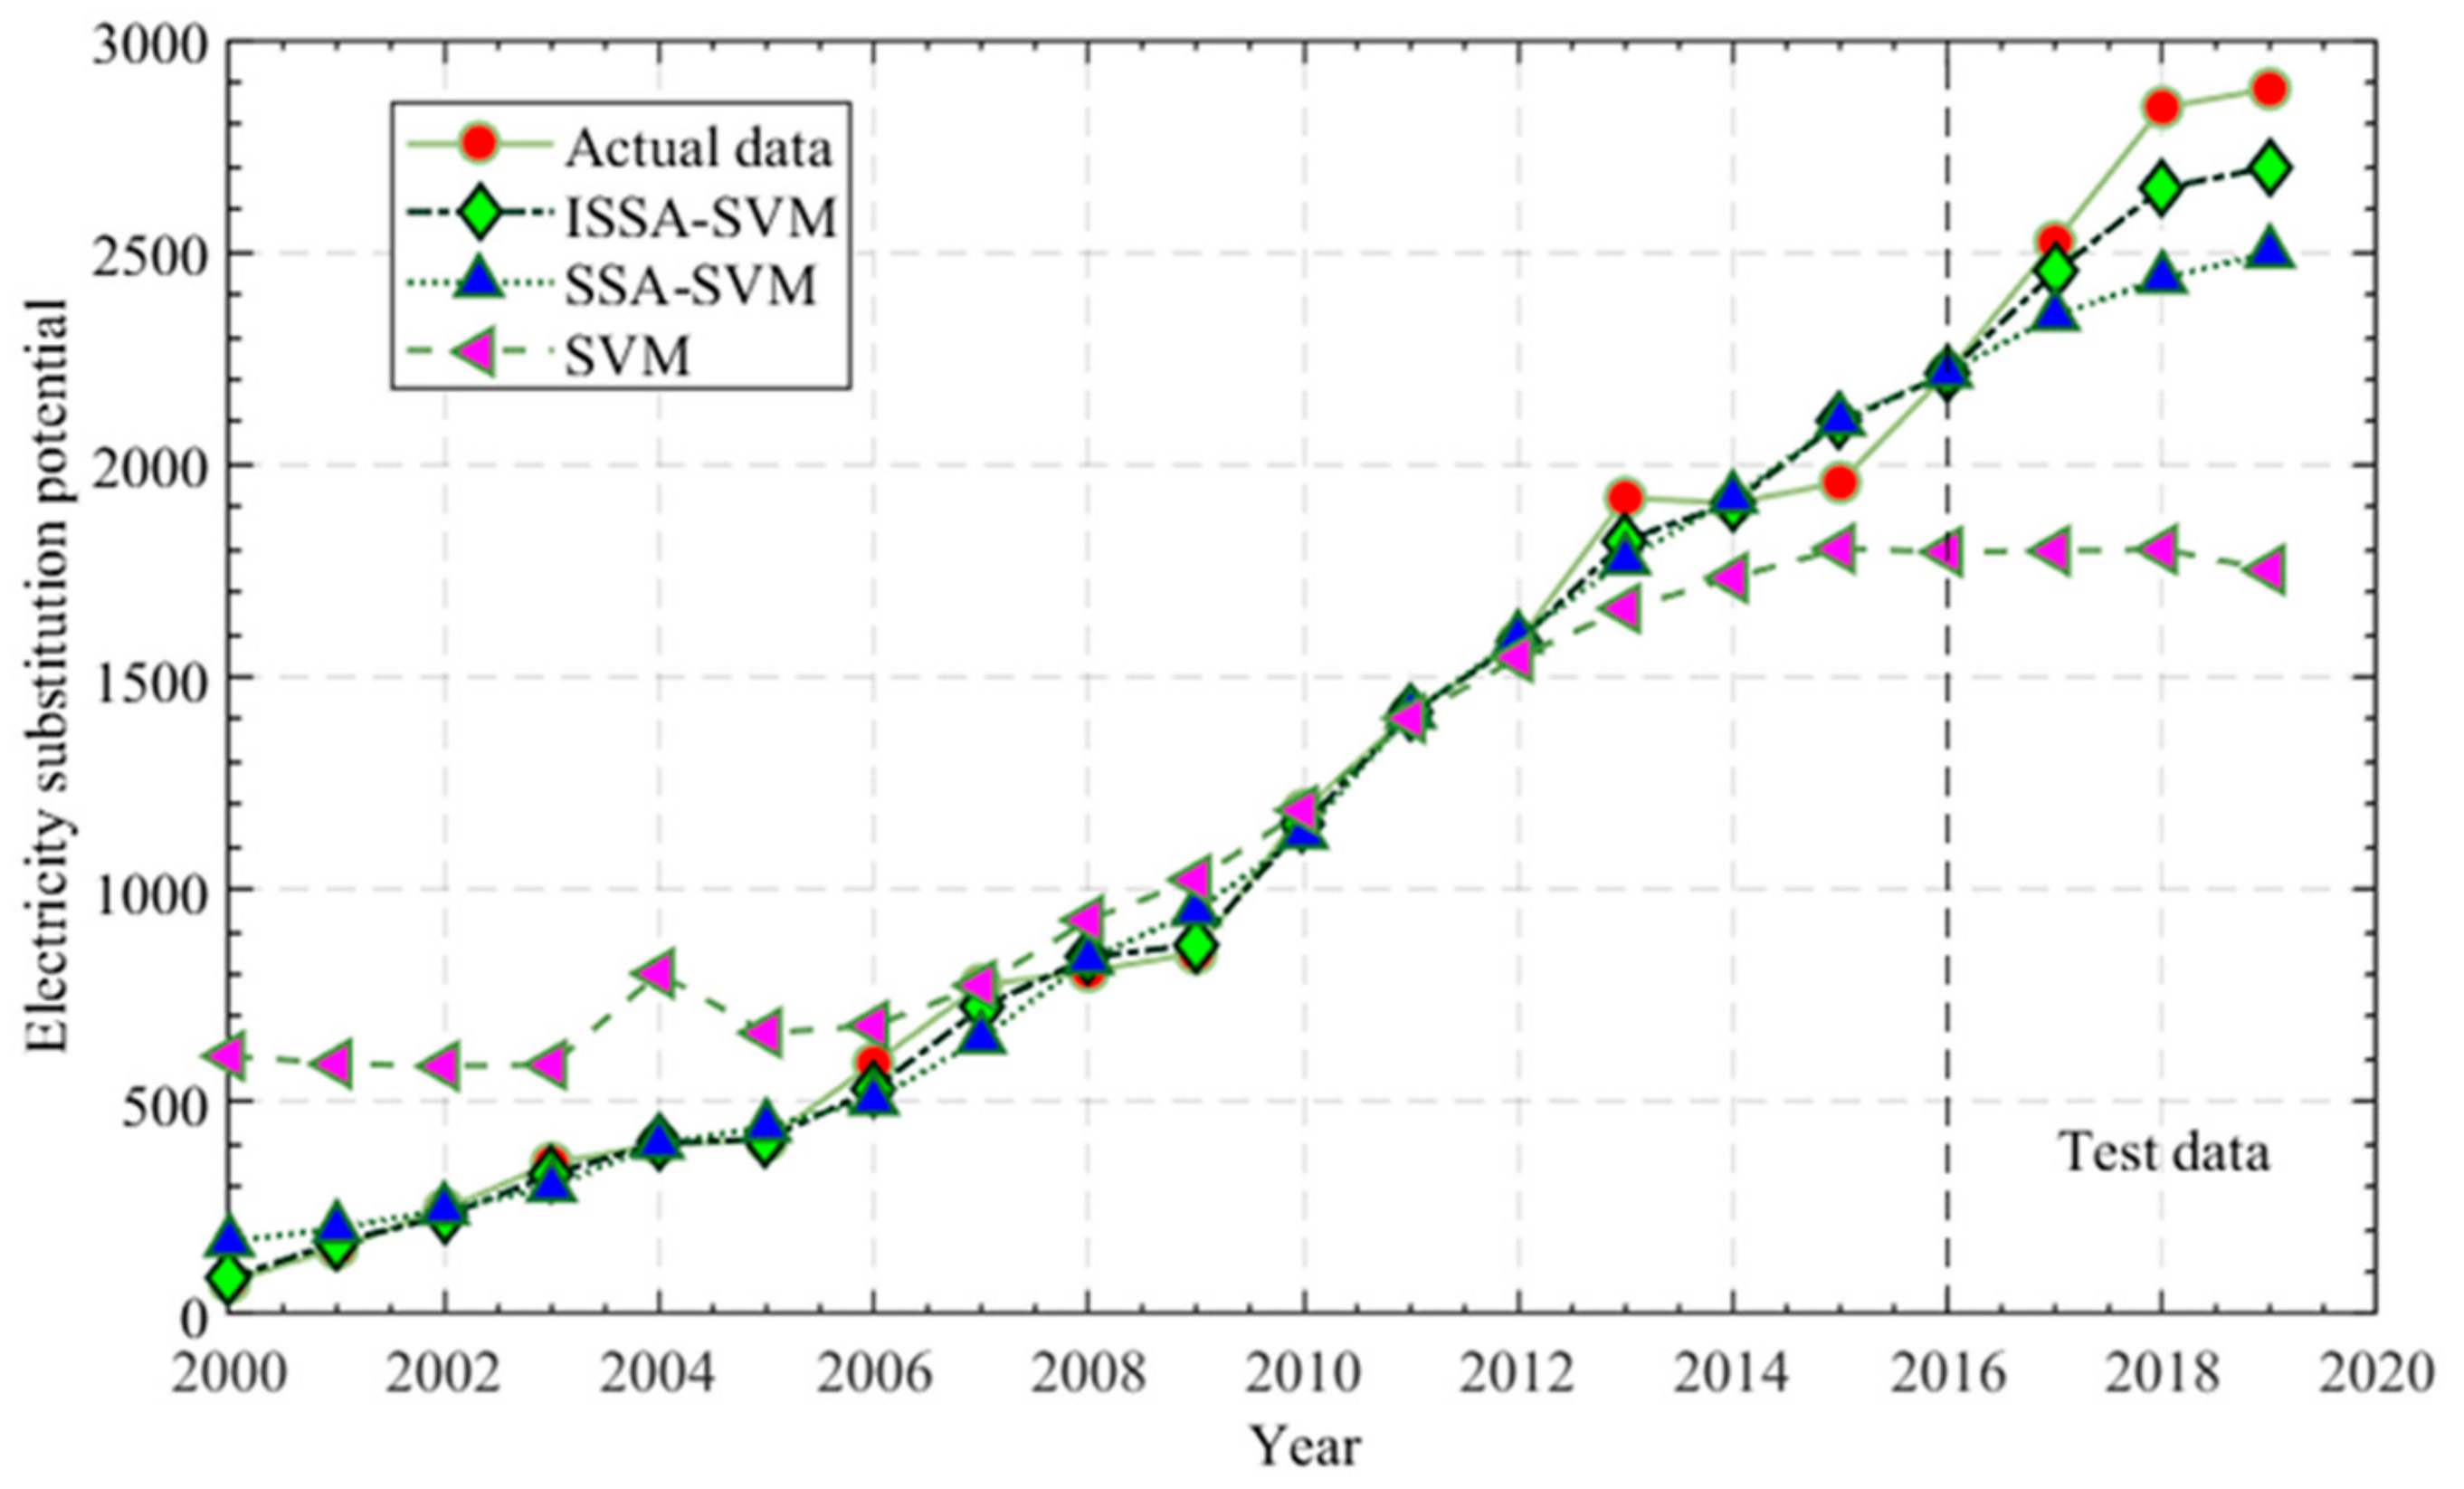
Further study of the model: Studying the reliability and applicability of the model, this paper introduces relevant data from another region of China as a further case study to predict the potential of electrical power substitution in Henan Province, using relevant electrical power substitution data from Henan Province as an example. The four model evaluation indicators mentioned above are still used here to compare the prediction ability of the model. The prediction results are shown in Figure 5 and Table 4; the relative errors of the test set are shown in Figure 6 and Table 5; the three model evaluation metrics are shown in Table 6; and the error pairs are shown in Figure 7.
Figure 5 shows that the predicted value curve obtained from the prediction results of the model proposed in this paper has the best fitting with the true value curve. In order to further verify the prediction ability of the model proposed in this paper, the evaluation index of relative error is introduced. Figure 6 also well reflects the relative error of the test sample, and it can be concluded that the relative error of the model proposed in this paper is smaller and has better prediction ability in the test set. From Table 5 and Figure 6, it can be concluded that the proposed model in this paper has the smallest relative error in all four test samples.
Further statistical analysis of the prediction results of the model can be performed in Table 4 and Table 6. First, the prediction ability of the model is evaluated from the RMSE, and it can be seen that the RMSE of the model proposed in this paper is 30.97, while the RMSE of the support vector machine without algorithmic optimization is 92.23, which proves that the intelligent algorithm proposed in this paper has the ability to optimize the model. Additionally, it is further found that the RMSE of the SVM optimized by the single sparrow search algorithm is found to be 60.96, which proves that the strategy of chaos mapping and chicken swarm optimization (CSO) used in this paper to optimize the sparrow search algorithm is effective. Similarly, the same conclusion can be obtained in the mean percentage error and the mean absolute error of the prediction model, in which the mean percentage error of the proposed multi-strategy hybrid improved sparrow search algorithm optimization model is improved by about 6 percent, compared with the single sparrow search algorithm optimization model. The proposed model has the best fitting effect. Using data from the two regions, Henan Province and Jiangsu Province in China, it is again demonstrated that the tent chaotic mapping, chicken swarm optimization (CSO), and Cauchy–Gaussian mutation strategy (CG) are effective in optimizing the sparrow search algorithm (SSA). This shows that the multi-algorithm hybrid strategy proposed in this paper is successful in predicting the electrical power substitution potential by SVM.
From Figure 5, it can be seen that all three models fit well in the training set. However, according to the fitting in the test set in Figure 6, the model proposed in this paper has best fitting in both predicted value and true value. Further analysis of the evaluation metrics of the model also leads to the conclusion that ISSA-SVM has better prediction ability. In summary, it can be concluded that optimizing Support Vector Machines through a combination of strategies of tent chaos mapping, chicken swarm optimization (CSO), Cauchy–Gaussian (CG), and sparrow search algorithm (SSA) is applicable in electrical power potential substitution.
6. Conclusions
The electrical power substitution development strategy is a critical way to achieve the carbon neutrality and carbon peak targets in China. Moreover, electrical power substitution is an important form of energy consumption structure transformation. The development strategy of electrical power substitution will also become a significant way to achieve sustainable green economy in China. Therefore, it is essential to study the potential of regional electrical power substitution development. The tent chaos mapping and chicken swarm optimization (CSO) with the Cauchy–Gaussian mutation improved the sparrow search algorithm optimized SVM, namely the is ISSA-SVM model proposed in this paper, which is used to predict and analyze the potential of electrical power substitution in two Chinese provinces. The relevant conclusions obtained are as follows:
- (1)
- From the perspectives of economic development, environmental constraints, technological progress, and policy support, the forecasting and analysis of electrical power substitution potential in Henan Province were carried out, and quantitative indexes are also given for the above four factors and electrical power substitution potential. The quantitative results show that the electrical power substitution potential of Jiangsu Province and Henan Province in China is increasing year by year, which is consistent with the trend of electrical power substitution strategy promotion.
- (2)
- A forecasting model of electrical power substitution potential is proposed; i.e., the sparrow search algorithm with tent chaos mapping and chicken swarm optimization (CSO) and Cauchy–Gaussian mutation optimization is introduced to optimize the SVM model. For the forecasting of electrical power substitution potential in two Chinese provinces, the data relevant to electrical power substitution potential in Jiangsu Province and Henan Province are used as examples, and both case studies show that the proposed model has improved in prediction accuracy and generalization ability. The mean percentage error (MAPE) of the proposed multi-strategy optimization model is reduced by about five percent compared with that of the single sparrow search algorithm, and the relative error (RE), mean absolute error (MAE), and root mean square error (RMSE) are reduced to different degrees. It can be concluded that the tent chaos mapping, chicken swarm optimization (CSO), and the Cauchy–Gaussian mutation strategy do improve the optimality finding of the sparrow search algorithm, showing that the multi-algorithm hybrid strategy proposed in this paper is successful in predicting the electrical power substitution potential by SVM.
- (3)
- It provides quantitative indicators of the factors influencing the potential for electrical power substitution and forecasts the potential. In addition, it provides theoretical support and a scientific decision-making basis for better guidance of the comprehensive promotion of electrical power substitution, which makes a contribution to the sustainable development of China.
Author Contributions
J.G.: Supervision, Project administration, and Funding Acquisition; W.M.: Methodology, Investigation, Writing—Original Draft, Writing—Review and Editing, Formal Analysis; Q.Y.: Visualization, Writing, and Data Curation. All authors have read and agreed to the published version of the manuscript.
Funding
Social Science Foundation of Hebei Province, China (Grant No. HB18GL021).
Institutional Review Board Statement
Not applicable.
Informed Consent Statement
Not applicable.
Data Availability Statement
The data presented in this study are openly available in https://data.stats.gov.cn/ (accessed on 25 December 2021).
Conflicts of Interest
The authors declare no conflict of interest.
Notations and Abbreviations
| CSO | Chicken Swarm Optimization |
| SSA | Sparrow Search Algorithm |
| CG | Cauchy–Gaussian Mutation |
| RMSE | Root mean square error |
| MAE | Mean absolute error |
| MAPE | Mean Absolute Percentage Error |
| r | Correlation coefficient |
| RE | Relative Error |
| SVM | Support vector machines |
| Tent | Tent chaos mapping |
| ISSA-SVM | Tent-CSO-CG-SSA-SVM |
References
- Lei, P.; Xiuhui, W.; Zhongfu, T.; Jing, W.; Chengfeng, L.; Weizheng, K. Feasible Electricity Price Calculation and Environmental Benefits Analysis of the Regional Nighttime Wind Power Utilization in Electric Heating in Beijing. J. Clean. Prod. 2019, 212, 1434–1445. [Google Scholar] [CrossRef]
- Cai, W.; Li, L.; Jia, S.; Conghu, L.; Jun, X.; Luoke, H. Task-Oriented Energy Benchmark of Machining Systems for Energy-Efficient Production. Int. J. Precis. Eng. Manuf. Green Technol. 2020, 7, 205–218. [Google Scholar] [CrossRef]
- Kumar-Verma, B.; Shirish, S. What Drives Successful Implementation of Pollution Prevention and Cleaner Technology Strategy? The Role of Innovative Capability. J. Environ. Manag. 2015, 155, 184–192. [Google Scholar] [CrossRef]
- Yanmei, L.; Zeng, C. Study on Regional Electric power Substitution Potential Evaluation Based on TOPSIS Method of Optimized Connection Degree. Power Syst. Technol. 2019, 43, 687–695. [Google Scholar]
- Ping, G.; Bin, Y. Application of Solid Energy Storage Heating Device in Electric Power Substitution. Power Demand Side Manag. 2016, 18, 34–36. [Google Scholar]
- Lin, L.; Rong, C.; Lei, F. Investigation of Boilers Energy Alternative Outside the Region of Nanjing Heating Supply. Power Demand Side Manag. 2010, 12, 47–49. [Google Scholar]
- Ming, L.; Diangang, H.; Youxue, Z. Research and Practice of Renewable Energy Local Consumption Mode in Gansu Province Based on “Double Alternative” Strategy. Power Syst. Technol. 2016, 40, 2991–2997. [Google Scholar]
- Dongli, C.; Yue, Y.; Zhixiang, L. Application and Efficiency Evaluation of Alternative Energy. J. Mod. Power Syst. Clean Energy 2011, 27, 30–34. [Google Scholar]
- Feng, Y.; Xiaozhong, X. A Short-Term Load Forecasting Model of Natural Gas Based on Optimized Genetic Algorithm and Improved BP Neural Network. Appl. Energy 2014, 134, 102–113. [Google Scholar] [CrossRef]
- Nan, L.; Yeyu, Z.; Caiyue, Z. Application of Support Vector Machine Method in Electric Load Forecasting. Power Syst. Technol. 2007, 31, 215–218. [Google Scholar]
- Yi, L.; Dongxiao, N.; Wei-Chiang, Hong. Short Term Load Forecasting Based on Feature Extraction and Improved General Regression Neural Network Model. Energy 2018, 166, 653–663. [Google Scholar]
- Ferlito, S.; Adinolfi, G.; Graditi, G. Comparative Analysis of Data-Driven Methods Online and Offline Trained to the Forecasting of Grid-Connected Photovoltaic Plant Production. Appl. Energy 2017, 205, 116–129. [Google Scholar] [CrossRef]
- Raju, K.; Madurai Elavarasan, R.; Mihet-Popa, L. An Assessment of Onshore and Offshore Wind Energy Potential in India Using Moth Flame Optimization. Energies 2020, 13, 3063. [Google Scholar]
- Yi, L.; Lee, T. Forecasting Energy Consumption Using a Grey Model Improved by Incorporating Genetic Programming. Energy Convers. Manag. 2011, 52, 147–152. [Google Scholar] [CrossRef]
- Kostmann, M.; Härdle, W.K. Forecasting in Blockchain-Based Local Energy Markets. Energies 2019, 12, 2718. [Google Scholar] [CrossRef] [Green Version]
- Yi, S.; Shuang, Z.; Baoguo, S.; Dexiang, J.; Fang, C. Analysis of Electric Power Alternative Potential Under Multi-Scenario. Power Syst. Technol. 2017, 41, 118–123. [Google Scholar]
- Baoguo, S.; Jia, Z.; Dexiang, J.; Fang, C.; Yi, S. Electric Power Substitution Potential Analysis Method Based on STIRPAT-Ridge regression. Distrib. Util. 2018, 35, 68–73. [Google Scholar]
- Yi, S.; Mo, S.; Baoguo, S.; Fang, C. Electric Power Substitution Potential Analysis Method Based on Particle Swarm Optimization Support Vector Machine. Power Syst. Technol. 2017, 41, 1767–1771. [Google Scholar]
- Changzu, L.; Dongxiao, N.; Xinyan, Z.; Bo, M. Zhejiang Province Electric Power Substitution Potential Prediction Model Based on Improved Particle Swarm Optimization BP Neural Network. Int. J. Eng. Sci. Technol. 2020, 20, 5173–5179. [Google Scholar]
- Wu, J.; Tan, Z.; De, G.; Pu, L.; Wang, K.; Tan, Q.; Ju, L. Multiple Scenarios Forecast of Electric Power Substitution Potential in China: From Perspective of Green and Sustainable Development. Processes 2019, 7, 584. [Google Scholar] [CrossRef] [Green Version]
- Guojing, L.; Jian, T.; Hu, L.; Xiaoyan, H.; Lei, Z. Forecast of Electric power Substitution Based on Logistic Model. EET 2018, 37, 39–43. [Google Scholar]
- Yujun, L.; Cheng, H.; Yi, H. Electric power Substitution Potential Prediction Based on Logistic Curve Fitting and Improved BP Neural Network Algorithm. Elektron. Elektrotech. 2019, 25, 18–24. [Google Scholar] [CrossRef]
- Li, M.-W.; Geng, J.; Wang, S.; Hong, W.-C. Hybrid Chaotic Quantum Bat Algorithm with SVR in Electric Load Forecasting. Energies 2017, 10, 2180. [Google Scholar] [CrossRef] [Green Version]
- Chenglong, Z.; Shifei, D. A Stochastic Configuration Network Based on Chaotic Sparrow Search Algorithm. Knowl Based Syst. 2021, 220, 106924. [Google Scholar] [CrossRef]
- Trull, O.; García-Díaz, J.C.; Troncoso, A. One-Day-Ahead Electricity Demand Forecasting in Holidays Using Discrete-Interval Moving Seasonalities. Energy 2021, 231, 120966. [Google Scholar] [CrossRef]
- Boqiang, L. Structural Changes, Efficiency Improvement and Electricity Demand Forecasting. J. Econ. Res. 2003, 05, 57–65. [Google Scholar]
- Yancang, L.; Muxuan, H.; Qnglin, G. Modified Whale Optimization Algorithm Based on Tent Chaotic Mapping and Its Application in Structural Optimization. KSCE J. Civ. Eng. 2020, 24, 3703–3713. [Google Scholar]
- Li, M.; Li, C.; Huang, Z.; Huang, J.; Wang, G.; Liu, P.X. Spiral-Based Chaotic Chicken Swarm Optimization Algorithm for Parameters Identification of Photovoltaic Models. Soft. Comput. 2021, 25, 12875–12898. [Google Scholar] [CrossRef]
- Yushan, Z.; Guiwu, H. An Analytical Framework for Runtime of a Class of Continuous Evolutionary Algorithms. Comput. Intell. Neurosci. 2015, 2015, 485215. [Google Scholar]
Figure 1.
Flow chart of electrical power substitution potential prediction model.

Figure 2.
Fitting effects of the three models in the case of Henan Province.

Figure 3.
The relative error in the case of Henan Province.

Figure 4.
Errors of three models in the case of Henan Province.

Figure 5.
Fitting effects of three the models in the case of Jiangsu province.

Figure 6.
Relative error in the case of Jiangsu province.

Figure 7.
Errors of three models in the case of Jiangsu Province.


Table 1.
Forecast results of electrical power substitution potential in the case of Henan province.
| Year | Actual Data | ISSA-SVM | SSA-SVM | SVM |
|---|---|---|---|---|
| 2000 | 76.30 | 84.42 | 171.07 | 608.46 |
| 2001 | 155.44 | 170.54 | 202.75 | 589.98 |
| 2002 | 246.48 | 230.12 | 246.09 | 584.55 |
| 2003 | 355.66 | 330.25 | 299.72 | 587.39 |
| 2004 | 401.35 | 402.99 | 401.76 | 802.31 |
| 2005 | 409.30 | 412.31 | 441.88 | 662.51 |
| 2006 | 590.94 | 530.45 | 504.19 | 679.70 |
| 2007 | 774.91 | 721.36 | 649.17 | 774.52 |
| 2008 | 807.77 | 840.31 | 835.69 | 927.85 |
| 2009 | 849.93 | 870.36 | 949.27 | 1023.15 |
| 2010 | 1185.80 | 1150.41 | 1130.43 | 1186.21 |
| 2011 | 1414.42 | 1415.42 | 1414.03 | 1402.46 |
| 2012 | 1582.65 | 1581.32 | 1591.80 | 1545.87 |
| 2013 | 1921.37 | 1821.31 | 1775.56 | 1661.06 |
| 2014 | 1908.90 | 1910.63 | 1920.41 | 1733.44 |
| 2015 | 1957.96 | 2100.14 | 2103.11 | 1801.85 |
| 2016 | 2215.35 | 2214.25 | 2215.76 | 1794.47 |
| 2017 | 2523.52 | 2453.41 | 2349.81 | 1796.93 |
| 2018 | 2840.47 | 2650.31 | 2438.29 | 1800.17 |
| 2019 | 2883.96 | 2699.89 | 2498.21 | 1752.16 |
Table 2.
Relative error of test sample in the case of Henan province.
| ISSA-SVM | SSA-SVM | SVM | |
|---|---|---|---|
| 1 | 0.049 | 0.018 | 23.454 |
| 2 | 2.857 | 7.392 | 40.435 |
| 3 | 7.175 | 16.494 | 57.789 |
| 4 | 6.8178 | 15.441 | 64.594 |
Table 3.
Evaluation indicators of different models in the case of Henan province.
| ISSA-SVM | SSA-SVM | SVM | |
|---|---|---|---|
| RMSE | 61.22 | 130.52 | 391.68 |
| r | 0.99 | 0.98 | 0.48 |
| MAE | 22.27 | 48.11 | 165.97 |
| MAPE | 4.62 | 9.84 | 46.57 |
Table 4.
Forecast results of electrical power substitution potential in the case of Jiangsu province.
Table 4.
Forecast results of electrical power substitution potential in the case of Jiangsu province.
| Year | Actual Data | ISSA-SVM | SSA-SVM | SVM |
|---|---|---|---|---|
| 2000 | 0.00 | 31.68 | 27.57 | 128.22 |
| 2001 | 49.38 | 49.78 | 49.78 | 115.68 |
| 2002 | 99.53 | 37.85 | 38.35 | 99.93 |
| 2003 | 80.37 | 38.26 | 39.10 | 82.54 |
| 2004 | 5.61 | 6.01 | 6.01 | 199.45 |
| 2005 | 25.98 | 26.38 | 26.38 | 98.93 |
| 2006 | 51.10 | 79.36 | 88.48 | 97.68 |
| 2007 | 190.66 | 180.11 | 190.26 | 191.06 |
| 2008 | 249.48 | 249.88 | 249.88 | 304.73 |
| 2009 | 290.22 | 399.27 | 416.82 | 430.75 |
| 2010 | 633.57 | 579.83 | 590.06 | 537.06 |
| 2011 | 803.75 | 803.35 | 803.35 | 695.61 |
| 2012 | 850.23 | 822.78 | 817.26 | 778.08 |
| 2013 | 912.55 | 860.10 | 865.90 | 838.83 |
| 2014 | 843.61 | 888.52 | 882.87 | 843.21 |
| 2015 | 853.20 | 857.35 | 853.60 | 829.77 |
| 2016 | 965.02 | 965.42 | 940.42 | 793.29 |
| 2017 | 1156.62 | 1157.02 | 1138.22 | 741.08 |
| 2018 | 1363.55 | 1241.36 | 1183.92 | 757.97 |
| 2019 | 1342.10 | 1276.86 | 1139.32 | 690.21 |
Table 5.
Relative error of the test sample in the case of Jiangsu province.
| ISSA-SVM | SSA-SVM | SVM | |
|---|---|---|---|
| 1 | 0.271 | 2.619 | 21.647 |
| 2 | 0.819 | 1.616 | 56.072 |
| 3 | 7.135 | 15.172 | 79.894 |
| 4 | 13.128 | 17.798 | 94.448 |
Table 6.
Evaluation indexes of different models in the case of Jiangsu province.
| ISSA-SVM | SSA-SVM | SVM | |
|---|---|---|---|
| RMSE | 30.97 | 60.96 | 92.23 |
| r | 0.97 | 0.91 | 0.74 |
| MAE | 9.41 | 21.27 | 92.23 |
| MAPE | 3.76 | 9.31 | 60.31 |
Publisher’s Note: MDPI stays neutral with regard to jurisdictional claims in published maps and institutional affiliations. |
© 2022 by the authors. Licensee MDPI, Basel, Switzerland. This article is an open access article distributed under the terms and conditions of the Creative Commons Attribution (CC BY) license (https://creativecommons.org/licenses/by/4.0/).
Share and Cite
MDPI and ACS Style
Geng, J.; Meng, W.; Yang, Q. Electricity Substitution Potential Prediction Based on Tent-CSO-CG-SSA-Improved SVM—A Case Study of China. Sustainability 2022, 14, 853. https://0-doi-org.brum.beds.ac.uk/10.3390/su14020853
AMA Style
Geng J, Meng W, Yang Q. Electricity Substitution Potential Prediction Based on Tent-CSO-CG-SSA-Improved SVM—A Case Study of China. Sustainability. 2022; 14(2):853. https://0-doi-org.brum.beds.ac.uk/10.3390/su14020853
Chicago/Turabian StyleGeng, Jinqiang, Weigao Meng, and Qiaoran Yang. 2022. "Electricity Substitution Potential Prediction Based on Tent-CSO-CG-SSA-Improved SVM—A Case Study of China" Sustainability 14, no. 2: 853. https://0-doi-org.brum.beds.ac.uk/10.3390/su14020853
Note that from the first issue of 2016, this journal uses article numbers instead of page numbers. See further details here.