
Dynamic Flood Resilience Typology: A Systemic Transitional Adaptation from Peitou Plateau, Taiwan


Department of Architecture, Tamkang University, New Taipei City 251301, Taiwan
Sustainability 2022, 14(2), 875; https://0-doi-org.brum.beds.ac.uk/10.3390/su14020875
Submission received: 27 November 2021
/
Revised: 27 December 2021
/
Accepted: 2 January 2022
/
Published: 13 January 2022
(This article belongs to the Topic Climate Change and Environmental Sustainability)
Abstract
:Resilience practice is a place-based activity. This study incorporates the notion of “Transitional Progress” as an available scoping tool pin-pointing the human-habitat domain; the critical human resilience build-up can be identified by the site-specific and locally adapted practice as the residents’ perception and interaction within the local geographical character are examined. The assessment framework is proposed as a measurable process, followed by an adaptive cycle valuation performed for each of the scales at the different transitional stages. This resilience varies from the degree and time exposed to flood and the resident’s respective responses regarding people, community, and place; accordingly, the semi-structured interview documented respondents’ self-evaluation from the Peitou Plateau in Taipei. The study ascertained that in the face of climate risks: (1) adaptive measures aided and enhanced the information gathered for risk impact is based on the residents’ perception of the habitat and human domain (2) adaptive capacity assessment is an effective mean in understanding residents’ mitigation will and confidence, and (3) community ability to reflect on past actual time scenario. Most importantly, the assessment framework contributes to understanding local adaptation practice and contributes toward the sustainability of the urbanity.
1. Introduction
The reality of climate change is frequently associated with extremely rapid onset events impacting the urban system [1]. Events like flooding damage nature and habitat, including communities and ecosystems; ultimately, this presents an urgent and fundamental challenge to cities [2,3]. Examined holistically, flood mitigation frequently involves an adaptation build-up or enablement process in natural or human systems, this is a response to actual or expected climatic stimuli or impact effects like damages or even beneficial opportunities [4,5,6]. Therefore, urban flood risk necessitates an adaptation system and mitigation strategy as the rapidly growing uncertainty obligates dynamic responses from a multitude of risks’ shocks or stresses. While withstanding flooding, elements within the resilience capital of community, place, and people undergo transitional changes. This adaptive capacity is bounded by the socioeconomic aspects, climate characteristics, built environment, and capacity learning processes, mainly through a dynamic transitional sequence [3,7,8,9,10].
There is no one-size-fits-all resilience measure, and nor should there be [11]. Therefore, there is no general measurement framework for disaster resilience that has been empirically verified [12,13]. Resilience was first introduced in the field of ecology by Holling as a “measure of the persistence of systems and of their ability to absorb change and disturbance and nevertheless maintain the same relationships between populations or state variables” [14]. However, assessing the local responses to flood information and mitigation approaches are unlikely to reflect or justify the local-based casual factors (physical characteristics, location); nor the social, cultural, and psychological attributes (cognitive and affective) that influence flood warning response [15,16,17]. Substantial differences exist at the national versus local scale for disaster resilience and measurement method; the accurate assessment, then, becomes even more challenging. Schipper and Langston [18] reviewed 17 sets of indicators from the household to the national level, attempting to evaluate holistically the resilience level. To substantiate the assessment scope, the Flood Resilience Measurement for Communities (the FRMC) [19] framework provide a highly generalized approach to features for improving disaster resilience; while the Sustainable Livelihoods (SL) framework developed in the nineties [20] emphasizes community assets and capacities in the social, human, physical, financial and natural capital; other assessment tools like the Zurich Alliance community flood resilience measurement framework attempts to examine the community’s resilience holistically [18,19,21,22,23].
Historically, the ‘drained city’ model has been adopted by many cities, as an infrastructure add-on strategy to cope with possible flooding events [24]. However, assuming cities infrastructures could be designed to withstand certain climate shocks and stresses, residents still need to acquire the adaptive capacity to accommodate these risks; these can be accomplished through their decision-making and action-based process. Communities that acquire and exhibit such capacity could be deemed resilient. With recent recognition on the critical human resilience build-up, the emphasis is on the site-specific and locally adapted practice; it incorporates residents’ perception and local geographical character, establishing a socially inclusive, resilient, economically prosperous, and energy-efficient urbanity with a place-based perspective to resilience [3,19,25,26,27]. This is in support of the argument that flood risk receptions and adaptation process shift status and reallocate incessantly; at no time can the status be at a homogenous state.
Therefore, acknowledging the shift of resilience state is a constant condition, we focus on the evaluation of the community’s awareness, place-based actions, or people’s responsiveness within the system as it changes through time. The system depends on the increase or decrease in the coping mechanism or adaptive capacity; the cross-scale linkages affect the progress of the human or habitat criteria influencing the overall dynamics of the system. This study proposes a “transitional” thinking framework that assesses the system as it accommodates the occurrence of climate events; the system is triggered by flooding that causes changes manifested through shock or stress within the human-habitat system. The evaluation of empirical evidence in the dynamic shift of the resilience capacity within the human-habitat domain is in a state of critical gaps in the field; assessment should integrate and analyze the present conditions, specifically the residents’ perception and the capacity to mitigate the flood risks. The aim is to determine the resilience ability as it bounces forth as determined by the interacting parts; the transitioning between states in the event of a flood disturbance to maintain functionality within the human-habitat domain.
This paper integrates the learned evidence and practice measures using the case study site of Peitou Plateau, Taipei, as it is ranked as one of the cities most prone to nature risks [28]; the research aimed to shed light on the question of flood events induced adaptive capacity based on individual and collective actions beyond the obligatory or expected statutes. The first part discusses the semi-structured interview with residents on their perception and practices toward flood risks. Empirically, the perception is based on the cognitive experience acquired from previous events; effectively, this is a gathering of local practice and measure. To conclude, we argue that by weighing on (1) adaptive measures aided and enhanced with a visualization model, as we gather the perception forming process; (2) information gathered for risk impact assessment differences among the residents; (3) the adaptive capacity could be increased by the effective learning tool, and (4) adaptive capacity phases reflecting actual time scenarios that the stakeholders evaluate is an effective mean of mitigating flood risks. These perceptions are typically based in a unique way to factor in the decision-making in the human/habitat dimension. The concluding section summarizes the insights of this study and calls for refinement and innovation in the build-up measures to consolidate the urban system to sustain its coherence.
2. Materials and Methods
2.1. Flood Resilience Adaptive Cycle-Criteria and Means
The adaptive cycle and its extension often can be utilized to grasp the adaptive scope and gauge flood resilience as the transitional process at a neighborhood level. Identifying the transitional stages enables a better understanding of the long-term dynamics of flood resilience [29,30]; the concept of “Panarchy” supposes that with each cyclical transition, the system acquires a resilience capacity, regardless of whether the transition continues or not. During the transition, either a finite-dimensional change or a bottom-up or top-down chain effect occurs, oscillating within the adaptive cycle. The change could vary dimensionally, depending on the scale shift within the temporal axial evaluation. In this study, we applied the adaptive cycle concept to the flood resilience build-up a community acquires through each flood event.
Taking the “Panarchy” thinking as a base, the interactions between the adaptive cycles at the different scales during the resilience build-up process acknowledges community learning in the context of adaptive management and adaptability (or adaptive capacity). [30]. Flood resilience represents a cumulative activity built over time via a variety of interactions, decisions, and interventions as customarily takes place within a system such as a community [31]. Essentially, the flood adaptive capacity exemplifies the ability to reduce the vulnerability of the community exposed to flood risk; by raising risk perceptions of developing responsive capacity for a changing climate. We underscore that people’s judgments on risk are influenced by the ease with which relevant events come to mind [19,32]. Experiences of an extreme flood event might make climate risk more cognitively available or salient in people’s minds.
By implementing a nested adaptive cycle with bi-directional cross-scale feedbacks, we essentially defined within the “Panarchy” thinking an “Adaptive cycle” transitioning endogenously; it generates dynamic flow in complex adaptive systems. The internal processes of self-organization and evolution over time are observed [29], as the complex systems of human and habitat dynamically interact and gather within and across scales of space and time, these bi-indicators of people and environment constitute a tiered structured framework with cross-scale responses termed the ‘panarchy cycle’ [7].
The representation of a cyclical process demonstrates the systemic shift defined by the complex interlocking of the elements (people, place, and community); the systems approach is used to understand ecosystem dynamics and to emphasize the hierarchical structuring [33]. The interlocking process is dependent on the flood events variables or relationships that mediate the influence of external variability [7]. The flood resilience capital builds up or down, dependent on flood activity through time (place or environment), people, and the community (individual or collective human interaction). This is in contrast to “hardware” or engineering-based additive in-situs response by technological and infrastructural elements; the concept of dynamic adaptation encourages resilience learning toward the improvement of local adaptive capacity. The system includes people, place, and community; it must undergo transitional changes in the “Panarchy” cycle.
2.2. A Transitional Adaptation Process
The adaptive capacity appropriation transitions through a crossed-ranged spatial-temporal scale. At each disturbance of scale domain within the system, it results in complex systems with multiple and nested domains of scales at distinct phases of the adaptive cycle; it is often separated by orders of magnitude [29,33]. Initially, the cycle can assume to be in a stable condition, which is the stability phase prior to any flood disturbances; the resilience capital remains negative (“-”), and there is no gain in adaptive capacity. Once flooding hits the community, the shock triggers the transition into the system transition phase (ST), generating a resilience capacity build-up. The community, place, and people acquire knowledge and skill; it establishes a stable network, and the system transitions into the innovation phase (R); the community acquires a strengthened awareness and adds the reinforcement to cope with and mitigate floods. This is necessary to attain robust growth in resilience. Lastly, the system calms down and arrives at the diversification phase (G); the cycle comes to a completion, and the transitions lead toward a resilience capacity that could be diminished if the community, people, and place resist acquiring additional ability; on the other hand, the capacity may increase if the system holistically retains the awareness and remains responsive. Therefore, adaptive capacity tends to oscillate between positive and negative scales and vice versa. Within a neighborhood, we propose the model below, based on the Panarchy thinking (Figure 1):
The process of system transition occurs in magnitudes, with criteria ranging from invisible changes to fluctuations in the interaction between sectors. In a way, the adaptability of the urban system within the habitat dimension (place-based environment) undergoes a transitional transformation; this could be gauged as adaptive or merely coping. The human domain changes with each flood. The human dimension changes are manifested in the responsive process of people (individual) or community (collective) changes. The mitigation affects the cumulative learning capacity and the visible change (knowledge), response (skill), and preparation (network) build-up within the community. Criteria range from being resistant, aware, or able to accumulate robust capacity. Hence, allowing flexibility in the cycle allows for robustness in the learning process. Adaptation acquires necessary channels delineating the changes, tracing the resilient versus transformational characteristics as well as those that are connected within the community [34].
The phases interface is not sequential or fixed, and systems function in a series of adaptive cycles, in an interacting or overlapping manner. During collective decision-making, the continuous shock process and mitigation actions constitute the source of knowledge build-up, which leads to acquiring skills for sharing with the community. Key variables within systems are distributed endogenously. The flood resilience self-organizing interactions and processes within the community are compartmentalized by scales within the system [7,35]. If the change’s characteristic is spatially fixed, the analysis focuses on the structural change; otherwise, the change is within its scale, reflecting the structuring of the scale within the system due to the change in process transition. The stability phase (S) accentuates the reorganization process evolving within the corresponding quadrant; the same applies for each of the other three phases, mainly, system transition (ST), innovation (I), and system transition (ST).
Assuming systemic structure has not changed, the community develops the resilience capacity and undergoes scale and structure (quadrant) changes. The collective decision-making, cooperative behavior, and planning and governance process to adapt require: (1) extensive access to information and knowledge networks; (2) available climate learning tools that could fortify the resilience into people’s livelihoods; (3) supporting institutions and community ecosystem that could provide the base to facilitate learning, information exchange, reflection, innovation, and anticipation; all of these are critical criteria which remain key elements in the practical reality of the adaptation process. The sense of awareness or identification of such risks is given a numerical value to represent low, medium, and high levels with values from 1 to 3. The numerical values correspond to the human-habitat domain; it reflects the ability of people, community, and place in coping and transition through the processional change in the urban system. The indicators comprised of identification, prioritization, design, and implementation of the capacity in the different phases.
2.3. The Proposed Adaptive Capacity Assessment Framework
This study proposed a two-tier assessment framework. The human-habitat domain-criteria was assessed, then the “Panarchy” change and phasing within the people, community, and place was measured. Additionally, mobilization of the communities and their prioritized adaptation as well as flood mitigation ability [3,35,36,37,38]; albeit through a differentiated capacity level manifested by each resident’s action. The learning, anticipation, and forecasting made through the community’s knowledge sharing, and response are beneficial towards capacity build-up. Hence, being adaptive means possessing the ability to learn from mistakes, to generate the experience of dealing with change, and the capability for innovation [36,39,40]. The assessment included a two-step process to evaluate the habitat-human domain first, then engage in the transitional phasing to determine the resilience state. The adaptive process within the habitat-human domain criteria state was decomposed to emphasize the resident’s flexibility; the need for continuous monitoring and adjusting of the adaptation action as circumstances change was also taken into consideration [41,42].
The adaptive or flexibility level is necessary for the mitigation of flood resilience; manifested through visible change, response, and preparation build-up. A typology of networks in the context of resilience: those that facilitate the flow of resources and ideas and those that facilitate connections among people. The flow of resources and ideas is beneficial in acquiring the necessary knowledge and skills while the facilitation of connections allows a network to be strengthened in the community [43,44]. Residents’ adaptive capacity was measured in two folds (Table 1): by the degradation in the habitat through environment/climate risks (Rht = damage levels in building, environment, infrastructure, and floods); and the human’s resilience that investigates the capacity level (Rhu = information, responsive process, learning, and social structure change). The people/community factor corresponds to an individual or collective evaluation in knowledge; while the place factor corresponds to degradation in the habitat through assessment of building, environment, flood event, and infrastructure of a given community as shown in Table 1:
The communities’ ability to cope and adapt to stresses underlines both the in-situs environmental sensitivity and human adaptability. As the transition is further categorized through impact, action, or mediation-based effect, the accumulation in learning attainment is valued most crucially in the transitional process. How residents acquire the necessary know-how and means to mitigate floods was accentuated in this indicator evaluation. Learning magnitude varies according to the flooding event. If the shock impact from the flood event is greater than previous ones, then the current learning structure must be reconfigured. This is deemed post-impact learning. Within the ‘Human’ domain, people and community generate and disseminate knowledge, continuing the learning cycle by identification, prioritization, design, and implementation of flood resilience. People are strongly stimulated to act about risk when presented with information about the actions they could take; the process flow entails the identification of the risks affecting the urban centers. For the indicators, each was assigned as either possessing (numerical value 1) or not (numerical value 0). In the ‘Habitat’ domain, criteria measured the ability to mobilize when threatened, to contain losses and recover in a timely manner, and the ability to withstand a shock was measured for the total resilience. Post-disturbance recovery was determined, in part, by remnant components, or the types and forms of ‘resilience capital’ that were not destroyed by a disturbance process of resilient adaptive capacity [5,7,45].
Continuous measure planning, experimentation, and solution-based management support can lead to post-impact learning. Other learning methods are transformational learning; stressing the learning along the way and emphasizing how the system behaves during the cross-scale flood event or the solutions that emerged from the mitigation. In these cases, learning involves rectifying problems identified or problem domains among sets of difficult and complex variable problem domains (habitat and human) that have been solved [45]; this includes restoring the state or solution benefiting all parties involved (people, place, and community). Once the modification or break of established habits takes place, it is deemed as a change; this is followed by the proper response which leads to capacity building in information analysis, learning methods, and social structural shift.
Table 2 identifies the changes in adaptive capacity in phases. It documents the key attributes from the current cycle state, examining the criteria involved and how it triggers the transitioning function change. In terms of the adaptive capacity phase, we proposed the four phases as follows:
1. Diversification phase (D); characterized by the rapid accumulation of resources (capital) within the human-habitat domain, the rising levels of place, people’s diversity, and connections with high but decreasing resilience within the community.
2. Innovation phase (I); the time of innovation, restructuring, and greatest uncertainty within the human-habitat domain, however, with high resilience. A high level of place, people, and community capacity characterize it.
3. Stability phase (S); the slowing-down growth phase as resources are stored and used for system maintenance within the human-habitat domain. This is characterized by stability, reduced flexibility, and low resilience value of place, people, and community capacity.
4. System transition phase (ST); characterized by the chaotic collapse and release and accumulated capital within the human-habitat domain. This phase is characterized by a rising level of place, people’s diversity, and connections but low in the place’s capacity. We argue that the mutual understanding and ability to identify the risks as one prepares to act is imperative toward the adaptive capacity of the community.
The means were examined to evaluate the cycle scale change from the shock coping process to stress adaptive capacity; the table shows the transitional framework below.

Table 2.
The continuous transitional resilience adaptive capacity framework.
| Panarchy StatePanarchy State | Cycle State | Criteria | Means | Cycle Scale Change | |
|---|---|---|---|---|---|
| Panarchy Phases | Characteristic | Phasing Trigger | People, Place and Community Action Evaluation | Adaptability & Resilience Change | |
| Diversification phase (D) | Habitat and human domain with rising level of diversity and connections with high but decreasing resilience value. | 1.People and community (Human domain) Diversification +. 2. Place (Habitat domain): Habitat + climate risks + | 1. People- (+) Information understanding Responsive process Learning tools 2. Place-(+) buildings, environment, roads 3. Community- (-) Social structure | Rht Rhu = (+ -) People = + Community = (-) Place = (+) | |
| Innovation phase (I) | Habitat and human domain in time of innovation, restructuring and greatest uncertainty but with high resilience value. | 1. People and community (Human domain) Innovation + 2. Place (Habitat domain: Habitat + climate risks + | 1. People-(+) Information understanding Responsive process Learning tools 2. Place-(+) buildings, environment, roads 3. Community- (+) Social structure | Rht Rhu = (+) People = + Community = + Place = + | |
| Stability phase (S) | Habitat and human domain in slow down stage; resources are stored and used largely for system maintenance with reduced flexibility & low resilience value. | 1. People and community (Human domain) Stability - + 2. Place (Habitat domain) Habitat - climate risks + | 1. People-(-) Information understanding Responsive process Learning tools 2. Place-(-) buildings, environment, roads 3. Community- (-) Social structure | Rht Rhu =(-) People = (-) Community = (-) Place = (-) | |
| System Transition phase (ST) | Habitat and human domain in transitional collapse and release; there is accumulated capital as resilience is low but increasing in value. | 1. People and community (Human domain) System transition + 2. Place (Habitat domain) Habitat +- climate risks + | 1. People-(+) Information understanding Responsive process Learning tools 2. Place-(-) buildings, environment, roads 3. Community-(+) Social structure | R = (- +) People = + Community = + Place = - | |
“-” means a decrease in resilience; “+” means an increase in resilience; “+ or -” means either an increase or decrease in resilience.
The capacity-building process was considered in connection with the decision-making process [46]. The two cornerstones were marked on how communities prepare for flood risk: Either through anticipating the forthcoming flood event or the impact upon the occurrence. Both components generally rely on experience or the history of natural disasters. Since people and community are active receptors of obtainable information in mitigation, they are necessary ‘initiators and creators of alternative schemes; rather than be expected to be mere receptors of experts’ plans [7,45] toward the appropriate responses as the indicators of such capacity. Forms of social learning arise following natural disasters and other ecological events [45]. The community adaptive capacity assessment measurement was calculated as below:
where:
TR = (Rht) + (Rhu)
TR = Total resilience to assess the resilience transitional phasing.
Rht = Habitat domain resilience (Place).
Rhu = Human domain resilience (People) and (Community)
- people as individuals.
- community as people in a collective assessment
The assessment phasing deems the transitional process accordingly. The transitional phasing of diversification (D), innovation (I), stability (S), and system transition (ST) could be categorized as follows:
- Diversification: TR= Rht Rhu = (+ -); People = + or -. Community = -, Place = +
- Innovation: TR= Rht Rhu = (++); People = +, Community = +, Place = +
- Stability: TR= Rht Rhu = (- -); People = -, Community = -, Place = -
- System Transition: TR= Rht Rhu = (- +); People = +, Community = +, Place = -
For the phasing, the sign “-” means a decrease in resilience; “+” means an increase in resilience; “+ or -” means either an increase or decrease in resilience. The system transition in the stress adaptive capacity takes the habitat domain and human domain as the basis to evaluate the total resilience in the given community. The measure was as follows:
Flood Resilience System Transition: The indicator of skill, knowledge, and network was further divided into the ability to identify information, learning tools, and support from the social structure. The process required active participation in listening, understanding, learning, and acting to mitigate efficiently as the community transits or adapts in phases. The identification of the urban system’s adaptive capacity phase of diversification (growth), innovation (reorganization), stability (conservation), and system transition was categorized according to the sum of the skills, knowledge, and network indicators. The numerical values assigned were Skill (+1 to +3), Knowledge (+1 to +3), and Network (+1 to +3). To fully explore the possibility of capacity robustness, it was ascertained that flexibility and innovation are necessary for the mitigation or adaptation to climate change. As such, the diversification to system transition phases were analyzed for best-fit scenarios with the highest resilience.
2.4. Semi-Structured Interview
To explore the multitude of ways in which urban communities acquire flood adaptive capacity and resilience, the criteria and means must be analyzed, and their aspects noted. We conducted the assessment abiding by the humanistic geography, taking a qualitative valuation based on the semi-structured interview to determine how a symbiotic coproduction of spaces, places, and people affects the adaptive capacity; the interviews assessed the relationship in which resilience knowledge is produced and shaped by place-based environmental and locational traits. The assessment gave a numerical quantifier of each attribute relevant to the formation of flood resilience (Table 3).
Taking the participant observation stand, the semi-structured interview process relied on local focus groups to allow the conversations to progress flexibly to the issues and concerns raised by the interviewee. The interviewer became a subjective participant and an objective observer. The interviews were conducted face-to-face and measured the occurrence of clearly defined direct physical impacts on flooding and the self-evaluation post-flood experience. Perceptions of surroundings differed from individuals depending on upbringing, perceptual experience, and epistemological systems [3,45], from which subjective environmental images were constructed. These differences could not be evaluated using physical geographical data. The cumulative result from the interactions of residents and their vulnerability were measured as the derivative to the direct environmental impact on people; in turn, it measured the adaptive capacity of residents in responding to environmental impacts [6].
Their inextricable blend of the face and feeling, reason and gut reaction, cognition, and intuition [45,47] were investigated to determine the human adaptive capacity based on human perception of environmental risks. The realistic preferences, values, attitudes, behaviors, and decision-making process regarding the habitat differed based on the subjective environmental image. By analyzing residents’ risk perception, we could explore the influence of local culture, experiences, and environments on people [7,11,45]. It is highlighted that studies that use more than one method require fewer participants, as to undertake studies that use multiple (very in-depth) interviews with similar participant [43,45]. Key stakeholders can tell a “story” about environmental impacts and responses in collaboration with researchers [3,43]. In this manner, we could recognize residents’ experiences in a progression and facilitate direct dialogue with residents.
The goal was to explore how risk events interact locally with the environment and social processes [3] in stages; beginning with stage 1, where the interviewer indicated and described the potential climate scenarios and the increase in flood risk. If the respondent’s answer was confident, then, the questions on stage 2 would be proposed to solicit specific answers from the interviewees. Stage 3 was to self-assess residents’ capacity robustness. With each stage, we focused on positive or negative answers and differentiated positive or negative reactions toward the questions. With the aid of a visualized diagram introduced during the interview, the key questions in the semi-structured interview followed the format below.
3. Results
3.1. Assessement Site: Peitou Plateau, Taiwan
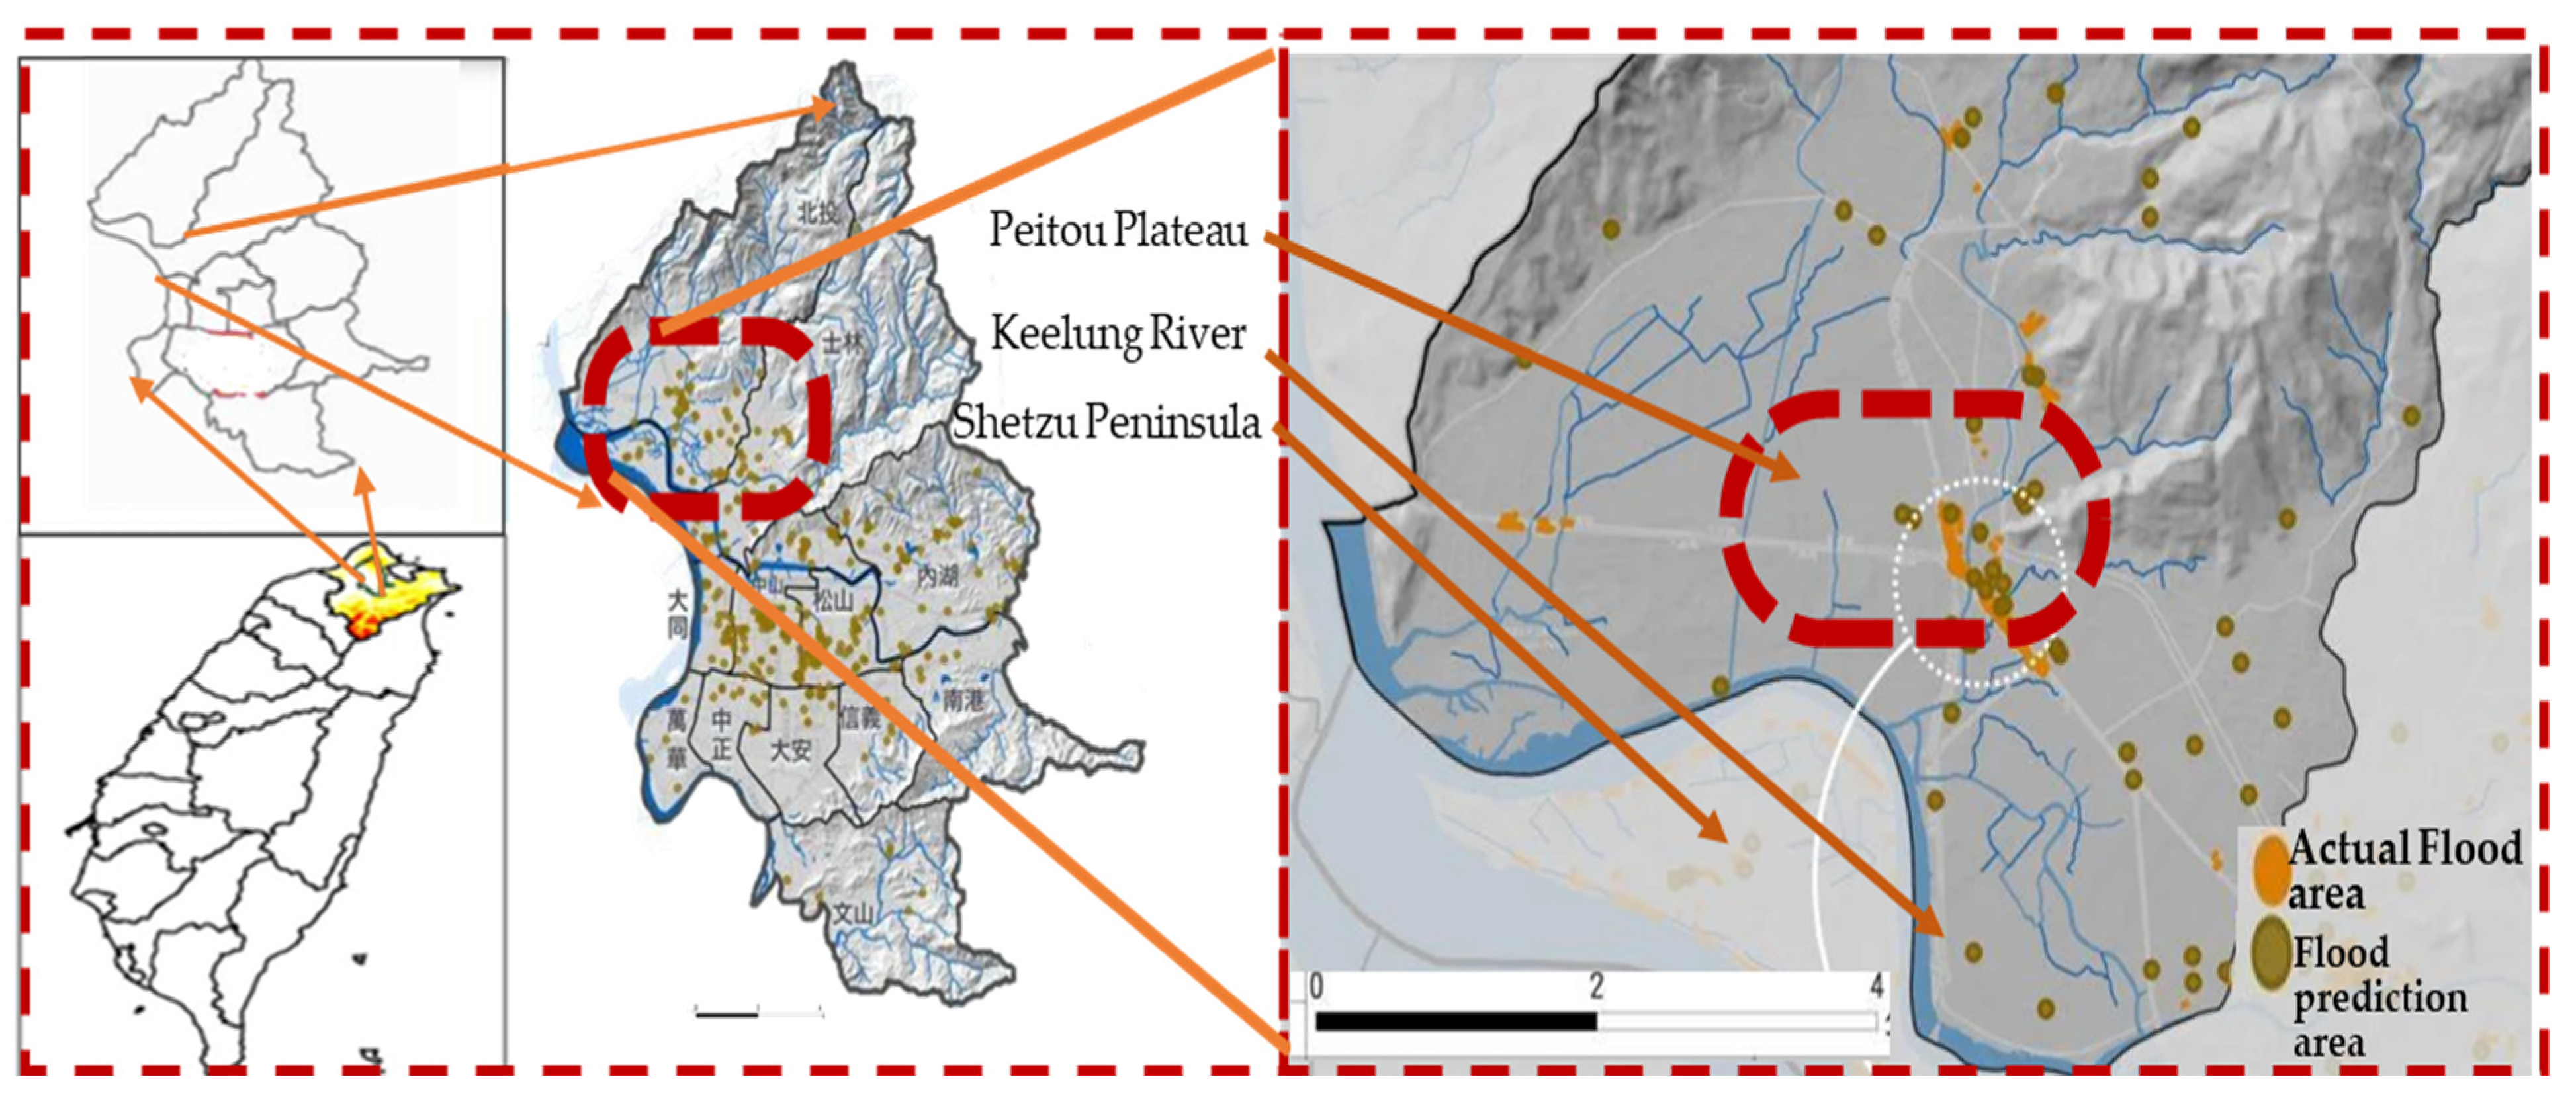
Peitou Plateau is located on the flat southern tip of Peitou District, which is the furthest north of the 12 administrative districts of Taipei City; the plateau is up north of Shetzu Peninsula and at the riverbank of Keelung River (Figure 2). Since Taipei City has a basin-like geographic feature surrounded by mountains on all sides except for the rivers extending in an east-west direction at the northern part of Taiwan, the city comprises two important rivers: Keelung River and Tamsui River carving across the basin. Peitou plateau is within the north-eastern side of the watershed area of Taipei, or the Pa-Shien area in the suburbs of Taipei City. The plateau is north of the Keelung River, as part of the watershed zone. The planning of the Peitou plateau watershed area has undergone several shifts as flood plain studies incrementally acknowledged the severity of flood risk of the 20 years to 200 years flood plain (see Figure 2).
The Keelung watershed areas function as irrigation, water supply, fishing, and transportation for neighboring villages of the Taipei metropolitan area through the 1960s. The Flood Control Plan for Great Taipei Area in 1971 was established and the urbanization continued in the watershed area and replaced the existing rural communities. The implementation was carried out between 1982 and 1996. Fifty water pumping stations and riverbank dikes of approximately 12 m high and approximately 100 km long were completed as part of structure measures to mitigate flood risks. During a thirty-five-year period from 1971–2006, there were eleven severe typhoons that caused flooding problems in Taipei. These floods mainly resulted from the overflowing of the Keelung River and the failure of the drainage system. The highest flooding reached 8.5 m caused by Typhoon Nari in 2001. Development pressure increased further in the late 1980s for Taipei and The Keelung watershed has been designated as an alternative zone for tertiary sector development, despite the threat of flood in the watershed area. In 2007, the dyke overflow caused severe flooding in the vicinity. The government immediately implemented dyke strengthening construction in the hope of reducing the risk of future flooding.
Subsequent flooding events in 2015, 2017, and 2021 continued to cause flash flooding in the plateau. The most recent one in 2021 accumulated 160 mm rainwater in the area within a six-hour period. The weather events in the area were in accordance with scenario prediction by the government that flooding of 0.5 m or above would increase 16.3%; confirming the 2018 UN Climate Risks Index report; it ranked Taiwan as the 7th country most prone to climate risks [28]. The Government evacuation plan focused on post-flood planning and preparation. Investigation of alternative ways to build up the resilience in the plateau should be implemented. New development in the area accommodates about 15,000 new residents and new technology parks are being planned. Since the urban plan is not yet finalized, a long-term drainage system cannot be constructed; only temporary pumping stations have been built. Hence, the aim of the study.
3.2. Respondents Demographic Characteristic
We conducted an initial semi-structured interview with respondents in the Peitou neighborhood from the fall of 2018 through to the summer month of 2019; the empirical research was carried out in 2018–2019 whereby 115 stakeholders were interviewed based on open-ended questions with the aid of visualized diagrams. The interview time corresponded to the seasonal typhoon and extreme rainfall months in Taipei City. The location was chosen to correspond to the area most likely to be flooded in Peitou.
Interviews took place on the main artery road, along retail stores or of the commercial facilities. We conducted the interview along the street or inside the stores. We observed the new residential housing tracts have been completed and some interviewees were with new residents; of the total 115 interview reports, we have ignored 17 interviews as the respondents indicated that they have just recently moved in and have no previous flood experience. In total, 98 respondents were selected to represent age, gender, occupation, and geographical location in the community. Most respondents were store owners, local customers, or employees. Respondents 60 years and over have been living around the area for generations. Respondents’ ages varied, with the youngest being in the late teens and the eldest in their 60s. However, as part of the semi-structured interview, not all respondents expressed opinions on all the questions presented in this study. The result reflects the feedback from the respondents. For the non-feedback or lack of response, the study excluded them from the tabulation. The respondent’s demographic characteristics and interview locations are shown in Table 4 below.
3.3. Adaptive Capacity Assessment Result
The study site reflected a unique habitat change and human adaptability toward the risk; the study measured how residents react to the changes of habitat and human domain. The given habitat state and human capacity address the ability to cope with change and action for adaptive capacity, and we took into account the people, community, and place factors. This section was presented accordingly, with resilience by habitat and human domain (Figure 3, Figure 4, Figure 5, Figure 6, Figure 7 and Figure 8); followed by system transition analysis to portray the dynamic changes that occurred in the community (Figure 9).
3.3.1. Stage 1—Resilience by Habitat (Rht) and Human (Rhu) Domain
The result for the habitat (Figure 3) and human domain (Figure 5, Figure 6, Figure 7, Figure 8 and Figure 9) is shown below. Each respondent gauged their experience in the semi-structured interview and it was categorized according to their self-assessment. The X-axis shows the respondent’s evaluation of association or no association, while the X-axis indicates the number of respondents corresponding to the category.
For the habitat dimension, the study breaks down into building, environment, road, and flooding criteria (Figure 3). Demographics break down into female and male categories which showed a divergent self-evaluation. Considering male and female respondents together, they were most worried about the building factors, since most buildings in the older section of the plateau were built four to five decades ago. There were 33 female and 29 male respondents that felt it was critical to evaluate the building condition. Older buildings were mostly at risk since a vast percentage of building grade elevation was below the street level elevation, and the chance of flooding was much higher than those newer buildings mostly above grade level. Most female respondents worried about their building’s safety as a shelter while dismissing the roads used for circulation; however, male respondents felt that roads were far more important for mitigation than buildings. The new development has raised the grade level, which lessens the chance to be flooded as compared to the older buildings. Some residents were extremely confident of the new development, describing the improved grade level height as an added real-estate value and resilient feature. For this reason, most of the respondents felt that land use is an extremely important sub-indicator, while road and flooding were evaluated divergently by male and female respondents.
The streets until now suffered partial flooding during extreme precipitation, and the leak permeates into the interior. Though flooding is an important issue, 16 female respondents felt that was unrelated to daily life, while 37 male respondents felt the same. This was related to the decrease in flood events in the area. They felt the road was the least important sub-indicator and did not express any negative comment regarding this matter. Male respondents felt that the flooding state had no degradation impact. However, several respondents affirmed that the degradation was a major implication on the community; they asserted that as time passes, the hardware engineering system would degrade. In response to the influx of new residents and building development, both male and female respondents felt land use should be re-evaluated, to better assess the impact of the new development in the neighborhood.
The respondents predominantly scored higher on the human domain dimension, indicating they were confident in their ability to cope with the flood risks (Figure 4). We began by asking how the local community evaluates their resilience thinking, the result from Figure 4 indicated a vast difference in the self-evaluation on resilience confidence. The confidence level changed when respondents felt they needed to engage in flood mitigation actions (action-based). Respondents were asked if they collectively possessed adaptive thinking, preparedness, engagement, and, finally, recovery thinking. There was a schism within the male and female respondents; they differed on the preparedness and engagement categories. Female respondents expressed that although they had adaptive and recovery thinking, it was much harder to deal with flooding, as they felt much threatened by the risk, though they could mitigate during the flood. Therefore, the preparedness and engagement confidence was lower than their male counterparts. The comprehensive evaluation (Figure 4) indicated that the resilience thinking in Peitou was strong.
In terms of individual key indicators, the result of information, responsive process, learning tools, and social structure variables are indicated below.
- -
- Information variable: this is the way information was gathered and acquired (Figure 5). The self-awareness in this study was the behavior and action based on the information and decision-making of the residents. We observed 69 of the total respondents felt strongly aware, which is 71% of the residents interviewed. Most respondents felt there was a lack of public support in marking the flood awareness and services as well as awareness of flood risk within the community. Only 31 respondents felt there was some public service; 69% of the respondents felt a lack of public service; 61% of the respondents felt that there was a lack of flood risk. However, over half (52%) of the respondents felt that they were prepared for a flood event.
- -
- Responsive process variable: Key issues in this variable included (1) ability to mobilize during a flood; (2) identify a threat; (3) prioritize actions; (4) design a strategy, and: (5) implement the strategy. The assessment for the responsive process was diverse (Figure 6).; for identifying the risk, 32 respondents felt strongly positive, 53 respondents felt positive, which made 86% of respondents measured positively; for prioritizing, 52 respondents felt strongly positive, 44 respondents felt positive, which made 98 % of respondents felt positive about having a strategy to prioritize the targets in mind during mitigation. As for the design of the actions required, only 6 respondents felt strongly positive, 33 respondents felt positive, 36 respondents felt ambivalent. This state reflected that the community has not faced an extreme flooding event and could not evaluate their ability to design mitigation practices. For implementation, 45 respondents felt strongly positive, with 43 respondents feeling positive, which resulted in 90% of all respondents feeling positive about their ability to implement mitigation during flood events.
- -
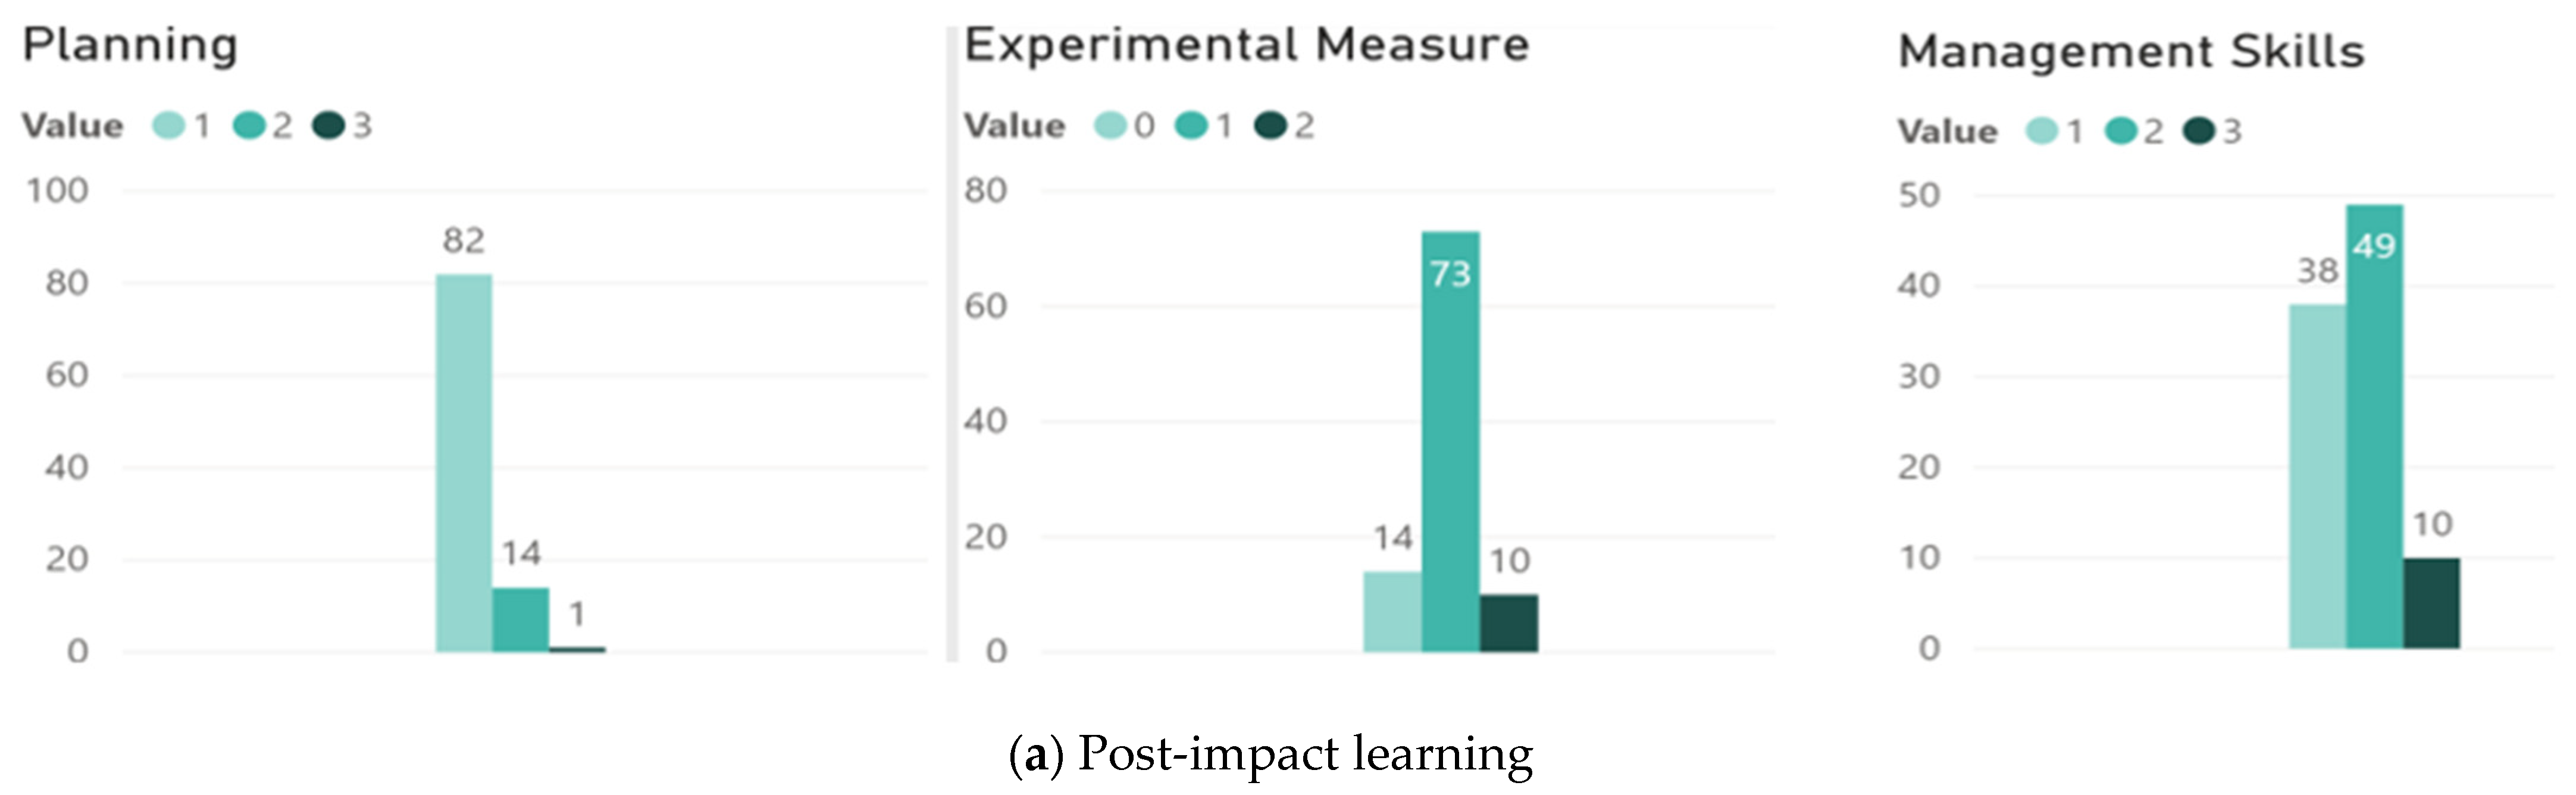
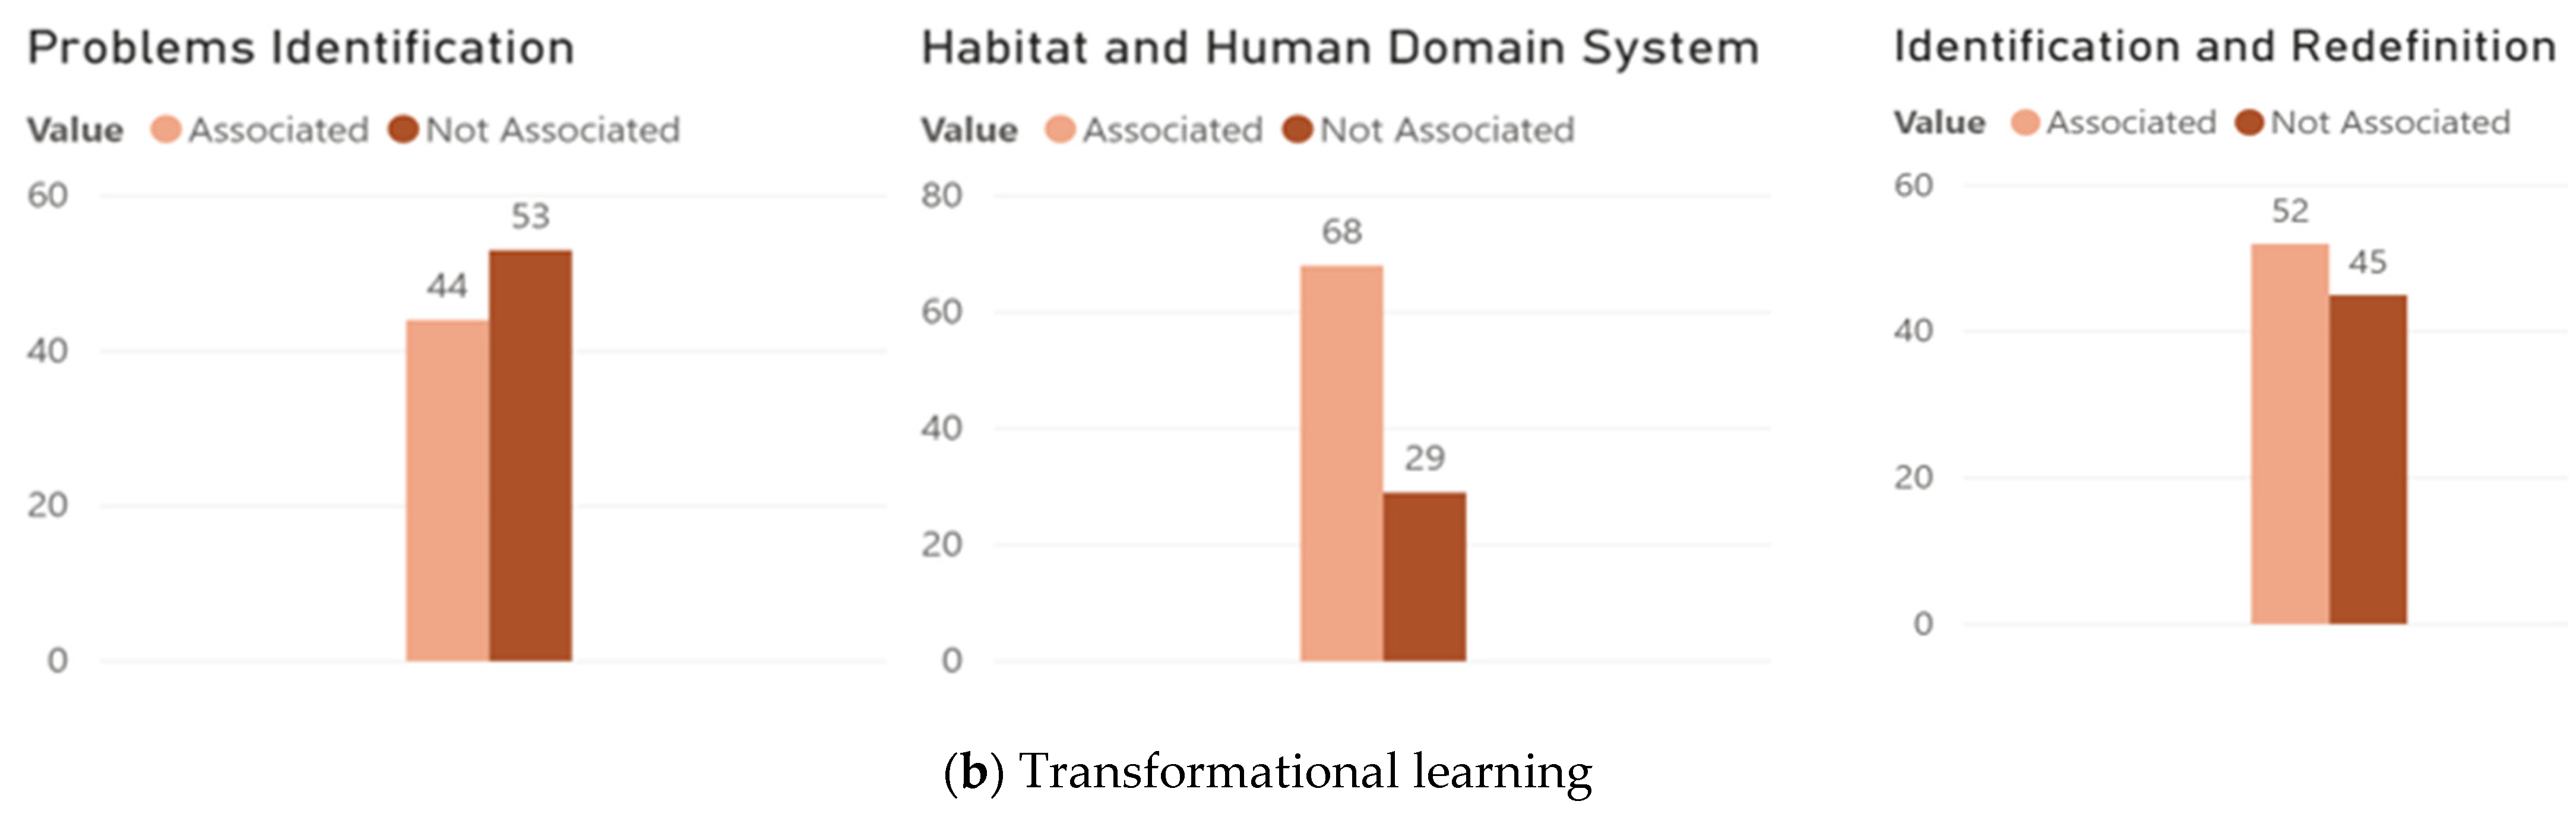
- Learning tools variable: The indicators included (1) post-impact; (2) transformational learning (Figure 7). Overall, the post-impact learning quite diverged among residents. For assessing the planning, experimental measures, and management skills, 69 respondents felt associated with the planning, with 63 respondents feeling a correlation with experimental measures; only 48 respondents felt management skills were crucial within the post-impact learning. For transformational learning, only 45 respondents felt they could identify the problem, but 69 respondents felt reasonably familiar with the habitat and human domain system; 52 respondents felt they were capable of identifying and redefining from each event, which accounted for 53% of the qualified respondents.
- -
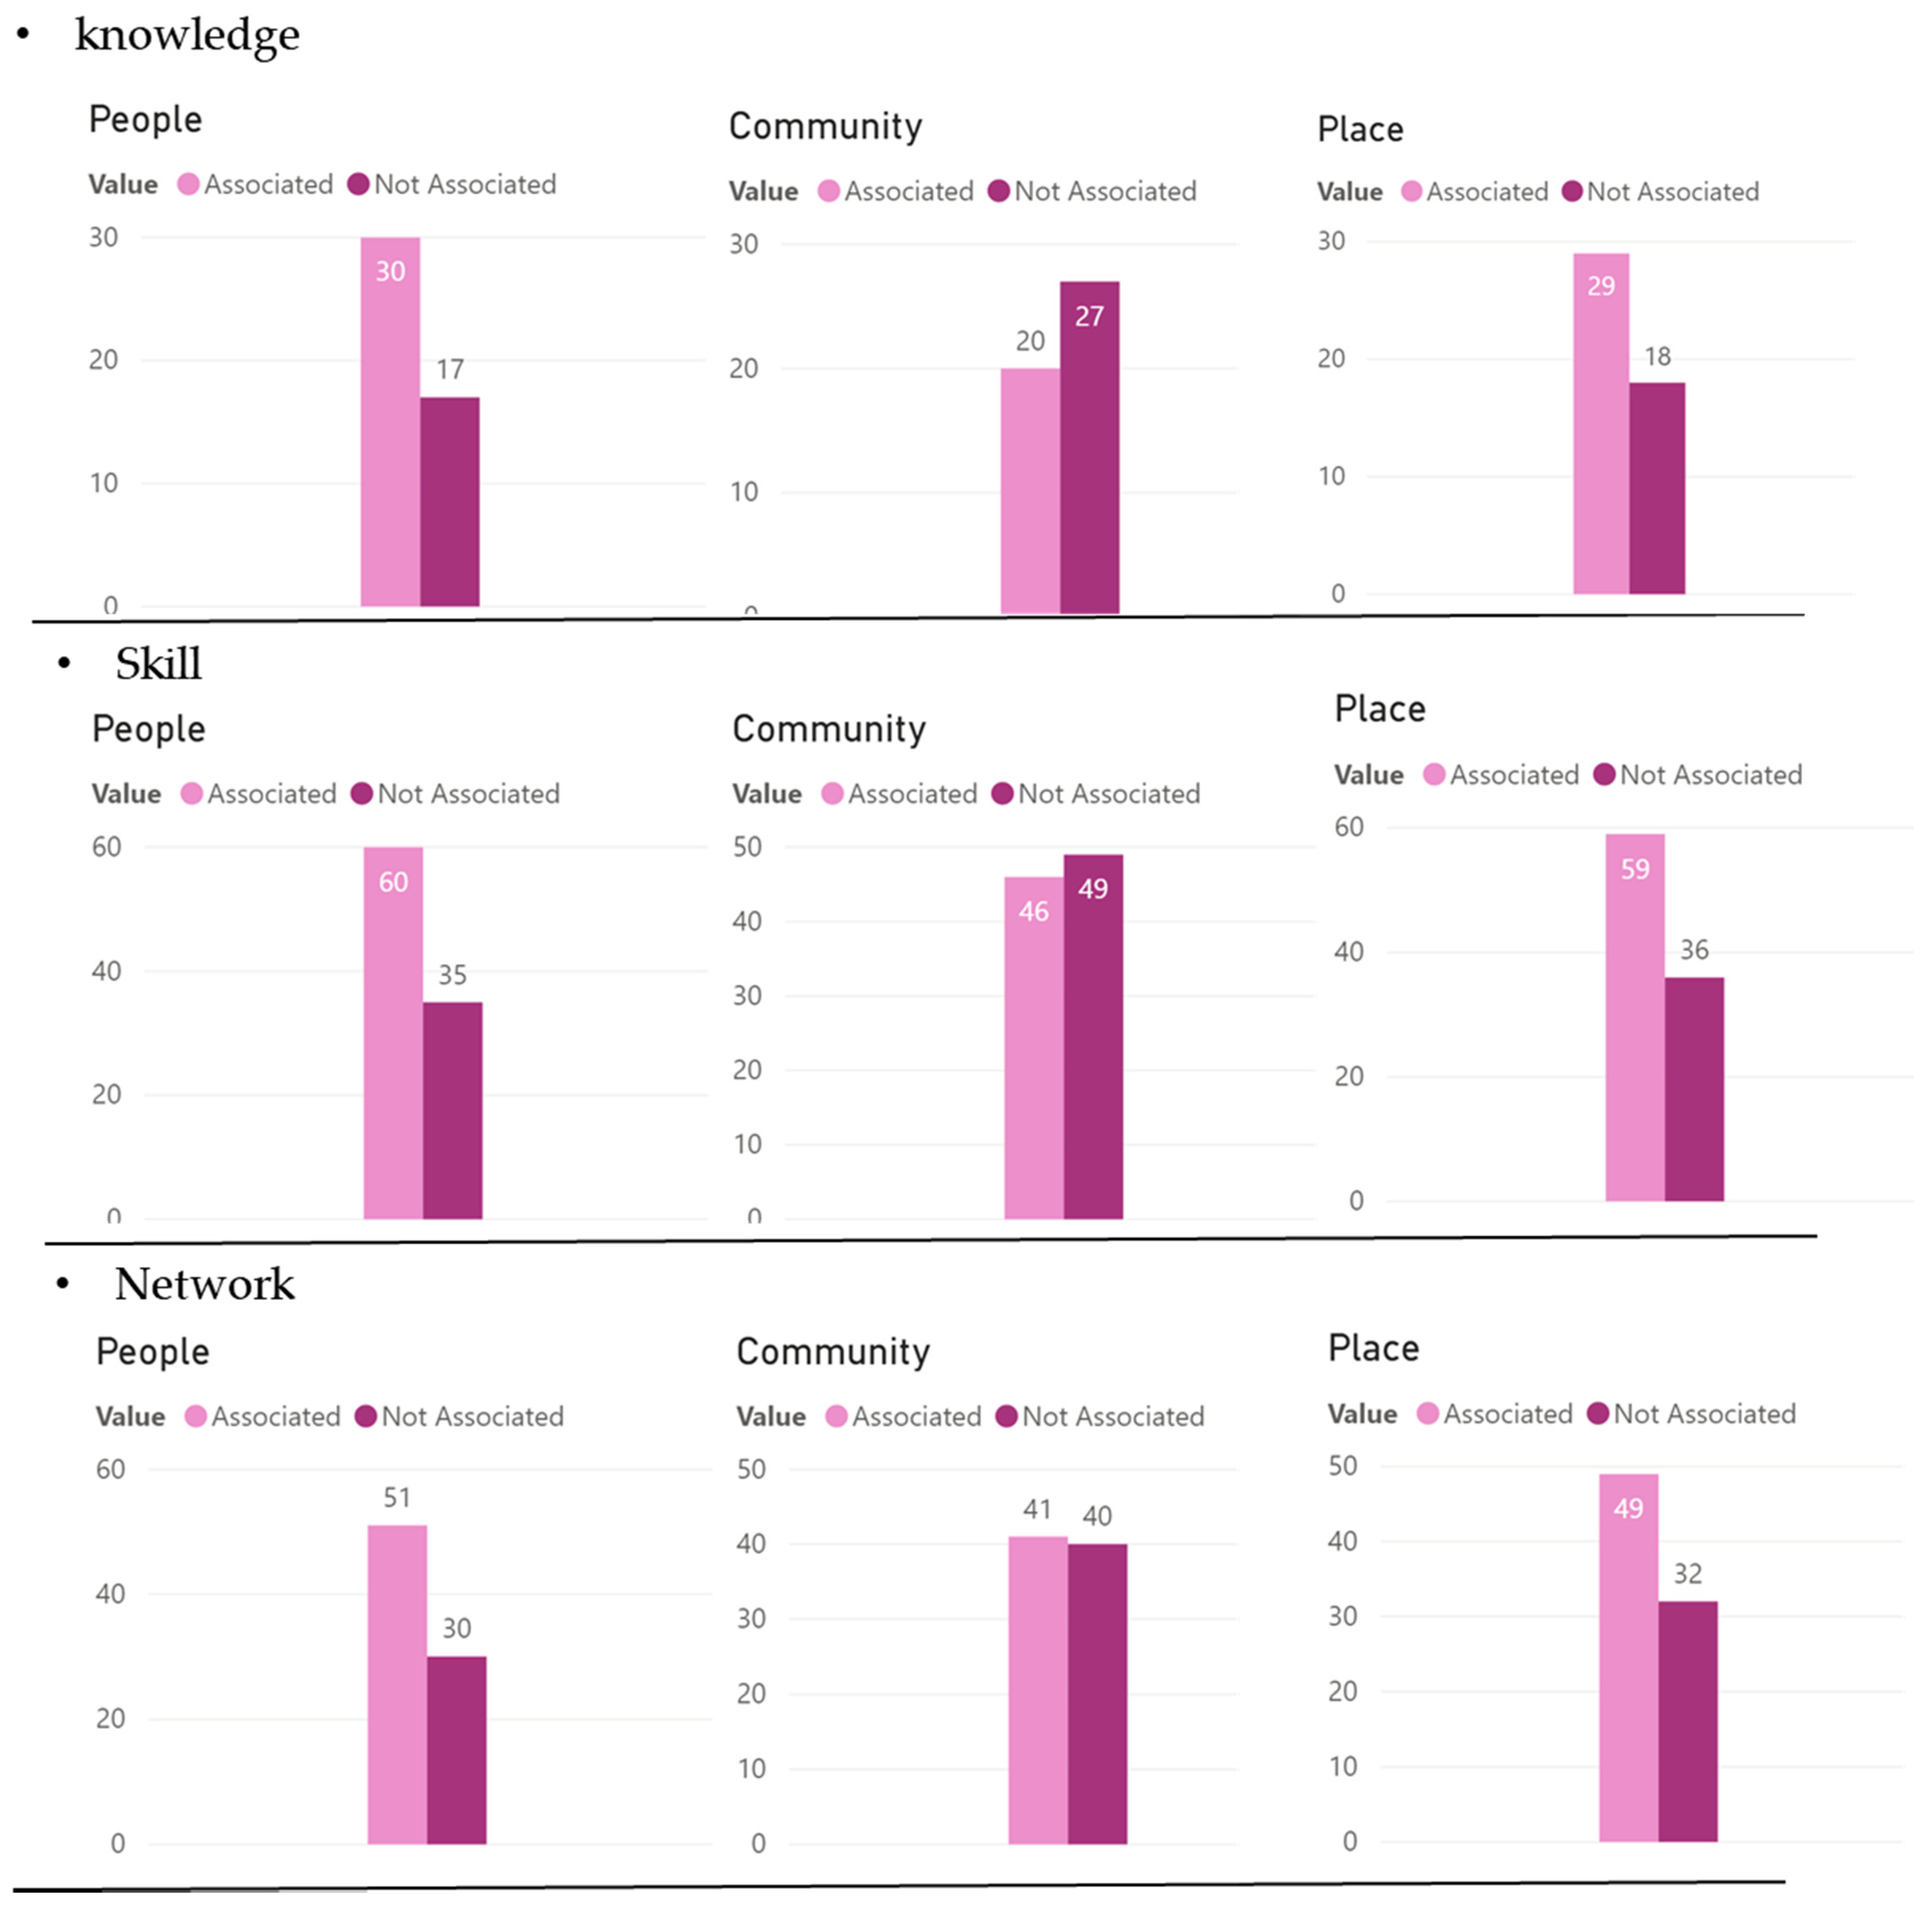
- Social structure variable: The study investigated the knowledge, skills, and network categories of people, community, and place factors (Figure 8). The aspiration for the communication tool was that it should be distinctive by being research-informed, narrative in orientation, and drawing on different evidence bases. In the adaptive resilience robustness build-up, the indicator of skills, knowledge, and networks was taken into consideration; it was further divided into the ability to identify information, learning tools, and support from the social structure. The process required active participation in listening, understanding, learning, and acting to mitigate efficiently as the community transits or adapt in phases.
In terms of social structure, the residents felt confident about the people and the place factor, but the community factor scored differently; the sentiment was in disarray in terms of the knowledge, skills, and network category. Looking into the people and place confidence, it outweighed the non-confidence sentiment. Residents felt that they could mitigate flood risks, and the neighborhood was equipped with engineered hardware. However, for the community factor, the network attributed score was 41 persons out of 98, but the non-confidence remained at 40 persons. This was perhaps due to the influx of new residents to the neighborhood and many old residents did not feel these new residents could be trusted in terms of their capacity. For the knowledge factor within the community category, the non-confidence outweighed the confident ones, mainly because of the influx of new residents to the community; most respondents felt that new residents may not know enough about mitigation and will affect the knowledge level. Upon more in-depth confirmation, the most recent flooding event occurred a decade earlier, which for most respondents it meant that there was no imminent risk. Each respondent’s assessment of knowledge, network, and skills was assessed within the people, place, and community factors. The evaluation took the three factors into account to measure knowledge, skills, and network ability. The initial assessment of the Peitou plateau presented a localized condition where the residents’ self-acknowledgment emphasized the self-awareness in the knowledge and network category within the people and place factors, while the community factor scored less. Conceivably if subsequent flood events require prompt actions from the community, this factor may score higher.
3.3.2. Stage 2—System Transition
Peitou adaptive phasing is disseminated in Figure 9; the overlap within each individual phases is present in accordance with the adaptive framework. Most residents measured fell into the diversification phase, followed by system transition, innovation, and, finally, the stability phase. The eclectic composition of the human dimension is evident from respondents with multiple flood mitigation experiences, second-generation residents, and other residents with sporadic experiences in dealing with floods. Respondents’ spontaneous responses offered descriptive and informative reactions to climate change and flood risk. The following is a further detailed analysis result of the respondents’ own assessment towards flood risk; in terms of identification, prioritization, design, and implementation, corresponding to diversification, innovation, stability, and chaotic state level. Most of the respondents showed a robust adaptability level. The respondents were quite independent in their self-assessment and showed confidence in the institution and community indicators. Using the assumed scenarios, these respondents were able to recount or share previous experiences. The result of the transitional process in the place-based capacity was directly proportional to the community’s awareness and mitigation practice.
Firstly, for the Diversification phase, which was characterized by the growth potential, 36% of the respondents reflected that there was a rising level of diversity and connections in the habitat and human domain; though the level was high, there was a distinct decrease in resilience value. They evaluated positively for the people (individual capacity) and place factors, while evaluated negatively for the community (collective capacity) category. Evidently, there was an uneasy feeling with the recent influx of residents into the neighborhood, marking a transitional shift in the community factor. Next, for the Innovation phase, we looked for innovation, restructuring, and greatest uncertainty but with high resilience value within the human and habitat domain. Of the respondents, 24% evaluated that people, community, and place factors were cohesively connected in this phase. This is critical for the neighborhood, since ranking habitat and human domain positively, shows a robust build-up in the flood resilience within some pockets of the neighborhood. Thirdly, 9% of the respondents felt the neighborhood was at the Stability phase; both habitats and human domains were slowing down, and allocated resources were being used only for system maintenance such as annual dyke check-ups. With so many new residents unaware of the flood risk, and old residents becoming very blase of the flood risk, they felt that the people, community, and place were left with reduced flexibility and low resilience value. Lastly, in the System Transition phase, 26% of the respondents felt the habitat and human domain were in a dynamic transitional shift; there was a reserved but low level in accumulated resilience in the place factor, but it was increasing in capacity value within the people and community factors.
Overall, the system transition was evident. Most residents felt confident in dealing with the habitat-human domain, only less than 9% of the respondents felt their resilience was lower than average. The system oscillated mostly between the Diversification and System Transition band, showing a hectic shift in resilience capacity. The scale shifted from passive to an active build-up of resilience capital. However, considerable uncertainty was felt by most residents with the new influx of residents; some old residents were unsure how the demographic compositional change may modify the neighborhood. The results ascertain the dynamic mechanism in people, community, and place factors; they contribute to adaptive capacity within the “Panarchy” framework. They expressed some hesitation but still seemed confident. The innovation phase scored lower than the system transition phase. Mainly, most residents felt they were in the diversification phase, characterized by a positive resilience in the ‘place’ factor, while the people factor scored positively, but the community factor scored negatively. Since most of the residents were either in the diversification or system transition phasing, it reflected that there was less drive in the community to explore creative solutions or to propose ways of alerting flood risks. There was an evident complacency in the community regarding flood risks. This is a warning sign for the institution looking into the Peitou resilience planning or management.
4. Discussion
4.1. Learning the Community Transitional Adaptive Capacity and Resilience
Urban resilience involves regime change in which the structures, processes, and identity of a community either evolve into a more desired configuration or devolve into a less desirable state [7,43,45]. It applies to urban centers acquiring flood resilience. In the processional transition, adaptation implies a transitory process with a specific goal to exploit all opportunities and means; to reduce vulnerability and risk, with available means to lessen the impact or harm. Therefore, adaptive thinking would be unfettered if the media, elite figures, local groups, or other societal actors are silent on the matter [45,48]. This capacity could be sustained by progressive emulsification.
The United Nations urbanization projected a total of 55% of the population live in urban areas under extreme climate threats which may result in loss and damage [25]. Therefore, acquiring the necessary mitigation becomes an essential condition for communities. Learning through an environmental event or natural disaster can create a “window of opportunity” for collective action in a habitat (socioecological) system [3,5] as well as human community systems [45]. Lessons learned from flood-prone communities serve as a learning reference to regional urban resilience planning; local practice makes a lasting impression of the conscious experiences and is part of the cognitive habitual action from the local community.
In addition to hardware engineering reinforcement, the community’s resilience should focus more on software reinforcement, like social capital, economics, resources, and disaster-control policy mechanisms. Adaptive capacity, then, is achieved through a vast array of actions layered upon the people and community; they assimilate experiences to apply to the eventual decision, effecting changes within the habitat domain. Resilience requires critical capacities of living systems: to resist collapse and maintain vital functions, to adapt to transforming conditions (learn and self-organize); this allows for an evolving the build-up of capacity. This study ascertains the assessment model of the human-habitat domain, though residents’ responses should be further tested and improved; overall, this scoping tool is still applicable to assess the capacity in mitigating flood events.
Adaptation is necessary to position countries to better cope with the impacts they will experience under climate risks [3,45,48]. It is argued that residents that shared previous experiences in flooding are more cautious about the risks, marking a stark contrast to those that lack previous encounters with flooding with their skill buildup. Those that lack any previous flooding experiences still enabled their flood adaptability knowledge but are not necessarily applicable to resiliency skill buildup. This differential directly (albeit marginally) reflects that communication tools and age highly influence adaptation capacity through skill, like any experience in flooding does influence the total preparedness or skills, the likelihood of flooding is replaced by the best practice opportunity that bears no direct impact on their livelihood.
4.2. The Dynamic Thinking in Adaptive Capacity
A system is deemed resilient when the degree of disturbance taken could withstand the shock without shifting into a new regime or basin of attraction [14]. System potential is concerned with the range of options available for future responses of the system [45,48]. Despite the inherent differences in the human-habitat domain, the prototype model proposed facilitates the evaluation of communities facing constant climate risks. Accordingly, introducing the awareness of flood events should stimulate and capacitate the communities’ capacity build-up [45,47]. Moreover, social consensus regarding appropriate solutions has been lagging and the effect of co-design cannot be observed nor tracked. By identifying the vulnerability areas through the appropriate assessment framework allows for future robust adaptation to be applied.
The hierarchical structuring allows the assessment of change that a given community encounters. Once the critical factor is identified, this condition enhances the amplest support to form an effective process and network. In Peitou, residents felt that they have a solid grasp of the local human and habitat domain, albeit a lack of support from the public sector. However, with new residents moving into the community, it would be of significance to evaluate the adaptive capacity on a rolling basis, since the dynamic change remain inherently the core of the Panarchy assessment model.
We find that flood risk awareness can be promoted through the form of visualized diagrams; the community best reads a graphic representation. Awareness should be raised to effectively assess climate change impacts. Significantly, the community needs to acknowledge the impacts and current capacity or susceptibility. By focusing on the people, community, and place criteria, the evaluation takes the human-habitat domain through the transitional evaluation. The dynamic shift corresponds to the realistic fluctuation that a given community may encounter. Jointly, local knowledge, skills, and network affect the local flood resilience; by addressing the system, one can undergo in the face of threats, and still retain the same controls on function and structure while maintaining options to develop further.
Identifying viable strategies and adaptable, flexible, and pertinent responses to the residents could undeniably facilitate capacity robustness build-up. Having effectual mitigation practice necessitates the short-term reactive practice and viable measures that could be implemented in the future to match the community’s adaptive level. Those with flooding experience perceive higher levels of personal and local area threat from climate change. Therefore, the community benefits from previous experiences or knowledge to build up skills. This is also important in forming a consensus prior to effective network formation.
4.3. Bottom-Up Approach in Flood Resilience Adaptation Options
The shift for the bottom-up approach can be witnessed from recent adaptation thinking; it allows scenarios and modeling as a visual aid to educate local communities in risk awareness and mitigation options; hence, a move toward better adaptation capacity. The skills attained through experience and information through the network seem to stimulate the knowledge building for the residents. In Peitou, the time of innovation phase happened before the 1960s until the late 1980s. That is the period of most momentous uncertainty but with most gained resilience; residents learned to mitigate without being dependent on additional institutional assistance. This is overlapped by the growth phase in the late 1980s till early 2000. The resilience capacity decreased as residents became dependent on the engineered hardware to mitigate floods. This is best exemplified in their habitual expectation that the dikes and pumps could keep the water level at bay. The adaptive capacity in the community is necessitated by the ability to listen, understand, and learn and the local social structure. The lack of these attributes in a direct way hampered the local capacity build-up.
The result of the semi-structured interview exhibited a discrepancy among the respondents. Most of the respondents have an elevated level of listening and understanding ability, while the learning and social structure shows a lower level as compared to the listening and understanding ability. The discrepancy seems to reflect the age differential among the respondents, as the younger respondents maintain less opportunity to mitigate the floods. If the learning opportunity is not present, then the sharing of past experiences needs to be encouraged to facilitate the capacity build-up process. This reflects that the personal learning and knowledge built up is much more crucial than the habitat contribution. The knowledge build-up contributes to the resilience of neighborhoods. People’s perception of climate change and its possible consequences is related to their direct personal experience of harm or damage from climate-related events like flooding or landslide [36,45,47]. The community needs to familiarize themselves with the coping strategies, while diversifying a divergent capacity among individuals, induced by their actions and responses toward the human-habitat impacts. Residents predominantly evaluate and rely on the hardware to mitigate the flood risk; their reliance on the dikes is essentially similar to other communities in Taiwan, where the assumption is that a reactive planning process is always followed by compensating past flooding against future risk. The “Panarchy thinking” approach allowed the dynamic transitional process to be assessed; local policy could encourage more software measures at the community level. Adaptation, therefore, should embrace innovation and viable strategies; even if the community’s confidence is aided by hardware addition, the locally adapted measures could be implemented to allow community-based measures.
The careful identification of available strategies allows the community to prioritize or integrate options in the ranges of uncertainty. Most importantly, the identified weakness could be fortified by learning tools, social structure, and strengthening of obtainable information. The paradigm shift allows adaptive thinking rather than impact-minded thinking, which combines flexibility in management and accepting uncertainty in a projected flood risk scenario. The community begins accepting the level of risks, becoming resilient in the face of the flood. Not to underestimate that the coordination effort within the network in the community becomes a challenge across levels and multiple scales.
5. Conclusions
It is ascertained that place-based capacity is directly proportional to the community’s awareness and mitigation practice. Public measures such as the EU Floods Directive in 2007 (Directive 2007/60/ EC), or the Finnish Flood Risk Management Act in 2010 could aid the community mitigation process. As the institutional stakeholders take part, the active participation from residents could benefit the collective whole to transition toward the adaptive resilience capacity but lack measurable evidence on their contribution and shift within the spatial-temporal scale. The study proposed transitional thinking derived analysis framework to better recognize the community’s dynamic capacity in mitigating flood risk.
How the community copes with flood risk is important; one should focus on identifying specific people, community, and place factors that could strengthen local flood resilience. Essentially, this study ascertained that by integrating and analyzing the conditions and perception of a given community, the capacity to mitigate the risks is ascertained; building the ability to bounce forth from flood events is critical. In the Peitou plateau, the residents transition between adaptive states to maintain daily function. At the onset of and post-flood events, residents’ self-assessment on their awareness of the condition to the practices indicated the dynamic transition.
An individual and collective evaluation of flood awareness was assessed. While some residents felt confident enough in their individual capacity gathering, the community seemed to ubiquitously agree on the lack of input from the public service in aiding local flood resilience. This critical observation confirms the effect of resilient practice and the individual and collective learning from past experiences within the community affect residents’ perception and resilience ability. Consequently, the demographic shift reflects the dynamic transition. As new residents move in, their subjective assessment of the habitat resonates and sometimes inhibits the learning process. Essentially, they learned to share an adapted resilience value system. Flood events sharpen people and the community’s awareness; the frequent flooding that may recede within a few hours encouraged new and younger residents in acquiring a positive attitude toward flood risk.
The preconception of reinforced engineered infrastructure decreased the flooding frequency in the area. The increased risks in the face of extreme climate change depend on the future intensity. Magnitude and scope in the engineering design could withstand will exceed the mainstream practice or estimated allowance. Further, the resilience enablement is reinforced by a positive outlook or the fact that residents feel empowerment in flood resilience. As the stress level lowers, the coping capacity and the adaptive means mostly become a cognitive measure or reflection rather than an actual capacity. Residents feel strongly about their resilience level, though most of them have not encountered recent flood events. The sporadic flooding in the community affected only a pocketful of residents, while others have not experienced the events at all.
Resilience capacity build-up requires a certain allowance to address the gaps rather than introducing new methods. The intra-network among the residents is helpful to process the intra-transformational learning process. This process can allow for resilience build-up from individually based to collective based adaptation. Flood risks present challenges that are augmented incrementally with further climate change. As resilience capacity involves how each member of the community copes with flood risk, this study empirically examined each of the scale changes at the various transitional stages of the resilience build-up process. This resilience varies from the degree and time exposed to flood. This is significant in understanding the strength and shortcomings of the members within the community. Depending on the increase or decrease in the coping mechanism or adaptive capacity, the cross-scale linkages affect the progress of the human or habitat criteria influencing the overall dynamics of the system. Evidently, the human criteria influenced the resilience capacity in Peitou.
Comprehensive information on suitable methods for adaptive assessment across multiple time, location and human-habitat dimensions are not readily available. Issues like the dynamic understanding of key components within the flood resilience, residents’ capacity for the mitigation process, and lessons learned over time should be analyzed. This study provided an alternative method to comprehend how residents enable their flood resilience; their adaptive capacity involves a process of reducing the uncertainty and complexity of rapid urban change. We ascertain that assessing the adaptive capacity is important in understanding local flood awareness; specifically, the fluctuation and dynamic shift in behavior and capacity, allowing public’s assisted measures to reference the human-habitat domain effect in the flood resilience capacity robustness within the community.
Funding
This research was funded by MOST, Taiwan, grant number NSC-107-2635-H-032-005.
Institutional Review Board Statement
Not applicable.
Informed Consent Statement
Informed consent was obtained from all subjects involved in the study upon the completion of the semi-structured interview.
Data Availability Statement
Data are not publicly available, though the data may be made availa-ble on request from the corresponding author.
Acknowledgments
The author is grateful to the students who contributed to the research by assisting out during the interviews.
Conflicts of Interest
The author declares no conflict of interest.
References
- Matias, D.M. Slow Onset Climate Change Impacts: Global Trends and the Role of Science-Policy Partnerships; German Development Institute: Bonn, Germany, 2017; Available online: https://www.die-gdi.de/uploads/media/DP_24.2017.pdf (accessed on 19 June 2019).
- Moritz, C.; Agudo, R. The Future of Species Under Climate Change: Resilience or Decline? Science 2013, 341, 504–508. [Google Scholar] [CrossRef]
- Ling, T.Y.; Chiang, Y.C. Strengthening the resilience of urban retailers towards flood risks—A case study in the riverbank region of Kaohsiung City. Int. J. Disaster Risk Reduct. 2018, 27, 541–555. [Google Scholar] [CrossRef]
- Savaget, P.; Geissdoerfer, M.; Kharrazi, A.; Evans, S. The theoretical foundations of sociotechnical systems change for sustainability: A systematic literature review. J. Clean. Prod. 2019, 206, 878–892. [Google Scholar] [CrossRef]
- McClymont, K.; Morrison, D.; Beevers, L.; Carmen, E. Flood resilience: A systematic review. J. Environ. Plan. Manag. 2019, 63, 1151–1176. [Google Scholar] [CrossRef] [Green Version]
- IPCC AR6. IPCC Fifth Assessment Report: Climate Change. Intergovernmental Panel on Climate Change. 2021. Available online: https://www.ipcc.ch/assessment-report/ar6/ (accessed on 20 October 2021).
- Holling, C.S.; Gunderson, L.H. Panarchy: Understanding Transformations in Human and Natural Systems; Gunderson, L.H., Holling, C.S., Eds.; Island Press: Washington, DC, USA, 2002. [Google Scholar]
- Burkhard, B.; Fath, B.D.; Müller, F. Adapting the adaptive cycle: Hypotheses on the development of ecosystem properties and services. Ecol. Modell. 2011, 222, 2878–2890. [Google Scholar] [CrossRef]
- Kharrazi, A.; Fath, B.; Katzmair, H. Advancing empirical approaches to the concept of resilience: A critical examination of panarchy, ecological information, and statistical evidence. Sustainability 2016, 8, 935. [Google Scholar] [CrossRef] [Green Version]
- Rezende, O.M.; Miranda, F.M.; Haddad, A.N.; Miguez, M.G. A Framework to Evaluate Urban Flood Resilience of Design Alternatives for Flood Defence Considering Future Adverse Scenarios. Water 2019, 11, 1485. [Google Scholar] [CrossRef] [Green Version]
- Keating, A.; Campbell, K.; Szoenyi, M.; McQuistan, C.; Nash, D.; Burer, M. Development and testing of a community flood resilience measurement tool. Nat. Hazards Earth Syst. Sci. 2017, 17, 77–101. [Google Scholar] [CrossRef] [Green Version]
- UNDP. Community Based Resilience Analysis (COBRA) Conceptual Framework and Methodology, Commissioned by UNDP Drylands Development Centre, Under the framework of Humanitarian Aid and Civil Protection Department of the European Commission’s Drought Risk Reduction Action Plan. 2014. Available online: https://www.undp.org/content/dam/undp/library/Environment%20and%20Energy/sustainable%20land%20management/CoBRA/CoBRRA_Conceptual_Framework.pdf (accessed on 30 August 2018).
- Manyena, B.; Machingura, F.; O’Keefe, P. Disaster Resilience Integrated Framework for Transformation (DRIFT): A new approach to theorising and operationalising resilience. World Dev. 2019, 123, 04587. [Google Scholar] [CrossRef]
- Holling, C.S. Resilience and Stability of Ecological Systems. Annu. Rev. Ecol. Syst. 1973, 4, 1–23. [Google Scholar] [CrossRef] [Green Version]
- Tapsell, S.; Tunstall, S.; Sorensen, A. UK Case Studies in Public Participation. Draft Report to the Floodscape Project; Flood Hazard Research Centre, Middlesex University: Enfiel, UK, 2005. [Google Scholar]
- Thrush, D.; Burningham, L.; Fielding, J. Vulnerability with Regard to Flood Warming and Flood Event: A Review of the Literature; R&D Report W5C-018/1; Environmental Agency: Bristol, UK, 2005. [Google Scholar]
- Tschakert, P.; Dietrich, K.A. Anticipatory learning for climate change adaptation and resilience. Ecol. Soc. 2010, 15, 11. Available online: http://www.ecologyandsociety.org/vol15/iss2/art11/ (accessed on 25 May 2018). [CrossRef]
- Schipper, E.L.F.; Langston, L. A Comparative Overview of Resilience Measurement Frameworks: Analyzing 15 Indicators and Approaches; Overseas Development Institute Working Paper, Issue 422; Overseas Development Insitutue: London, UK, 2015. [Google Scholar]
- Laurien, F.; Hochrainer-Stigler, S.; Keating, A.; Campbell, K.; Mechler, R.; Czajkowski, J. A typology of community flood resilience. Reg. Environ. Change 2020, 20, e24. [Google Scholar] [CrossRef] [Green Version]
- DFID. Sustainable Livelihoods Guidance Sheets, Department of International Development, United Kingdom. 1999. Available online: http://www.eldis.org/vfile/upload/1/document/0901/section2.pdf (accessed on 15 May 2019).
- Winderl, T. Disaster Resilience Measurements: Stocktaking of Ongoing Efforts in Developing Systems for Measuring Resilience. UNDP. 2014. Available online: https://www.preventionweb.net/files/37916_disasterresiliencemeasurementsundpt.pdf (accessed on 15 May 2019).
- Ostadtaghizadeh, A.; Ardalan, A.; Paton, D.; Jabbari, H.; Khankeh, H.R. Community Disaster Resilience: A 5 Systematic Review on Assessment Models and Tools. PLoS Currents Disasters 2015, 7. [Google Scholar] [CrossRef] [PubMed]
- Oddsdottir, F.; Lucas, B.; Combaz, É. Measuring Disaster Resilience, GSDRC Helpdesk Research Report 1045, GSDRC; University of Birmingham: Birmingham, UK, 2013. [Google Scholar]
- Brown, R.R.; Keath, N.; Wong, T.H.F. Urban water management in cities: Historical, current and future regimes. Water Sci. Technol. 2009, 59, 847–855. [Google Scholar] [CrossRef] [PubMed]
- UN. UN Global Report on Human Settlement. 2018. Available online: https://unhabitat.org/series/global-report-on-human-settlements/2015 (accessed on 29 June 2018).
- Fisher, L. Disaster Responses: More than 70 Ways to Show Resilience. Nature 2015, 518, 35. [Google Scholar] [CrossRef] [PubMed] [Green Version]
- Mehmood, A. Of resilient places: Planning for urban resilience. Eur. Plan. Stud. 2016, 24, 407–419. [Google Scholar] [CrossRef] [Green Version]
- UNFCCC. German Watch. Global Climate Risk Index. 2018. Available online: https://unfccc.int/event/germanwatch-global-climate-risk-index-2018 (accessed on 10 January 2019).
- Sundstrom, S.M.; Allen, C.R. The adaptive cycle: More than a metaphor. Ecol. Complex. 2019, 39, 100767. [Google Scholar] [CrossRef]
- Kuang, D.; Kiao, K.H. Learning from Floods: Linking flood experience and flood resilience. J. Environ. Manag. 2020, 271, 111025. [Google Scholar] [CrossRef] [PubMed]
- Satterthwaite, T.D.; Wolf, D.H.; Erus, G.; Ruparel, K.; Elliott, M.A.; Gennatas, E.D. Functional maturation of the executive system during adolescence. J. Neurosci. 2013, 33, 16249–16261. [Google Scholar] [CrossRef] [Green Version]
- Taylor, A.; Bruin, W.B.; Dessai, S. Climate change beliefs and perceptions of weather-related changes in the United Kingdom. Risk Anal. 2014, 34, 1995–2004. [Google Scholar] [CrossRef] [PubMed] [Green Version]
- Preiser, R.; Biggs, R.; De Vos, A.; Folke, C. Social-ecological systems as complex adaptive systems: Organizing principles for advancing research methods and approaches. Ecol. Soc. 2018, 23, 46. [Google Scholar] [CrossRef] [Green Version]
- Biggs, R.; Schlüter, M.; Schoon, M.L. Principles for Building Resilience: Sustaining Ecosystem Services in Social-Ecological Systems; Cambridge University Press: Cambridge, UK, 2015. [Google Scholar] [CrossRef] [Green Version]
- Bodin, Ö. Collaborative environmental governance: Achieving collective action in social-ecological systems. Science 2017, 357, 6352. [Google Scholar] [CrossRef] [Green Version]
- Räsänen, A. Cross-scale interactions in flood risk management: A case study from Rovaniemi, Finland. Int. J. Disaster Risk Reduct. 2021, 57, 102185. [Google Scholar] [CrossRef]
- EEA. National Adaptation Policy Processes in European Countries; Publications Office of the European Union: Copenhagen, Denmark, 2014. [Google Scholar]
- ADB. Urban Climate Change Resilience: A Synopsis, Asian Development Bank. 2014. Available online: https://www.adb.org/publications/urban-climate-change-resilience-synopsis (accessed on 20 June 2019).
- Martin-Breen, P.; Anderies, J.M. Resilience: A Literature Review, Brighton: Bellagio Initiative. 2011. Available online: http://opendocs.ids.ac.uk/opendocs/handle/123456789/3692 (accessed on 20 May 2018).
- Adger, W.N.; Barnett, J.; Brown, K.; Marshall, N.; O’Brien, K. Cultural dimensions of climate change impacts and adaptation. Nat. Clim. Change 2013, 3, 112–117. [Google Scholar] [CrossRef]
- Burch, S.; Shaw, A.; Dale, A.; Robinson, J. Triggering transformative change: A development path approach to climate change response in communities. Clim. Policy 2014, 14, 467–487. [Google Scholar] [CrossRef]
- Hassnoot, M.; Kawkkeil, J.; Walker, W.; ter Maat, J. Dynamic adaptive policy pathways: A method for crafting robust decisions for a deeply uncertain world. Glob. Environ. Chang. 2013, 23, 485–498. [Google Scholar] [CrossRef] [Green Version]
- Snel, K.A.W.; Witte, P.A.; Hartmann, T.; Geertman, S.C.M. The shifting position of homeowners in flood resilience: From recipients to key-stakeholders. WIREs Water 2020, 7, e1451. [Google Scholar] [CrossRef]
- Allen, J.C.R.; Angeler, D.G.; Chaffin, B.C.; Twidwell, D.; Garmestani, A. Resilience reconciled. Nat. Sustain. 2019, 2, 898–900. [Google Scholar] [CrossRef]
- Heidenreich, A.; Masson, T.; Bamberg, S. Let’s talk about flood risk!—Evaluating a series of workshops on private flood protection. Int. J. Disaster Risk Reduct. 2020, 101880. [Google Scholar] [CrossRef]
- Mitchell, M.; Griffith, R.; Ryan, P.; Walkerden, G.; Walker, B.; Brown, V.A.; Robinson, S. Applying resilience thinking to natural resource management through a planning-by-doing framework. Soc. Nat. Resour. 2014, 27, 292–314. [Google Scholar] [CrossRef]
- Bui, H.T.; Jones, T.E.; Weaver, D.B.; Le, A. The adaptive resilience of living cultural heritage in a tourism destination. J. Sustain. Tour. 2020, 28, 1022–1040. [Google Scholar] [CrossRef]
- Demski, C.; Capstick, S.; Pidgeon, N.; Sposato, R.G.; Spence, A. Experience of extreme weather affects climate change mitigation and adaptation responses. Clim. Change 2017, 140, 149–164. [Google Scholar] [CrossRef] [PubMed] [Green Version]
Figure 1.
Resilience Capacity Phases in The Adaptive Capacity build-up process through Coping and Adaptation. Source: compiled and drawn by this study.
Figure 1.
Resilience Capacity Phases in The Adaptive Capacity build-up process through Coping and Adaptation. Source: compiled and drawn by this study.

Figure 2.
Peitou Plateau Watershed Taipei Location Map with flood location overlay for Peitou District Source: Academia Sinica and compiled by this study.
Figure 2.
Peitou Plateau Watershed Taipei Location Map with flood location overlay for Peitou District Source: Academia Sinica and compiled by this study.

Figure 3.
Resilience by habitat domain Rht (building, road, land use, and flooding) criteria result; based on the interview and compiled by the study.
Figure 3.
Resilience by habitat domain Rht (building, road, land use, and flooding) criteria result; based on the interview and compiled by the study.

Figure 4.
Information understanding: based on the interview and compiled by the study.

Figure 5.
Responsive process analysis diagram.

Figure 6.
Learning process analysis is the post-impact learning evaluation; (b) is the transformation learning evaluation.
Figure 6.
Learning process analysis is the post-impact learning evaluation; (b) is the transformation learning evaluation.

Figure 7.
Social structure analysis diagram.


Figure 8.
The respondents’ adaptive capacity phasing analysis in Peitou Plateau.

Figure 9.
The respondents’ adaptive capacity phasing analysis in Peitou Plateau.

Table 1.
The community adaptive capacity’s domain-criteria table.
| Adaptive Domain Attributes | Key Indicators Impact, Action, Mediation | Sub-Indicators | Measurement | Resilience Habitat (Rht), Human (Rhu) |
|---|---|---|---|---|
| Resilience Rht By Habitat Domain A. Place Impact based | 1. Building (impact) | a. Building state 0-1 (1). Building damage (2). Building no damage | “yes” = 1 “no” = 0 | Habitat domain indicators total numerical values = 0 ≤ Rht ≥ 4 Low Rht (1), Medium Rht (2), and High Rht (3+). |
| 2. Environmental (impact) | a. Ambient condition 0-1 (1). environnemental impact (2). no environmental impact | “yes” = 1 “no” = 0 | ||
| 3. Infrastructure (impact) | a. Road, Bridge damage 0-1 (1). water, electricity, and other damages (2). no water, electricity, and other damages | “yes” = 1 “no” = 0 | ||
| 4. Flooding (impact) | a. Flood experience 0-1 (1). Water retention or accumulation (2). No water retention or accumulation | “yes” = 1 “no” = 0 | ||
| Resilience Rhu By Human Domain A. People (individual) B. Community (collective) Action and mediation based | 1. Information Understanding (action) | a. Self-perception of flood risk b. Visual prompts before flood c. Public services alert source d. Information stream and awareness | visible change (knowledge) “yes” = 1 “no” = 0 | Human domain indicators total numerical values = 0 ≤ Rhu ≥ 12 Low Rhu (summation “yes” ≤ 2), Medium Rhu (summation 3 ≤ “yes” ≥ 6), and High Rhu (summation 7 ≤ “yes” ≥ 12). |
| 2. Responsive Process (action) | a. Ability to mobilize during flood b. Identify threat c. Prioritize actions d. Design strategy d. Implement strategy | Visible change response (skill) “yes” = 1 “no” = 0 | ||
| 3. Learnings Attainment (action) | a. Post-impact learning 0–1 (1). Planning (2). Experimental measure (3). Management skill b. Transformational learning 0-1 (1). Problem identification, or problem domains variables identified (2). Habitat and human domain system identification and redefinition | Visible change preparation (network) “yes” = 1 “no” = 0 | ||
| 4. Social Structure (mediation) | a. Network transition | “yes” = 1 “no” = 0 | ||
| b. Communication channel | ||||
| c. Engagement with others |
Table 3.
Semi-structured interview stages.
| Key Question Stage 1 Habitat-Human dimension | Key Question Stage 2 Responsive process | Key Question Stage 3 Adaptive Resilience Robustness |
|---|---|---|
| Habitat dimension: has your building ever been flooded (if “yes”, note “1”) | Have you ever gained any knowledge to protect your building from flooding? (if “yes”, note “-1”) | Self-assessed level of initiation to mitigate floods in change, response and capacity building: (if ”yes” diversity, prioritize, design and action: ok=low +1, good=medium +2, great = High +3) |
| Habitat dimension: have the buildings nearby ever been flooded? (if “yes”, note “-1”) | Have you ever used any skills? (if “yes”, note “1”) | Self-assessed level of input in understand, learning and effect on social structure separately (if yes ok=low +1, good=medium +2, great =High +3) |
| Habitat dimension: Have the flood affected the community (if “yes”, note “-1”) | Self-assessed levels of personal preparedness (scale: Not prepared at all = -1; ambivalent=0; somewhat ok= 2; ok= 3; very prepared= 4; very well prepared= 5) | Is the community acting effectively during flooding? (not ok -1, don’t know 0, ok +1, good +2, great +3) |
| Human dimension: Have you try to gather information before the flood? And has your community being better prepared? (if “yes”, note “1” respectively) | Has the neighborhood gained from experience? (if “no” = 0; if “yes”, note “1”) | Is the change, response and building capacity effective? (not ok -1, don’t know 0, ok +1, good +2, great +3) |
| Human dimension: have you acquired better learning tools to mitigate? (if “yes”, note “1”) | The flood mitigation for the change, response and building capacity (diversification, innovation, stability, or system transition phase) (not ok -1, don’t know 0, ok +1, good +2, great +3) |
Table 4.
Respondents’ demographic characteristics.
| Percentage | Duration/Description | |
|---|---|---|
| Gender (n = 100) | ||
| Male | 48% | |
| Female | 52% | |
| Level of Education | ||
| High school or less | 32% | |
| University | 46% | |
| Graduate School/higher | 22% | |
| Age (n = 100) | ||
| 20 and younger | 2% | |
| 21–29 | 29% | |
| 30–39 | 21% | |
| 40–49 | 14% | |
| 50–59 | 18% | |
| 60 and older | 16% | |
| Flood Experience | 4 years | |
| Business Operation (most eateries, convenience store) | 5 years | |
| Property Condition | Mostly rental | |
Publisher’s Note: MDPI stays neutral with regard to jurisdictional claims in published maps and institutional affiliations. |
© 2022 by the author. Licensee MDPI, Basel, Switzerland. This article is an open access article distributed under the terms and conditions of the Creative Commons Attribution (CC BY) license (https://creativecommons.org/licenses/by/4.0/).
Share and Cite
MDPI and ACS Style
Ling, T.-Y. Dynamic Flood Resilience Typology: A Systemic Transitional Adaptation from Peitou Plateau, Taiwan. Sustainability 2022, 14, 875. https://0-doi-org.brum.beds.ac.uk/10.3390/su14020875
AMA Style
Ling T-Y. Dynamic Flood Resilience Typology: A Systemic Transitional Adaptation from Peitou Plateau, Taiwan. Sustainability. 2022; 14(2):875. https://0-doi-org.brum.beds.ac.uk/10.3390/su14020875
Chicago/Turabian StyleLing, Tzen-Ying. 2022. "Dynamic Flood Resilience Typology: A Systemic Transitional Adaptation from Peitou Plateau, Taiwan" Sustainability 14, no. 2: 875. https://0-doi-org.brum.beds.ac.uk/10.3390/su14020875
Note that from the first issue of 2016, this journal uses article numbers instead of page numbers. See further details here.