
Analysis of Forest Fire Dynamics, Distribution and Main Drivers in the Atlantic Forest

1
The Centre for Environmental Policy, Imperial College London, The Weeks Building, 16–18 Princes’ Gardens, London SW7 1NE, UK
2
Department of Earth Science and Engineering, Imperial College London, The Weeks Building, 16–18 Princes’ Gardens, London SW7 1NE, UK
*
Author to whom correspondence should be addressed.
Sustainability 2022, 14(2), 992; https://0-doi-org.brum.beds.ac.uk/10.3390/su14020992
Submission received: 29 November 2021
/
Revised: 28 December 2021
/
Accepted: 10 January 2022
/
Published: 17 January 2022
Abstract
:The fire susceptibility of the Atlantic Forest has largely increased over the past two decades due to a combination of climate change and anthropogenic factors such as land cover change and human modification. High rates of forest fragmentation have contributed to escalating fires in this imperilled global biodiversity hotspot. Understanding fire patterns is essential to developing an effective forest fire management strategy. In this research, we utilized the Random Forest (RF) machine learning approach for identifying the role of climatic and anthropogenic factors in influencing fire occurrence probability and mapping the spatial distribution of fire risk. We found that the Normalized Difference Vegetation Index value and climate variables (i.e., temperature and solar radiation) were significant drivers of fire occurrence risk. Results also confirm that forest fragmentation increases with fire density in the region.
1. Introduction
The Atlantic Forest, the second-largest rainforest in South America, extends along the Atlantic coast of Brazil from Rio Grande do Norte state in the northeast to the Rio Grande do Sul state in the south and inland as far as Paraguay and the Misiones Province of Argentina is the home to 20,000 species of plants and many endemic mammals and birds owing to the variety of its habitats [1,2,3]. In Brazil, where the Atlantic Forest is mainly concentrated, it has been reduced to only 11.7% of its original size owing to agricultural expansion and urban development [1]. In the early 1970s, about 73% of the Atlantic Forest ecoregion was forested, but by 2013 only about one-third of the area was forested. Large-scale agricultural plantations are a major driver of deforestation [4]. The historical extensive conversion of forest habitat into agricultural areas has played a key role in preserving the remaining forest habitat as archipelagos of small forest fragments.
The Atlantic Forest is distributed as 245,173 forest fragments of differing sizes. A total of 83.4% of them contain forest patches smaller than 50 ha, and only 0.03% of the total fragments are larger than 10,000 ha [5]. The degrees of habitat loss and fragmentation in the northern portion of the forest are severe. Only 48% of the remaining fragments are less than 10 ha in area, and few have areas larger than 1000 ha [6]. The Atlantic Rainforest is the most altered Brazilian biome with less than 28% of its original forest cover remaining [7]. In the Atlantic Rainforest, the proportion of forest farther than 1 km from the forest edge has decreased from 90% (historical) to less than 9% in 2015, which indicates severe fragmentation [8].
Such high levels of forest fragmentation have a significant impact on the Atlantic Forest’s fire dynamics as this steep land cover change has caused this biome to become more prone to fire, both natural and human-caused, reduced the natural regeneration power and escalated the savannization process [9]. Fragmentation and fire now share a synergetic relationship in the biome with areas that have seen increased anthropogenic activities and lower forest covers seeing increased fire frequencies [3]. The relationship between fire and landscape fragmentation patterns are especially strong in the Atlantic Forest landscape, where small forest patches (which also end up having large patch edges and low canopy cover) increase the fire susceptibility [10].
Fragmentation impacts the status of remaining forest patches as it facilitates the flow of disturbances from the surrounding landscape, leading to higher tree mortality. This in turn leads to an increase in fire frequency [11]. The conversion of natural forests to agricultural plantations is a leading cause of forest fragmentation in many ecosystems of South America, including the Atlantic Forest. Increased fragmentation makes the remnant forest patches in the Atlantic Rainforest more accessible to fire [12]. Fires typically spread into habitat fragments from nearby agricultural fields and fragments bordering agricultural areas may be more susceptible to fires [13]. Most edge-related fires in deforested areas tend to move into the forest centre, and further deforestation accelerates the fragmentation of the remaining forest [14]. In many parts of the Atlantic Rainforest, flammable grass-dominated ecosystems now border the forest fragments and these are typically managed for human use, for instance, grazing and livestock management using fire, which drives leakage into the forested areas [15]. A positive association has been detected between the presence of such human-modified landscapes (e.g., pastures) and fire activity in the biome [10].
According to the existing body of research, wildfires contribute to the natural regeneration pattern of the Atlantic Forest [9]. However, out of control and large-scale wildfires have detrimental consequences on this biome [16]. Unlike savanna dominated ecosystems like the Cerrado, the Atlantic Rainforest is not fire adapted [17]. The Atlantic Rainforests show no evidence of a fire-influenced evolutionary history, and their species lack adaptations that enhance their resistance to and resilience following fire events [15].
Hence fire management is critical for the Atlantic Rainforest. Mapping the spatial distribution of occurrences and fire risk areas, along with identifying the underlying drivers is critical to successful fire management in this biome. Tropical fire regimes are influenced by a variety of factors, human-caused (for instance, slash-and-burn tactics) [18], fragmentation [10] along with climatic factors such as precipitation [19]. While historical use of fire for agriculture purposes changed plant communities at the landscape level [9,19], the spread and occurrence of wildfires are also influenced by temperature, wind speed and the heating of trees and crops by solar radiation [20]. Hence both anthropogenic and climatic factors need to be incorporated in order to identify fire risk and fire occurrence probability as a way of supporting conservation. Different machine learning models have also been applied to fire prediction owing to their ability to produce robust predictive results, especially for spatial modelling [21]. Support Vector Machines (SVM) [21], Neural Networks [22] and Random Forest (RF) [3,21,23] have been proven to be effective for fire prediction.
The main aim of the research is to identify the variation in key fire dynamics such as burned area, fire density and fire radiative power and the role of climatic and anthropogenic factors, including forest fragmentation in driving these fire parameters. Additionally, we will identify the role of climatic and anthropogenic factors in influencing fire occurrence probability and map the spatial distribution of fire occurrence probability. The probability of fire occurrence identifies the areas in which fires are most likely to occur in the context of risk management [24].
2. Materials and Methods
2.1. Study Area
Our study area is the Atlantic Forest in South America with the current land area of the Atlantic Forest of being 99,944 square km, down from the original 1,233,875 square km. The forest once spanned from the Brazilian coast to around 1.5 million km westward to Paraguay and Argentina [1]. The land area ranges from 5 to 33 in latitude S and 35–57 in longitude W [25].
Now, most of it exists in fragments, especially in Brazil. The Atlantic Forest contains different ecoregions with different biome categories. The area is a biodiversity hotspot [26]. It covers a wide range of climatic and edaphic conditions, with forest types ranging from rainforests to seasonal forests, including cloud, swamp and white-sand forests [27].
2.2. Dependent Variables
The three main fire metric variables used to quantify fire dynamics were fire density (FD), burned area (BA) and mean fire radiative power (mFRP, which is a proxy for fire intensity). The active fire data was obtained from the MCD14DL Active Fire Product, which combines MODIS Terra and Aqua satellite data at a 1 km resolution [28]. The field value FRP stands for the rate of fire energy released per unit of time using MODIS mid-infrared wavelengths as a measurement of fire intensity. It is increasingly used to qualify biomass burning to local and global carbon degrees [29]. In the project, the data was filtered by >70% confidence and TYPE = 0, which indicates vegetation fire. The MODIS Burned Area Product (MCD64A1) was used to measure the burned area of the Atlantic Forest at a 500 m resolution. Algorithms were applied to composite imagery from a vegetation index and temporal texture to improve the accuracy of fire detection [30]. The mFRP and FD variables were extracted from the MCD14DL Active Fire Product. Active FD is the count of the active fire points in each grid cell over the two decades. mFRP (MW∙km−2) was summarized from all fire pixels that occur in each grid cell in all years.
2.3. Predictor Variables
A total of 14 variables covering human impacts, forest fragmentation, climate and vegetation were retained as predictors of fire dynamics variation. All of these were sampled to a resolution of 1 km. The predictor variables and their sources are shown in Table 1.
The climate variables were generated from WordClim v2 ranges from 1970 to 2000 with a 1 km resolution. Average temperature, precipitation, solar radiation and water vapour pressure were presented as monthly mean values for these years [31]. The predictor was calculated by taking the mean value over all the months for the entire period.
The fragmentation variables were generated from the Hansen Global Forest Change dataset and MCD12Q1.006 land cover data. The forest cover data, mean forest patch area and forest length were generated from the land cover data with reclassification for land cover classes. Class values of 1–5 were taken as forest areas with the LC_Type1 attribute. The forest loss area was summed from 2000 to 2020 using the yearly loss data from the Hansen Global Forest Change dataset. Loss proportion represents the percentage of loss area in each grid cell and was used as the predictor. Fragmentation-related predictors including the number of patches, patch area and patch length have been found to be important drivers of fire in this biome [10].
Normalized Difference Vegetation Index (NDVI) and Enhanced Vegetation Index (EVI) variables were used as the vegetation variables from the MOD13A1.006 product at a 500 m spatial resolution. The algorithm selects the best possible pixel value from all the captures with low clouds, a low view angle and the greatest NDVI/EVI value [31]. Besides, the savanna cover and forest cover were calculated from the MCD12Q1 product as the vegetation cover variable. Although classes 1–5 were reclassified as forest cover, classes 6–7 were classified as savanna cover in 2020. The proportion of the loss area was calculated depending on each grid cell as the predictor.
Human modification data was obtained from the Global Human Modification Map. The Global Human Modification of Terrestrial Systems data set provides a cumulative measure of the human modification of terrestrial lands across the globe at a 1 km resolution. It is a continuous 0–1 metric that reflects the proportion of a landscape modified, based on modelling the physical extents of 13 anthropogenic stressors and their estimated impacts using spatially explicit global data sets with a median year of 2016. The anthropogenic stressors across all terrestrial lands, biomes and ecoregions account for the spatial extent, intensity, and co-occurrence of human activities to derive the potential magnitude of impact on terrestrial systems for a parsimonious list of stressors [32]. This identifies differences in terrestrial modification across biomes and ecoregions and strong variability within each.
2.4. Locally Weighted Scatterplot Smoothing (LOESS) Regression for Fragmentation and Fire Metric
The relationship between fragmentation and fire metrics could be characterized as the relationship between each fragment variable and fire variable. BA and FD were selected as the fire metrics. The scatter plots between these variables were used to visualize the relationship between them. Locally weighted scatterplot smoothing (LOESS) regression was used to fit the curve. The method involves locally fitting the function of the independent variables to estimate a wide class of regression surfaces [33]. The span variable used for the method was 0.8.
2.5. Mann–Kendall Analysis of Annual Fire Tendency
The nonparametric Mann–Kendall test was used to test for the trend that indicates monotonical upward or downward annual FD and FRP. The Mann–Kendall test is a common methodology for testing trends in time series data. The null hypothesis is that the data are independent and randomly arranged [34]. The significance level set for the test was 0.1.
2.6. Fire Occurrence Probability
We used the University of Maryland’s latest collection of MODIS active fire products (MCD14ML) [35]. Although the active fire dataset has a nominal spatial resolution of 1 km, it is capable of detecting flaming fires as small as 50 m2. The MODIS fire product includes the latitude and longitude of the fire pixels, the date and time of the fire detection, the FRP and the fire detection confidence level [36]. From the information layer of burned areas for the time period, stratified sampling was conducted, in which, for each class (burned area/non-burned area), the same number of points were taken (randomly). In the context of machine learning, mapping the probability of occurrence of a fire can be interpreted as a binary classification problem in which each pixel can be classified into two classes: fire or no fire. The fire class corresponds to the value of 1, while for the non-fire class, non-fire points were randomly chosen from the areas that did not burn during the study’s temporal range [23,37]. Of all the points collected, 70% were used for training and 30% for testing [23]. The prediction is set as a binary classification problem. Class labels 0 and 1 were used to represent the non-fire and fire classes, respectively. To further improve the accuracy of the model, a stratified sampling method was used on both the training and testing data to rebalance the sample size for each class. The prediction value for the model is in probability format and indicates the likelihood of fire occurrence.
2.7. Variable Selection
The correct choice of variables reduces the burden of irrelevant and redundant variables and improves the accuracy of the model [21,38]. The variable selection process was done in two parts. The first part involved using variance inflation factor (VIF) technology to quantify the severity of multicollinearity while applying an ordinary least squares regression analysis [39]. Multicollinearity occurs when two or more variables are linearly related, and this will influence machine learning performance [40]. A large VIF value (i.e., larger than 10) indicates the presence of multicollinearity and the variables should be removed [41]. Another method used for variable selection is Pearson’s correlation analysis. The Pearson technique has been demonstrated to be efficient when applied in forest fire modelling [21]. It is used to quantify the correlation between the predictors and the ability to predict the fire variable [42]. The correlation coefficients are scaled to range from −1 to +1 while 0 represents no monotonic association [42]. Correlations larger than 0.7 are considered to be a cause of distortion and influence model performance [40].
2.8. Machine Learning Models
An RF model was used to predict fire regimes and to identify the main drivers. It is a combination of decision tree predictors with each tree making predictions on randomly sampled values under the same data distribution in the forest, and this model has been approved for its ability to reduce generalization errors [43]. The algorithm is implemented in the randomForest package in R. The main hyperparameters used in the model were the number of decision trees (ntree) and the number of randomly sampled variables at each division (mtry) [44]. Cross-validation was used to validate the model and prevent overfitting. Ten-fold cross-validation was applied to 9/10 of the training data and 1/10 of the testing data with 10 times processing. It was combined with the grid search method to identify the optimal hyperparameters of the model and optimize the accuracy rate. The value used for tuning the ntree parameter ranged from 100 to 1000 with steps of 100, and the mtry was set to 2 to 5. The mechanism was implemented by the ‘tune’ function in the e1071 package in R, which is used to identify the optimal combination of parameters depending on the accuracy rate [40].
2.9. Performance Assessment of the Fire Occurrence Probability Model
The testing data consists of 30% of the original data that was not used in the training process. It would be accessed by comparing the prediction class to the real class using the ‘roc’ function in R. The receiver operating characteristics (ROC) curve plots the changes in true prediction rates (TPR) against false positive prediction rates (FPR), with the area under the curve (AUC) representing the accuracy rate [45]. The AUC was the performance metric for the model. The RF model provided variable importance after training. The mean decrease in accuracy (MDA) reveals the importance of each variable used in the model. It is a measure of the change in accuracy rate from the variable’s original distribution to random choice [46]. The MDA metric enables the direct observation of the importance of each variable and its correlation to the fire class. It can be directly calculated through the ‘importance’ argument of the training function in R. Creating a partial dependence plot is an alternative way to explore and interpret the relationships between predictor variables and predicted classes [47]. The partial dependence could depict the relative logit contribution of the prediction variables to class probability [48]. The marginal effect for each predictor variable was plotted using the partial dependence plot (PDP) package in R.
2.10. Probability of Fire Occurrence Map
The predictions from the model with the best result were used to predict the fire occurrence probability in the Atlantic Forest. Because the result was in the format of probability values that range from 0 to 1, it could be used as the continuous value in each grid cell to form the fire risk map. The natural breaks method can be used to categorize the predicted values. The class splits were chosen such that the resulting groupings are as close as possible and the disparities between classes are minimized [49]. In the project, fire probability was divided into five classes. The class boundaries were determined using the natural break method.
2.11. Code Metadata
The workflow occurred in the macOS Catalina version 10.15.7 operating system. The raster data were all downloaded and processed through Google Earth Engine (GEE) and QGIS software. GEE is a cloud-based platform that enables users to use high-performance computing resources to process massive amounts of geospatial data without being constrained by the limitations of a local system [50]. QGIS is a free and open-source geographic information system, and QGIS 3.6.10 was used in the project. Some of the geospatial data were obtained from the GEE platform. All the raster data was manipulated in QGIS to extract information. The LecoS plugin in QGIS was used to extract the forest edge length and forest patch area. The workflow used to extract the information was mainly based on the GEE and QGIS.
The coding language used in the project was R 4.1.0, and the platform I used was R Studio. R script was used to process data and apply algorithms. Despite the default library, several packages were used in the process. The ‘dplys’ package was used for data processing, the ‘ggplot2,’ ‘ggcorrplot’ and ‘gridExtra’ packages were used to plot images of analytical results. The ‘Kendall’ package was used for Mann–Kendall analysis, and the ‘car’ package was used for the VIF test. The ‘randomForest’ package is a powerful package for constructing RF models. The ‘pROC’ package was used to evaluate the ROC curve and accuracy values of the models. The ‘pdp’ package was used to create the partial dependency plot. The ‘BAMMtools’ package was used for the natural break algorithm.
3. Results
3.1. LOESS Regression between Fragmentation and Fire Regime
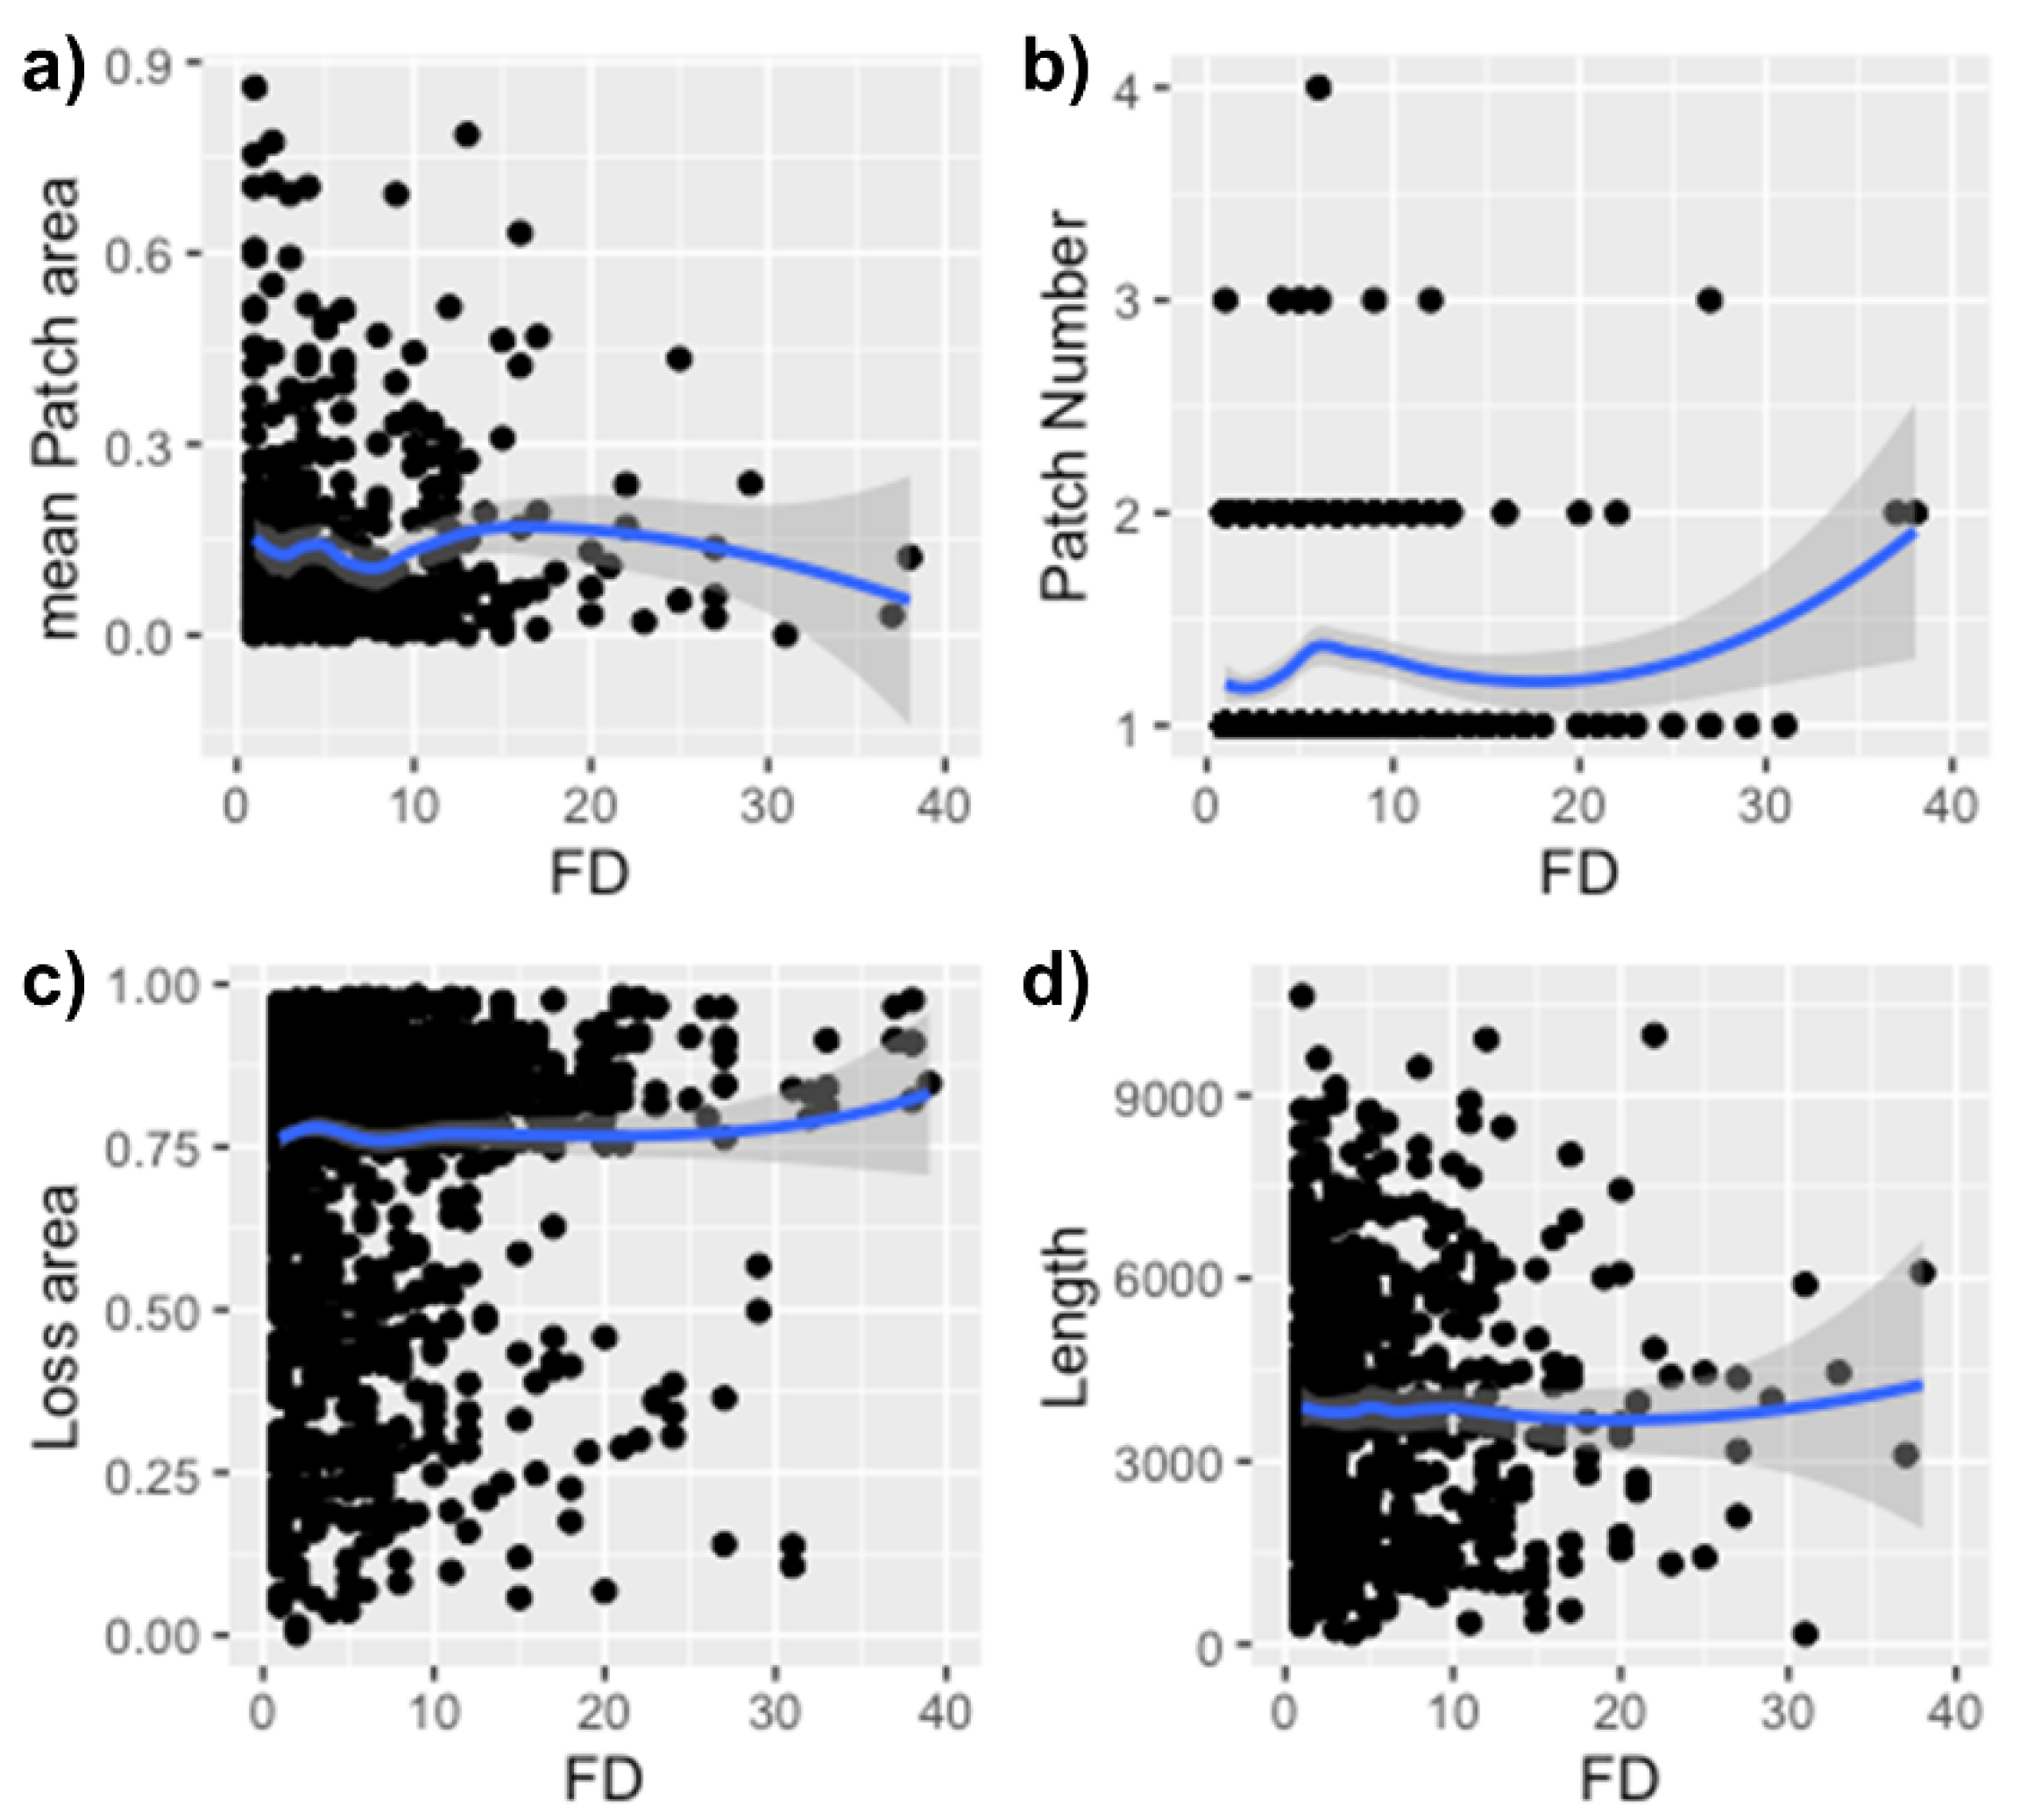
The relationship between fragmentation and fire regime variables (FD and BA) is shown in Figure 1. The results reveal different patterns with different fragment variables and FDs in the forest area. The test depends on FDs between 0 to 40, which comprises the majority of the FD data. The outliers were removed to guarantee that the fitted curve estimated through LOESS regression could properly reveal the trend. A weak association between patch number and FD is observed in Figure 2. Loss area and forest edge length rise slowly while FD increases.
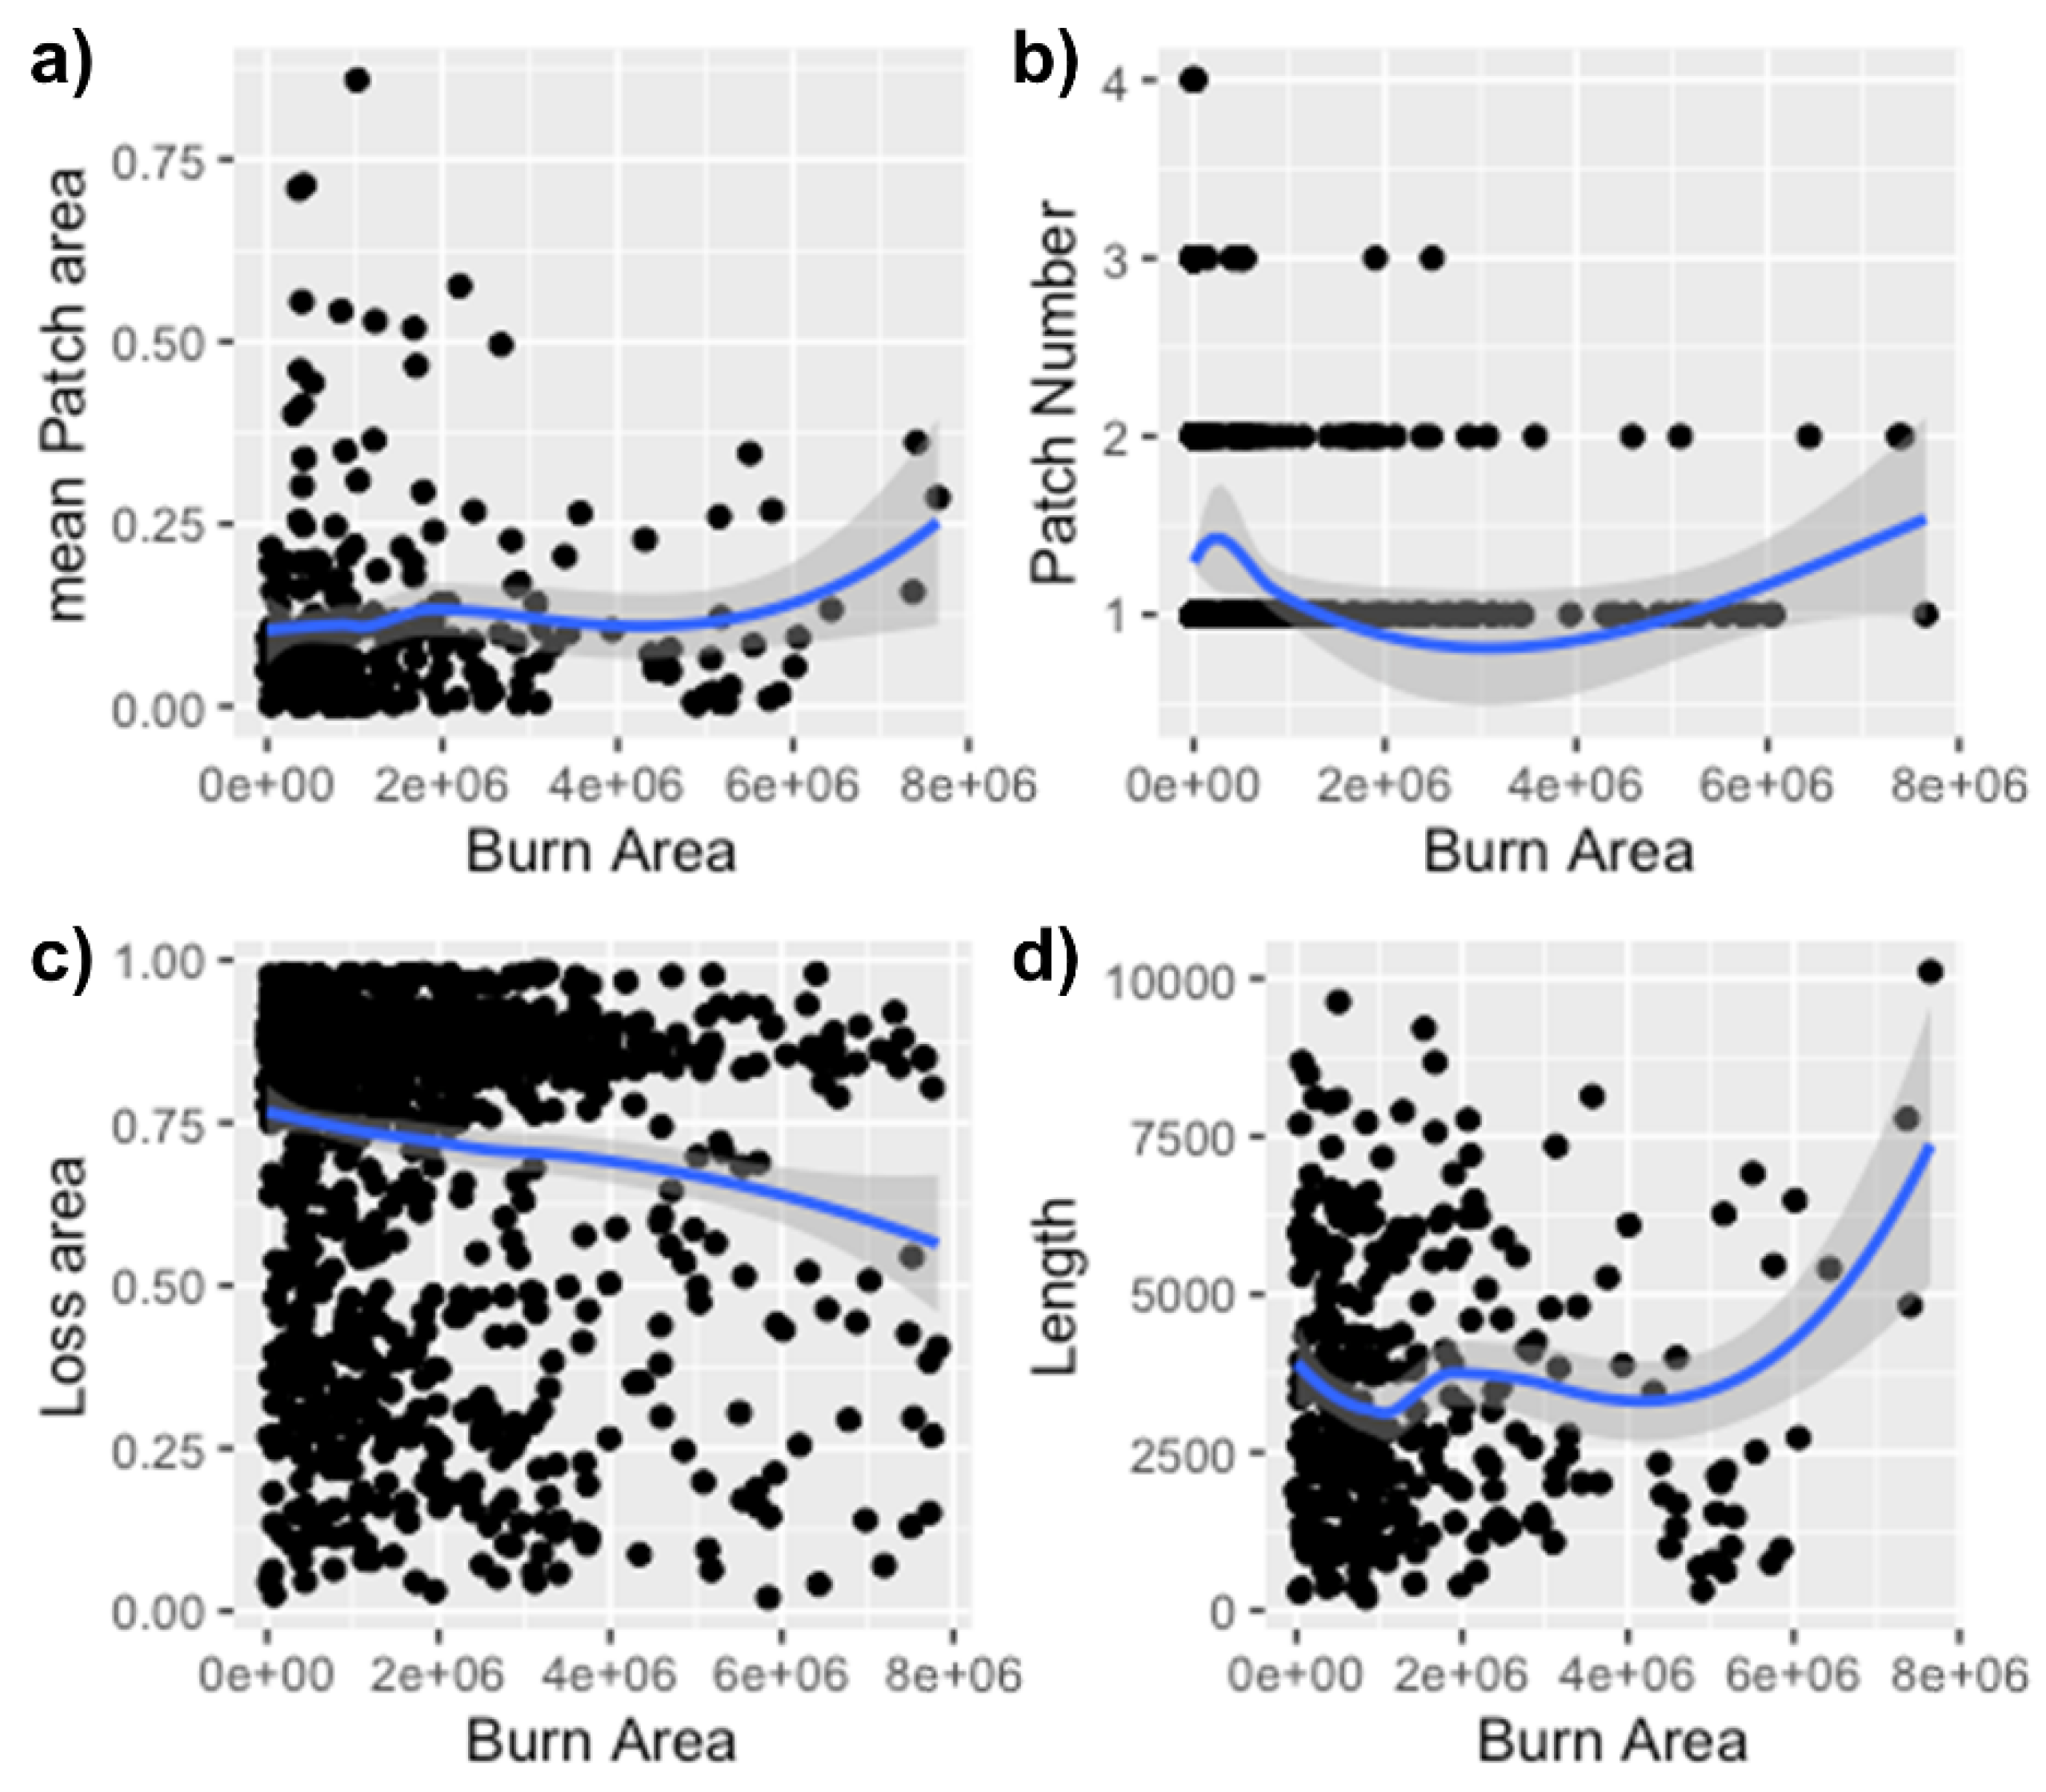
Figure 2 shows the relationship between the fragmentation metrics and the BA. The mean patch area increases when the BA is over 200 ha and increases more sharply after the burned are reaches 60 ha. PN has a negative relationship with BA. Loss area declines smoothly as the BA increases. The forest edge length increases sharply when BA is larger than 400 ha.
3.2. Temporal Trends: Mann–Kendall Test Results
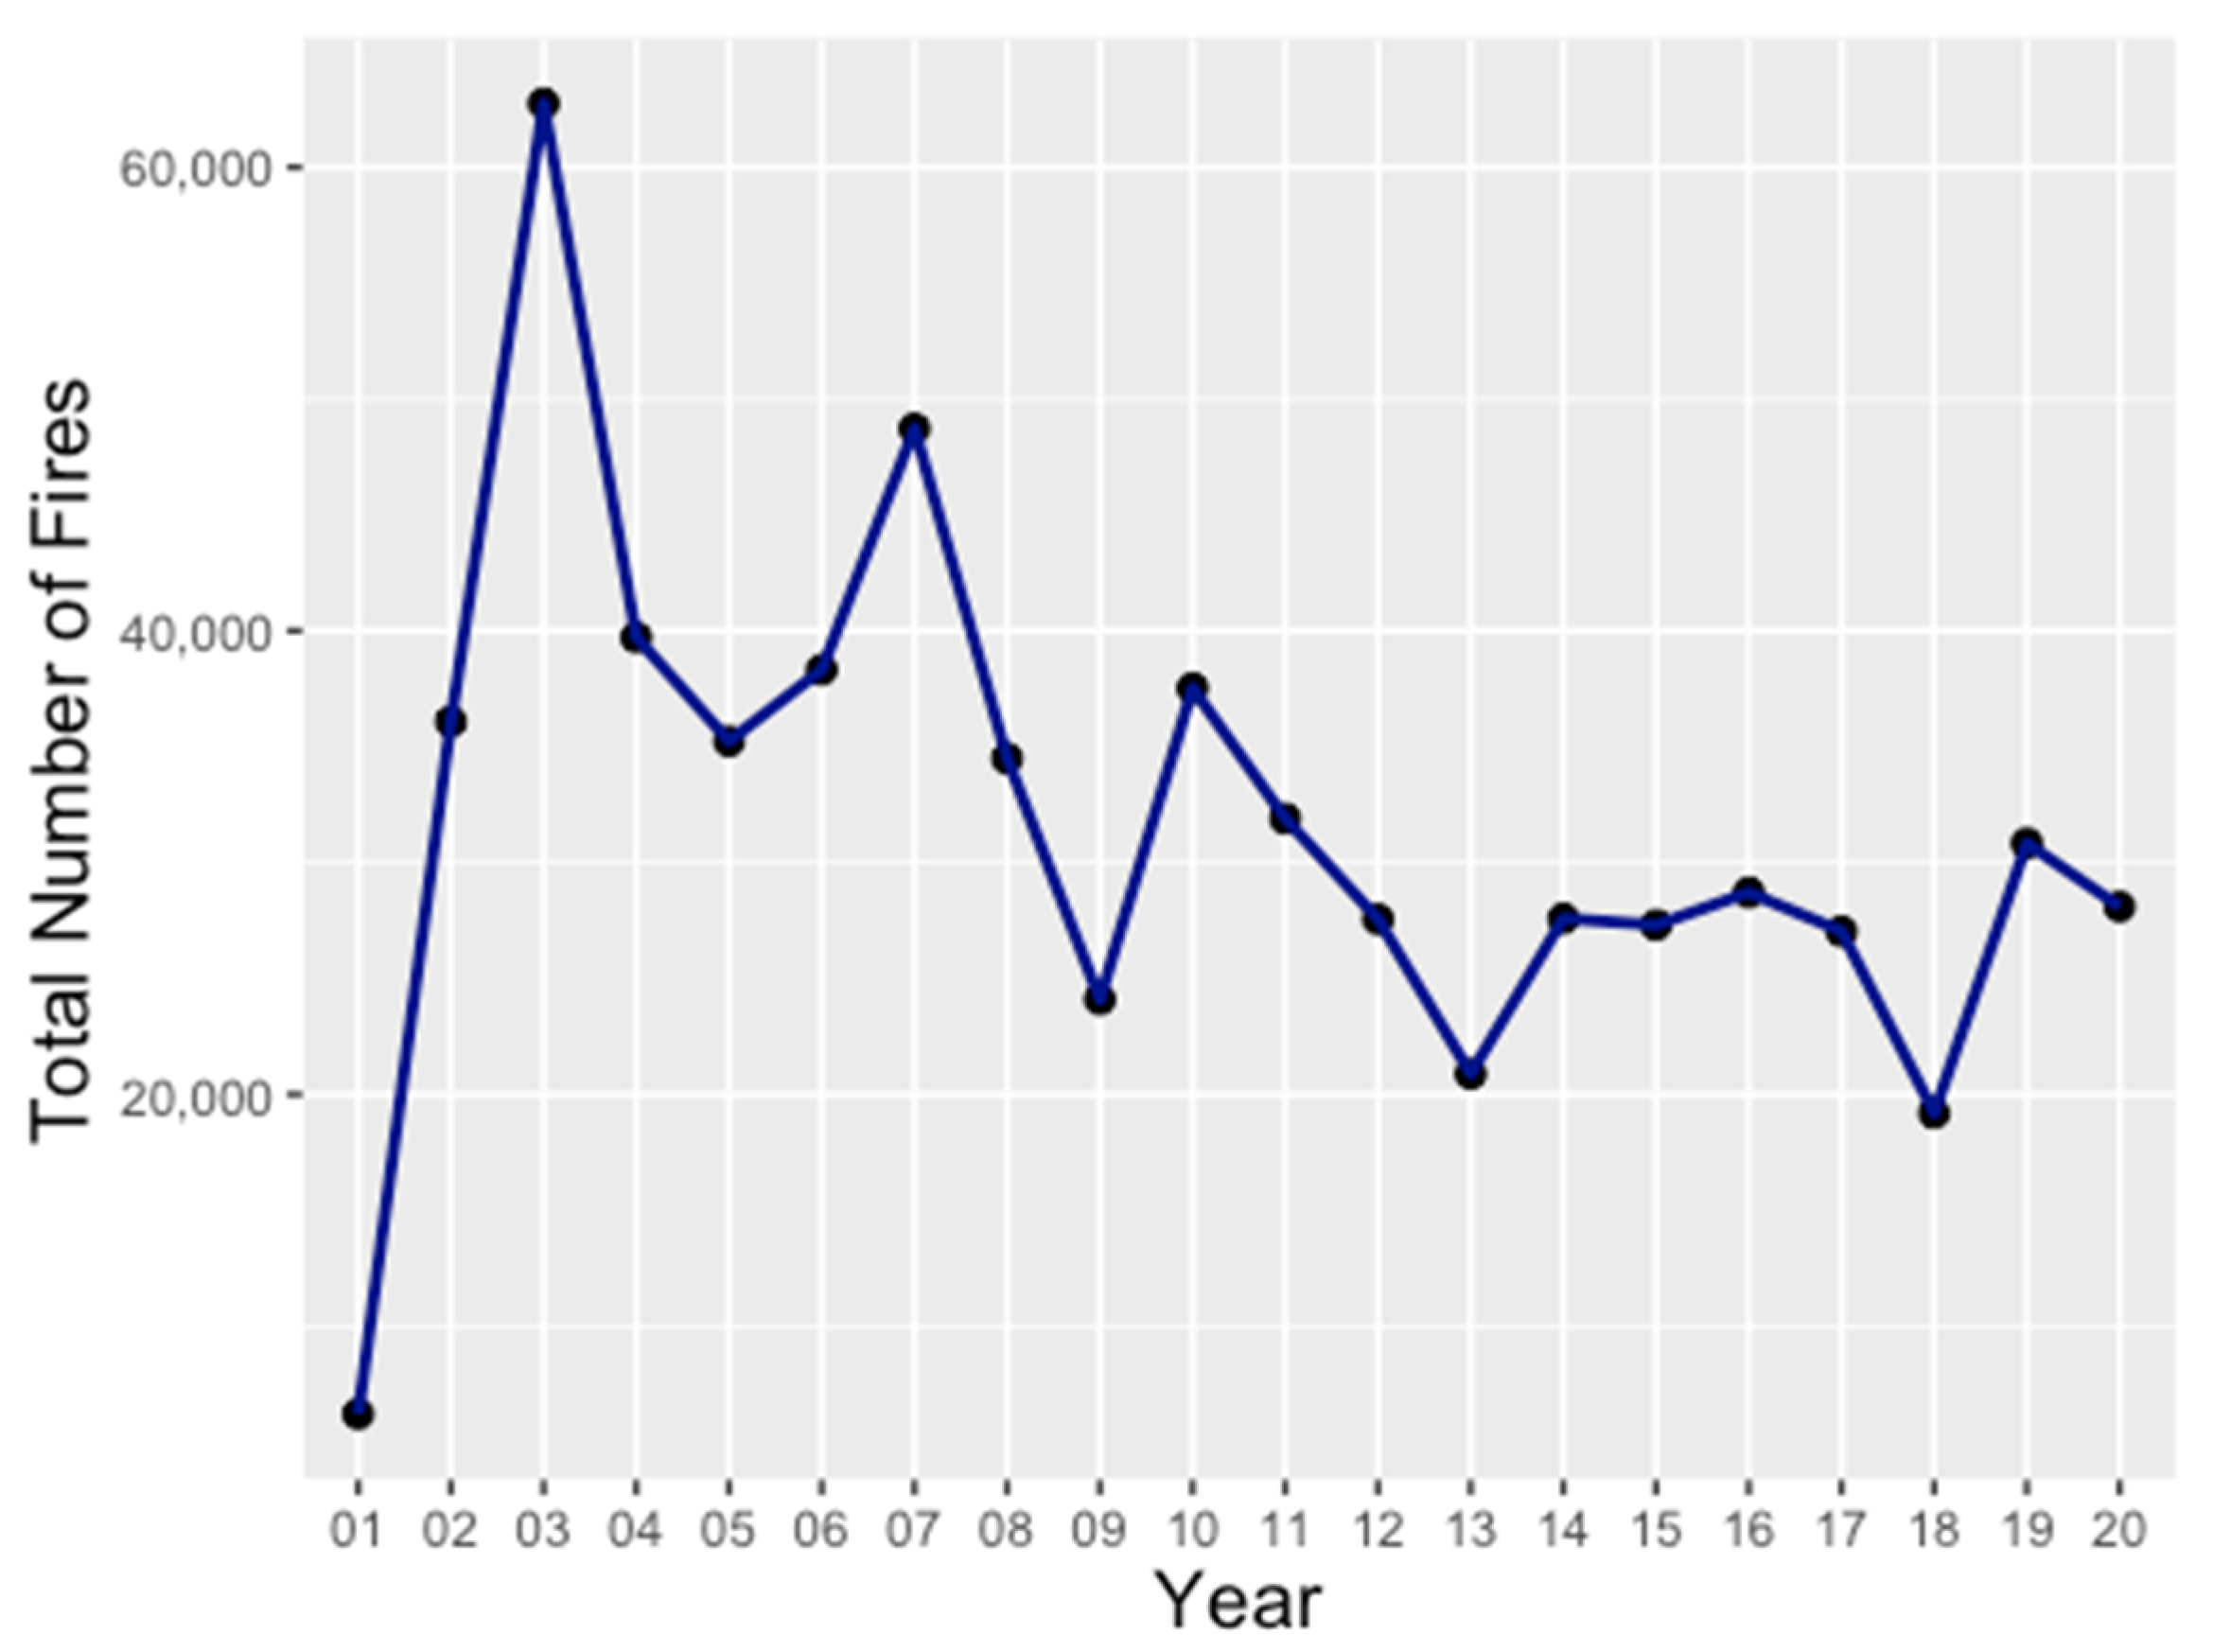
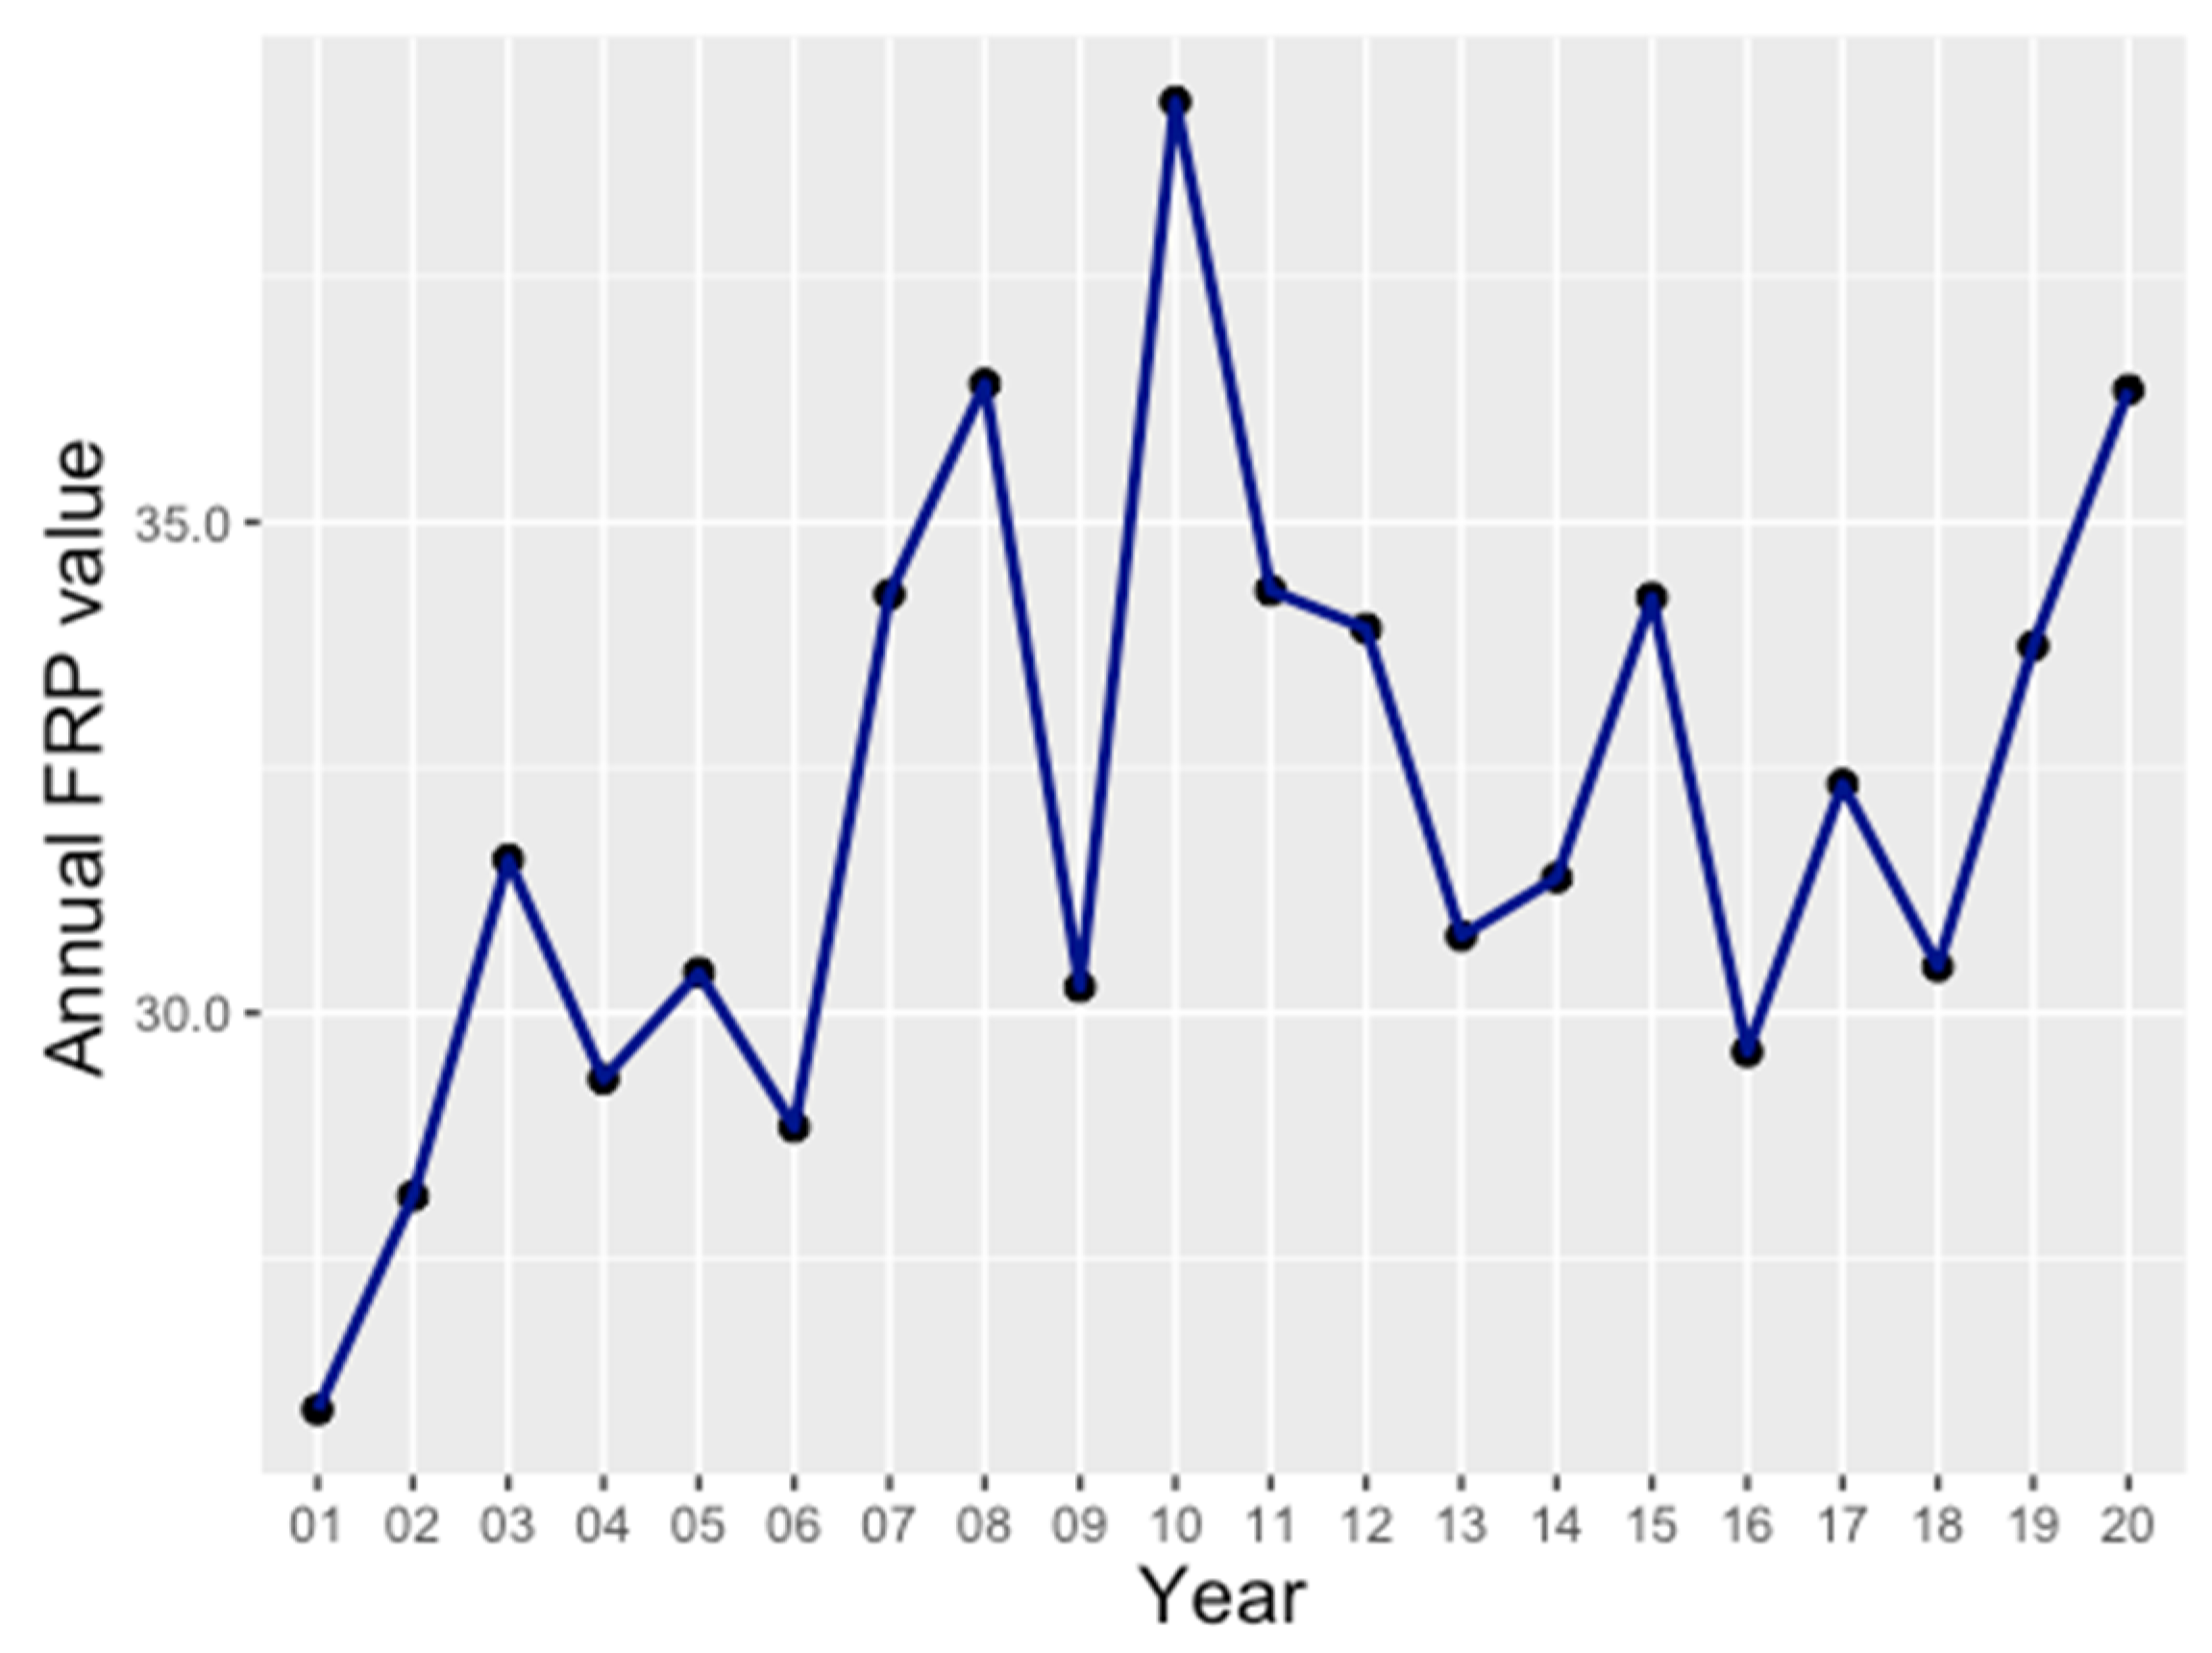
Figure 3 and Figure 4 reveal the variation in annual FD and annual FRP value in the Atlantic Forest from 2001 to 2020. There was an increase in both FD and FRP values from 2001 to 2003. In 2003, FD reached its peak value while the largest FRP value was in 2011. From the plots, it can be concluded that in the Atlantic Forest land area, there is a weak negative trend of FD while the mean FRP value had a slightly upward trend.
The Mann–Kendall test revealed that the annual FD is tau value −0.368 with a p-value of 0.025, which confirms the negative trend in the area during the considered two decades. For the mean annual FRP, the tau value is 0.4 with a p-value of 0.014. The mean annual FRP had an increasing trend from 2001 to 2020, indicating an increase in fire intensity.
3.3. Fire Risk Prediction Results
3.3.1. Variable Selection Results
The results for the VIF values are shown in Table 2. The results show that NDVI and EVI have the largest VIF values, which exceed 10. The other variables have VIF values lower than 5.
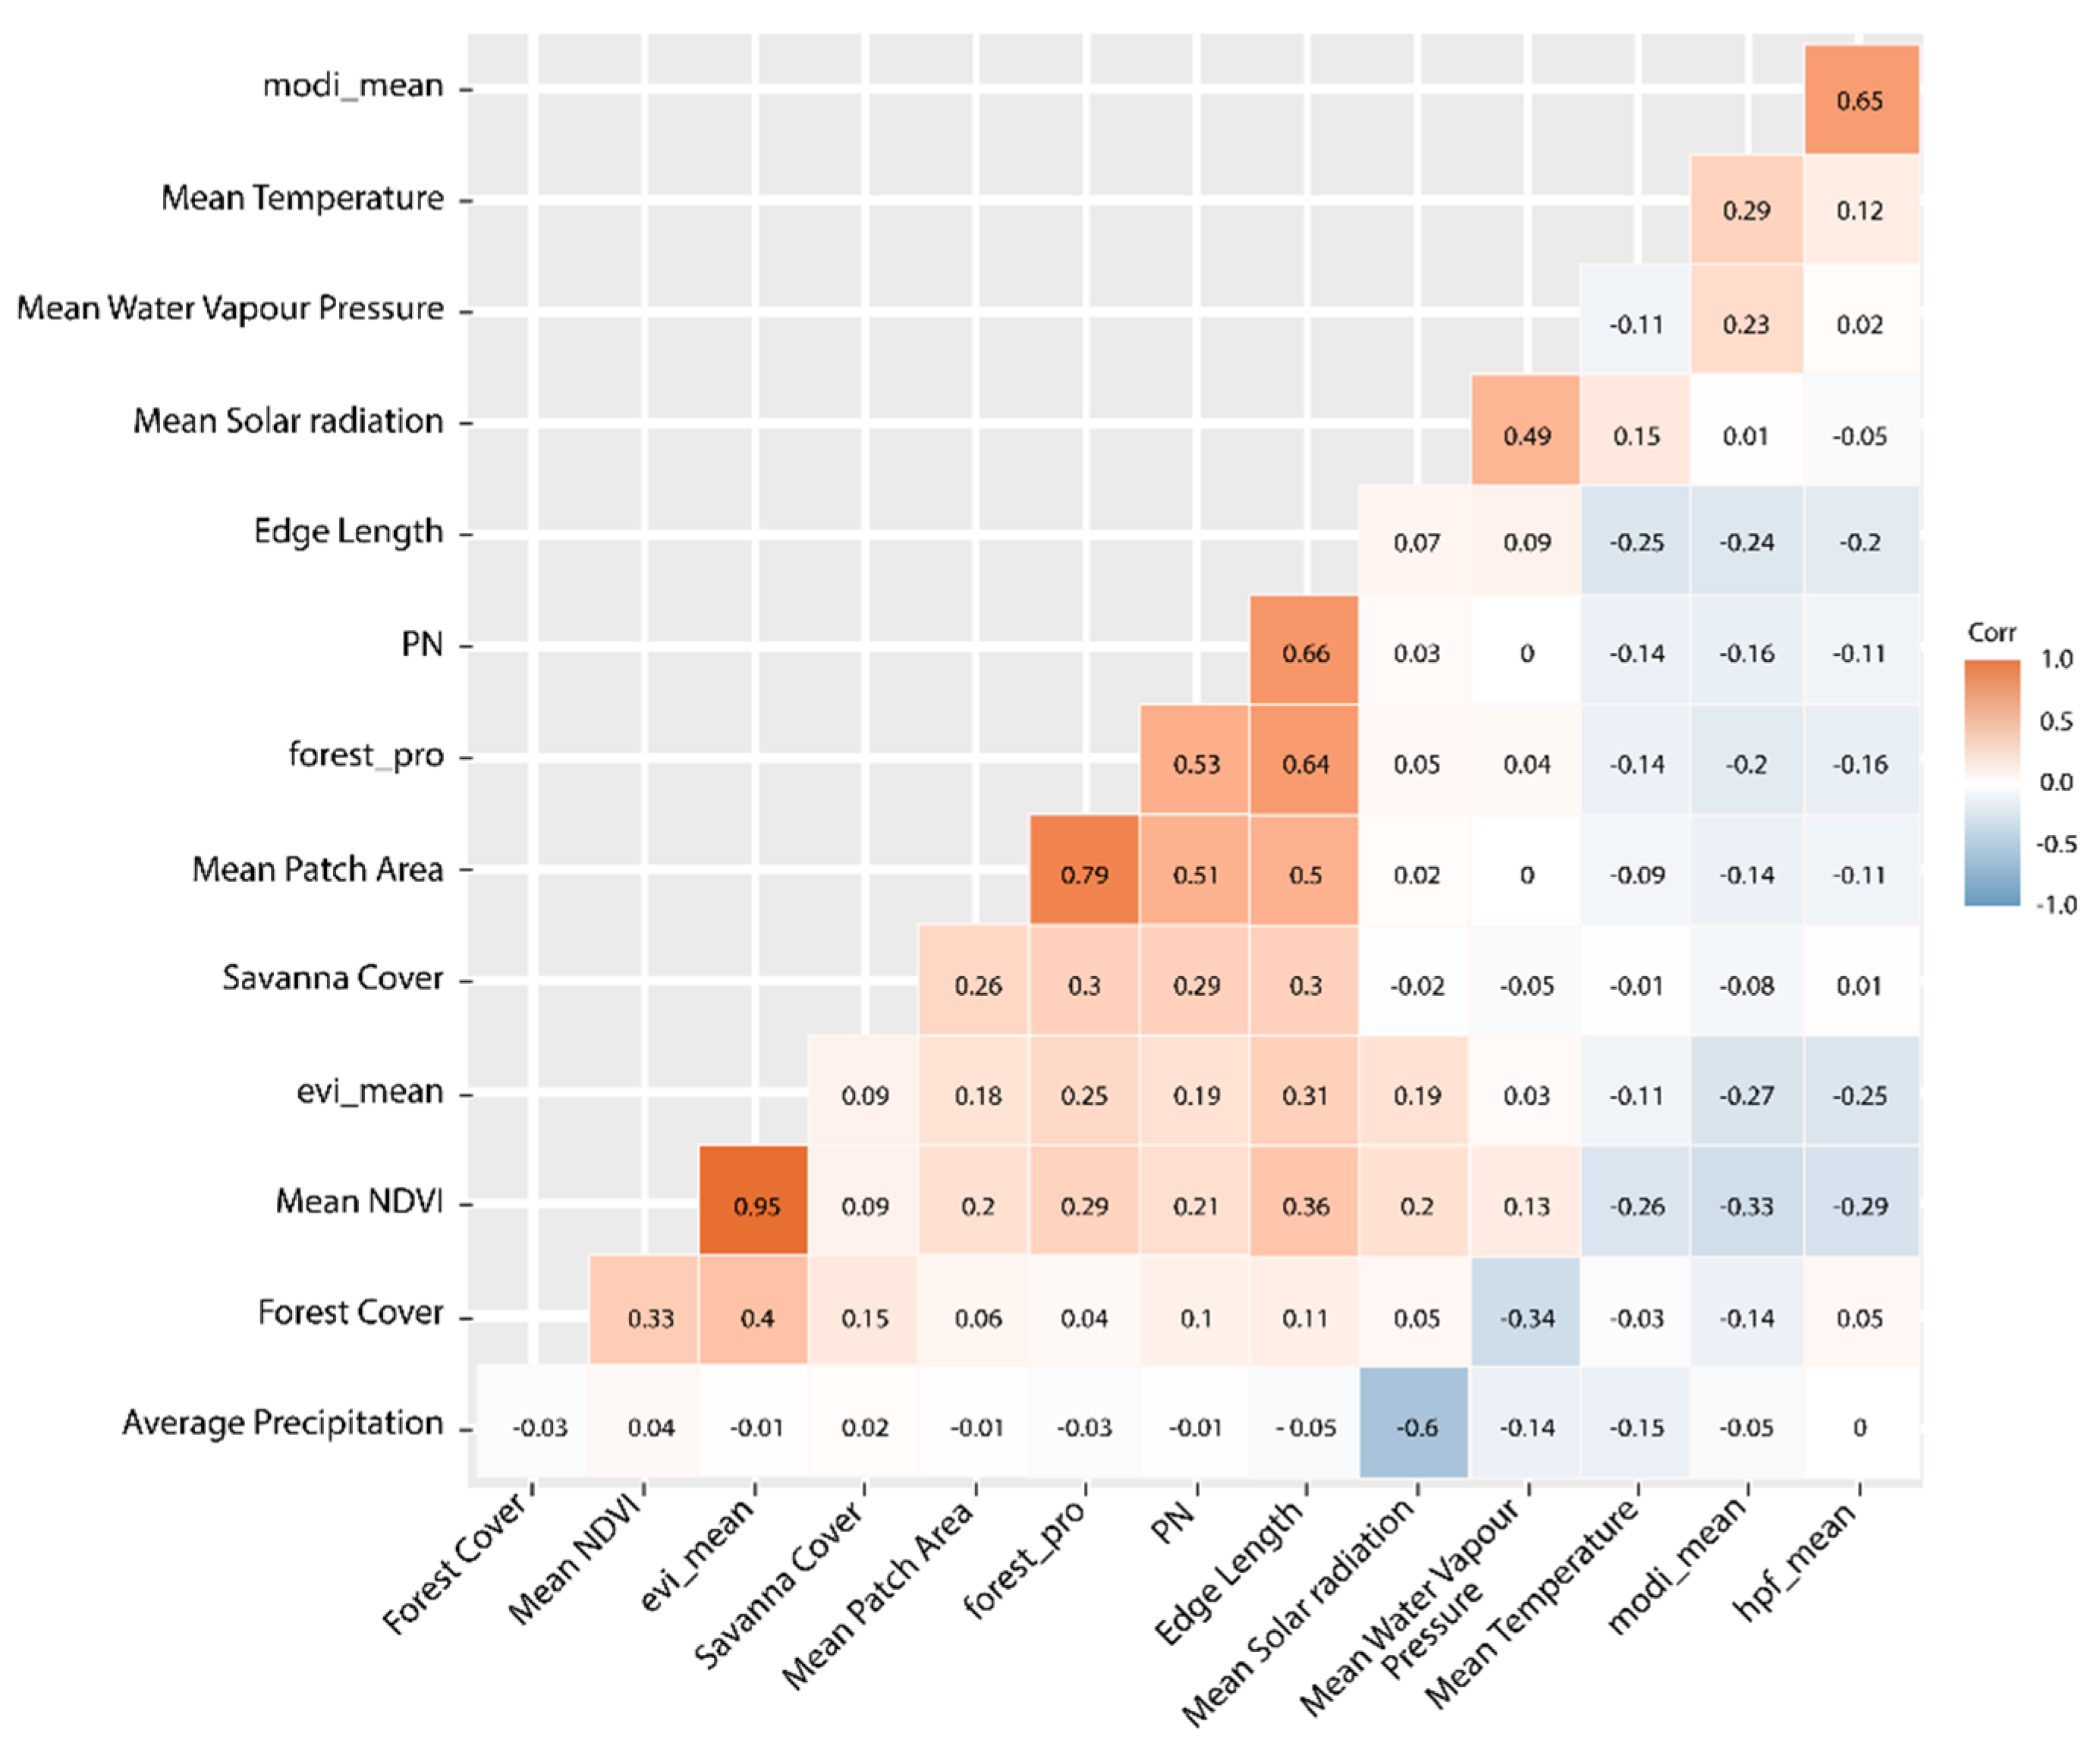
Figure 5 indicates that there is a strong positive correlation that exceeds 0.9 between the NDVI and EVI variables. Besides, the correlation between forest area and mean patch area and forest edge length also exceeds 0.6. The hfp value also has a positive relationship with the human modification variable. Considering the result of the VIF test, the EVI mean, human footprint value, forest area proportion and patch number were removed from the predictors.
3.3.2. Model Performance and Predictor Evaluations
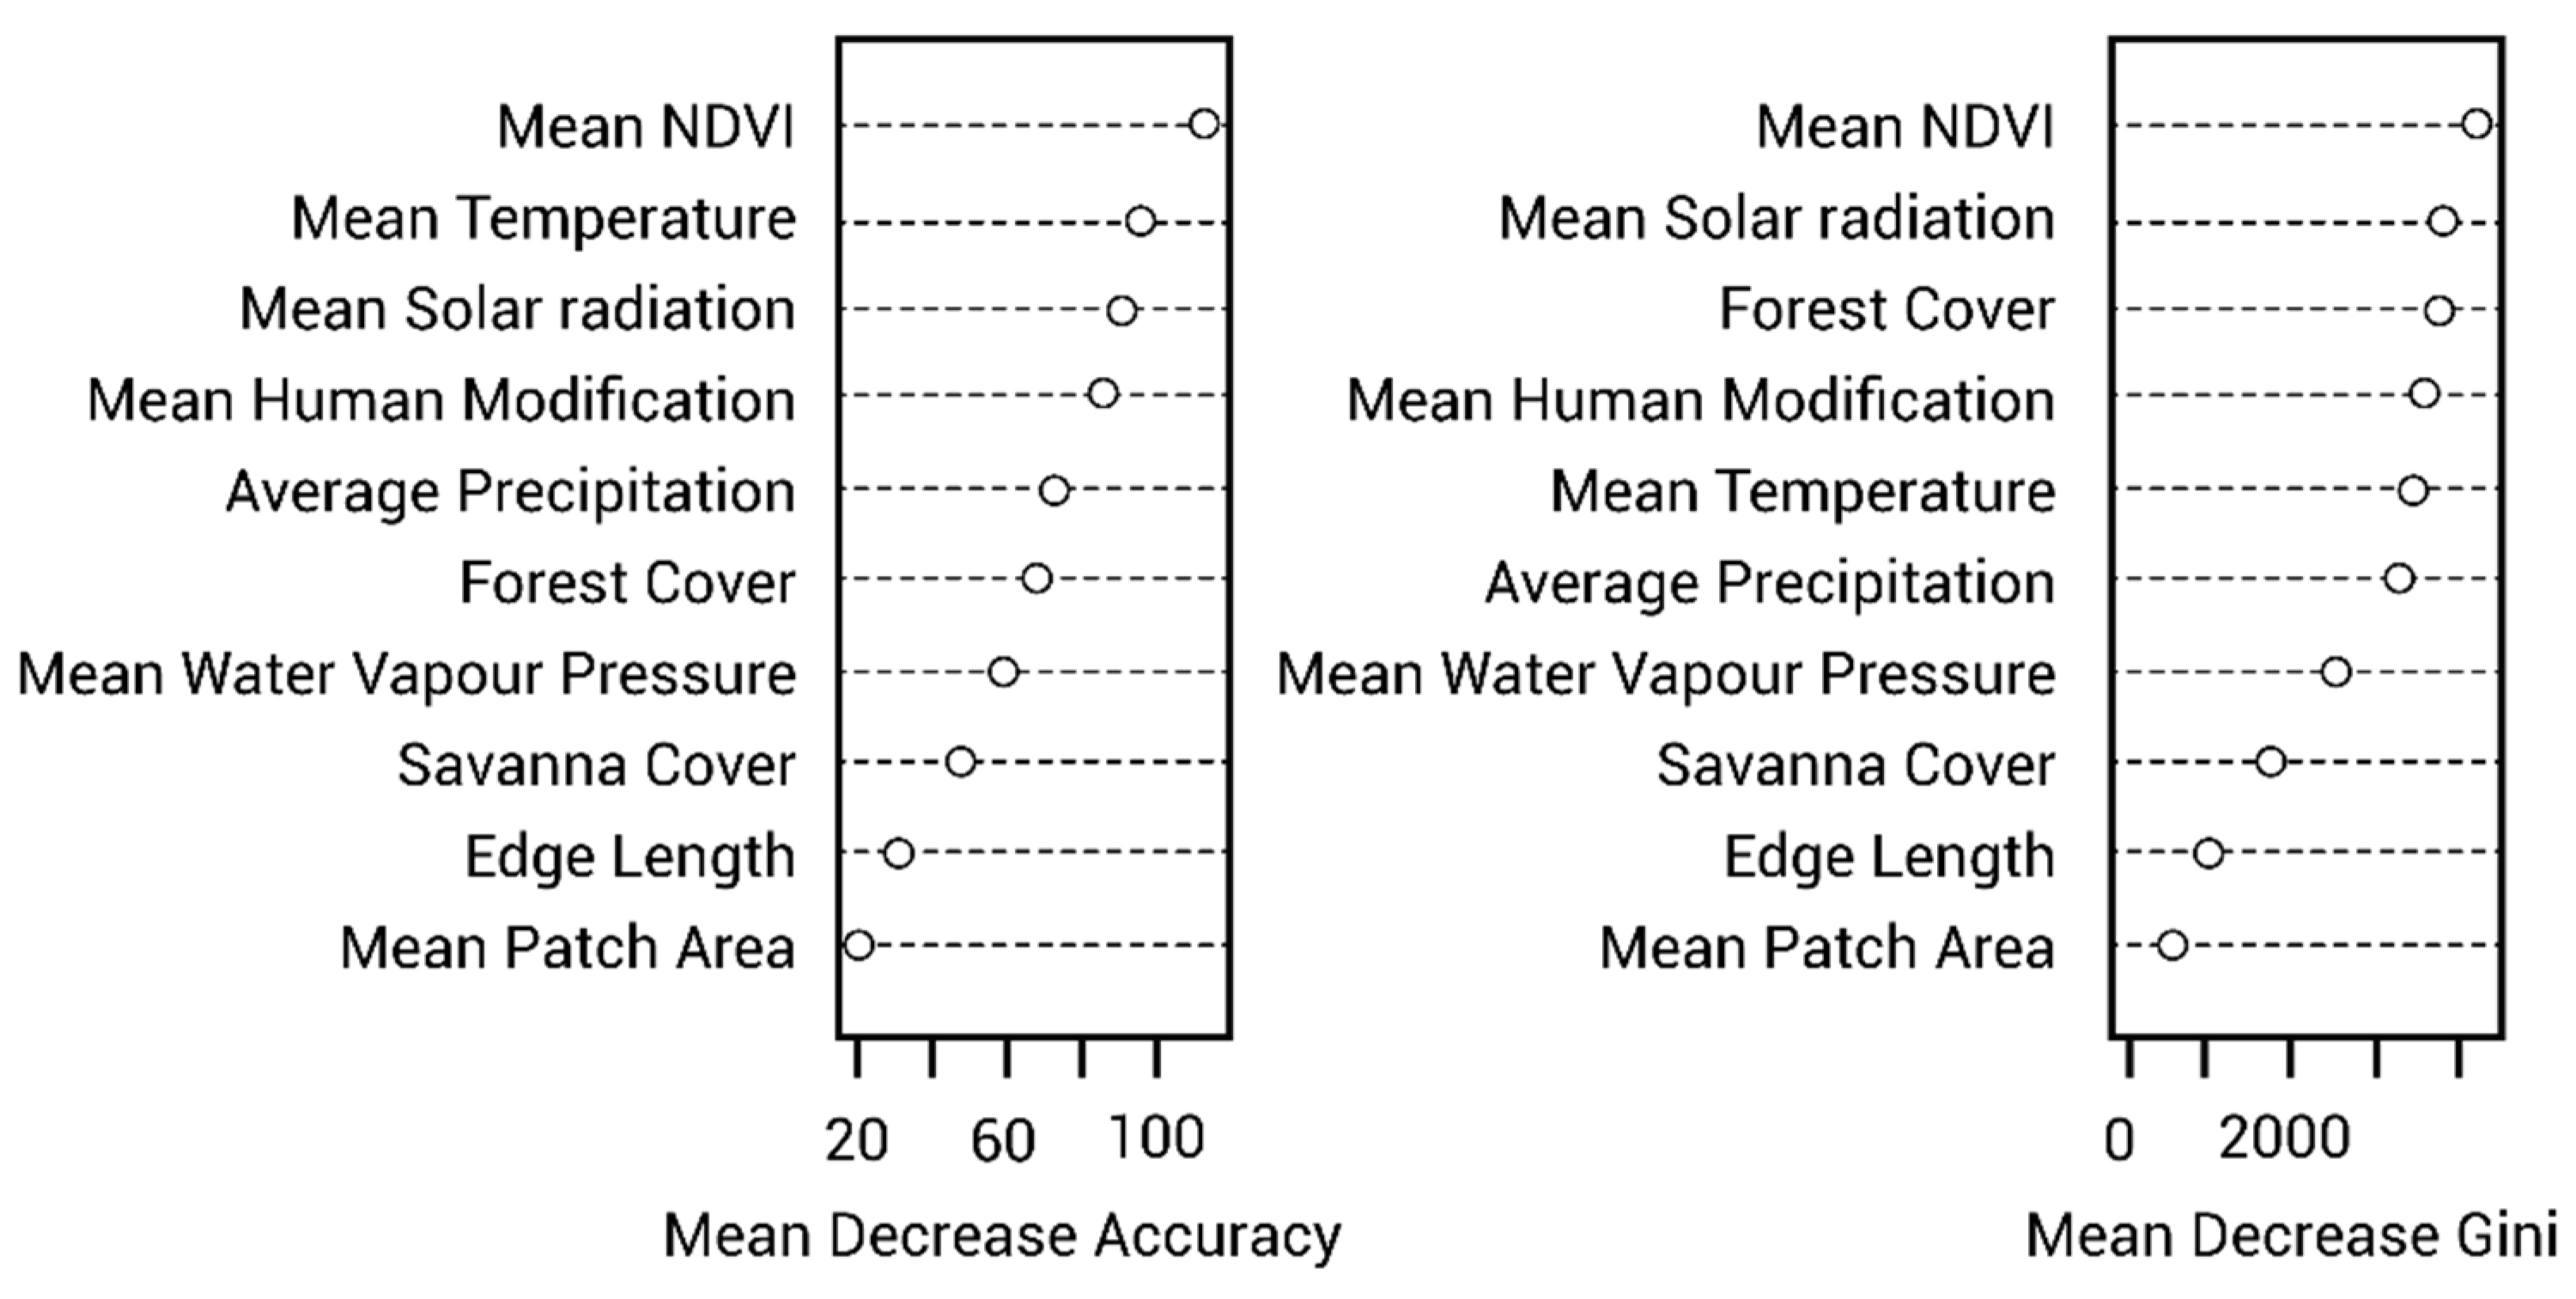
With the grid search, the RF algorithm reaches the best result when mtry = 2 and ntree = 300. The prediction result shows that the AUC rate of RF for predicting fire occurrence is 0.83. The mean decreased accuracy for predicting FD is shown in Figure 6. Among the MCD values, the most important value is NDVI mean value, followed by temperature mean, solar radiation mean and human modification mean.
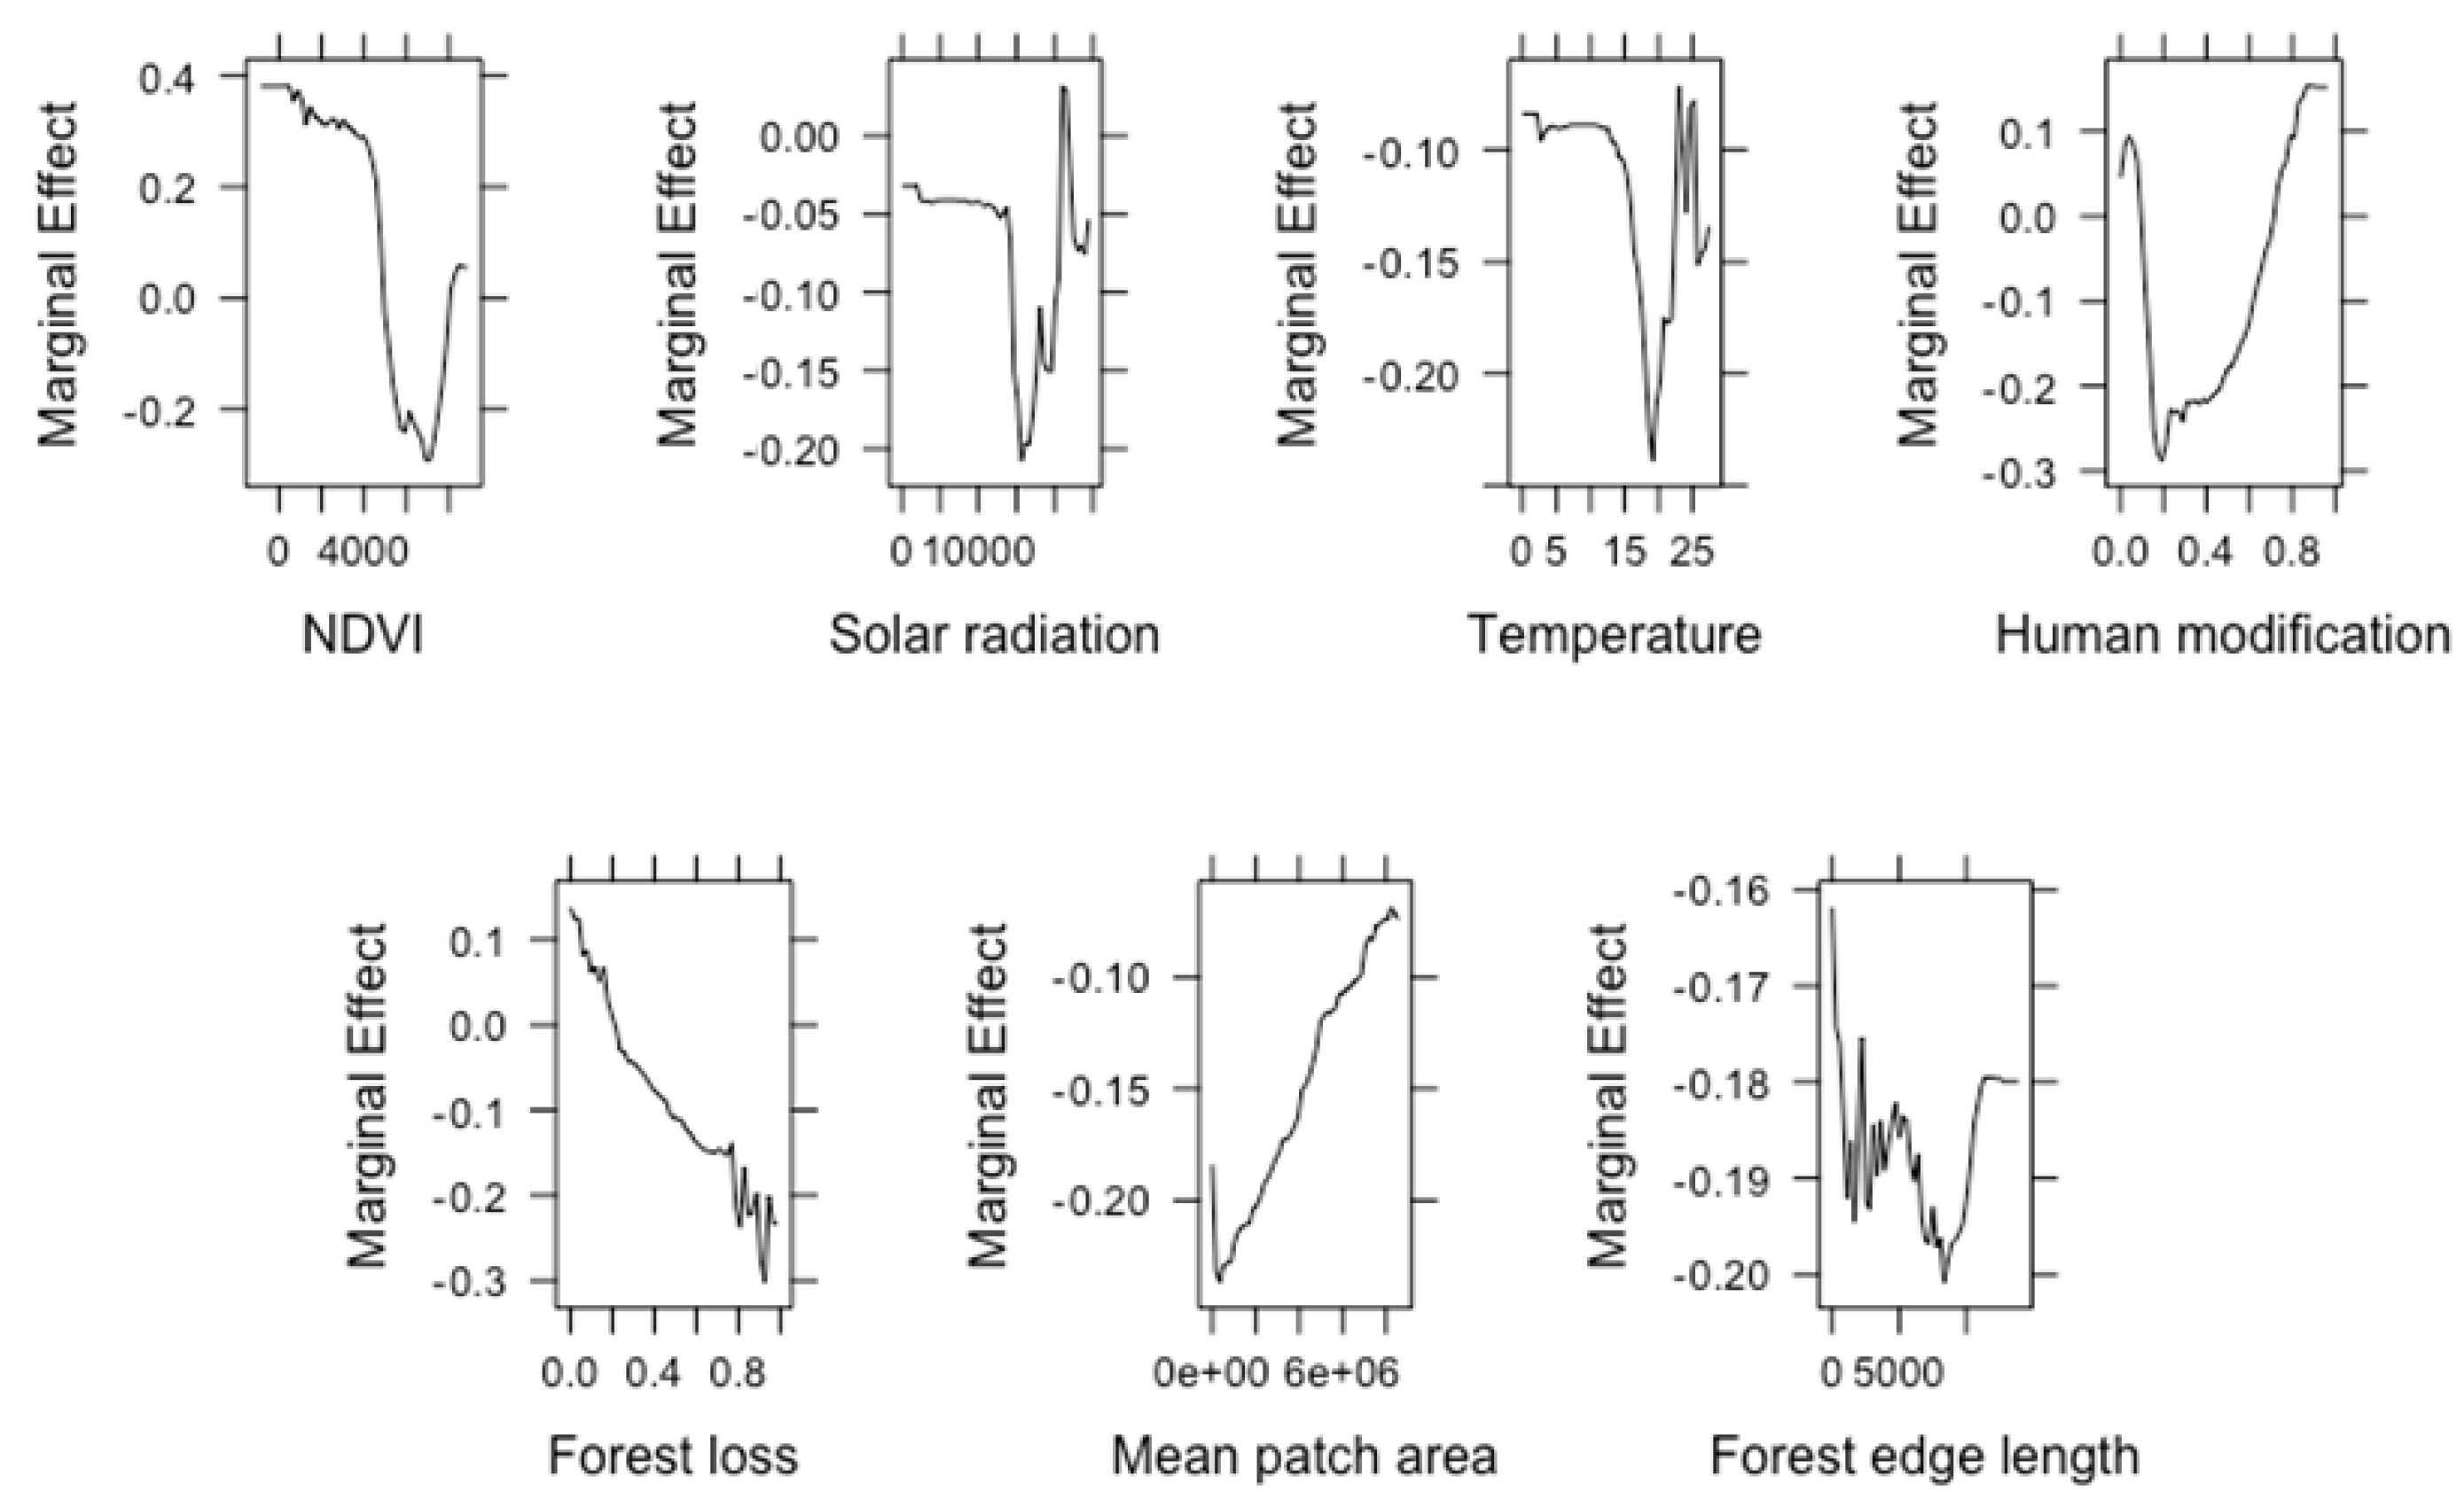
The partial dependence plot for the most influential variables and fragmentation variable is shown in Figure 7. The marginal effect depends on Class 0, which is a non-fire class. A positive value on the y-axis represents a high probability to predict the non-fire class than a negative value. Among the four most important predictors, NDVI has a negative relationship with Class 0 when it is less than 7000 and increases after 7000. The probability of Class 0 has a nonlinear relationship with solar radiation, which is similar to the temperature trend. Human modification has a positive correlation with the marginal effect when the value is over 0.2. The fragmentation variables used in the RF model were forest loss, mean patch area and forest edge length. Meanwhile, forest loss is the third important variable in the model, and it is negatively related to Class 0, which indicates that land with a large proportion of loss area is likely to be predicted as Class 1. The mean patch area has a positive relationship with Class 0, and low patch area values have high probabilities to be predicted as Class 1. The forest length has a nonlinear relationship. The probability for predicting Class 0 is negative, which shows that the data points with forest loss are prone to fire.
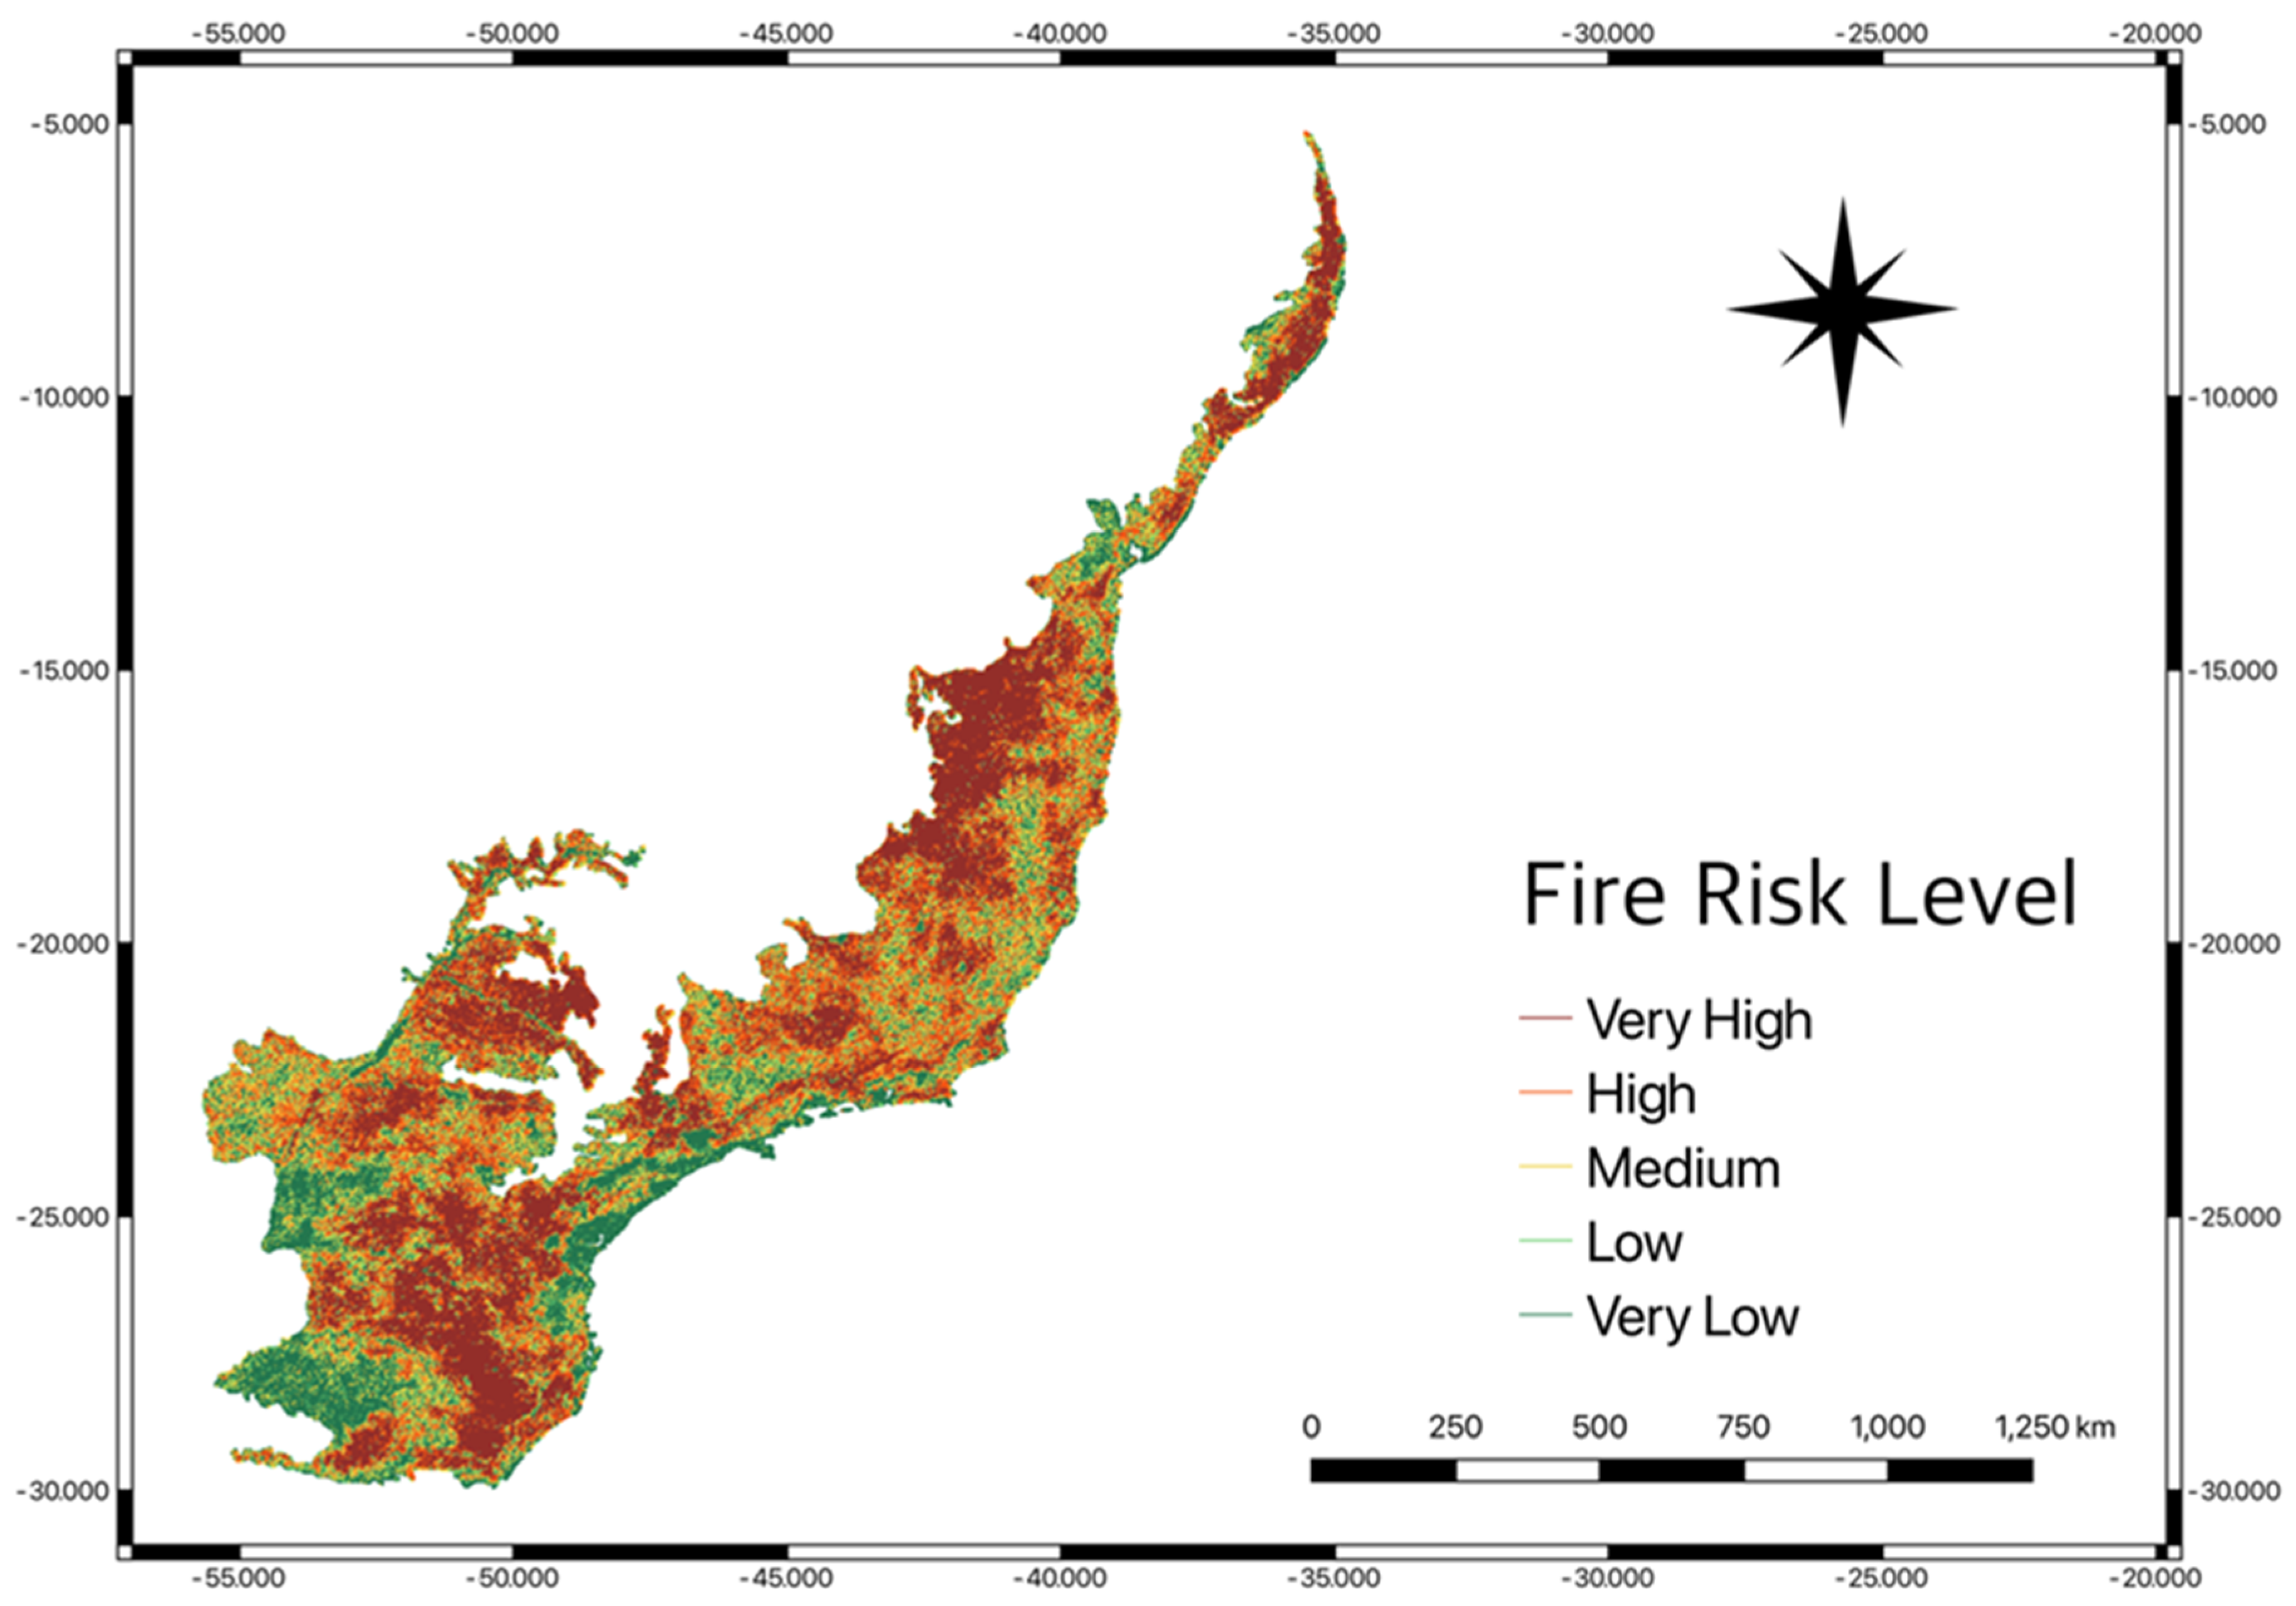
The fire occurrence probability/risk map reveals the predicted values from the RF model by presenting the probability of fire occurrence in each pixel in the Atlantic Forest area as shown in Figure 8. Values of 0–0.18 represent a very low fire risk, values of 0.18–0.41 represent a low fire risk, values of 0.41–0.64 represent a medium fire risk, values of 0.64–0.82 represent a high fire risk and values of 0.82–1.0 represent a very high risk. The fire risk map is shown in Figure 8.
Most of the Atlantic Forest is at a high risk of fire occurrence and very high-risk areas seem to be distributed both around the edges and southern part of the biome.
4. Discussion
4.1. Relationship between Forest Fragmentation and Fire
The result of the LOESS regression suggests that the fragmentation partly explains the variation in FD and BA. The partial dependency plot of the RF model for the fragmentation variables reveals the relationship between forest patch, loss area and fire. The result indicates that fires are most likely to occur in highly fragmented landscapes. The existing body of research has also identified that forest fragments, especially small forest fragments, are more vulnerable to forest fires in the Brazilian Atlantic [3,10]. The number of forest patches, mean forest patch area and forest loss proportion were previously to have a strong association with forest dynamic patterns such as fire density in tropical forest ecosystems such as the Central Brazilian Amazonia and the Atlantic Rainforest [10,51].
The result follows the conclusion that repeated forest fires lead to fragmentation and increase the forest length [52]. Fire-induced forest fragmentation always has a negative influence on habitat conditions on the patch scale [53], making these fragments vulnerable to future fires. Due to their poor humidity retention, high temperatures and increased exposure to dry air masses, fragmented forests are drier than areas with continuous forest cover [54]. The dry state would result in a significant fuel load and increase the vulnerability of the forest to fire [55]. In a hyper-fragmented landscape, there is a significant change in the size structure of tree assemblages and a reduction in the number of large trees [2]. The loss of large trees can lead to increased herbaceous/shrub vegetation and fine fuels, which is related to increased active fire detection [48,56].
From 20 years of observations in the Atlantic Forest, forest fragmentation was found to partly influence the fire regime: increased fire has a negative effect on fragmentation and biotic response in the forest area [53]. The relationship between fragmentation and fire is uncertain on account of the different situations and because fire and forest fragmentation interact in a complex way. Many factors can influence the fire regime in a certain area, such as climate, human modification and vegetation type. The magnitude of anthropogenic influence has been identified as an important fire driver in the Brazilian Atlantic forest [3]. To comprehend the spatial patterns, causes and ecological impacts of fire, various components of the fire regime must be examined [57]. This knowledge is essential when developing strategies for combating dynamic natural fire in the future.
4.2. Main Drivers of Forest Fires
The RF result demonstrates the importance of the NDVI value for affecting the fire regime. The NDVI value is used to calculate the vegetation cover. It represents the vegetation greenness level that influences the fire risk [58]. Our findings indicate a high vegetation cover index results in low FD. It may be inferred that unaffected natural forests are less vulnerable to fire than other forest types and the fire resistance of undisturbed tropical rainforests is borne by existing research [59]. The retention of transpired moisture and the trees providing the majority of the forest humidity contribute to this resistance. We also discovered that the climate variables of temperature, precipitation and solar radiation also play an important role in influencing fire dynamics. The importance of temperature and precipitation in influencing fire regimes is well established [3], especially in the context of the Brazilian Atlantic Rainforest. Temperatures higher than 22 degrees C and lower than average precipitation were identified as major fire drivers in the south-eastern part of the Brazilian Atlantic Forest [3]. The relationship could be considered to be the result of the correlation between temperature and fuel humidity [60]. High temperatures result in high evaporation and a decrease in moisture content, which increases the probability of ignition [61].
4.3. Limitations
The lack of temporal discussion is a limitation of the analysis. Fragmentation tends to have a stronger correlation with fire intensity in dry seasons/years [55,62]. The distance to the forest edge would also be a reasonable variable for investigating the relationship between forest fires because of the greater amount of fuel available at the forest edge than in the forest centre [62]. Besides, neural networks have also been applied to predict fire risk in many cases and have been proven to be efficient [21,22,63] and could be tested for future studies. The results of the present study may have been improved through studying the temporal shifts in fire occurrence risk and identifying hotspots of risk to better support conservation.
5. Conclusions
The research focused on identifying the variation in fire dynamics over a two-decade period and discovered an increase in fire intensity (measured using FRP). Additionally, fragmentation was discovered to be a significant driver of fire activity. The Random Forest identified the relative importance of the different variables in influencing fire occurrence and established vegetation greenness, temperature and precipitation as important drivers of fire dynamics. Typically, areas of higher rainfall and/or intact vegetation see lower fire activity. The spatial distribution of fire occurrence risk has identified areas at a higher risk of fire occurrence. These findings are of importance both in terms of conservation prioritization in the Atlantic Rainforest biome and other fragmented tropical ecosystems.
Author Contributions
Conceptualization, methodology, software support, writing: M.S.; data sourcing, data curation, analysis, draft preparation, Z.H.; oversight, analysis, support and guidance, writing, editing, M.S. and Z.H. All authors have read and agreed to the published version of the manuscript.
Funding
This research received no external funding.
Institutional Review Board Statement
Not applicable.
Informed Consent Statement
Not applicable.
Data Availability Statement
All the data used in the paper can be found here https://drive.google.com/drive/u/3/folders/1lAftb0NmaGTIov0oy_zhiFWm3dFAya1l (accessed on 17 November 2021).
Acknowledgments
We would like to thank Adriana Paluszny (of the Department of Earth Science and Engineering) and Mark Burgman (of CEP of Imperial College London) for the supportive atmosphere that they provided.
Conflicts of Interest
The authors declare no conflict of interest.
References
- Ribeiro, M.C.; Martensen, A.C.; Metzger, J.P.; Tabarelli, M.; Scarano, F.; Fortin, M.-J. The Brazilian Atlantic Forest: A shrinking biodiversity hotspot. In Biodiversity Hotspots; Springer: New York, NY, USA, 2011; pp. 405–434. [Google Scholar]
- Oliveira, M.A.; Santos, A.M.M.; Tabarelli, M. Forest Ecology and Management Profound impoverishment of the large-tree stand in a hyper-fragmented landscape of the Atlantic forest. For. Ecol. Manag. 2008, 256, 1910–1917. [Google Scholar] [CrossRef]
- de Assis Barros, L.; de Mendonça, B.A.F.; Sothe, C.; Fernandes Filho, E.I.; Elkin, C. Fire in the Atlantic Rainforest: An analysis of 20 years of fire foci distribution and their social-ecological drivers. Geocarto Int. 2021, 1–25. [Google Scholar] [CrossRef]
- Lôbo, D.; Leão, T.; Melo, F.P.L.; Santos, A.M.M.; Tabarelli, M. Forest fragmentation drives Atlantic forest of northeastern Brazil to biotic homogenization. Divers. Distrib. 2011, 17, 287–296. [Google Scholar] [CrossRef]
- McNeely, J.A.; Schroth, G. Agroforestry and biodiversity conservation—Traditional practices, present dynamics, and lessons for the future. Biodivers. Conserv. 2006, 15, 549–554. [Google Scholar] [CrossRef]
- Ranta, P.; Blom, T.; Niemelä, J.; Joensuu, E.; Siitonen, M. The fragmented Atlantic rain forest of Brazil: Size, shape and distribution of forest fragments. Biodivers. Conserv. 1998, 7, 385–403. [Google Scholar] [CrossRef]
- Rezende, C.L.; Scarano, F.R.; Assad, E.D.; Joly, C.A.; Metzger, J.P.; Strassburg, B.B.N.; Tabarelli, M.; Fonseca, G.A.; Mittermeier, R.A. From hotspot to hopespot: An opportunity for the Brazilian Atlantic Forest. Perspect. Ecol. Conserv. 2018, 16, 208–214. [Google Scholar] [CrossRef]
- Haddad, N.M.; Brudvig, L.A.; Clobert, J.; Davies, K.F.; Gonzalez, A.; Holt, R.D.; Lovejoy, T.E.; Sexton, J.O.; Austin, M.P.; Collins, C.D.; et al. Habitat fragmentation and its lasting impact on Earth’s ecosystems. Sci. Adv. 2015, 1, e1500052. [Google Scholar] [CrossRef] [PubMed] [Green Version]
- Dos Santos, J.F.C.; Gleriani, J.M.; Velloso, S.G.S.; de Souza, G.S.A.; do Amaral, C.H.; Torres, F.T.P.; Medeiros, N.D.G.; dos Reis, M. Wildfires as a major challenge for natural regeneration in Atlantic Forest. Sci. Total Environ. 2019, 650, 809–821. [Google Scholar] [CrossRef] [PubMed]
- Guedes, B.J.; Massi, K.G.; Evers, C.; Nielsen-Pincus, M. Vulnerability of small forest patches to fire in the Paraiba do Sul River Valley, southeast Brazil: Implications for restoration of the Atlantic Forest biome. For. Ecol. Manag. 2020, 465, 118095. [Google Scholar] [CrossRef]
- Bourgoin, C.; Betbeder, J.; Le Roux, R.; Gond, V.; Oszwald, J.; Arvor, D.; Baudry, J.; Boussard, H.; Le Clech, S.; Mazzei, L.; et al. Looking beyond forest cover: An analysis of landscape-scale predictors of forest degradation in the Brazilian Amazon. Environ. Res. Lett. 2021, 16, 114045. [Google Scholar] [CrossRef]
- De Lima, R.A.F.; Oliveira, A.A.; Pitta, G.R.; de Gasper, A.L.; Vibrans, A.C.; Chave, J.; ter Steege, H.; Prado, P.I. The erosion of biodiversity and biomass in the Atlantic Forest biodiversity hotspot. Nat. Commun. 2020, 11, 6347. [Google Scholar] [CrossRef]
- Singh, M.; Zhu, X. Analysis of how the spatial and temporal patterns of fire and their bioclimatic and anthropogenic drivers vary across the Amazon rainforest in El Niño and non-El Niño years. Environ. Sci. 2021, 9, 12029. [Google Scholar] [CrossRef]
- Armenteras, D.; González, T.M.; Retana, J. Forest fragmentation and edge influence on fire occurrence and intensity under different management types in Amazon forests. Biol. Conserv. 2013, 159, 73–79. [Google Scholar] [CrossRef]
- Pivello, V.R.; Vieira, I.; Christianini, A.V.; Ribeiro, D.B.; da Silva Menezes, L.; Berlinck, C.N.; Melo, F.P.L.; Marengo, J.A.; Tornquist, C.G.; Tomas, W.M.; et al. Understanding Brazil’s catastrophic fires: Causes, consequences and policy needed to prevent future tragedies. Perspect. Ecol. Conserv. 2021, 19, 233–255. [Google Scholar] [CrossRef]
- Fox, D.M.; Laaroussi, Y.; Malkinson, L.D.; Maselli, F.; Andrieu, J.; Bottai, L.; Wittenberg, L. POSTFIRE: A model to map forest fire burn scar and estimate runoff and soil erosion risks. Remote Sens. Appl. Soc. Environ. 2016, 4, 83–91. [Google Scholar] [CrossRef]
- Kganyago, M.; Shikwambana, L. Assessment of the characteristics of recent major wildfires in the USA, Australia and Brazil in 2018–2019 using multi-source satellite products. Remote Sens. 2020, 12, 1803. [Google Scholar] [CrossRef]
- Lobovikov, M.; Paudel, S.; Ball, L.; Piazza, M.; Guardia, M.; Ren, H.; Russo, L.; Wu, J. World Bamboo Resources: A Thematic Study Prepared in the Framework of the Global Forest Resources Assessment 2005; Food & Agriculture Organization: Rome, Italy, 2007. [Google Scholar]
- Cochrane, M.A. Fire science for rainforests. Nature 2003, 421, 913–919. [Google Scholar] [CrossRef]
- Sayad, Y.O.; Mousannif, H.; Al Moatassime, H. Predictive modeling of wildfires: A new dataset and machine learning approach. Fire Saf. J. 2019, 104, 130–146. [Google Scholar] [CrossRef]
- Ngoc Thach, N.; Bao-Toan Ngo, D.; Xuan-Canh, P.; Hong-Thi, N.; Hang Thi, B.; Nhat-Duc, H.; Dieu, T.B. Spatial pattern assessment of tropical forest fire danger at Thuan Chau area (Vietnam) using GIS-based advanced machine learning algorithms: A comparative study. Ecol. Inform. 2018, 46, 74–85. [Google Scholar] [CrossRef]
- Cheng, T.; Wang, J. Integrated spatio-temporal data mining for forest fire prediction. Trans. GIS 2008, 12, 591–611. [Google Scholar] [CrossRef]
- Barreto, J.S.; Armenteras, D. Open data and machine learning to model the occurrence of fire in the ecoregion of “llanos colombo–venezolanos”. Remote Sens. 2020, 12, 3921. [Google Scholar] [CrossRef]
- Bachmann, A.; Allgöwer, B. A consistent wildland fire risk terminology is needed. Fire Manag. Today 2001, 61, 28–33. [Google Scholar]
- de Lima, R.A.F.; Mori, D.P.; Pitta, G.; Melito, M.O.; Bello, C.; Magnago, L.F.; Zwiener, V.P.; Saraiva, D.D.; Marques, M.C.M.; de Oliveira, A.A.; et al. How much do we know about the endangered Atlantic Forest? Reviewing nearly 70 years of information on tree community surveys. Biodivers. Conserv. 2015, 24, 2135–2148. [Google Scholar] [CrossRef] [Green Version]
- Da Fonseca, G.A.B. The vanishing Brazilian Atlantic forest. Biol. Conserv. 1985, 34, 17–34. [Google Scholar] [CrossRef]
- Oliveira-Filho, A.T.; Fontes, M.A.L. Patterns of floristic differentiation among Atlantic Forests in Southeastern Brazil and the influence of climate. Biotropica 2000, 32, 793–810. [Google Scholar] [CrossRef]
- Giglio, L.; Schroeder, W.; Hall, J.V.; Justice, C.O. MODIS Collection 6 Active Fire Product User’s Guide Revision C. Available online: https://modis-fire.umd.edu/files/MODIS_C6_Fire_User_Guide_C.pdf (accessed on 31 December 2020).
- Freeborn, P.H.; Wooster, M.J.; Roy, D.P.; Cochrane, M.A. Quantification of MODIS fire radiative power (FRP) measurement uncertainty for use in satellite-based active fire characterization and biomass burning estimation. Geophys. Res. Lett. 2014, 41, 1988–1994. [Google Scholar] [CrossRef]
- Giglio, L.; Loboda, T.; Roy, D.P.; Quayle, B.; Justice, C.O. An active-fire based burned area mapping algorithm for the MODIS sensor. Remote Sens. Environ. 2009, 113, 408–420. [Google Scholar] [CrossRef]
- Fick, S.E.; Hijmans, R.J. WorldClim 2: New 1-km spatial resolution climate surfaces for global land areas. Int. J. Climatol. 2017, 37, 4302–4315. [Google Scholar] [CrossRef]
- Kennedy, C.M.; Oakleaf, J.R.; Theobald, D.M.; Baruch-Mordo, S.; Kiesecker, J. Managing the middle: A shift in conservation priorities based on the global human modification gradient. Glob. Chang. Biol. 2019, 25, 811–826. [Google Scholar] [CrossRef] [PubMed]
- Cleveland, W.S.; Devlin, S.J. Locally Weighted Regression: An Approach to Regression Analysis by Local Fitting Locally Weighted Regression: An Approach to Regression Analysis by Local Fiiting. J. Am. Stat. Assoc. 1998, 83, 596–610. [Google Scholar] [CrossRef]
- Hamed, K.H.; Rao, A.R. A modified Mann-Kendall trend test for autocorrelated data. J. Hydrol. 1998, 204, 182–196. [Google Scholar] [CrossRef]
- Davies, D.K.; Ilavajhala, S.; Wong, M.M.; Justice, C.O. Fire information for resource management system: Archiving and distributing MODIS active fire data. IEEE Trans. Geosci. Remote Sens. 2009, 47, 72–79. [Google Scholar] [CrossRef]
- Vadrevu, K.P.; Lasko, K.; Giglio, L.; Schroeder, W.; Biswas, S.; Justice, C. Trends in Vegetation fires in South and Southeast Asian Countries. Sci. Rep. 2019, 9, 7422. [Google Scholar] [CrossRef] [PubMed]
- Zhang, Y.; Lim, S.; Sharples, J.J. Modelling spatial patterns of wildfire occurrence in South-Eastern Australia. Geomat. Nat. Hazards Risk 2016, 7, 1800–1815. [Google Scholar] [CrossRef] [Green Version]
- Chandrashekar, G.; Sahin, F. A survey on feature selection methods. Comput. Electr. Eng. 2014, 40, 16–28. [Google Scholar] [CrossRef]
- Akinwande, M.O.; Dikko, H.G.; Samson, A. Variance Inflation Factor: As a Condition for the Inclusion of Suppressor Variable(s) in Regression Analysis. Open J. Stat. 2015, 5, 754–767. [Google Scholar] [CrossRef] [Green Version]
- Dormann, C.F.; Elith, J.; Bacher, S.; Buchmann, C.; Carl, G.; Carré, G.; Marquéz, J.R.G.; Gruber, B.; Lafourcade, B.; Leitão, P.J.; et al. Collinearity: A review of methods to deal with it and a simulation study evaluating their performance. Ecography 2013, 36, 27–46. [Google Scholar] [CrossRef]
- Wu, W.; Zhang, L. Comparison of spatial and non-spatial logistic regression models for modeling the occurrence of cloud cover in north-eastern Puerto Rico. Appl. Geogr. 2013, 37, 52–62. [Google Scholar] [CrossRef]
- Schober, P.; Schwarte, L.A. Correlation coefficients: Appropriate use and interpretation. Anesth. Analg. 2018, 126, 1763–1768. [Google Scholar] [CrossRef]
- Breiman, L. Random forests. Mach. Learn. 2001, 45, 5–32. [Google Scholar] [CrossRef] [Green Version]
- Tonini, M.; D’andrea, M.; Biondi, G.; Esposti, S.D.; Trucchia, A.; Fiorucci, P. A machine learning-based approach for wildfire susceptibility mapping. The case study of the liguria region in italy. Geosciences 2020, 10, 105. [Google Scholar] [CrossRef] [Green Version]
- Hanley, J.A.; McNeil, B.J. The meaning and use of the area under a receiver operating characteristic (ROC) curve. Radiology 1982, 143, 29–36. [Google Scholar] [CrossRef] [PubMed] [Green Version]
- Han, H.; Guo, X.; Yu, H. Variable selection using Mean Decrease Accuracy and Mean Decrease Gini based on Random Forest. In Proceedings of the 2016 7th IEEE International Conference on Software Engineering and Service Science (ICSESS), Beijing, China, 26–28 August 2016; pp. 219–224. [Google Scholar] [CrossRef]
- Jones, Z.; Linder, F. Exploratory data analysis using random forests. In Proceedings of the 73rd Annual MPSA Conference, Chicago, IL, USA, 16–19 April 2015. [Google Scholar]
- Strobl, C.; Boulesteix, A.; Kneib, T.; Augustin, T.; Zeileis, A. Conditional variable importance for random forests. BMC Bioinform. 2008, 9, 307. [Google Scholar] [CrossRef] [Green Version]
- Ghorbanzadeh, O.; Blaschke, T.; Gholamnia, K.; Aryal, J. Forest fire susceptibility and risk mapping using social/infrastructural vulnerability and environmental variables. Fire 2019, 2, 50. [Google Scholar] [CrossRef] [Green Version]
- Gorelick, N.; Hancher, M.; Dixon, M.; Ilyushchenko, S.; Thau, D.; Moore, R. Google Earth Engine: Planetary-scale geospatial analysis for everyone. Remote Sens. Environ. 2017, 202, 18–27. [Google Scholar] [CrossRef]
- Silva, C.H.L.; Aragão, L.E.O.C.; Fonseca, M.G.; Almeida, C.T.; Vedovato, L.B.; Anderson, L.O. Deforestation-induced fragmentation increases forest fire occurrence in central Brazilian Amazonia. Forests 2018, 9, 305. [Google Scholar] [CrossRef] [Green Version]
- Skole, D.; Tucker, C. Tropical deforestation and habitat fragmentation in the Amazon: Satellite data from 1978 to 1988. Science 1993, 260, 1905–1910. [Google Scholar] [CrossRef] [PubMed] [Green Version]
- Driscoll, D.A.; Armenteras, D.; Bennett, A.F.; Brotons, L.; Clarke, M.F.; Doherty, T.S.; Haslem, A.; Kelly, L.T.; Sato, C.F.; Sitters, H.; et al. How fire interacts with habitat loss and fragmentation. Biol. Rev. 2021, 96, 976–998. [Google Scholar] [CrossRef]
- Cochrane, M.A.; Laurance, W.F. Synergisms among fire, land use, and climate change in the Amazon. Ambio 2008, 37, 522–527. [Google Scholar] [CrossRef]
- Berenguer, E.; Ferreira, J.; Gardner, T.A.; Aragão, L.E.O.C.; De Camargo, P.B.; Cerri, C.E.; Durigan, M.; De Oliveira, R.C.; Vieira, I.C.G.; Barlow, J. A large-scale field assessment of carbon stocks in human-modified tropical forests. Glob. Chang. Biol. 2014, 20, 3713–3726. [Google Scholar] [CrossRef] [PubMed] [Green Version]
- Dwomoh, F.K.; Wimberly, M.C. Fire regimes and forest resilience: Alternative vegetation states in the West African tropics. Landsc. Ecol. 2017, 32, 1849–1865. [Google Scholar] [CrossRef]
- Liu, Z.; Wimberly, M.C. Climatic and Landscape Influences on Fire Regimes from 1984 to 2010 in the Western United States. PLoS ONE 2015, 10, e0140839. [Google Scholar] [CrossRef] [Green Version]
- Maki, M.; Ishiahra, M.; Tamura, M. Estimation of leaf water status to monitor the risk of forest fires by using remotely sensed data. Remote Sens. Environ. 2004, 90, 441–450. [Google Scholar] [CrossRef]
- Cochrane, M.A.; Alencar, A.; Schulze, M.D.; Souza, C.M.; Nepstad, D.C.; Lefebvre, P.; Davidson, E.A. Positive feedbacks in the fire dynamic of closed canopy tropical forests. Science 1999, 284, 1832–1835. [Google Scholar] [CrossRef]
- Guo, F.; Su, Z.; Wang, G.; Sun, L.; Tigabu, M.; Yang, X.; Hu, H. Understanding fire drivers and relative impacts in different Chinese forest ecosystems. Sci. Total Environ. 2017, 605–606, 411–425. [Google Scholar] [CrossRef]
- Bisquert, M.; Caselles, E.; Snchez, J.M.; Caselles, V. Application of artificial neural networks and logistic regression to the prediction of forest fire danger in Galicia using MODIS data. Int. J. Wildl. Fire 2012, 21, 1025–1029. [Google Scholar] [CrossRef]
- Laurance, W.F.; Camargo, J.L.C.; Fearnside, P.M.; Lovejoy, T.E.; Williamson, G.B.; Mesquita, R.C.G.; Meyer, C.F.J.; Bobrowiec, P.E.D.; Laurance, S.G.W. An Amazonian rainforest and its fragments as a laboratory of global change. Biol. Rev. 2018, 93, 223–247. [Google Scholar] [CrossRef] [PubMed]
- Satir, O.; Berberoglu, S.; Donmez, C. Mapping regional forest fire probability using artificial neural network model in a Mediterranean forest ecosystem. Geomat. Nat. Hazards Risk 2016, 7, 1645–1658. [Google Scholar] [CrossRef] [Green Version]
Figure 1.
Scatter plot with fragmentation metric and fire density (FD) with LOESS regression. A gentle declining association is found between FD and (a) mean patch area (after an increase). Strong positive association between FD and the (b) number of patch areas (especially with values greater than 30. Slight positive association between FD and (c) loss area and (d) length.

Figure 2.
Scatter plot with fragmentation metric and burned area with LOESS regression. The burn has a parabolic positive association with (a) the mean patch area, (b) patch number, and the (d) length but has a negative association with (c) forest loss area.
Figure 2.
Scatter plot with fragmentation metric and burned area with LOESS regression. The burn has a parabolic positive association with (a) the mean patch area, (b) patch number, and the (d) length but has a negative association with (c) forest loss area.

Figure 3.
Time series of annual fire density change in the Atlantic Forest from 2001 to 2020.

Figure 4.
Time series of annual FRP in the Atlantic Forest from 2001 to 2020.

Figure 5.
Pearson’s correlation coefficients between predictor variables. tempo_mean—average temperature; vapr_mean—average water vapour pressure; srad_mean—average solar radiation; length—edge length; PN—number of patches; forest_pro—loss area; PAM—mean patch area; savanna_pro—savanna cover; evi_mean—mean EVI; ndvi_mean—mean NDVI; hpf_mean—average human foot; modi_mean—average human modification; loss_pro—forest cover; prec_measn—average precipitation.

Figure 6.
Mean decrease accuracy (MDA) and mean decrease in the Gini coefficient (MDG) of each predictor in the RF model.
Figure 6.
Mean decrease accuracy (MDA) and mean decrease in the Gini coefficient (MDG) of each predictor in the RF model.

Figure 7.
Partial dependency plot for the four most influential variables and fragmentation variables.
Figure 7.
Partial dependency plot for the four most influential variables and fragmentation variables.

Figure 8.
Fire risk map for the Atlantic Forest based on the RF model.


Table 1.
Predictor variables and the sources used in the project.
| Category | Variable | Source |
|---|---|---|
| Climate | Average Temperature | WordClim v2 |
| Precipitation | WordClim v2 | |
| Solar Radiation | WordClim v2 | |
| Water VapourPpressure | WordClim v2 | |
| Fragmentation | Forest Patch Number | MCD12Q1.006 |
| Mean Forest Patch area | MCD12Q1.006 | |
| Forest length | MCD12Q1.006 | |
| Loss Area Proportion | Hansen Global Forest Change | |
| Vegetation | Normalized Difference Vegetation Index | MOD13A1.006 |
| Enhanced vegetation index | MOD13A1.006 | |
| Forest Cover | MCD12Q1.006 | |
| Savanna Cover | MCD12Q1.006 | |
| Human | Human Modification | Global Human Modification map |
| Human Footprint | Human Footprint Data |
Table 2.
VIF values for the 14 predictors.
| Variable | VIF |
|---|---|
| Temperature | 1.56 |
| Precipitation | 1.81 |
| Solar Radiation | 2.61 |
| Water Vapour Pressure | 2.23 |
| Normalized Difference Vegetation Index | 17.80 |
| Enhanced Vegetation Index | 16.03 |
| Forest Cover | 3.76 |
| Savanna Cover | 1.17 |
| Mean Patch Area | 2.95 |
| Patch Number | 1.94 |
| Edge Length | 2.54 |
| Loss Area | 1.70 |
| Human Modification | 2.35 |
| Human Footprint | 1.92 |
Publisher’s Note: MDPI stays neutral with regard to jurisdictional claims in published maps and institutional affiliations. |
© 2022 by the authors. Licensee MDPI, Basel, Switzerland. This article is an open access article distributed under the terms and conditions of the Creative Commons Attribution (CC BY) license (https://creativecommons.org/licenses/by/4.0/).
Share and Cite
MDPI and ACS Style
Singh, M.; Huang, Z. Analysis of Forest Fire Dynamics, Distribution and Main Drivers in the Atlantic Forest. Sustainability 2022, 14, 992. https://0-doi-org.brum.beds.ac.uk/10.3390/su14020992
AMA Style
Singh M, Huang Z. Analysis of Forest Fire Dynamics, Distribution and Main Drivers in the Atlantic Forest. Sustainability. 2022; 14(2):992. https://0-doi-org.brum.beds.ac.uk/10.3390/su14020992
Chicago/Turabian StyleSingh, Minerva, and Zhuhua Huang. 2022. "Analysis of Forest Fire Dynamics, Distribution and Main Drivers in the Atlantic Forest" Sustainability 14, no. 2: 992. https://0-doi-org.brum.beds.ac.uk/10.3390/su14020992
Note that from the first issue of 2016, this journal uses article numbers instead of page numbers. See further details here.