Article

A Mixed Reality Application for the On-Site Assessment of Building Renovation: Development and Testing

by
Alessandro Carbonari
1,*,
Carlos Franco
2,
Berardo Naticchia
1,
Francesco Spegni
1 and
Massimo Vaccarini
1
1
Department of Civil and Building Engineering and Architecture (DICEA), Polytechnic University of Marche, 60131 Ancona, Italy
2
General Directorate of Architecture and Building Quality, JEA, Ministry of Mobility, Transport and Housing—Regional Government of Extremadura, 06800 Mérida, Spain
*
Author to whom correspondence should be addressed.
Sustainability 2022, 14(20), 13239; https://0-doi-org.brum.beds.ac.uk/10.3390/su142013239
Submission received: 25 August 2022 / Revised: 11 October 2022 / Accepted: 11 October 2022 / Published: 14 October 2022

Abstract

:
This paper contributes to a sustainable construction design management approach to increase the successful renovation rate of existing residential building stock. Indeed, coupling BIM with mixed reality can speed up and improve the quality of the renovation design processes, because it can display virtual models of alternative design scenarios superimposed over the existing physical facility. To this purpose, a sample of technicians was enrolled to test the reliability of this technology. A prototype was developed that enables cooperation among stakeholders and the implementation of an efficient workflow. The volunteers carried out real-life tests in a building demonstrator in Caceres (Spain) and filled in two questionnaires with their feedback. The results showed that an MR-based platform can involve interested stakeholders in the assessment of renovation design projects, that speeds up the decision-making process and increases the quality of those projects. Moreover, technicians can master the technology quickly, provided that it is included in the current renovation workflow and some technology gaps are covered. However, the main limitations of this study are that these findings are valid for building renovation design only, and the tests were performed in a controlled, yet full scale, experimental environment. Finally, this paper deals with a few open technical issues, such as the efficient alignment of holograms, transformation of BIM models into a format suitable for mixed reality applications and sharing feedbacks in an on-line repository to foster collaboration.

1. Introduction

For several years, the Architecture, Engineering and Construction (AEC) domain has been facing a constant push towards improving the energy efficiency of the existing residential building stock worldwide. For instance, in recent years, the EU has invested a lot of effort, both political as well as economical, in implementing policies that will substantially decrease greenhouse gas emissions as of “80–95% by 2050 compared to 1990”, as per the EU Directive 2012/27/EU [1]. The Directive 2018/2022 of the European Parliament amending the Directive 2012/27/EU in its premise states that the number of households that have been converted into energy efficient buildings is still very limited [2]. For this reason, the current renovation rate of existing buildings must increase from 1–2% to 2–3% per year until 2030 [3,4]. Improving the energy efficiency of buildings has been recognized by the EU as a driving force for alleviating the fuel scarcity issue and also for increasing the employment rate continent-wide [4]. It has been assessed that buildings are responsible for about 40–43% of energy consumption as well as 36% of overall CO2 emissions [5]. As a consequence, an upturn in energy efficiency by at least 33% must be met by 2030, according to the EU Directive 2018/2002/EU [2]. The urgency of such directives and the policies contained therein have been confirmed and reinforced by the recent world-wide energy crisis [6]. Since the end of 2021, EU observers and columnists have confirmed that an acceleration in the implementation of the Renovation Wave initiative would be the best answer to the recent surge in energy prices [7]. Evidence shows that several factors may hamper the realization of the desired renovation rate goal. On one hand, renovation design is more challenging compared to designing a new construction, since it requires considerable efforts in surveying and collecting information regarding the status of the existing building. On the other hand, renovation activities are carried out by a highly fragmented supply chain in the construction industry [4]. Furthermore, close collaboration among several experts is required while assessing the constructability and feasibility of any technical solution design in response to requests by the owner (e.g., a design layout may be constrained by the existing building structure, or dedicated interfaces must be defined between current and renovated technical sub-systems).
Several authors have recognized the added value of combining BIM with Augmented Reality/Mixed Reality (AR/MR) technologies. Among others, we argue that it fosters collaboration among the actors involved in the renovation process; it allows users to reach a deeper level of immersion while assessing the quality of the designed solutions; it allows design mistakes to be spotted at an early stage rather than during the work execution; and it enables BIM enrichment by storing information collected during on-site surveys of the to-be-renovated building [8,9]. The general use cases singled out in the paper written by Delgado et al. [10] include stakeholder engagement, design support, design review and training within their overview of the current usage landscape of AR and VR in the AEC industry. More specifically, BIM and AR/MR can be interfaced to make renovation design more sustainable, to increase the efficiency of the renovation processes of existing building stock, to decrease costs and to increase the rate of building renovation [10]. In addition, BIM and AR/VR have been classified as two of the most critical technologies to enable the digitization of the construction industry [11]. Basically, advanced visualization tools such as augmented reality and virtual reality (VR) can be considered potential tools for a more sustainable building design development since they can lead to the virtualization of the constructor sector: this can change people’s behavior and improve the efficiency of the workflow [12].
Empirical studies and tests on realistic case studies targeted to the assessment of the reliability and user acceptance of AR/MR tools in the AEC industry have been performed mainly in the fields of construction work execution [13], enhanced communication between back-office and field staff while performing tasks concerning facility maintenance [14], besides several studies regarding education and on-site training [15,16]. To the best of the authors’ knowledge, no empirical study and survey about the application of AR/MR to facilitate and improve the quality of building renovation design has been carried out. Besides, the scientific literature has stressed some technical challenges that are still hampering the full realization of an immersive environment to perform renovation design assessment directly on-site. Among these, we cite the need for the retrieval of technical information included in the BIM model while navigating on-site [17] and the availability of a quick and robust alignment of virtual models [18].
Due to the above-mentioned reasons, this paper designed and carried out a survey to evaluate the reliability and user acceptance of an MR-based building design renovation assessment process. The tests were performed in a full-scale demonstrator in Caceres (Spain), where a residential building underwent a controlled renovation process to improve its energy efficiency as part of an EU research project. To this purpose, a prototype of an MR-based platform was developed and feedback was collected by means of questionnaires. The prototype is an IT solution that combines BIM and immersive MR technologies. A web application helps stakeholders visualize the impact of the planned changes and enables a collaborative workflow between the architectural team and on-site experts. In addition, this paper describes how a few technical challenges could be overcome, such as: ensuring that the virtual model is correctly and constantly superimposed over the real building; allowing the selective visualization of holograms representing the relevant components of a BIM renovation model either to be demolished or constructed; and allowing smooth interaction among the actors involved throughout the overall renovation process, such as owners, designers and energy experts. Furthermore, an efficient workflow integrating MR in a typical building renovation design project is defined.
Section 2 includes the analysis of the scientific background and Section 3 concerns the methodology. Findings are reported in Section 4 and comments on collected data and feedback are included in Section 5. Section 6 deals with conclusions, limitations of this study and suggestions for next research steps.

2. Literature Review

2.1. The Motivation behind Streamlining the Building Renovation Design Phase

Renovation and refurbishment are established methods of solving the problem of an aged existing stock of residential buildings [19]. These methods may include not only the repair but also the extension of a household. Although building renovation feasibility studies have usually focused on economic feasibility and business efficiency, it has been found that other different issues may arise during the execution process that could prevent the successful accomplishment of renovation works [20]. The main drawback of feasibility studies is that they seldom reflect technical factors. Hence, more accurate pre-evaluation processes must be carried out to reduce any risks connected with technical aspects. Techniques such as VR and AR can be used for the better visualization of projects integrated with BIM-like analyses (e.g., structural, energy) for a better understanding by involved stakeholders [12]. Indeed, immersive environments generated by AR and VR provide the basis to visualize data in a way that improves the values and facilitates the use and interpretation of the data, because participants can interact with the geometry at a real scale [10]. These authors have cited studies regarding a VR system that enables designers to experience various different designs in realistic scenarios, thus enabling them to identify qualitative characteristics besides the quantitative analysis. However, this scenario poses research challenges that the AEC industry has faced to a lesser extent. First, the implications that new AR displays represent for data visualization in a spatial context must be investigated; also, efforts are required to investigate the best approaches to visualize underlying and meta-data related to real-life objects [10]. In agreement with this point of view, an up-to-date review paper found that the AEC future research agenda on this field included topics such as improving workflow and data analysis and developing new technology resources in the area [12]. AR could enable the implementation of a more sustainable design, because these advanced visualization tools can improve workflow and data analysis, until people’s behavior changes, e.g., leaner collaboration and more efficient business meetings, which would help reduce GHG emissions [12]. This challenge resides in the multi-disciplinary coexistence of specialized skills, techniques and tools, which has already been investigated regarding the refurbishment and restoration design phases [21].
In conclusion, digital technology can be employed with the aim of streamlining the management of information and technical knowledge during the design phase. This goal could include the BIM submission process to local authorities, too. Indeed, governing bodies, such as building authorities, can use augmented reality, as enabled by a BIM-based work environment, to support all stakeholders involved in the plan check process to understand the project much better, thanks to such an advanced visualization [22].

2.2. Applicability of AR/MR in the Renovation of Existing Buildings

Extended reality (XR) is a collective term which groups the whole spectrum of experiences between virtual environments and the real world, that is, from Virtual Reality (VR), through Augmented Reality (AR) and finally to Mixed Reality (MR). In a VR environment, the participant–observer is totally immersed in, and able to interact with, a completely synthetic world [23]. In both AR and MR, on the other hand, virtuality and reality are combined, but each to a different extent. AR is characterized by digital contents superimposed on the users’ real surroundings, whereas MR totally integrates them, so that users can interact with both digital and real contents, and these elements too can interact with each other [24].
The beneficial introduction of mixed reality, which is the specific technology addressed in this paper, into renovation design management processes was suggested a few years ago [17]. These authors claimed that the renovation process involves many disciplines to simultaneously meet requirements concerning architectural, facilities, structural and environmental design in order to build a healthy, comfortable and energy-saving environment. During the implementation of this process, the gathering of feedback is an indispensable element and is a core element for the decision framework that drives sustainable building renovations. Indeed, several stakeholders, such as owners and designers, can more easily be involved in the decision-making process thanks to the adoption of mixed reality. Technically, they showcased that a user wearing a MR head-mounted display and walking in a to-be-renovated building could read expected indoor temperature values and airflow rates resulting from CFD analyses, thanks to the use of HoloLens and a BIM modelling tool [17]. In a follow-up paper, the chance of a selective display of components was discussed [25] too. The authors argued that the MR experience can make non-professionals understand and participate in the design process, thanks to the selective selection of specific components of the virtual model. Moreover, in order to increase the immersive experience further, MR should include diminished reality, which can either display or remove objects from the real world [25].
Another research study devoted to make renovation procedures more efficient was targeted to the assessment of individual components of building technical equipment [26]. In this case, the authors claimed that jointly adopting BIM and virtual reality to assess the suitability of heat sources in case of building adaptation can improve the administration, operation and maintenance of technical equipment. Hence, they performed simulations and numerical analyses to show that thanks to these technologies, the locations and connections of virtual elements in the real environment can be displayed, so as to locate any incorrectly placed components, and to check the size and length of pipes, elbows, number and distribution of branches and valves [26]. This approach was deemed as strongly required in the case of renewable energy sources, due to the relatively high investment cost for acquiring such systems and the remarkable effort usually required to incorporate these technology items in existing buildings. For the reasons stated above, solving issues during the planning stage can save a lot of the budget that would be required in case those problems were addressed during the following implementation stage.

2.3. Examples of Other Applications of AR/MR in Construction

A further countless number of use cases with great potential for the construction industry have been detected, among which we cite: visualization of preliminary design, monitoring of the construction progress, on-site assessment of construction works and quality checks [27]. Some of these scenarios have been tested at various readiness levels.
Laboratory trials to compare to what extent AR can improve the performance of workers assembling electric conduits showed that this technology would help not only construction workers, but also students in their learning process and workers with no previous specialty skills in construction [13]. More specifically, the authors identified and involved three groups for this research: construction professionals, construction students and individuals with no construction experience. They found that all the three groups completed two construction tasks irrespective of their background thanks to the support of AR, that focused on the assembly of an electrical conduit in a room, although construction practitioners performed faster and with higher accuracy [13]. In more complex situations, an MR-based framework can support collaboration between on-site and back-office personnel during inspection tasks for facilities maintenance, which poses many challenges such as addressing the activities involved, retrieving on-site data, managing work orders, localizing components and accomplishing maintenance works [14]. Feedback and comments shared during the collaboration showed that such a framework can lead towards more sustainable construction as a result of the reduced inspection time, the reduced number of resources involved in the inspection process, increased quality and decreased reworking and overall, more efficient processes. Similar evidence was shown by means of lab tests performed on an innovative platform, called iVR, that proposes a closed loop of communication between the construction jobsite and constructor offices during the inspection process [28]. A literature survey concerning the execution phase emphasized how critical AR associated with BIM can become in construction management, with particular reference to building site inspection [29]. The main benefits concern the detection of information on the progress of activities; reduction in the workload in the building site that would improve productivity; and increased reliability in the detection of workspace locations, which were tested in the case of trench excavation. Even in this phase, VR applications can improve communication between the different actors (e.g., construction manager, site engineer, jobsite layout planner, contractor, etc.) involved in the construction jobsite organization [30].

2.4. Technologies Supporting Mixed Reality

Advanced visualization technologies, including augmented reality and virtual reality, have been listed among the ten types of cutting-edge technology that have led to the new concept in the construction industry known as construction 4.0 [11]. Different manufacturers have recently introduced MR-enabling devices to the market such as Intel Realsense Stereo or LiDAR (Intel Corp., Santa Clara, CA, USA), StereoLabs, ZED family (Stereolabs Inc., San Francisco, NY, USA), Microsoft Azure Kinect DK (Microsoft Corp., Redmond, WA, USA), Microsoft Hololens 2 (Microsoft Corp., Redmond, WA, USA), Magic Leap (Magic Leap Inc., Plantation, FL, USA), ThirdEye (ThirdEye Gen, Inc., Princeton, NJ, USA). Some of them are head-mounted devices, providing users with a fully immersive MR experience, others are cheaper extension devices for use in combination with the most common hand-held displays (tablets, mobiles, etc.). To the best of the authors’ knowledge, the holographic devices Microsoft HoloLens (Microsoft Corp., Redmond, WA, USA), Magic Leap (Magic Leap Inc., Plantation, FL, USA) and ThirdEye (ThirdEye Gen, Inc., Princeton, NJ, USA) are the current technological devices that can truly generate pure and immersive mixed realities and that are provided with open SDK, and which integrate virtual and real objects in a head-mounted display.
In order to successfully apply extended reality (XR) technologies on field, full integration between reality and virtuality, which characterizes MR, is required. This integration can be achieved in an MR device by means of a set of enabling technologies [31,32], namely:
  • Displays: superposition of 3D holograms over real environments (head-mounted, hand-held, projective);
  • Calibration: adjustment of sensor parameters for mapping sensor readings to 3D space (camera parameters, field of view, sensor offsets, distortions, etc.);
  • Tracking: accurate and real-time tracking of the observer within the space (indoor/outdoor, environment sensing);
  • Registration: alignment of the virtual objects over real ones;
  • Interaction: ability to capture human gestures or voice commands for an easy and natural human–machine interaction;
  • The first two points require that the camera and the display used for showing holograms in front of an observer be calibrated for mapping the 3D position of real/virtual objects within the 2D space of the displayed image. Tracking is usually performed via a hybrid approach, by merging different sensory information and implementing SLAM algorithms that enable the building and updating of a 3D map representation of the surrounding space while at the same time localizing the observer within it [33,34]. For outdoor spaces, the most precise and diffused tracking system available is GPS RTK that combines GPS localization with additional information inferred using a ground RTK station in the surroundings. For indoor spaces, where GPS is not available, the most common combination of sensors is a camera with depth perception (either a stereo camera or LiDAR camera) with a proper Inertial Measurement Unit (IMU with the option of barometer and magnetometer). However, this indoor tracking system does not provide absolute positions, but just relative ones.
The tracking task is strictly connected to the registration problem that aims to achieve a precise real-time alignment between virtual and real elements. Due to the absence of an absolute tracking system, for indoor spaces there is always an unknown offset between the coordinate system of the virtual model and that of the 3D representation of the environment. Feature recognition could be exploited for this task when the visible features can be matched exactly with the virtual model, but this is not always the case, for instance during building construction. The approaches that are currently adopted for addressing the registration issue by the commercially available devices, such as Trimble™ XR10 for Microsoft™ HoloLens, are the semi-manual alignment and the markers-based ones. The first method consists of aligning any two surfaces in the model with the corresponding real ones. Then, manual scaling and rotation of a cube is required for fine tuning [18]. This method produces a rough but acceptable alignment, provided that two conditions are fulfilled. First, the user must be aware of his/her positions in the virtual space; secondly, he/she must be enabled to visually select any item, even those usually hidden by the other holograms. Moreover, such an alignment method can only be applied with reference to virtual elements that have their physical and stable counterpart in the real world. Such a requirement may be hard to be meet in AEC scenarios that continuously evolve (e.g., during work progress) and may not offer stable references. The markers-based alignment method overcomes those issues by aligning the BIM model based on the user position, retrieved by scanning a real and visible marker, e.g., a QR code, having its virtual replica [35]. Although the correctness of visual markers’ positions must be verified before each scan, this method ensures a pretty good model alignment.
As for the last point, the MR device must enable easy and natural user interaction by exploiting AI (Artificial Intelligence) capabilities: feature detection and tracking, object recognition, motion tracking, etc., implemented in neural networks embedded in the MR devices. They are usually fed by the output of image processing algorithms. AI allows users’ gestures to be captured and enables the detection and tracking of known objects, thus making the man–machine interface quite transparent and natural.

3. Methodology

3.1. Research Approach

The proposed service for the on-site assessment of renovation works is an MR-based platform specifically devoted to increasing the efficiency/efficacy of building renovation design. The short name for this service is ODAVS, which stands for On-site Design Analysis and Verification Service. This work embraced a quasi-experimental, empirical research approach to develop an understanding of the reliability and user acceptance observed using MR for building renovation design assessment [27,36]. The target population is described in Section 3.2. The development of the prototype is the subject of Section 3.3, which includes the workflow enabled by ODAVS and technical details concerning the Web GUI and applications for on-site navigation and renovation design assessment. Then, ODAVS was tested and studied in real-life settings to assess its current capabilities and limitations, as reported in Section 3.4. The user acceptance of the developed prototype was demonstrated in a real-life scenario involving several end-users in the tests and through interviews used to collect feedback. Finally, data were analyzed as described in Section 3.5.

3.2. Target Population and Sampling Method

Due to the proof-of-concept nature of this experiment, a convenience sampling technique was used [36]. One of the institutions with whom the researchers partnered in the EU H2020 project Encore was in charge of carrying out real-life tests to determine the viability of using the MR-based platform for building renovation design assessment. The institution is called Junta de Extremadura (JEA) and is based in Caceres, Spain. Participants from the institution were chosen based on three criteria. First of all, they were required to have a technical degree, in order to simulate the behavior of experts or advisors on-site in the existing building and assessing a renovation project. Another basic requirement was that none of them be experts in the technology to be tested. Finally, they were chosen based on their time availability in the allocated two days for the experiments. As a result, eight volunteers from JEA staff were involved.

3.3. Development of the Prototype

In order to perform the tests, a prototype was built. The architecture of the prototypical service is based on three loosely coupled components, which are: the web service, the MR application running on the Hololens device and the mobile NFC scanner used for the alignment of virtual models. Prior to the description of its components, an overview of an efficient workflow enabled by this application is provided in Section 3.3.1. Then, a focus on the web service architecture and its Web GUI is provided in Section 3.3.2; the MR application and the mobile NFC scanner for the alignment of virtual models are the subject of Section 3.3.3 and Section 3.3.4, respectively. The same web service also supports the transformation of BIM renovation models into another format suitable for post-processing and the storage of assessment results of alternative scenarios, in the form of audio annotations. Furthermore, the technical solution showcased in this paper creates an on-site alignment of holograms enabled by short-range RFID tags, which overcomes the repeated step of preliminarily deploying visible tags usually required at every on-site survey.

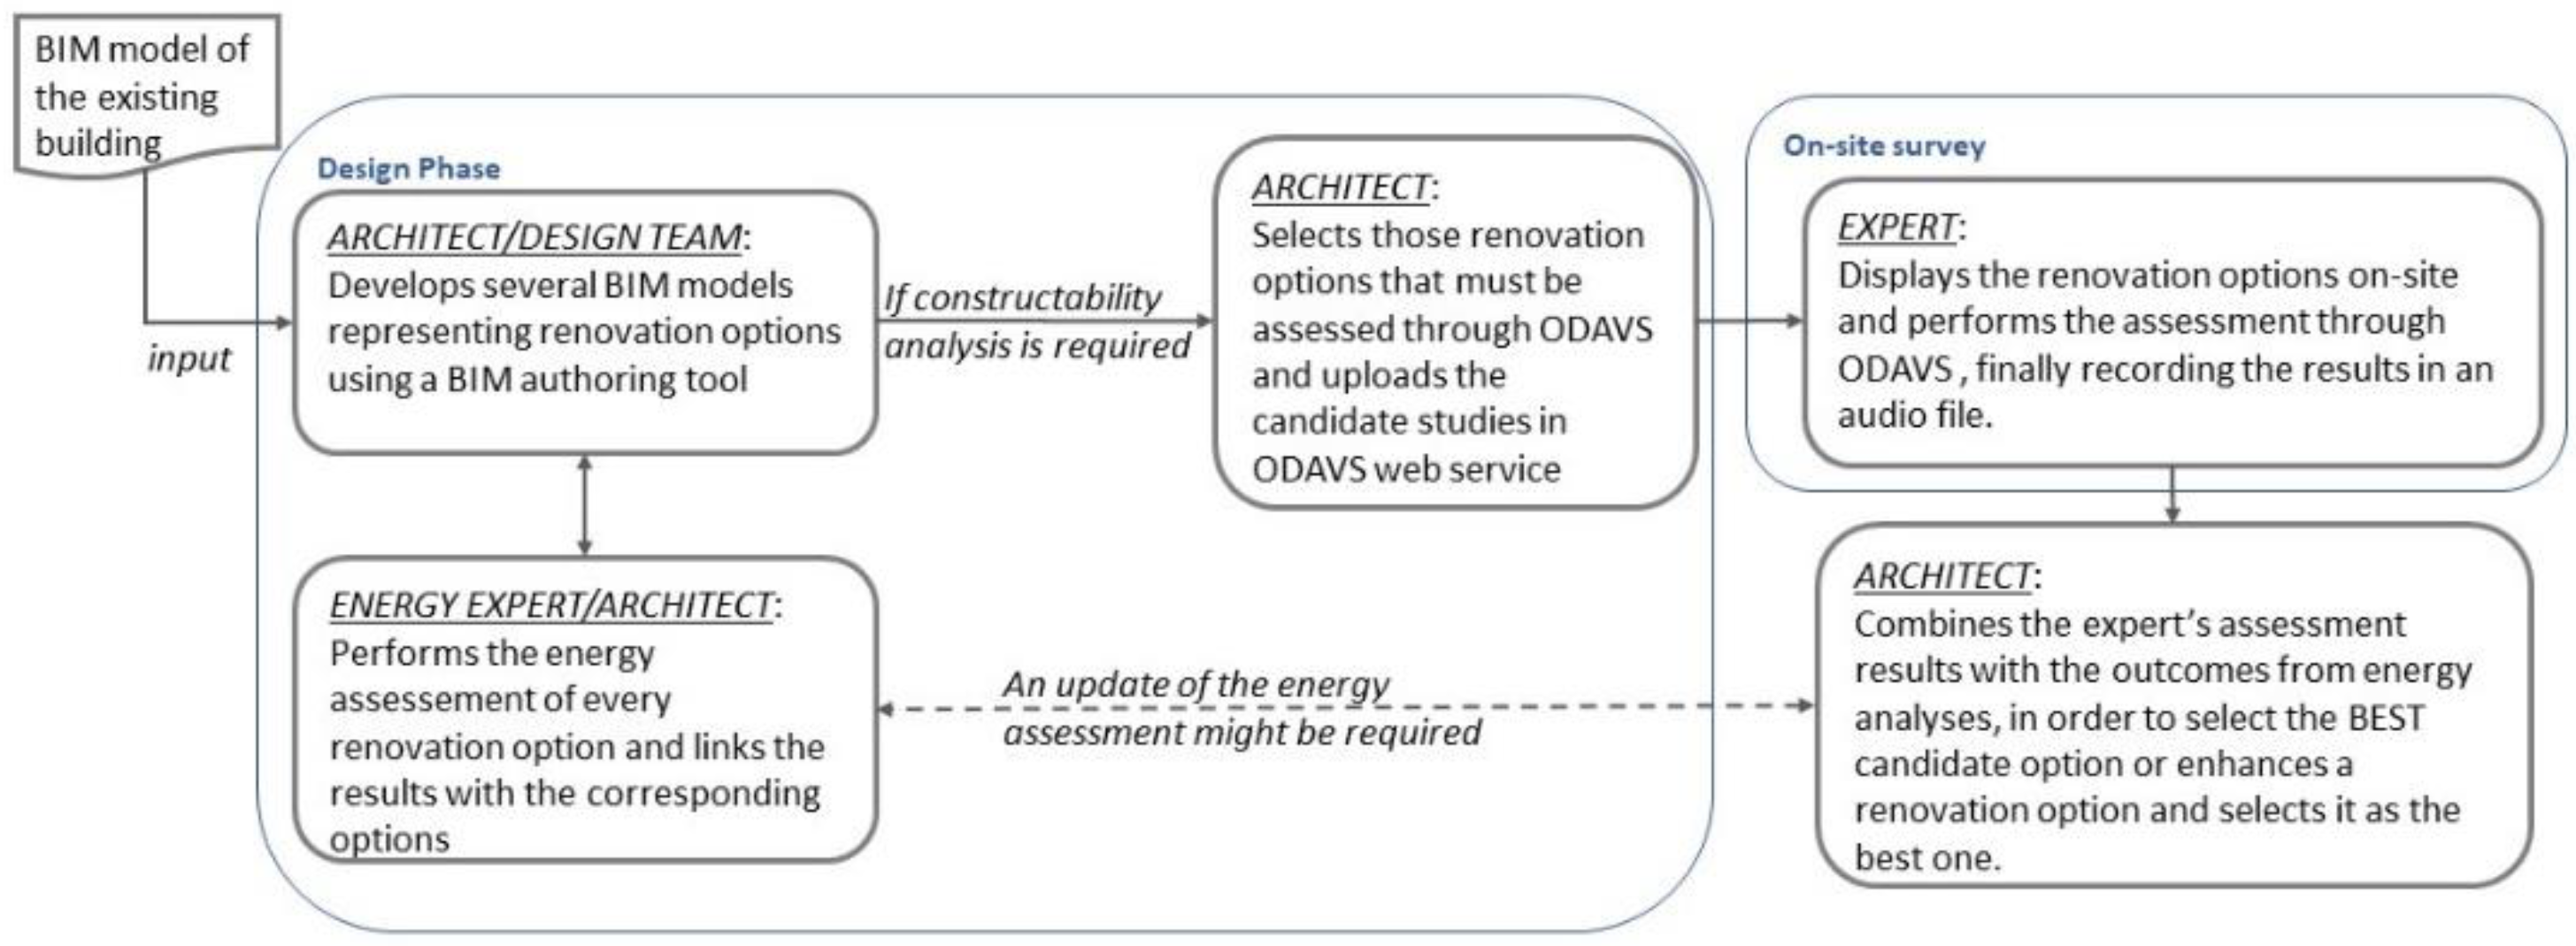
3.3.1. The Workflow Enabled by the MR Application

ODAVS enables asynchronous cooperation between the design team and experts in charge of verifying the constructability of some design solutions regarding the energy renovation of buildings. As depicted in Figure 1, the design team is supposed to create the model of the current status of the building through a BIM authoring software. Based on this scenario, a few alternative renovation options can be worked out as BIM models and assessed in terms of energy performances, which could be the main criteria used to compare the several options [37]. However, designers must often evaluate constructability issues prior to moving forward into the engineering phase. One of the reasons might be that either geometry or technical compliance between some components of the existing building and the renovated scenario must be verified. Furthermore, in a renovation scenario it is not infrequent for an architect to gather the opinions of experts (e.g., specialty contractors in charge of renovation works or technicians). The increased efficiency determined by the service reported in this paper lies in two aspects. Firstly, the architect and the expert can even perform their evaluation asynchronously. In fact, once the expert is on-site, she/he can display every candidate study through the MR headset and align the virtual model over the real building. During the survey, the expert can attach one or several audio files including his/her opinions about the key components of every candidate study. Then, the architect can listen to the audio files at any time. Secondly, the display of the virtual model by means of the MR tool allows for a direct comparison between the renovated virtual model and the existing status of the building, thus reaching the highest level of accuracy when comparing the two different phases of “existing” versus “renovated”. The help provided by ODAVS becomes even more valid whenever small components are the causes of constructability issues such as geometric clashes. To the best of the authors’ knowledge, BIM models of existing buildings developed by surveyors often fail to include small components such as light switches, sockets and elevator buttons in the correct locations. Research on the automated detection of those objects is still in progress [38]. As a result, these objects may cause clashes with new components (e.g., air supply inlets) included in the model of the to-be-renovated building and an on-site verification through ODAVS can detect such conflicts at the design process stage.

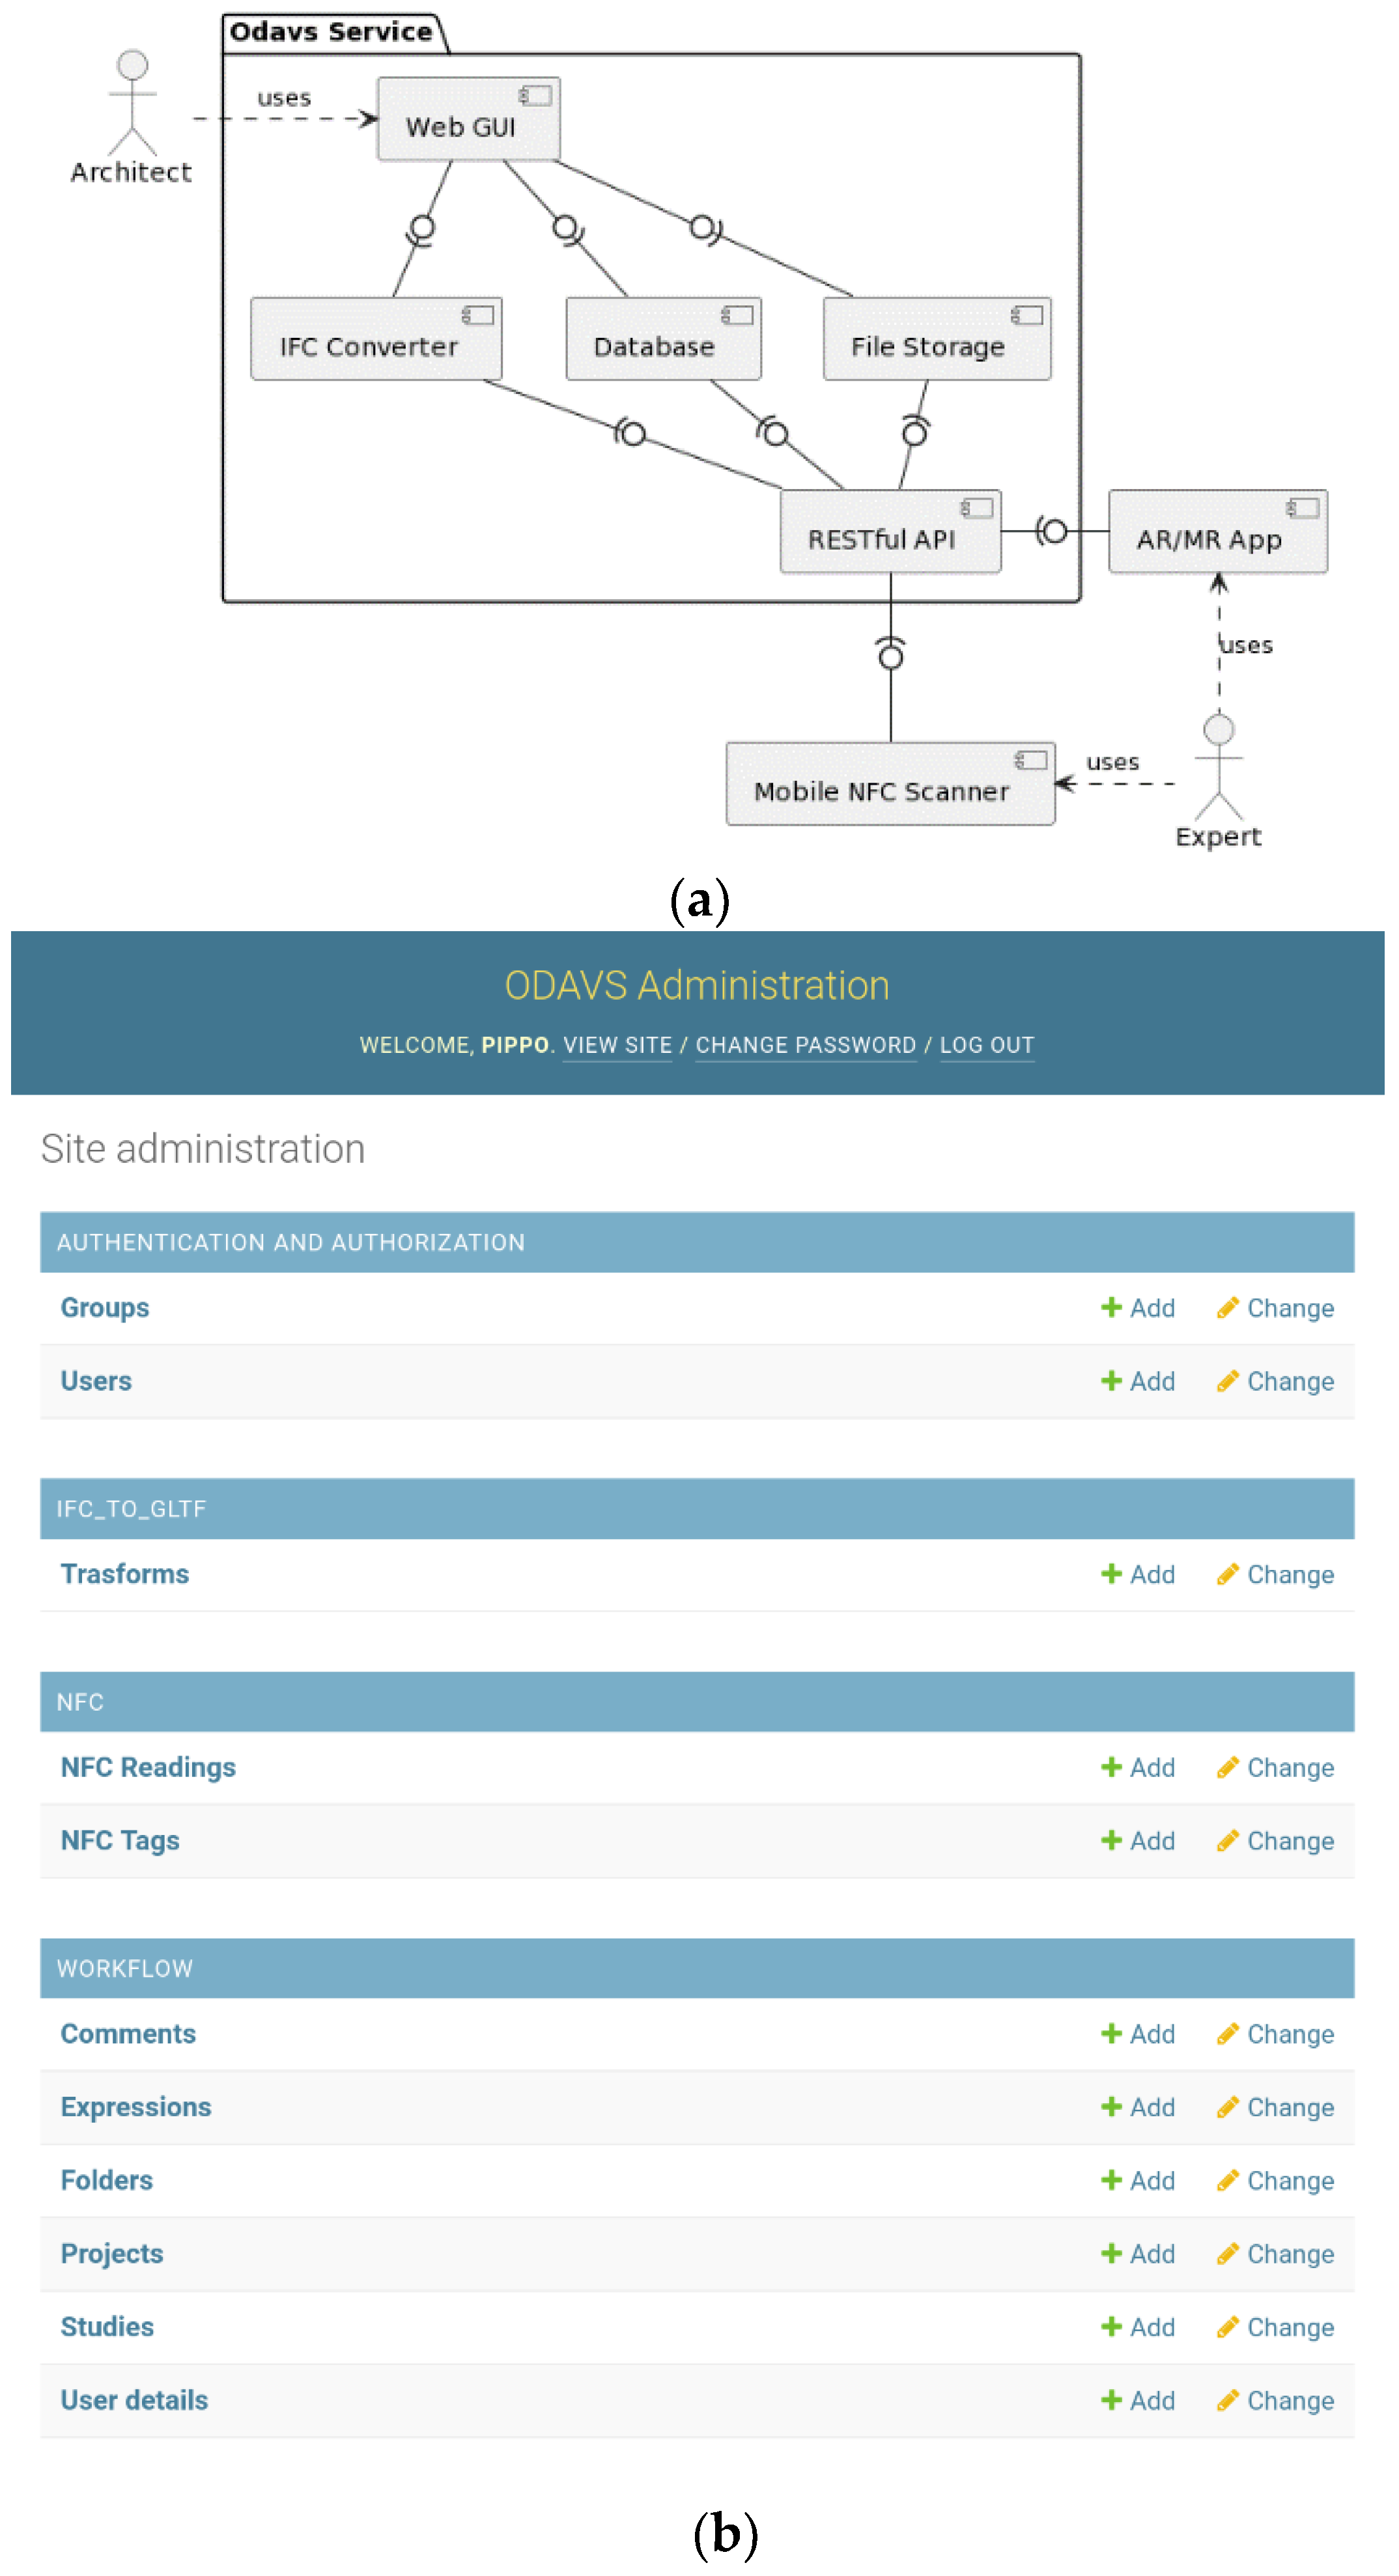
3.3.2. Architecture of the MR Application and Web GUI

The key components of the ODAVS architecture are depicted in Figure 2a. File Storage is responsible for storing the renovation designs uploaded by the architect as IFC datasets, together with the temporary files produced by the service along the way, along with the audio files recording the comments made by the on-site experts and uploaded through the HoloLens MR application. A Database stores metadata about the project the user is working on, the several renovation scenarios included in each project and the geometrical information extracted from the IFC files. A RESTful API gives access to all the data stored using the Database as well as the File Storage, allowing a seamless read–write interaction between remote units and the ODAVS service, provided that the remote user is authenticated and has been granted the necessary capabilities. Finally, a Web GUI guides the user through the intended workflow, again, on condition that she/he matches the authentication and authorization criteria of each step. An IFC converter is responsible for taking the IFC dataset uploaded by the user and transforming it. The purpose of such a transformation is to store the geometrical information separately from the non-geometrical, logical relationships among the objects modeled in the IFC file. The latter is indeed recognized as not being suitable for visualizing geometries, especially on devices with limited resources [39,40]. Thanks to this converter, the geometrical information is extracted and stored on a separate GLTF file, which is more suitable for being rendered on handheld or HoloLens devices. Indeed, even though the standardization of the GLTF file format is relatively recent, it has already become a de-facto standard for 3D visualization in AR/MR applications, being sponsored and supported with tools and devices released by major IT companies [41]. The IFC converter acts as a function taking an IFC dataset as input and returning on one side a GLTF file containing the collection of 3D objects ready to be downloaded and rendered by the remote MR application, and on the other side a JSON file describing the “logical” relationships among the objects and the properties as they were described in the original IFC dataset. The characteristic of the produced JSON file is that it links the identifiers of each IFC object (e.g., its line number, its IfcGloballyUniqueId, i.e., GUID) with the identifiers of 3D objects included in the GLTF file. Having both files in GLTF and JSON formats as input, the MR application is capable of smoothly rendering a 3D view of the objects originally contained in the IFC dataset, and, in parallel, it is capable of reconstructing the tree of relationships among them in order to implement smart functionalities. For instance, thanks to the information stored in the JSON file, a simple filtering algorithm may allow the user to show or hide the 3D objects that are associated with a given IFC Object Type. As another example, when the user of the MR Application points towards a 3D object, through the mapping between 3D objects and IFC objects contained in the JSON file, a straightforward algorithm can recover the GUID of the IFC Object corresponding to the pointed 3D object and use this information to enrich the piece of BIM represented by the original IFC dataset. The IFC Converter is based upon XbimGltf, an extension of Xbim. Essentials, a state-of-the-art open-source C# library [42]. In the user interaction model, an architect should login on to the ODAVS service and create one or more projects (Figure 2b) by providing some metadata for each of them. Once this step has been accomplished, she/he can create one or more renovations scenarios and associate them with a project. In this respect, the project acts as a folder containing several alternative renovation scenarios conducted by the architect and her/his team. For each study, the user provides the relevant metadata and uploads an IFC dataset including the model of the renovated scenario as the result of the exported BIM model performed by an architect working in a BIM authoring tool. When confirming and saving the study, the IFC dataset is passed to the IFC Converter, which in turn stores the GLTF and JSON files generated from it, and links them to the study itself. In this way, for each study, the user has access, at any moment, through the WEB Gui or via the RESTful API, to three files: the original IFC dataset, the 3D representation contained in the GLTF file as well as the tree of IFC objects and properties represented in a JSON file.
While the ODAVS Service supports both IFC 2 × 3 and IFC 4 datasets without any special requirement, in order to facilitate interaction with the user, it assumes objects from a custom IFC family called “RFID” might be present, to denote the position in the original building of NFC tags used to align the tool, as later described in Section 3.3.4. Such objects could be tiny boxes or circles, denoting the fact that token-style NFC tags or smart cards with NFC tags are used inside walls or next to electric switches of the facility to be renovated. The use of such tags is emerging as a technology enabling the smart management of buildings and infrastructures throughout its entire lifecycle [43,44], and this motivated their use in ODAVS to ease remote collaboration between the architect and the on-site expert wearing the MR application.
If the IFC datasets uploaded with each renovation study make use of the special IFC family named RFID, the architect has the opportunity to use the Web GUI (see Figure 2b) in order to build a registry of NFC tags embodied in the building to be renovated. The set of NFC tags is intended to be shared by all the renovation options contained in a given project. For each of the NFC tags, the user associates the universal identifier (UID) of the latter with the GUIDs of the IFC Objects having RFID family and representing the NFC tag within the uploaded IFC datasets, as well as a short textual description to better identify the tag itself. In principle, each NFC tag can be linked to several different GUIDs, one for each alternative renovation study. This registry of NFC tags and the relation with the IFC Objects will be used later by the mobile NFC scanner and by the AR/MR application, during the model alignment task.
Concerning the Web GUI structure depicted in Figure 2b, it provides a Web user interface organized as a set of entity types, each containing pieces of information called entities supporting the aforementioned workflow. For each entity, four basic operations are possible through the Web GUI: adding a new entity, changing or deleting an existing entity and listing all or some of the entities of any given entity type. For each entity type, the links to the “Add” and “Change” operations are made available. Looking at the Web GUI from top to bottom, in the “Authentication and Authorization” section the entity types named Groups and Users are included. They allow the administrator to control the list of users with access to any entity type of the platform. They can limit the list of operations for a specific user or set of users. Through such entities, the platform implements a standard role-based access model for authorization, while authentication is based on standard password verification for each user. In the “IFC_TO_GLTF” section of the Web GUI, the entity type named “Transforms” keeps track of each request a user may have made to transform an IFC file into a GLTF one. In the “NFC section”, the entity type “NFC Tags” keeps track of all the serial codes of the RFID deployed in the buildings where ODAVS is going to be used, while the entity type “NFC readings” stores the relevant information of each RFID scan operation completed using the Mobile NFC scanner. In the “Workflow” section it is possible to find the core entity types of the ODAVS workflow. In particular, in “User Details” the administrator can associate a regular User with extra information concerning the usage of ODAVS, e.g., what projects are available to a given user. By means of entity types “Folders and Expressions”, the administrator can customize the list of IFC Object Types that can be shown or hidden through the interface of the MR App (e.g., furniture, systems, envelope). The entity type “Project” stores relevant metadata for each renovation project worked out within ODAVS, while the entity type “Study” stores further metadata for each candidate study to be assessed using ODAVS as well as their IFC attachments and can link them with the GLTF and JSON files generated using the “Transform” entity type. Finally, the “Comment” entity type contains the collection of annotations and comments uploaded by the user during the on-site survey through the MR App.

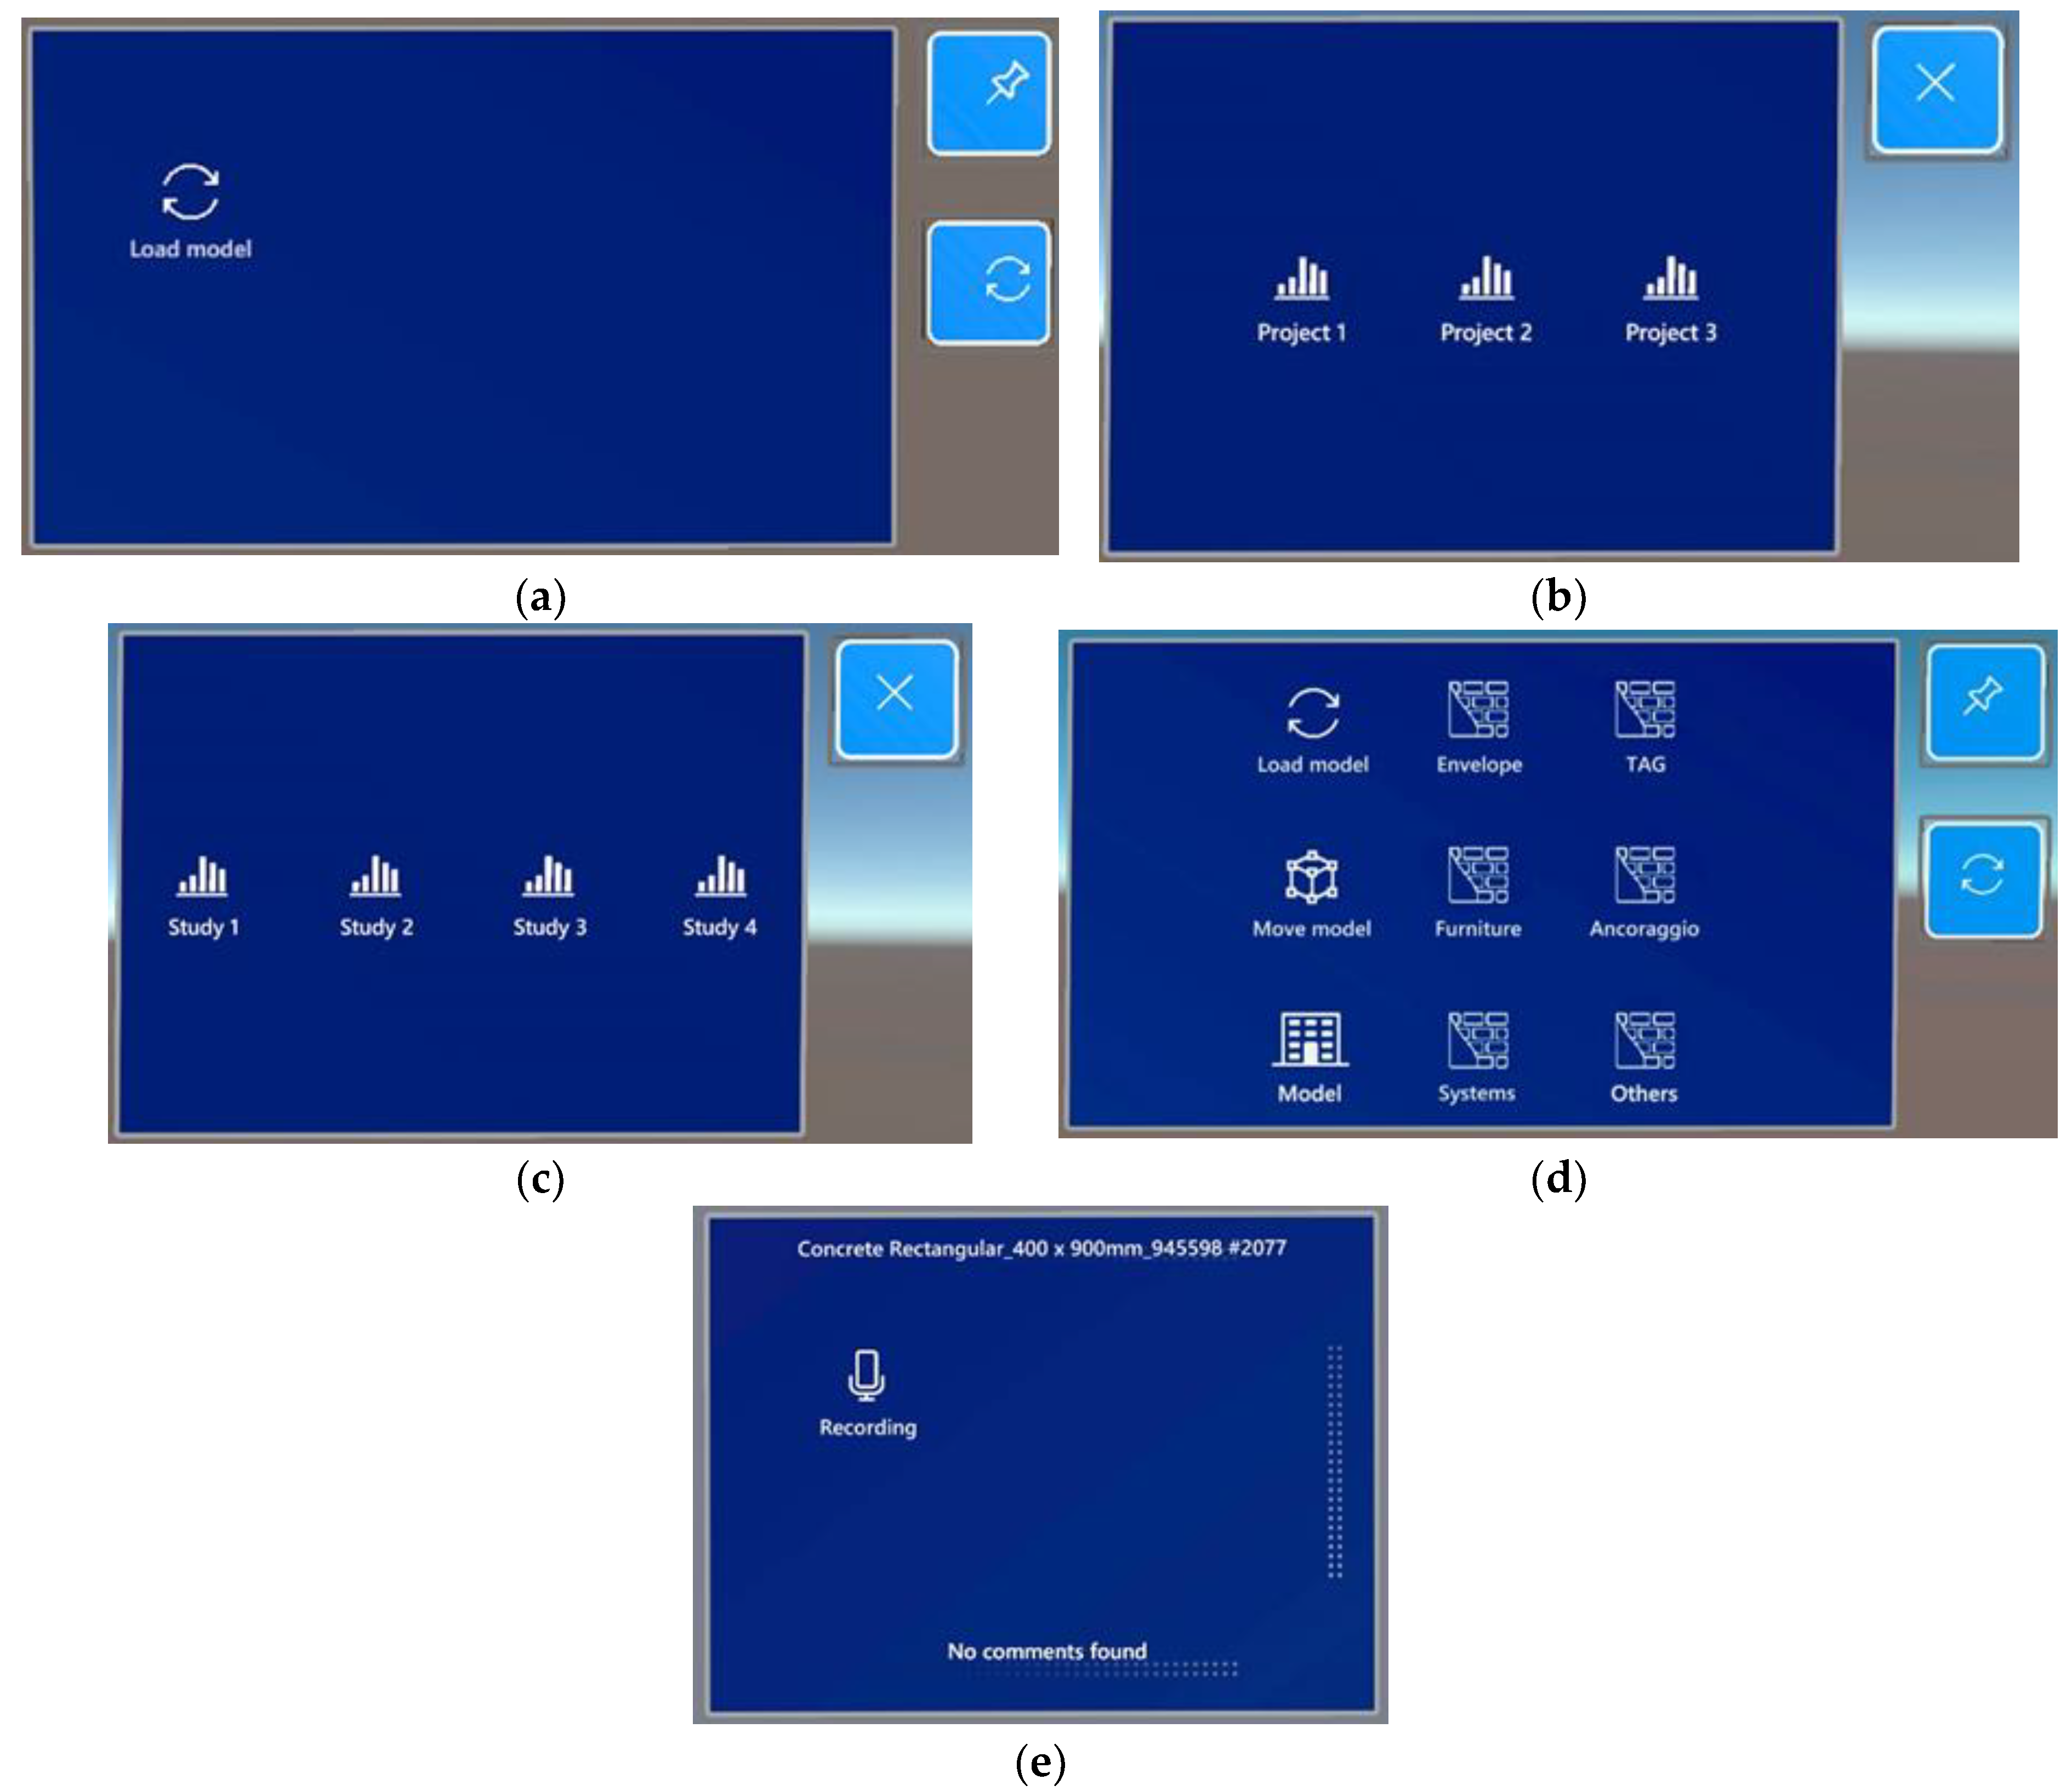
3.3.3. The On-Site MR App

The MR application for Microsoft HoloLens was developed under Unity3D 2019 environment with Microsoft Visual Studio 2019 (Microsoft Corp., Redmond, WA, USA) and Mixed Reality Toolkit (MRTK) for Unity (Unity Technologies, USA). The on-site app is a client for the RESTful API that hosts all the information used and produced by it. As reported in Section 3.3.2, at least one project and one study must be loaded via the Web GUI into the server and the corresponding IFC files must be converted into a pair of files: a 3D model in GTLF format and a JSON document.
The assessment task starts as soon as an expert is on site and establishes Internet connectivity. Then, he/she puts on the MR headset, logs into the device and runs the app. At this time, a virtual menu (Figure 3a) appears in front of the user allowing them to retrieve the available projects and renovation studies that can be assessed on-site. The user is then able to switch across different alternative options by selecting the desired project (Figure 3b) and, within it, the desired study (Figure 3c). After the selection of the study, the MR app queries the RESTful API for the related information (GLTF and JSON files). Once the download has been completed, the “Assessment menu” pops up (Figure 3d) for managing the loaded model that is not yet displayed on the MR app. This menu is made of several virtual buttons that allow the user to manage the model, to align it via RFID tags and to hide/show specific IFC categories of objects, which are outlined in Table 1.
By means of the buttons in the rightmost two columns of the menu in Figure 3d, any components corresponding to IFC types can be hidden/shown in order to keep visible only those parts of the renovation options that are useful to perform the assessment task and to hide objects that may obstruct the observer’s view from other parts of the model to be assessed.
Moreover, every component of the virtual model can be selected by gazing at it and performing an “air tap” gesture. Once the object is selected, a new virtual menu is shown (i.e., the “Recording menu” of Figure 3e), that enables the user to record a voice comment as an audio file. As soon as the recording phase is over, the file is sent to the RESTful API along with the GUID of the object to which it must be attached, and it is shown as an available file on the right side of the “Recording menu”. As a result, the final assessment of a study will consist of a set of audio files attached to IFC elements that can be played back either on site by the experts, using the MR application, or off site and asynchronously by any members of the design team, using the WEB Gui.

3.3.4. The Alignment Tool

In this paper, the Microsoft™ HoloLens 2.0 (Microsoft Corp., Redmond, WA, USA) device was adopted for addressing all the above MR requirements, except for the registration, for which a new approach for the alignment of virtual BIM models over reality is suggested. The solution presented is based on the use of short-range RFID tags, which can be kept embedded in building components, irrespective of the building layout evolution, or even the replacement of minor building components due to regular maintenance. As compared with the manual alignment method, the new method can be applied even if the virtual elements do not have their physical and stable counterparts in the real world. As compared with the marker-based approach, the new method is less demanding because it does not require QR code labels to be affixed in the building and to be made visible prior to every survey. The MR application for HoloLens was developed using the Unity3D 2019 environment with Microsoft Visual Studio 2019 (Microsoft Corp., Redmond, WA, USA) and Mixed Reality Toolkit (MRTK) for Unity (Unity Technologies, USA), together with the wide set of available libraries provided by the community.
With reference to Section 2.4, the registration problem consists of keeping the holograms aligned with actual objects in the existing building in real time. This objective is achieved by means of the tracking capability of the MR device, together with an offset elimination procedure (that we call model alignment) that must be implemented for each specific model. The approach for model alignment reported in this paper solves this problem by using RFID tags together with a handheld device (e.g., a smartphone) capable of reading RFID tags. We assume such tags have been previously and once and for all embedded in the building (e.g., during the construction or in the first on-site survey) and can also be embedded in building components, thus making them invisible and persistent. In addition, this approach overtakes the need for having the real counterpart of a virtual element, which is compulsory for the manual/semi-manual alignment methods, as described in Section 2.4. This improves and generalizes the alignment process both in terms of efficiency and quality of results.
The RFID used for this purpose are short range NFC tags compliant with ISO 14443, HF, MIFARE standard. They can be read/written with NFC enabled handheld devices within a 0.04 m range, depending on the geometry of the antenna and on the reader’s configuration. This reduced reading distance allows for the precise localization of the tag inside a component. This operation is supported by the handheld device Mobile NFC scanner that exploits the Web NFC API for reading the information stored in the NFC tags.
Alignment of models with the physical world is carried out by means of a visual localization of the handheld device that reads a tag and calculates its relative position with regard to the model (Figure 4). The offset between its position in the model and its actual position is used for aligning models over the physical world. When the Mobile NFC scanner detects an NFC tag, it sends a request to the RESTful API to save a new NFC read event. The latter stores the UID read from the NFC tag together with the date and time of the reading event. If the communication with the RESTful API is successful, a target image is shown on the display of the Mobile NFC scanner that is recognized by the MR application that precisely and rapidly localizes it by exploiting the capabilities of available AR engines, such as OpenCV or Vuforia. In our application we embedded the latter.
In general, the image tracking algorithm is based on a Feature Extraction method (e.g., SIFT, SURF, ORB description–extraction algorithms) that consists of two phases: feature points detection and descriptor–extraction for the detected feature points. For each frame F acquired by the camera, given an arbitrary target image I, the image tracking algorithm consists of [45]:
  • Extraction of features from the target I (only during the initialization phase) producing the target object (including image, feature, descriptor);
  • Extraction of features from the frame F producing the frame object (including image, feature, descriptor);
  • Matching of feature points: by searching for the nearest neighbor from each element of a set of descriptors to the other set. Outliers must be removed to minimize false positive matches (e.g., by the ratio test);
  • Homography estimation and refinement: estimates the homography matrix that will bring points from a target image I to the frame F coordinate system by also filtering out geometrically incorrect matches [46];
  • Transformation of the target corners to the frame coordinate system to obtain target I location on the frame image F;
  • Estimation of the 3D pose of the target I: only its center i is relevant for performing the alignment and, with MR headsets, this mapping can be directly performed by raytracing the 2D image center into the spatial map (3D mesh) of the environment.
Since the detected distance from the observer is highly sensitive to scale variations of the target image, only the observer direction is used from image detection and the actual distance is measured by exploiting the raytracing capability of the MR headset. The resulting position is then always snapped to the observed surface. The alignment procedure based on NFC tags assumes that at least two IFC elements of the RFID family have been placed in known positions in the BIM model of the building with their UID as an attribute. For the sake of simplicity, but without loss of generality, the model is assumed to be horizontal since the inertial sensors of the MR headset are usually accurate enough to ensure this. Therefore, there are just four remaining degrees of freedom to align the model with reality: three for translation and one for rotation around the vertical axis. This implies that just two reference points are enough to perform alignment: the first point enables the translation of the model and the second one is used for rotating it.
At the beginning, the loaded model is placed in position P with respect to the right-handed reference system of the MR device. When the image target is visually detected for the first time, its position in space i 1 is returned by the MR headset and the handheld device sends the UID of the NFC tag UID1 to the server to match it with the model and retrieve the position in space of the corresponding tag t1. Since the two positions should overlap, the first alignment operation is a translation of the model by the detected offset i 1 t 1 :
P = P + i 1 t 1
Then, the user looks at the second image target in position i 2 at which the NFC tag with U I D 2 is placed. This UID matches with the tag in position t 2 in the model. The distance vectors among the couple of image targets in reality i 21   = def   i 2 i 1 and the couple of tags in the model t 21   = def   t 2 t 1 are then exploited to determine the rotation that also overlaps the second tag. The horizontality assumption allows us to project them to the horizontal plane and to perform just a rotation around the vertical axis. By denoting the projections of vectors i 21 and t 21 on the horizontal plane with i ¯ 21 and t ¯ 21 , and by defining their unit vectors i ¯   = def   i ¯ 21 / i ¯ 21 and t ¯   = def   t ¯ 21 / t ¯ 21 respectively, the rotation matrix that rotates i ¯ onto t ¯ by a counter clockwise angle θ is given by:
R = c s 0 s c 0 0 0 1
where v   = def   i ¯ × t ¯ is the cross product of the two unit vectors with module s   = def   v   = s i n θ , c   = def   i ¯ t ¯ = c o s θ is the dot product of the two unit vectors. Since the two vectors are applied to a common point i 1 = t 1 generally not placed at the origin, this pivot point must be placed at the origin before rotation by applying translation P = P t 1 , then the model must be rotated with rotation matrix R (eventually regularized by the use of the corresponding quaternions), and at the end it must be translated back to the original position by P = P + t 1 . Due to unavoidable uncertainties, the distance between the image targets will always be slightly different from that between the tags in the model. Once the planes containing the tags and that containing the image targets overlap, the two remaining degrees of freedom are used to fine-tune the position of the model by moving it along this plane in order to minimize the distance among the two couples:
P = P + i 2 t 2 / 2
In order to avoid any unnecessary computational burden, for the implementation in the game engine, all the transformations are performed on a not rendering dummy game object and, only at the end of the alignment, are they applied to the building model. In case more than two reference points are detected, the procedure can be repeated by considering the most significant couple of tags (e.g., the last two or the farthest). A regression approach can also be implemented for progressively refining the alignment when many tags are considered simultaneously.

3.4. Data Collection Method

The eight volunteers chosen for the experiment attempted to perform the assessment of two renovation projects in two consecutive days. This allowed us to make a comparison of the performances between the two days, too. These tasks were carried out in a realistic environment provided by JEA. JEA owns two demonstrator housings, called “pattern housing” and “experimental housing”; in this case the latter was used to test the technology. The validation concerned two renovation options suitable for the experimental housing where the tests took place. Prior to the execution of tests, the eight volunteers were involved in a training session that was managed by one researcher from JEA and two researchers from the Polytechnic University of Marche, all skilled in the procedures and technology to be tested. The training session left the volunteers free to become familiar with the technology. As a result, during the tests they could use the MR App with no interference from the expert operators and a frank account could be recorded on the perceived usefulness and perceived ease-of-use of the technology, without being affected by any bias or other external variables. Finally, at the end of each day, each participant was asked to answer a questionnaire about the technology experience. The questions are listed in Table 2 and Table 3, while demographics and answers to open-ended questions are included in Table 4 and Table 5, and they will be discussed extensively in Section 4. The experimental facilities managed by JEA and built with construction features, surfaces and materials typical of the social housings of Extremadura are depicted in Figure 5a.
The two renovation alternatives were developed and uploaded on ODAVS as IFC files exported from Autodesk RevitTM. Two different sets of renovation actions were assigned to each of them, so as to increase the variety of situations in which any volunteer would operate and test his/her ability to properly use the system during the validation phase.
The first renovation alternative is partially depicted in Figure 5b and concerns four main renovation actions. The first one is the installation of a mechanical air supply system to serve both the ground and the first floor of the building. This new system requires the installation of another new component, that is, the ceiling to enclose such air supply systems and to hold air inlets and other units. In addition, a new partition was hypothesized in the north-facing rooms on the ground and first floors, that is, the facade of the building located in the forefront in Figure 5b. The last action concerns the installation of sensors on the inner side of the south-facing envelope to track air quality in the building.
The second renovation alternative concerns the installation of electronic window openers and sun shading systems on the inner and outer side, respectively, of the south facing external wall, which is in the forefront of the picture shown in Figure 5c. Moreover, north facing windows were resized, as is visible in the same figure, and an external coating will be installed on both the south- and north- facing walls, which will increase the overall thickness as a consequence.
The range of renovation actions included in the aforementioned scenarios was determined in such a way to encourage a few inferences from the volunteers joining on-site tests. They were expected to be able to assess the executability of these solutions because they concern an existing building. In addition, they could detect constructability issues, such as spatial clashes or technical incompatibilities between the components of the design model and the components in the existing building. Finally, assessments were expected to arise regarding the display quality of a virtual model over imposed on real components and the usability of the MR application.
Three main tasks were carried out on the first day:
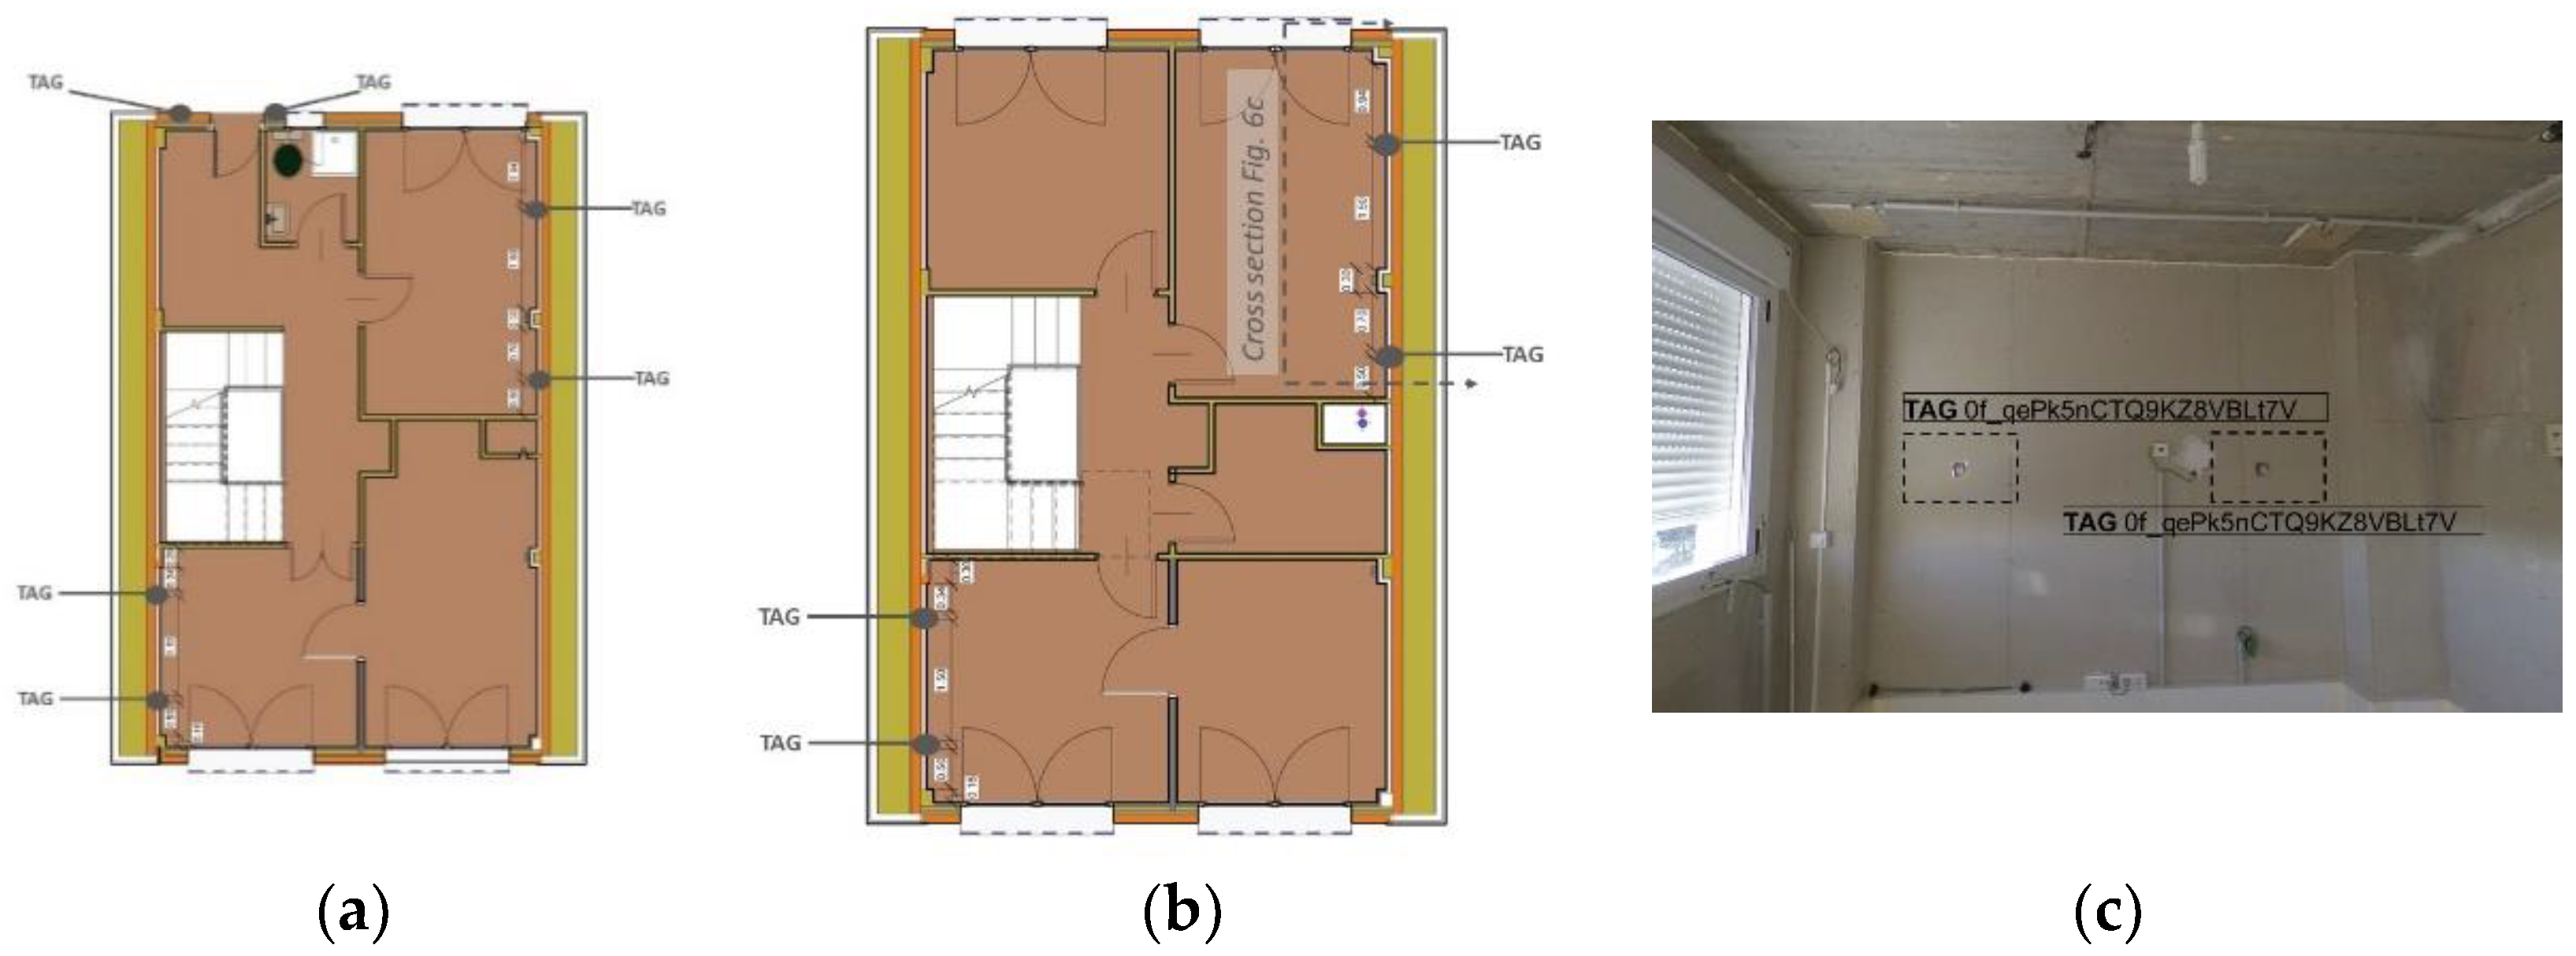
  • Set-up of ODAVS and uploading of the renovation alternative no. 1 (Figure 5b), performed by the researchers from the Polytechnic University of Marche;
  • A training session involving the eight volunteers, jointly led by the three experts in the technology;
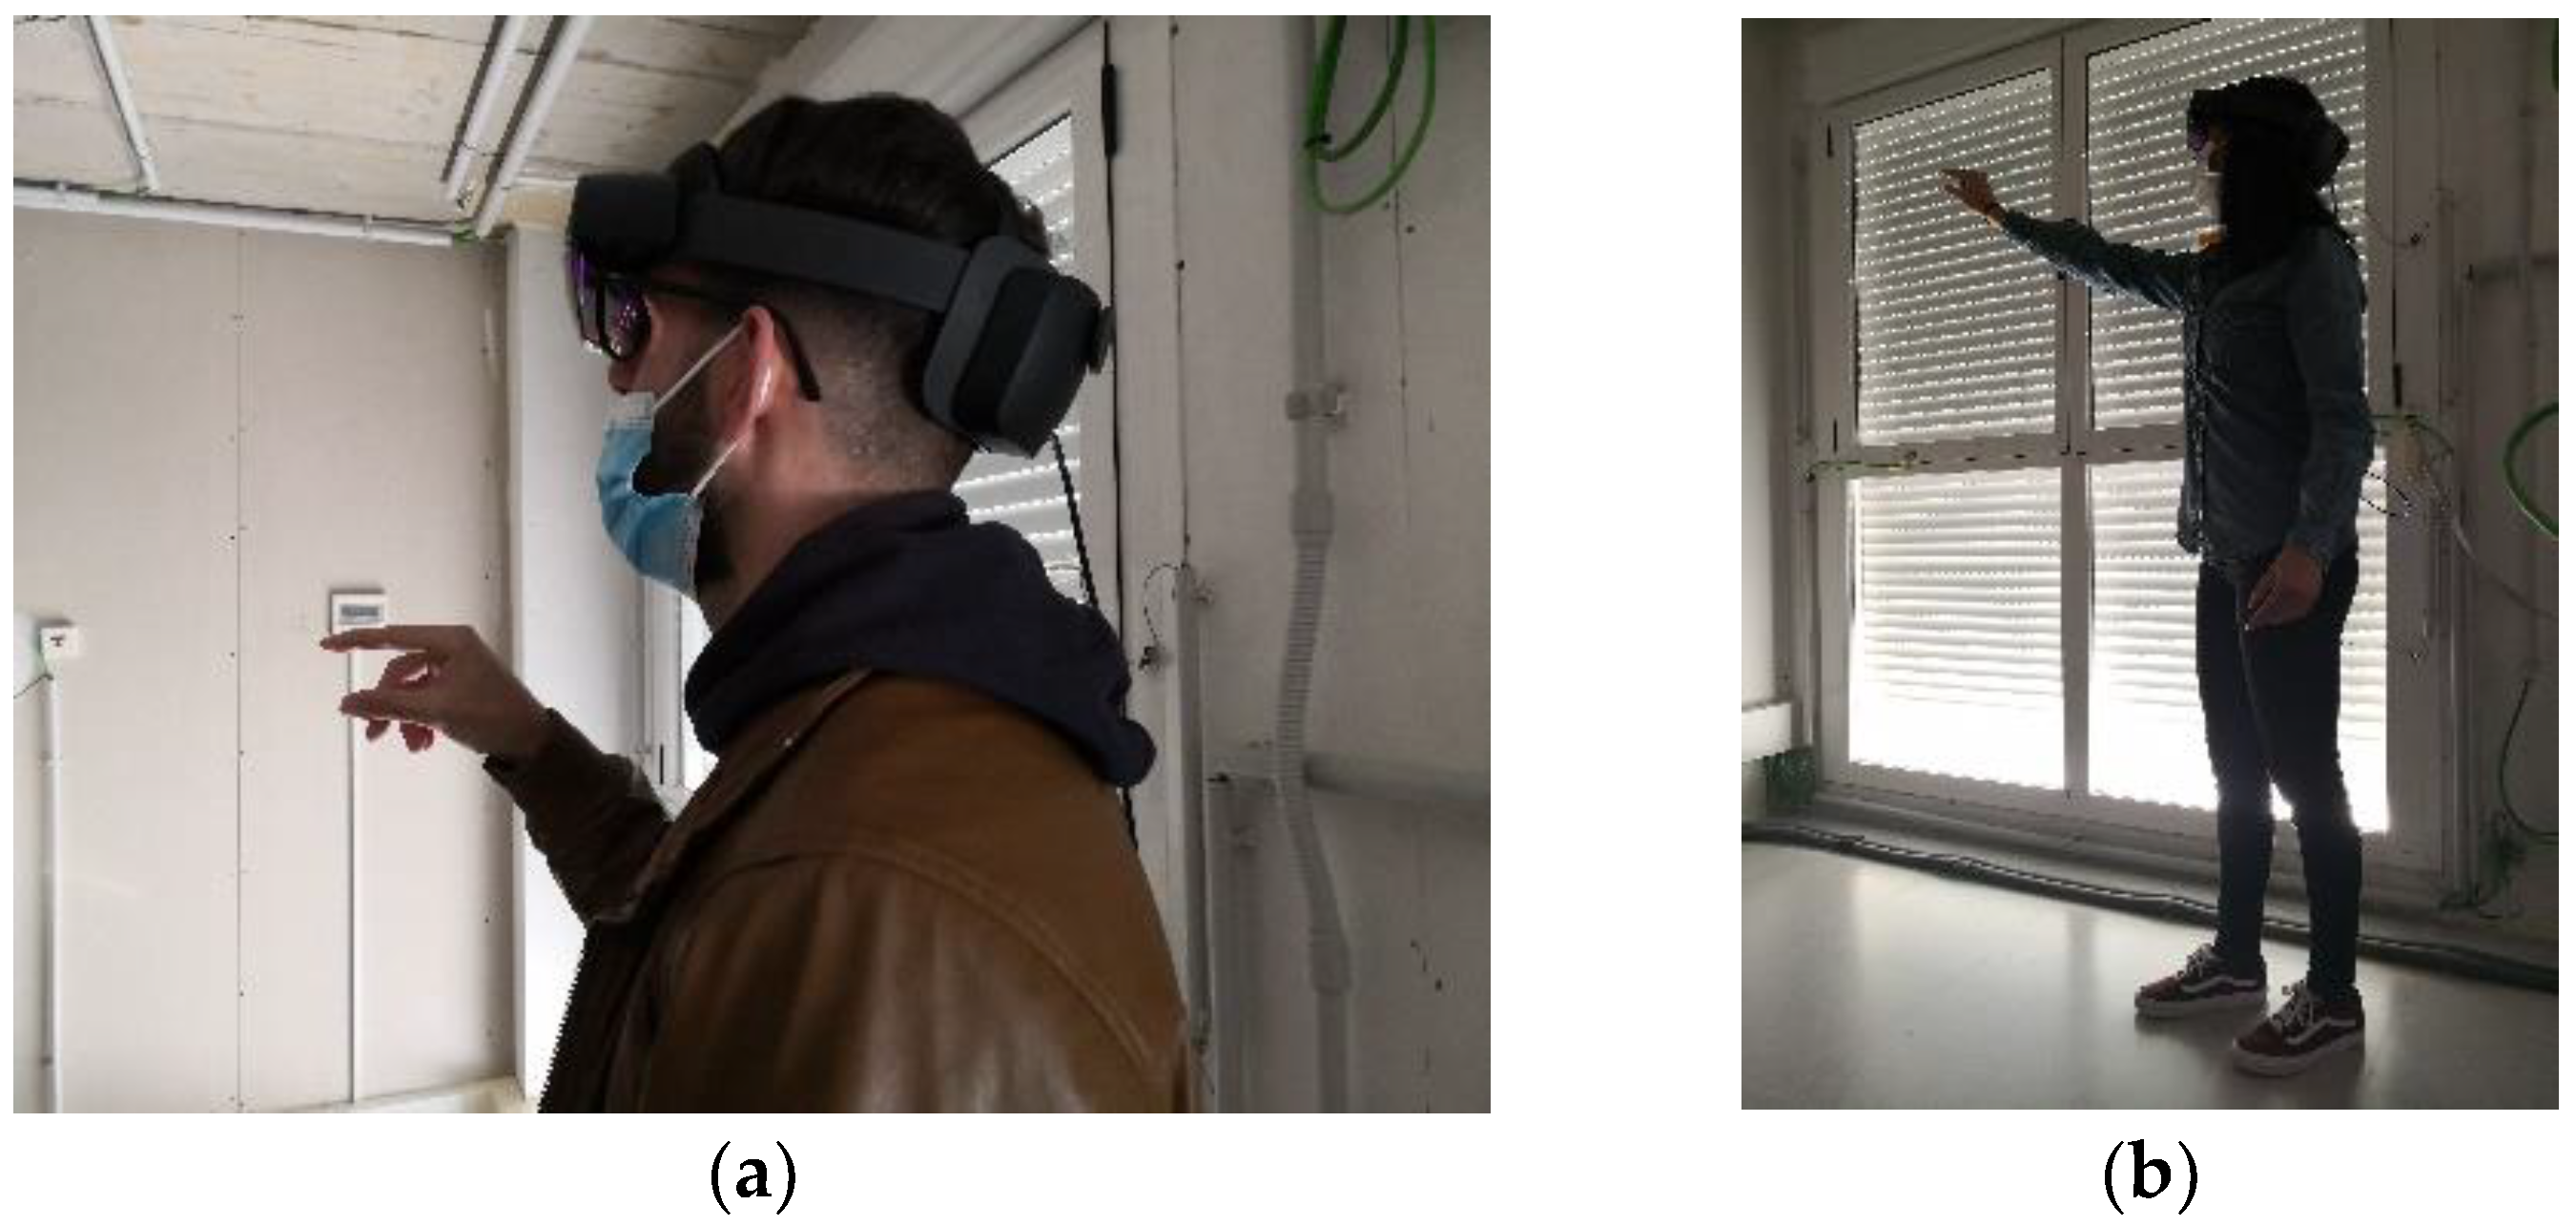
  • Execution of the first session of real-life tests, concerning the renovation alternative no. 1, when every volunteer was asked to assess such a model on their own by using the MR Application.
Finally, once a volunteer accomplished their task, he/she was asked to fill in questionnaire no. 1, the questions of which are included in Table 2. It is noteworthy that this questionnaire was split into four groups. The first group consisted of questions numbered from no. 1 to no. 6 concerning their opinions about the technical features of the renovation model to be assessed. The purpose of this group was to check whether ODAVS worked well and was clear enough to allow the volunteers to understand the model while surveying on-site. The second one consisted of questions numbered from 7 to 10 plus question no. 15 and concerned the ease-of-use of the system. The third group of questions included questions from no. 11 to 14 plus questions 16 and 17. The purpose of this third group was to obtain a frank account of the quality of the displayed holograms. The fourth group of questions consisted of the open-ended questions no. 18 and 19 that collected comments, along with question no. 23 asking for an overall score of the technology. Finally, questions no. 20, 21 and 22 are not shown in Table 2 because they do not concern ODAVS, but rather, they gathered data about the volunteers’ age range, degree of education and current job. The scores provided as answers consisted of a four-point Likert scale, that ranged from “Disagree” to “Strongly agree”. In order to work out descriptive statistics, every point of this scale was matched with a number between 1 and 4. In particular, the points of the Likert scale ranging from “Disagree”, through “Neutral”, “Agree” and “Strongly agree” matched with the numbers 1, 2, 3 and 4, respectively. Every answer was collected in real-time on a dedicated on-line service.
Then, on the second day two additional main tasks were carried out:
  • Set-up of ODAVS and uploading of the renovation alternative no. 2 (Figure 5c), performed by the researchers from the Polytechnic University of Marche;
  • Execution of the second session of real-life tests concerning the renovation alternative no. 2, when every volunteer was asked to assess such a model on their own by using the MR Application.
In the second questionnaire, the first group consisted of four questions, which concerned the opinions of the respondents regarding the technical features of the second model to be assessed. The remaining questions were placed from no. 5 to no. 21 and had the same phrasing and grouping as the questions numbered from 7 to 23 in the first questionnaire (Table 3).

3.5. Data Analysis Strategy

The reliability of the answers collected was assessed by means of the Cronbach coefficient alpha indicator applied to the subset of questions strictly concerning the topic “ease of use” of the system [47], which were numbered from 7 to 10 plus 15 in both questionnaires. It was worth carrying out an in-depth analysis of this subset of questions because it can express the quality of the relationship between operators and the MR application. Technically, Cronbach’s alpha measures the inter-item correlation among the measurement items and is computed by correlating the score for each scale item with the total score for each of the eight observations provided by every survey respondent, then comparing that with the variance for all individual item scores. In case we have k scale items, a variance σ y i 2 is associated with each item i and σ x 2 refers to the variance associated with the observed total scores, the alpha coefficient is computed as [48]:
α = k k 1 · 1 i = 1 k σ y i 2 σ x 2
The estimation was performed by means of the “psy” package of the R Project for Statistical Computing.
Then, two separate descriptive statistics were worked, in order to obtain one set of results for each experimental day. These statistics included mean value, variance, standard deviation, lowest and highest values, median and range of the scores collected in each of the questions evaluated through the Likert scale.
Finally, a Wilcoxon rank test was performed on the two paired samples represented by answers numbered from 7 to 10 along with answers to question no. 15 in both datasets, in order to confirm or reject the null hypothesis stating that “the score assigned by respondents and concerning the ease-of-use of the system on the first day is the same as the score assigned on the second day” [49].

4. Result of Findings

Within task no. 1 on day 1 (Section 3.4), the two researchers performed the alignment of the virtual model in two steps. First, they displayed the BIM model including the renovation alternative no. 1 and queried the model for all the entities that belonged to the “QR Code” family. Secondly, a tag was placed in the demonstrator at the same locations where it was found in the BIM model, as depicted in Figure 6a,b which includes the plan views of the BIM model. In these figures every tag is labelled by the word “tag”. Two of the tags installed on the first floor are shown in the front view of Figure 6c (referenced by Figure 6b) and labelled by the GUID and they were assigned in the exported IFC file of the model. This setup allowed the team to align the model of the renovation alternative no. 1 over the real building thanks to the implementation of the approach reported in Section 3.3.4.
The second task concerned the training of volunteers. The purpose of this task was to teach volunteers how to use the MR Application. The training sessions started with a general overview of the ODAVS components, and in particular, the MR Application. Then, the team of experts showed all the volunteers how to use hand gestures to open the main menu and to start the MR Application. Moreover, they became familiar with the model of the renovation alternative no. Some additional clarifications were provided about the main options of the virtual menu of the MR Application and about how every feature could be used during the assessment.
Then, every volunteer was asked to perform the assessment of the first renovation option on their own. During this task they were not helped by experts. Each person was encouraged to visit the whole ground floor of the building, to navigate the virtual model and to record at least one audio comment about at least one of the components affected by the renovation option under assessment (Figure 7a,b). This task took about 2 h and 30 min to be accomplished by all the volunteers, who were able to record and upload twenty-one comments using the MR Application. Eighteen out of the twenty-one comments were valid. The remaining ones were either empty or too noisy to be understood. This means that more than 85% of the audio files were recorded correctly. Figure 8a depicts a screenshot of the first-person view of one of the volunteers while using the MR Application to record a comment concerning the position of air inlets. In this case, a portion of the ceiling had been hidden by the volunteer in order to display the path of ducts to be installed in the ceiling. Prior to recording the comment, the user had selected the component interested by that assessment. Thanks to this action, every comment saved in the ODAVS platform was kept linked with the component it was referred to. Finally, every volunteer filled in questionnaire no. 1 (ref. Table 2).
The first task planned on the second day was performed in the same way as on the first day, with the exceptions that this assessment concerned the renovation alternative no. 2 reported in Section 3.4 and was performed on the first floor of the demonstration building. No training was executed on this second day. The assessment that took place on the second day was performed using the same rules as on the first day but took just over one hour. Hence, every volunteer proved to be more skilled and comfortable in the use of the technology than on the first day.
It is important to point out that assessing the second renovation study was more challenging than assessing the first one, because it included either minor renovation actions or changes integrated in existing components; hence, their visualization was more challenging. One example is the external wall coating and resizing of windows that could be seen through the windows’ glazed panels (Figure 8b): in this case, half of the opening occupied by the existing window will be replaced by a new wall, whose cross section is visible beyond the glass of the existing white framed window. Another example is the sun-shading system that is placed on the outer surface of the envelope. As a result of the overall assessment, ten audio files out of thirteen were successfully recorded (77%) and totally audible. Finally, every volunteer filled in questionnaire no. 2 (Table 3).
The feedback collected from questions 20–22 (see Table 4) concerned the demographic characteristics of the respondents and told us that all the volunteers who joined the survey had a master’s degree in a technical subject, such as engineering or architecture. Seven out of eight were employed as technicians (87.5%), such as an engineer or architect. The remaining one was employed as a developer of research projects (12.5%). Three of them were younger than thirty years old (37.5%), while the age of the other five people fell between thirty and fifty (62.5%).
Both Cronbach’s alpha tests involved five items assessed on the above-mentioned Likert scale and a sample of size eight (Equation (4)), which gave back alpha values as large as 0.454 and 0.678 in the first and second questionnaires, respectively. In the second case, it was higher than the recommended threshold which is usually set at 0.5 [50]. The first one was considered as acceptable, too, because it was close to that threshold, despite the quite limited sample size.
Descriptive statistics worked out from the two datasets are reported in Table 2 and Table 3. It is noteworthy that the cells regarding the questions of rows no. 5 and 6 in Table 3 are filled in with “NaN” values in order to align the rest of the answers from no. 7 to no. 23 in both questionnaires that facilitated a pairwise comparison of the results gathered over the two days.
The first check concerned the first six answers in the two questionnaires, which were about technical assessment matters of the two renovation scenarios. Whenever these answers are different from the value 2, that is, the one corresponding to the nominal value “neutral” in the Likert scale, it implies that participants were able to provide a sharp evaluation on constructability matters, thanks to the use of ODAVS. To be more specific, the percentage of answers equal to “Neutral” given to questions no. 1 to 6 on the first day were, respectively, 13%, 13%, 13%, 25%, 0% and 25%. On the second day, the “neutral” value was chosen as the answer to questions no. 1 to 4 by a percentage of volunteers equal to 13%, 0%, 0% and 13%, respectively. This suggests that on the second day the volunteers felt more confident.
Another remarkable result was that answers to questions no. 12 and 16 received low values on average, always included between 1.38 and 1.75 on the first day and equal to 1.38 on the second day. This evidence implies that few respondents felt uncomfortable while using ODAVS, whereas most of them appreciated its visualization capabilities. The average values of all the rest of the answers from question no. 7 to question no. 17 were ranked between 2.25 and 3.00 on the first day and between 2.13 and 3.25 on the second day. All the means were well above the “neutral” value. On the second day, the highest mean was higher than on the first day. The volunteers leaned towards higher scores on the second day, which could be a consequence of their improved skills. Finally, the mean value of the answers to question no. 23 was equal to 8.00 and 8.63 on the first and second day, respectively. These means were matched with very limited standard deviations which confirmed a quite good appreciation of the technology overall. Moreover, the average value was higher and the standard deviation was narrower on the second day, which could be a further confirmation of increased confidence with the technology.
The claim that “the score assigned by respondents on the first day is the same as the score assigned on the second day” (Section 3.5) could not be rejected, which shows that the ease-of-use of the ODAVS system was confirmed in both surveys, irrespective of the differences between the renovation design models to be assessed.
The answers to open-ended questions no. 18 and 19 were analyzed in order to gather suggestions for improving the technology in future research steps and are reported in Table 5, along with their frequencies and percentages. Twenty-five suggestions were collected. All the first four suggestions had the same 16% frequency and concerned both the brightness of the virtual model, which could be increased to facilitate the assessment, and the enhancement of selection capabilities. A total of 8% of the suggestions concerned the increased length of recordable comments and the possibility of representing the sequence of tasks to be executed in the construction phase. Every one of the remaining five comments obtained a 4% frequency and they concerned diverse issues, such as the enhancement of queries, field of view and visualization of the virtual hand; involvement of owners in the assessment by means of MR; and simulation of operable components.

5. Discussion

5.1. Field Experiments

Real-life tests were carried out in two days. They showcased that experts could easily locate renovation options in the ODAVS Web GUI and upload them to the MR Application right after the previous step. The only manual operation required is the positioning of tags in the same locations where they can be found in BIM models. Once this is accomplished, the MR Application can align virtual models over the real one. Then, the considerable performances of the eight volunteers during the execution of their tasks showed that they were well supported by the functionalities of the virtual menu, such as selecting components, hiding components and the merged display of virtual and real environments. One training session was long enough for them to become comfortable with the MR Application and all of them accomplished what was asked by the research team. The remarkable percentage of valid audio files recorded during the surveys in the two days, which were 85% and 77%, respectively, showed that they were able to provide the required feedback. Moreover, the relatively positive scores collected through questionnaires showed that they were all able to assess the models, irrespective of the types of renovation actions involved. Even analyzing the answers to question no. 23 in both questionnaires, in which the volunteers were asked to provide a general assessment ranging between 1 and 10, we noticed that the average values were always higher than 8 and the minimum are 6 and 7. These results confirm that, thanks to MR, several stakeholders, including owners and designers, can be involved in the decision-making process triggered by the management of renovation design processes in which the gathering of feedback is a key element to drive sustainable building renovation [17]. Indeed, the prototype can meet the request for a more accurate pre-evaluation process to be carried out at the design phase of renovation projects to reduce any risks connected with technical issues [20]. An integral part of the solution reported in this paper is the Web GUI facilitating collaboration among the different stakeholders, as described in Section 3.3. However, the implementation of the workflow subject of Section 3.3.1 asks for the availability of structured information that must be provided by BIM models, as already stated by other authors [26]. The joint application of BIM and MR is expected to lead towards more sustainable design processes, thanks to reduced effort employed for quality inspection and decreased reworking during the execution of renovation works [28]. In general, a leaner collaboration and more efficient business meetings would help reduce GHG emissions [12].

5.2. Findings from the Survey

Overall, the feedback collected in Table 2 and Table 3 confirmed that the quality of visualization of MR tools is already quite suitable for the indoor assessment of design options (answers to questions no. 12, 16 and 17). The survey performed in the second day confirmed the outcomes collected in the first day. Similarly, questions from no. 7 to no. 11 and from no. 13 to 15 concerning the use of the virtual menu and the easy-to-use of the technology collected quite high scores and were slightly higher in the second day than in the first day. Although the difference was not statistically significant, as shown by the Wilcoxon text referred in Section 3.5, it shows that in both days the volunteers felt comfortable with the technology. Comparing the duration of the two tests, the second day it barely took one hour, as compared with the 2 h and half of the first day. This shows how steep the learning curve was, and that technicians can easily become accustomed with this new approach. The good feedback collected during field tests consolidate the results reported by two research works that involved testing prototypes by potential end-users [27,36]. The first paper showed that construction workers wearing an MR headset could perform their tasks more efficiently, because they were both faster and more accurate and did not suffer major technology barrier in the use of the prototypical technology. The second research paper concluded that the quality of display is sufficient to help field engineers understand the project documentation and check whether construction works are conducted in accordance with expectations defined in the schedule. Even in this case, some remarks about the limited field of view were raised, but it did not sound as if this would be a major barrier in view of future technology developments.
Another remarkable outcome of these tests is the many suggestions resulting from them, which are outlined in detail in Table 5. Some of them were strictly related to the technical characteristics of the device, such as comments no. 1, 8 and 10. We expect that this technology will continue to evolve at a fast pace and will meet the expectations raised by the cited comments. The required increase in the accuracy of the virtual menu and display of operators’ hands along with the enlarged field of view seem to reasonable expectations, as well as the increased brightness of displayed models. Other comments concerned the features of the MR Application and provided suggestions for further research steps to be taken in the short term, such as comments no. 3, and 5. Both requests could be met through enhancing the MR App. As for the first case, the distance between the user and virtual menu could be better calibrated. As for the second case, the duration of recordable comments could be made flexible. Other similar comments concerned the technical development of the MR Application and would require a considerable effort to be developed, such as comments no. 2, 4, 6 and 7. Basically, this requires that a more extensive amount of information (e.g., alternative options about the way a component could be designed) be generated during the design phase. In addition, a larger amount of information must be exported from the BIM model into the translated files. Trials and insights into the maximum size that can be managed through the processor embedded in the MR device must be performed. Finally, comment no. 9 suggested that owners and clients be included in the workflow, which could affect some aspects of the suggested procedure.
The outcomes of this research step suggest that, once a friendly MR-based platform is available, renovation design projects developed in a BIM environment can efficiently be assessed on-site by technicians, provided that they have been given quick training. A slight revision of current workflows would allow technicians and designer to cooperate and could include owners and other stakeholders, too. Thus, the reliability and quality of design outcomes would increase and less rework would be required during the construction phase. These benefits along with the requests made by the volunteers about the opportunity of enhancing editing and selection capabilities of the virtual model allow us to infer that the next research effort should be addressed towards the development of further interoperability between BIM tools and MR. This would enable experts to make decisions and design changes directly on-site, thanks to bi-directional communication and data transfer. Moreover, we expect that MR will allow multiple users to connect around the same project and to live a shared experience, either on-line or in the back-office.

6. Conclusions

In this paper, the authors showed that mixed reality can significantly contribute to the streamlining of the workflow for an on-site assessment of building renovation design projects. This claim is based on the findings of an empirical study that involved eight technicians within real-life tests of a prototypical MR-based platform in a to-be-renovated full-scale experimental building. The prototype is called ODAVS. It is a service developed as part of the EU H2020 project ENCORE and combines several technologies to provide its services: an MR application, a web application and a mobile NFC scanning device helping to align the virtual objects, thus superimposing them over the existing building. The survey performed among these potential users showed that the performances of the technology were already satisfactory, yet they gave advice for additional improvement. The only requirement is that designers work in a BIM environment. This enables them to exploit the web service for the conversion of renovation models into a format suitable for the MR technology. In the same platform, they can look for suggestions as audio files and display the objects linked with them. On the other side, experts can display models on-site and provide their advice in an asynchronous way.
The volunteers provided both unstructured feedback by means of direct interaction with the tool, and structured feedback by filling in two questionnaires. The results showed that this approach can effectively support on-site design assessment, in order to gain more accuracy and facilitate the verification of renovation projects in a residential building. According to the above-mentioned findings and feedbacks, we recommend that architects and designers consolidate their workflows, grounded in BIM-based working environments, because this approach is expected to enable the uptake of MR technology and the associated improved collaboration with concerned stakeholders. Designers and experts in the field are expected to define the minimum information requirements that can allow the application of the collaboration framework showcased in this paper, depending on the type of project. Developers are encouraged to: focus their efforts towards an improved virtual menu and an easier interaction with the virtual model; increase immersivity with wider field of view; empower the model query capabilities; exploit multi-users operation; and develop seamless processes by enabling quick transition from BIM content to MR. Policy makers themselves can support the adoption of this technology in order to foster the acceptance of sustainable design approaches.
However, this study does have some limitations, which are related to the sample of participants, environment and the case study. The first one concerns the sampling of volunteers, who all came from the same institution and had similar backgrounds. The institution was involved in the same research project that funded the study, which could make an impact on their opinions. Despite this, they had never used the proposed technology earlier, which supports the validity of the performed field tests. In addition, despite the choice of a full-scale experimental facility, tests were carried out in a controlled environment, that is in a facility that is usually devoted to experimental tests. This choice reduced the number of unexpected events that could be found during the setup of the system and the assessment of renovation options in an operational environment. Furthermore, the experimented models only concerned building renovation design. Different types of design models could generate other challenges. Indeed, future research might explore the use of an MR-based platform applied to other types of construction works and different types of building uses. Finally, the tests performed in this paper extended until the on-site collection of feedback. The capability of designers to take advantage of this was not demonstrated. Rather, the paper wished to show that recording opinions on-site is one of the most efficient ways to collect information from experts and enrich the models stored in the platform. Additional research investigating what type of information could be collected and what format must be used to facilitate decision making would make sense as well.

Author Contributions

Conceptualization, B.N. and A.C.; methodology, M.V. and A.C.; software and App development, F.S. and M.V.; validation, A.C., M.V. and C.F.; results analyses and discussion, A.C. and F.S.; data curation, M.V.; writing—original draft preparation, all; writing—review and editing, all; supervision, B.N.; project administration, A.C. All authors have read and agreed to the published version of the manuscript.

Funding

This work was supported by the European Commission under the program H2020, ENCORE Project—“Energy aware BIM Cloud Platform in a Cost-effective Building Renovation Context”, Grant Agreement No. 820434.

Informed Consent Statement

Written informed consent has been obtained from the volunteers performing the assessment and filling in the questionnaires to disseminate this research results.

Data Availability Statement

A publicly archived but restricted access dataset generated during validation is available at: https://0-doi-org.brum.beds.ac.uk/10.5281/zenodo.6531860 (accessed on 24 August 2022). It includes pictures and videos collected during the validation performed in Caceres (Spain).

Acknowledgments

The authors wish to thank the students Felipe Mate and Lea De Benedictis, who contributed to the technical setup of validation tests. Furthermore, the authors wish to thank the reviewers for their valuable comments, that dramatically improved the overall quality of this paper.

Conflicts of Interest

The authors declare no conflict of interest.

References

  1. European Parliament & Council of the European Union. (2021) Directive 2012/27/EU of the European Parliament and of the Council of 25 October 2012 on ENERGY Efficiency, Amending Directives 2009/125/EC and 2010/30/EU and Repealing Directives 2004/8/EC and 2006/32/EC. Available online: http://data.europa.eu/eli/dir/2012/27/oj (accessed on 24 August 2022).
  2. European Parliament & Council of the European Union. (2018) Directive (EU) 2018/2002 of the European Parliament and of the Council of 11 December 2018 Amending Directive 2012/27/EU on Energy Efficiency. Available online: http://data.europa.eu/eli/dir/2018/2002/oj (accessed on 24 August 2022).
  3. Sandberg, N.H.; Sartori, I.; Heidrich, O.; Dawson, R.; Dascalaki, E.; Dimitriou, S.; Vimm-r, T.; Filippidou, F.; Stegnar, G.; Šijanec Zavrl, M.; et al. Dynamic building stock modelling: Application to 11 European countries to support the energy efficiency and retrofit ambitions of the EU. Energy Build. 2016, 132, 26–38. [Google Scholar] [CrossRef] [Green Version]
  4. Artola, I.; Rademaekers, K.; Williams, R.; Yearwood, J. Boosting Building Renovation: What Potential and Value for Europe. Study for the ITRE Committee, Edited by Directorate General for Internal Policies 2016, Policy Department, European Union. Available online: https://www.europarl.europa.eu/RegData/etudes/STUD/2016/587326/IPOL_STU(2016)587326_EN.pdf (accessed on 24 August 2022).
  5. Rousselot, M.; Da Rocha, F.P. Energy Efficiency Trends in Buildings in the EU. The ODYSSEE-MURE Project. June 2012. Available online: https://www.odyssee-mure.eu/publications/policy-brief/buildings-energy-efficiency-trends.pdf (accessed on 26 May 2022).
  6. El Ammari, K.; Hammad, A. Remote interactive collaboration in facilities management using BIM-based mixed reality. Autom. Constr. 2019, 107, 102940. [Google Scholar] [CrossRef]
  7. Vaughan, A. Time to green your home. New Sci. 2022, 254, 20–21. [Google Scholar] [CrossRef]
  8. Raimbaud, P.; Lou, R.; Merienne, F.; Danglade, F.; Hernández, J.T. BIM-based mixed reality application for supervision of construction. In Proceedings of the 2019 IEEE Conference on Virtual Reality and 3D User Interfaces (VR), Osaka, Japan, 23–27 March 2019; pp. 1903–1907. [Google Scholar] [CrossRef] [Green Version]
  9. Brito, C.; Alves, N.; Magalhães, L.; Guevara Lopez, M.A. BIM mixed reality tool for the inspection of heritage buildings. Int. Ann. Photogramm. Remote Sens. Spat. Inf. Sci. 2019, IV-2/W6, 25–29. [Google Scholar] [CrossRef] [Green Version]
  10. Delgado, J.M.D.; Oyedele, L.; Demian, P.; Beach, T. A research agenda for augmented and virtual reality in architecture, engineering and construction. Adv. Eng. Inform. 2020, 45, 101122. [Google Scholar] [CrossRef]
  11. Forcael, E.; Ferrari, I.; Opazo-Vega, A.; Alberto Pulido-Arcas, J. Construction 4.0: A Literature Review. Sustainability 2020, 12, 9755. [Google Scholar] [CrossRef]
  12. Caldas, L.R.; Silva, M.V.; Silva, V.P.; Carvalho, M.T.M.; Toledo Filho, R.D. How Different Tools Contribute to Climate Change Mitigation in a Circular Building Environment?—A Systematic Literature Review. Sustainability 2022, 14, 3759. [Google Scholar] [CrossRef]
  13. Chalhoub, J.; Ayer, S.K.; Ariaratnam, S.T. Augmented reality for enabling un-and under-trained individuals to complete specialty construction tasks. J. Inf. Technol. Constr. (ITcon) 2021, 26, 128–143. [Google Scholar] [CrossRef]
  14. Ammari, K.E.; Hammad, A. Collaborative BIM-Based Markerless Mixed Reality Framework for Facilities Maintenance. In Proceedings of the 2014 Conference on Computing in Civil and Building Engineering, Orlando, FL, USA, 23–25 June 2014; pp. 657–664. [Google Scholar] [CrossRef]
  15. Yang, F.; Goh, Y.M. VR and MR technology for safety management education: An authentic learning approach. Saf. Sci. 2022, 148, 105645. [Google Scholar] [CrossRef]
  16. Wu, W.; Sandoval, A.; Gunji, V.; Ayer, S.K.; London, J.; Perry, L.; Patil, K.; Smith, K. Comparing tradition and Mixed Reality-Facilitated Apprenticeship Learning in a wood-Frame Construction Lab. J. Constr. Eng. Manag. 2020, 146, 04020139. [Google Scholar] [CrossRef]
  17. Zhu, Y.; Fukuda, T.; Yabuki, N. Slam-based MR with animated CFD for building design simulation. In Proceedings of the 23rd International Conference of the Association for Computed-Aided Architectural Design Research in Asia (CAADRIA), Tsinghua University, School of Architecture, Beijing, China, 17–19 May 2018; pp. 391–400. [Google Scholar]
  18. Aligning a Model to Site in Trimble Connect for HoloLens. Available online: https://www.youtube.com/watch?v=AUfv2dRGcNc (accessed on 26 January 2020).
  19. Choi, J.; Choi, J.; Kim, Y.; Moon, S. Development of remodeling prototype plans in 1st-phase new town aged apartment—Based on ‘2 bay type’ of 1st-phase new town representatives. J. Archit. Inst. Korea Plan. Des. 2018, 34, 67–76. [Google Scholar] [CrossRef]
  20. Yoon, J.; Yu, I. Estimating normal duration of renovation for multistory apartment building considering extension-type renovation projects. J. Civ. Eng. Manag. 2019, 25, 156–167. [Google Scholar] [CrossRef] [Green Version]
  21. Bruno, S.; Scioti, A.; Pierucci, A.; Rubino, R.; Di Noia, T.; Fatiguso, F. VERBUM—Virtual enhanced reality for building modelling (virtual technical tour in digital twins for building conservation. J. Inf. Technol. Constr. (ITcon) 2022, 27, 20–47. [Google Scholar] [CrossRef]
  22. Schranz, C.; Urban, H.; Gerger, A. Potentials of Augmented Reality in a BIM based building submission process. J. Inf. Technol. Constr. (ITcon) 2021, 26, 441–457. [Google Scholar] [CrossRef]
  23. Milgram, P.; Kishimo, F. A taxonomy of Mixed Reality Visual Displays. IEICE Trans. Inf. Syst. 1994, 77, 1321–1329. [Google Scholar]
  24. Flavián, C.; Ibáñez-Sánchez, S.; Orús, C. The impact of virtual, augmented and mixed reality technologies on the customer experience. J. Bus. Res. 2019, 100, 547–560. [Google Scholar] [CrossRef]
  25. Zhu, Y.; Fukuda, T.; Yabuki, N. Synthesizing 360-degree live streaming for an erased background to study renovation using mixed reality. In Proceedings of the 24th International Conference of the Association for Computed-Aided Architectural Design Research in Asia (CAADRIA), Victoria University of Wellington, Faculty of Architecture & Design, Wellington, New Zealand, 15–18 April 2019; pp. 71–80. [Google Scholar]
  26. Chudikova, B.; Faltejsek, M. Advantages of using virtual reality and building information modelling when assessing suitability of various heat sources, including renewable energy sources. IOP Conf. Ser. Mater. Sci. Eng. 2019, 542, 012022. [Google Scholar] [CrossRef]
  27. Meža, S.; Turk, Z.; Dolenc, M. Measuring the potential of augmented reality in civil engineering. Adv. Eng. Softw. 2015, 90, 1–10. [Google Scholar] [CrossRef]
  28. Ali, A.K.; Lee, O.J.; Lee, D.; Park, C. Remote Indoor Construction Progress Monitoring Using Extended Reality. Sustainability 2021, 13, 2290. [Google Scholar] [CrossRef]
  29. Machado, R.L.; Vilela, C. Conceptual framework for integrating BIM and augmented reality in construction management. J. Civ. Eng. Manag. 2019, 26, 83–94. [Google Scholar] [CrossRef]
  30. Muhammad, A.A.; Yitmen, I.; Alizadehsalehi, S.; Celik, T. Adoption of virtual reality (VR) for Site Layout Optimization of Construction Projects. Tek. Dergi 2019, 31, 9833–9850. [Google Scholar] [CrossRef] [Green Version]
  31. Azuma, R.; Baillot, Y.; Behringer, R.; Feiner, S.; Julier, S.; MacIntyre, B. Recent advances in augmented reality. IEEE Comput. Graph. Appl. 2001, 21, 34–47. [Google Scholar] [CrossRef] [Green Version]
  32. Costanza, E.; Kunz, A.; Fjeld, M. Mixed Reality: A Survey. In Human Machine Interaction; Lecture Notes in Computer Science; Lalanne, D., Kohlas, J., Eds.; Springer: Berlin/Heidelberg, Germany, 2009; Volume 5440, pp. 47–68. [Google Scholar] [CrossRef]
  33. Taketomi, T.; Uchiyama, H.; Ikeda, S. Visual SLAM algorithms: A survey from 2010 to 2016. IPSJ Trans. Comput. Vis. Appl. 2017, 9, 16. [Google Scholar] [CrossRef] [Green Version]
  34. Macario Barros, A.; Michel, M.; Moline, Y.; Corre, G.; Carrel, F. A Comprehensive Survey of Visual SLAM Algorithms. Robotics 2022, 11, 24. [Google Scholar] [CrossRef]
  35. Aligning Models Using Markers in Trimble Connect for HoloLens. Available online: https://www.youtube.com/watch?v=n5TKyeQ8QOU (accessed on 1 October 2020).
  36. Chalhoub, J.; Ayer, S.K. Using Mixed Reality for electrical construction design communication. Autom. Constr. 2018, 86, 1–10. [Google Scholar] [CrossRef]
  37. Márquez-Martinón, J.M.; Martín-Dorta, N.; González-Díaz, E.; González-Díaz, B. Influence of Thermal Enclosures on Energy Saving Simulations of Residential Building Typologies in European Climatic Zones. Sustainability 2021, 13, 8646. [Google Scholar] [CrossRef]
  38. Pan, Y.; Braun, A.; Brilakis, I.; Borrmann, A. nriching geometric digital twins of buildings with small objects by fusing laser scanning and AI-based image recognition. Autom. Constr. 2022, 140, 104375. [Google Scholar] [CrossRef]
  39. Xu, Z.; Zhang, L.; Li, H.; Lin, Y.H.; Yin, S. Combining IFC and 3D tiles to create 3D visualization for building information modelling. Autom. Constr. 2020, 109, 102995. [Google Scholar] [CrossRef]
  40. Neb, A.; Brandt, D.; Rauhöft, G.; Awad, R.; Scholz, J.; Bauernhansl, T. A novel approach to generate augmented reality assembly assistance automatically from CAD models. Procedia CIRP 2021, 104, 68–73. [Google Scholar] [CrossRef]
  41. Daoust, F. Update from the World Wide Web Consortium (WC3). SMPTE Motion Imaging J. 2020, 129, 80–83. [Google Scholar] [CrossRef]
  42. Lockley, S.; Benghi, C.; Cerny, M. Xbim.Essentials: A library for interoperable building information applications. J. Open Source Softw. 2017, 2, 473. [Google Scholar] [CrossRef] [Green Version]
  43. Saraubon, K.; Chinakul, P.; Chanpen, R. Asset Management System using NFC and IoT Technologies. In Proceedings of the 2019 3rd International Conference on Software and e-Business (ICSEB 2019), Tokyo, Japan, 9–11 December 2019; pp. 124–128. [Google Scholar] [CrossRef]
  44. Al Hammadi, O.; Al Hebsi, A.; Zemerly, M.J. Indoor localization and guidance using portable smartphones. In Proceedings of the 2012 IEEE/WIC/ACM International Conferences on Web Intelligence and Intelligent Agent Technology, Macau, China, 4–7 December 2012; pp. 337–341. [Google Scholar] [CrossRef]
  45. Özlü, A. Marker-Less Augmented Reality by OpenCV and OpenGL. Available online: https://ahmetozlu.medium.com/marker-less-augmented-reality-by-opencv-and-opengl-531b2af0a130 (accessed on 21 January 2018).
  46. Monnin, D.; Bieber, E.; Schmitt, G.; Schneider, A. An Effective Rigidity Constraint for Improving RANSAC in Homography Estimation. In Advanced Concepts for Intelligent Vision Systems. ACIVS 2010; Lecture Notes in Computer Science; Blanc-Talon, J., Bone, D., Philips, W., Popescu, D., Scheunders, P., Eds.; Springer: Berlin/Heidelberg, Germany, 2010; Volume 6475, pp. 203–214. [Google Scholar] [CrossRef]
  47. Forza, C. Survey research in operations management: A process-based perspective. Int. J. Oper. Prod. Manag. 2002, 22, 152–194. [Google Scholar] [CrossRef] [Green Version]
  48. Goforth, C. Using and Interpreting Cronbach’s Alpha. University of Virginia Library. Available online: https://data.library.virginia.edu/using-and-interpreting-cronbachs-alpha/ (accessed on 16 November 2015).
  49. Wonnacott, T.H.; Wonnacott, R.J. Introductory Statistics, 5th ed.; John Wiley and Sons: Hoboken, NJ, USA, 1991; ISBN 978-0471615187. [Google Scholar]
  50. Yang, Z.; Wang, Y.; Sun, C. Emerging information technology acceptance model for the development of smart construction system. J. Civ. Eng. Manag. 2018, 24, 457–468. [Google Scholar] [CrossRef]
Figure 1. Cooperation in building renovation design enabled by ODAVS.
Sustainability 14 13239 g001
Figure 2. ODAVS architecture (a) and the architect Web GUI (b).
Sustainability 14 13239 g002
Figure 3. Main menu to connect to the server and load the list of models (a), to select the project options (b) and study options (c); the virtual menu to navigate on-site (d) and to attach an audio comment to an IFC object (e).
Sustainability 14 13239 g003
Figure 4. Picture of sample NFC tags (a) and first-person view of the expert while reading a tag (b).
Sustainability 14 13239 g004
Figure 5. Demonstrator building in Caceres (a); partial 3D views of the first (b) and second (c) renovation design.
Sustainability 14 13239 g005
Figure 6. Plan view with the locations at which the tags were placed on the ground (a) and first (b) floors and pictures of two tags installed on the first floor (c).
Sustainability 14 13239 g006
Figure 7. Volunteers performing the assessment and using the virtual menu.
Sustainability 14 13239 g007
Figure 8. First-person view of a volunteer recording an audio file (a) and of another volunteer looking through a window (b).
Sustainability 14 13239 g008
Table 1. List of buttons of the “Assessment menu” and related functions.
IconLabelFunction
Sustainability 14 13239 i001Load modelConnect to the server to load a new study
Sustainability 14 13239 i002Move modelToggle manual interactive alignment for fine adjustments. One hand gestures on the faces of the movement cube or model objects produce translations and one hand gestures on the edges of the movement cube to produce rotation around vertical axis. During movement, the model is always kept horizontal
Sustainability 14 13239 i003ModelToggle visibility for the holograms of the active study
Sustainability 14 13239 i004<Category>Toggle visibility for the specific types of building elements, previously defined in ODAVS web GUI. This is a set of IFC types displayed in the last two columns of the Assessment menu. Common categories are Furniture, Envelope, Systems, TAGs
Sustainability 14 13239 i005OthersToggle visibility of all objects not belonging to the previous categories
Sustainability 14 13239 i006 Lock/unlock position of menu. When unlocked, the menu follows the user as she/he moves
Sustainability 14 13239 i007 Reset alignment and hide model for performing a new alignment
Table 2. Questionnaire no. 1 and descriptive statistics of the collected answers on day 1 as a result of the assessment of the first renovation option.
IDQuestionMeanVarianceSt. Dev.MinMaxMedianRangeNo. of Answers
1Do you think that the new ventilation system included in the renovation design is executable and well-integrated in the building?2.251.361.161.004.002.503.008
2Do you confirm that the location of the communication cables and sensors placed on the walls will not hamper the usability of the room and/or the regular use of other appliances?2.381.701.301.004.002.503.008
3Do you agree with the location of air inlets integrated in the ceiling?2.631.411.191.004.003.003.008
4Do you think that the arrangement of air ducts and electric/communication cabling above the ceiling is executable by technical crews?3.130.700.832.004.003.002.008
5Do you confirm that the new partition will not interfere with existing objects and can be executed as it was designed?1.631.411.191.004.001.003.008
6Do you think that the air duct clamps have been placed and fixed at the right locations on the bottom surface of the floor above the ceiling? 2.500.570.761.003.003.002.008
7Do you feel comfortable with the hand-gesture used to open the MAIN menu?2.751.361.161.004.003.003.008
8Is the selection of any item on the menu easy to locate and to click?2.251.931.391.004.002.003.008
9Is the “hide” function of the menu useful in performing the assessment and in checking technical solutions included in the renovation design?2.880.980.991.004.003.003.008
10Do you feel comfortable with the “recording of comments” function to provide the assessment during your visit on-site?2.750.790.891.004.003.003.008
11Were the holograms that were displayed stable while wandering throughout the building so as to make you feel well immersed in the virtual mock-up?2.630.550.741.003.003.003.008
12Was the visualization of the holograms flickering?1.750.790.891.003.001.502.008
13Was the visualization of holograms clear at a close distance (<1 m)?3.500.290.533.004.003.501.008
14Was the visualization of holograms clear at a longer distance (>2 m)?2.251.071.041.003.003.002.008
15Do you think that the headset is comfortable and easy to wear?3.000.570.762.004.003.002.008
16Does the visualization get pixelated?1.380.550.741.003.001.002.008
17Was the field of view wide enough?2.251.361.161.004.002.003.008
18–22Demographics and open-ended questions (Table 4 and Table 5)
23Your opinion is important8.001.431.206.0010.008.004.008
Table 3. Questionnaire no. 2 and descriptive statistics of the collected answers on day 2 as a result of the assessment of the second renovation option.
IDQuestionMeanVarianceSt. Dev.MinMaxMedianRangeNo. of Answers
1Do you think that the replacement of the windows and their resizing are suitable for the building?2.750.790.891.004.003.003.008
2Do you confirm that the sun shading systems have been properly sized and placed on the façade of the building?3.500.290.533.004.003.501.008
3Do you agree with the decision to apply an external coating on the north façade and do you think that the overall thickness of the new wall is acceptable?3.250.210.463.004.003.001.008
4Do you think that the electric window openers installed on the south façade are executable and will not damage the existing frame/wall interface?2.381.701.301.004.002.503.008
5N.A.--------
6N.A.--------
7Do you feel comfortable with the hand-gesture used to open the MAIN menu?3.001.141.071.004.003.003.008
8Is the selection of any item on the menu easy to locate and to click?3.001.141.071.004.003.003.008
9Is the “hide” function of the menu useful in performing the assessment and in checking technical solutions included in the renovation design?3.250.500.712.004.003.002.008
10Do you feel comfortable with the “recording of comments” function to provide the assessment during your visit on-site?3.130.980.992.004.003.003.008
11Were the holograms that were displayed stable while wandering throughout the building so as to make you feel well immersed in the virtual mock-up?3.000.290.532.004.003.002.008
12Was the visualization of the holograms flickering?1.380.550.741.003.001.002.008
13Was the visualization of holograms clear at a close distance (<1 m)?3.380.840.922.004.004.002.008
14Was the visualization of holograms clear at a longer distance (>2 m)?2.130.980.991.003.002.502.008
15Do you think that the headset is comfortable and easy to wear?3.130.410.642.004.003.002.008
16Does the visualization get pixelated?1.380.550.741.003.001.002.008
17Was the field of view wide enough?2.381.131.061.004.002.503.008
18–22Demographics and open-ended questions (Table 4 and Table 5)
23Your opinion is important8.630.840.927.0010.009.003.008
Table 4. Demographics of the respondents.
CharacteristicsNumber (%)
Age
Younger than 303 (37.5)
Between 30 and 505 (62.5)
Degree
Master’s Degree8 (100.0)
Job
Architect–Energy expert4 (50.0)
Building Engineer2 (25.0)
Telecommunication engineer1 (12.5)
Developer of research projects1 (12.5)
Table 5. Answers to open-ended questions.
IDSuggestionFrequencyPercentage (%)
1The brightness of the virtual model should be increased to be able to see the model even in poorly lit rooms416.0
2When selecting an element, a drop-down menu should pop-up to display alternative options for that component416.0
3The selection of an option on the virtual menu is not that reliable, because sometimes it fails and must be repeated, and its relocation should be made easier too416.0
4The selection capabilities of building components should be refined, such as querying even single parts or the properties of a component416.0
5The maximum duration of recordable comments should be increased in order to include more information and clarifications28.0
6The display of components of the virtual model should be in different colors according to the construction phase they belong to, so as to be able to display components according to the order in which they will be built or installed28.0
7The system should display even technical information resulting from energy analyses14.0
8The virtual hand is not perfectly aligned over the real hand, which sometimes reduces the accuracy of selection on the virtual menu14.0
9This system could be even more useful for clients than for technicians14.0
10The field of view should be wider14.0
11A function to simulate the movement of operable components (e.g., windows with electric openers) should be available14.0
Total25100.0
Publisher’s Note: MDPI stays neutral with regard to jurisdictional claims in published maps and institutional affiliations.

