Article

Genome-Wide Association Study Based on Plant Height and Drought-Tolerance Indices Reveals Two Candidate Drought-Tolerance Genes in Sweet Sorghum

College of Agriculture, Tarim University, Alar 843300, China
*
Author to whom correspondence should be addressed.
Sustainability 2022, 14(21), 14339; https://0-doi-org.brum.beds.ac.uk/10.3390/su142114339
Submission received: 20 September 2022 / Revised: 28 October 2022 / Accepted: 30 October 2022 / Published: 2 November 2022

Abstract

:
To understand the molecular mechanism of drought tolerance in sweet sorghum [Sorghum bicolor (L.) Moench], we found the genetic loci associated with single nucleotide polymorphism (SNP) markers and explored drought-tolerance candidate genes. A genome-wide association study (GWAS) of sweet sorghum was performed using the general linear model (GLM), mixed linear model (MLM) and the fixed and random model circulating probability unification (FarmCPU) method in R. Mean productivity (MP), relative drought index (RDI) and stress-tolerance index (STI), based on plant height under two water treatments, were obtained from 354 sweet sorghum accessions from home and abroad. These plant-height drought-tolerance indices showed continuous quantitative variation. Except for the RDI, the others were close to normal distribution. A total of 6186 SNPs were obtained from the resequencing data after quality control and filling. The marker densities on chromosomes 9, 10 and 5 were higher than those on other chromosomes, which were 40.4, 16.5 and 10.0 SNPs within 1 Mb, respectively. The GWAS results showed that 49, 5 and 25 significant SNP loci were detected by the GLM, the MLM and FarmCPU, respectively, many of which were detected by two or more models. Two candidate genes of drought tolerance were annotated: Sb08g019720.1, homologous to the gene encoding the early flowering MYB protein transcription factor in Arabidopsis thaliana; and Sb01g037050.1, homologous to the gene encoding the basic leucine zipper transcription factor in maize. The results of this study can facilitate the cultivar development of drought-tolerant sweet sorghum.

1. Introduction

Southern Xinjiang experiences a dry climate and slight rainfall. The annual average evaporation is 1000–2000 mm, 7–20 times more than the annual rainfall. Because Southern Xinjiang is the main producing area of cotton and fruit trees, water resources have a great demand for agricultural development. However, water resources in Xinjiang are in a state of ecological deficit, and the situation is likely to worsen [1]. Soil salinization is also severe in Xinjiang, with about 1/3 of the total area of cultivated land affected by different degrees of salinity or alkalinity. Therefore, developing saline–alkali and drought-tolerant crop varieties that can be grown in Xinjiang has broad prospects [2]. As a common sorghum variety, sweet sorghum has strong stress resistance. Because of its resistance to drought, aridity, salinity and alkalinity [3], it is an ideal model crop in studying stress resistance mechanisms. In addition, sweet sorghum as a roughage source has broad prospects in feed development in Xinjiang, where animal husbandry is also being developed. Therefore, it is of great theoretical and practical significance to strengthen the evaluation, identification and mining of the excellent genetic resources of sweet sorghum, especially for arid and saline areas.
Drought, an essential abiotic factor, affects the growth and yield of crops, thus restricting agricultural production. Cultivating and planting varieties with excellent drought-tolerance genes are effective ways to solve this problem. Much research has been conducted to understand the drought-tolerance mechanism of crops and explore drought-tolerance candidate genes. With the rapid development of molecular biology, molecular genetics and bioinformatics, genome-wide association studies (GWASs), based on the natural population and linkage disequilibrium, can detect genetic variation polymorphisms in the whole genome and conduct population-level statistical analysis of the genotype and phenotype, which can efficiently detect genes associated with traits, making it more convenient to mine genes that control the drought-tolerance traits of crops and identify excellent genetic variation materials. With the reduction in sequencing costs and the completion of most crop gene sequencing, GWASs have been widely applied in the drought-tolerance research of rice [4,5,6,7,8], wheat [9,10,11,12], maize [13,14,15], soybean [16,17], sorghum [18,19], cotton [20] and other crops, and many significant marker–trait association loci and candidate genes related to drought tolerance have been revealed, some of which are related to transcription factors (TFs) [7,8,10,16,18]. The quantitative trait locus identified by GWAS contains candidate genes with functions related to osmotic stress regulation, such as the basic leucine zipper (bZIP) protein gene OsbZIP80, which plays an important role in the tolerance of or adaptation to abiotic stress and is considered a rice-dehydration stress-inducible gene [8]. A dehydration response element-binding protein TF identified by a GWAS, related to drought tolerance in wheat, plays a transcriptional activation role in abscisic acid (ABA)-independent drought stress responses by binding to the dehydration response element [10]. A GWAS, using high-density phenotypic genomics, was conducted to study the height, leaf area and biomass of 648 sorghum cultivars under drought and well-watered conditions. High-quality, repetitive and conserved gene associations have been revealed, which included many strong candidate genes encoding heat shock proteins and antifreeze proteins involved in stress response [18]. Hence, drought tolerance is a complex trait regulated by many genes and it involves a variety of drought-response signaling pathways and metabolic networks. It is a long-term evolutionary process of plants and an adaptation mechanism to the adverse environmental conditions of drought. Under drought stress conditions, genes or TFs related to drought resistance are activated to regulate the expression of target genes at the transcriptional level, thereby regulating plant growth and physiological metabolism. There are many kinds of TFs in the plant kingdom. According to the structure of the DNA-binding domain, TFs can be divided into many different families, such as MYB TF family proteins, bZIP proteins, etc. MYB TFs, one of the largest TF families in plants, play a crucial role in abiotic stress responses [21]. GmMYB52 encodes a typical MYB TF in soybean that can bind MYB cis-acting element motifs, indicating that this TF may be related to abiotic stress and the ABA signal transduction pathway of soybean [22]. Genes encoding bZIP TFs significantly increase the tolerance of Arabidopsis and cotton to multiple abiotic stresses [23].
For a GWAS on the drought tolerance of sweet sorghum, phenotypic data, genotype data, software and good analysis methods are required. Phenotypic data are needed to accurately reflect the difference in drought tolerance. Some studies have indicated that drought-tolerance indices, such as the stress sensitivity index (SSI) and the stress-tolerance index (STI), evolved from traits under drought and normal conditions and could provide useful information in GWASs. The genotype data in this study were obtained from the resequencing data of sweet sorghum materials. When phenotypic and genotypic data are available, the most important thing is the selection of analysis methods. Although a GWAS is advantageous in detecting important genes, false positives, computing speed and statistical ability are the main concerns for researchers. Therefore, they have developed a series of models and related software packages to deal with these concerns. With the continuous improvement of computing models and the development of software packages, GWASs have been greatly improved in terms of computing speed and statistical effectiveness [24,25,26,27]. The general linear model (GLM) is used to reduce false positives from population stratification by treating the population structure (Q) or principal components (PCs) as fixed effects [28]. Subsequently, the mixed linear model (MLM) uses genetic markers covering the whole genome and introduces the genetic relationship between individuals to control false positives, which is effective in controlling Q and genetic relationships [29,30]. However, the challenge for the MLM is dealing with the workload of large data sets. To solve this problem, many algorithms, such as the compressed mixed linear model (CMLM) and the enriched CMLM, have been proposed. The CMLM method is based on the genetic relationship of individuals, and varieties or individuals are clustered and grouped to obtain the optimal number of groups. The genetic coefficient between groups is used instead of the genetic coefficient between varieties as the random effect of the MLM [31]. By finding the optimal combination of the clustering method and the between-groups kinship (K) coefficient algorithm, the CMLM is an optimized MLM method [32]. Such algorithms improve the calculation speed of the MLM, but the statistical ability is the same. Subsequently, the MLM transitioned from a single point to a multiple loci mixed model (MLMM). Based on the MLMM, a fixed and random model circulating probability unification (FarmCPU) model has been developed. The idea is to use two models for iteration. One model is the MLM which contains covariates, such as random effects and Q related to K, and the other is the GLM. The latter contains a test tag and Q as a covariate. FarmCPU provides increased computing speed and statistical power compared with the MLMM [33]. In this study, the GLM, the MLM and FarmCPU were used for the GWAS.
In this study, 354 sweet sorghum accessions were identified for drought tolerance in fields under regular irrigation and drought stress treatments. The objectives of this study were to identify significant SNP loci associated with drought-tolerance traits through a GWAS, using the GLM, the MLM and FarmCPU, to explore candidate genes for drought-resistance traits in sweet sorghum, and to better understand the molecular mechanisms of the drought adaptation of sweet sorghum in order to facilitate the cultivation of drought-tolerant varieties.

2. Materials and Methods

2.1. Test Materials and Experimental Design

The test materials were 354 sweet sorghum accessions from China, the USA, India, and other countries, which were provided by the National Crop Germplasm Resource Platform (Beijing, China). The experiments were performed in the field at the agronomy experiment station of Tarim University in Xinjiang Uygur Autonomous Region in 2019, using a completely randomized experimental design with two replicates. The sowing date was 1 May and the sowing depth was 3 cm, with a row length of 5 m, row spacing of 0.6 m and plant spacing of 0.2 m. Three lines were arranged in one plot, with a 0.6 m space between plots for observation and data measurement. Seedlings were thinned at the one-leaf and one-heart stage, leaving one seedling in each hole. The two treatments were regular irrigation and drought stress. In the regular irrigation treatment, irrigation was applied normally during the growth period of sweet sorghum, and the irrigation amount was 50, 100, 80 and 80 mm at the seedling stage, jointing stage, booting stage and filling stage, respectively. In the drought stress treatment, irrigation was stopped after the seedling stage until grain maturity, with 50 mm irrigation at the seedling stage. The rainfall during the whole growth period was close to 100 mm [34].

2.2. Measurements and Data Analysis

Agronomic traits were investigated and collected at the ripening stage. The plants of the two treatments were continuously sampled from the middle row of each plot to prevent data deviation caused by the boundary effect. The height of the main stem of the plant, as measured with a meter scale, was the plant height (PH). Y S represents the PH of each accession under drought stress, and Y P represents the PH under regular irrigation. Mean productivity (MP, unit: m), relative drought index (RDI) and stress-tolerance index (STI) were obtained from Y S and Y P by the following formulas [35].
M P = Y S + Y P / 2
R D I = Y S / Y P / Y S ¯ / Y P ¯
S T I = Y S × Y P / Y P ¯ 2
Y S ¯ is the average value of all accessions under drought stress and
Y P ¯ is the average value of all accessions under regular irrigation.
Whole genome resequencing was performed by Beijing Nuohe Zhiyuan Science and Technology Co., Ltd. (Beijing, China). Before the GWAS, Plink software (v1.9 beta) was used for quality control, Beagle software (v5.4) was used for filling, and Plink was used again under the same conditions to control the quality of the filled data, and the unmapped data were removed. Under the premise of minimum allele frequency (MAF) ≥ 0.01 and missing rate (missing data) ≤ 0.1, 6186 high-quality SNPs were obtained. The SNP variation files obtained by sequencing were sorted according to the format required by the rMVP package.
This study used FactoMineR, a de facto software package in R (v3.6.1), for principal component analysis (PCA), extracting PCA results and data visualization. A GWAS with the GLM, the MLM and FarmCPU was performed using the rMVP package in R. Significant markers were named as SNP + chromosome + position. The 100 kb interval on both sides of each significant SNP locus was intercepted. The resulting sequences were searched with NR, NT, KO, Swiss-Prot, Pfam, GO and KOG databases using BLAST software (v1.4) to annotate gene function.

3. Results

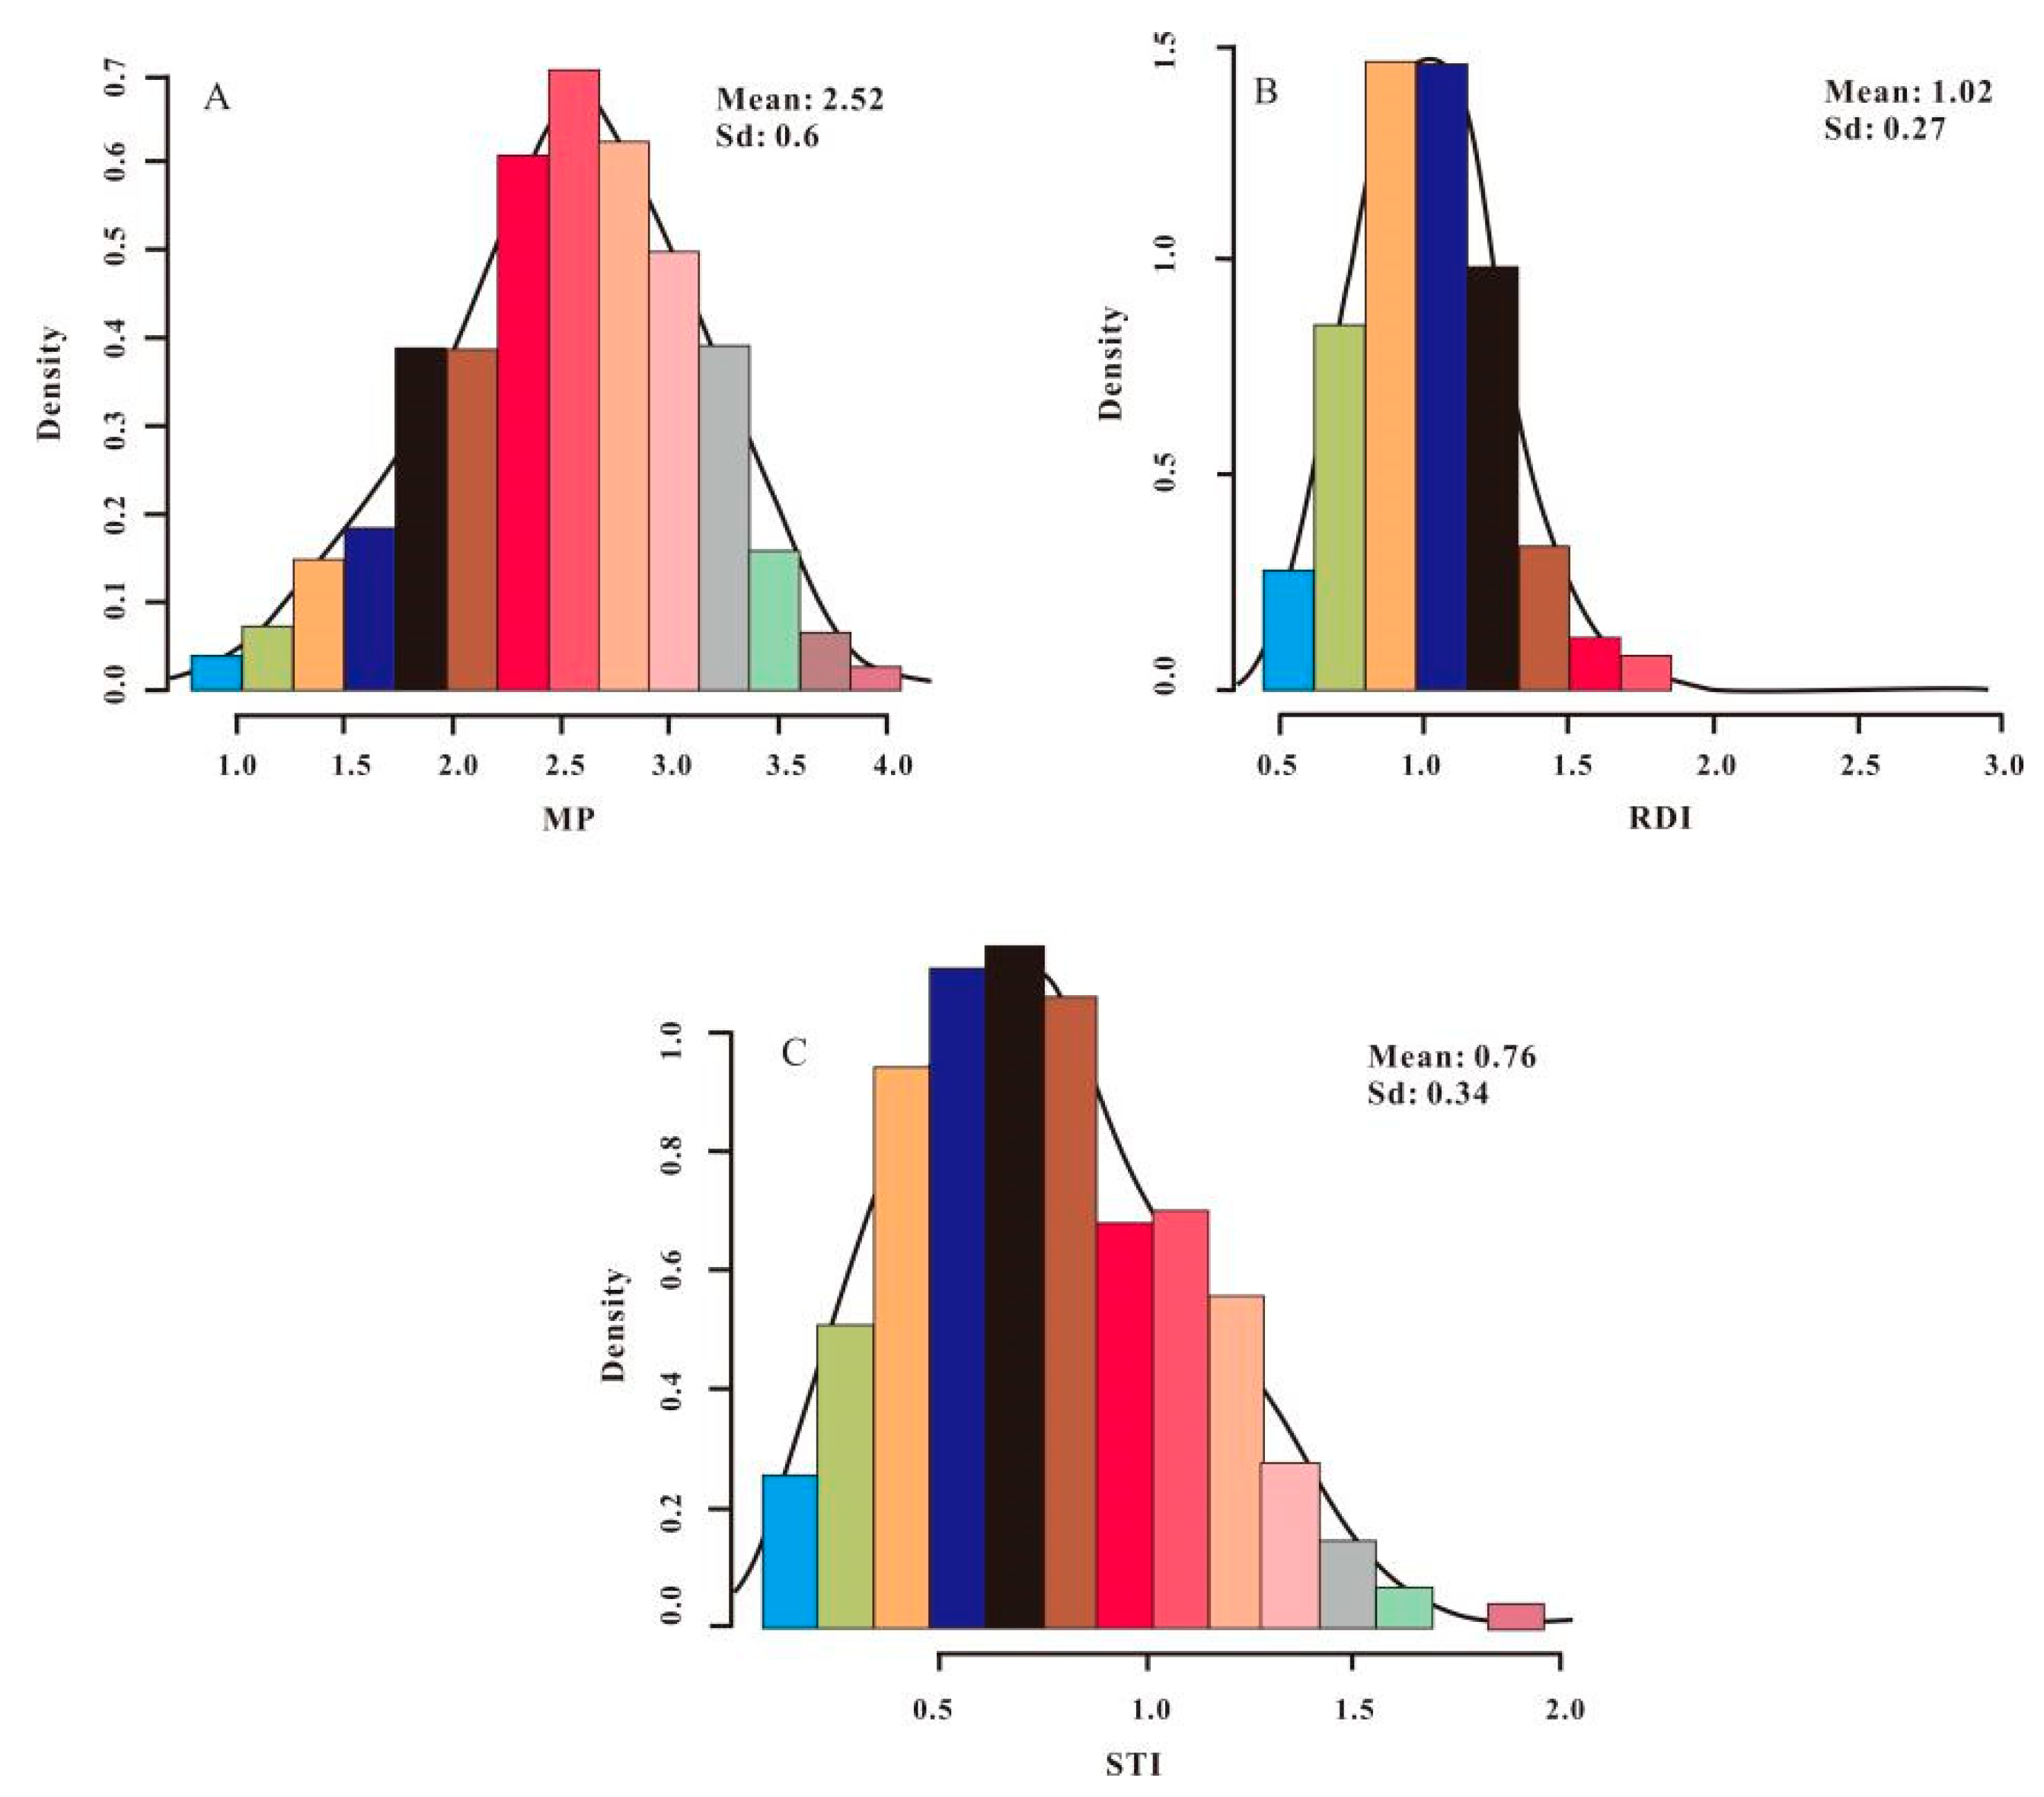
3.1. Distribution of PH and Drought-Tolerance Indices in Sweet Sorghum

The drought-tolerance indices, including the mean productivity (MP), relative drought index (RDI) and stress-tolerance index (STI), were obtained from the formulas based on Y S and Y P under two different water treatments for each accession, which showed continuous quantitative variation (Figure 1). The drought-tolerance indices’ MP and STI were close to a normal distribution, with the standard deviation reaching 0.60 and 0.34, respectively, while the drought-tolerance index RDI did not follow the normal distribution.

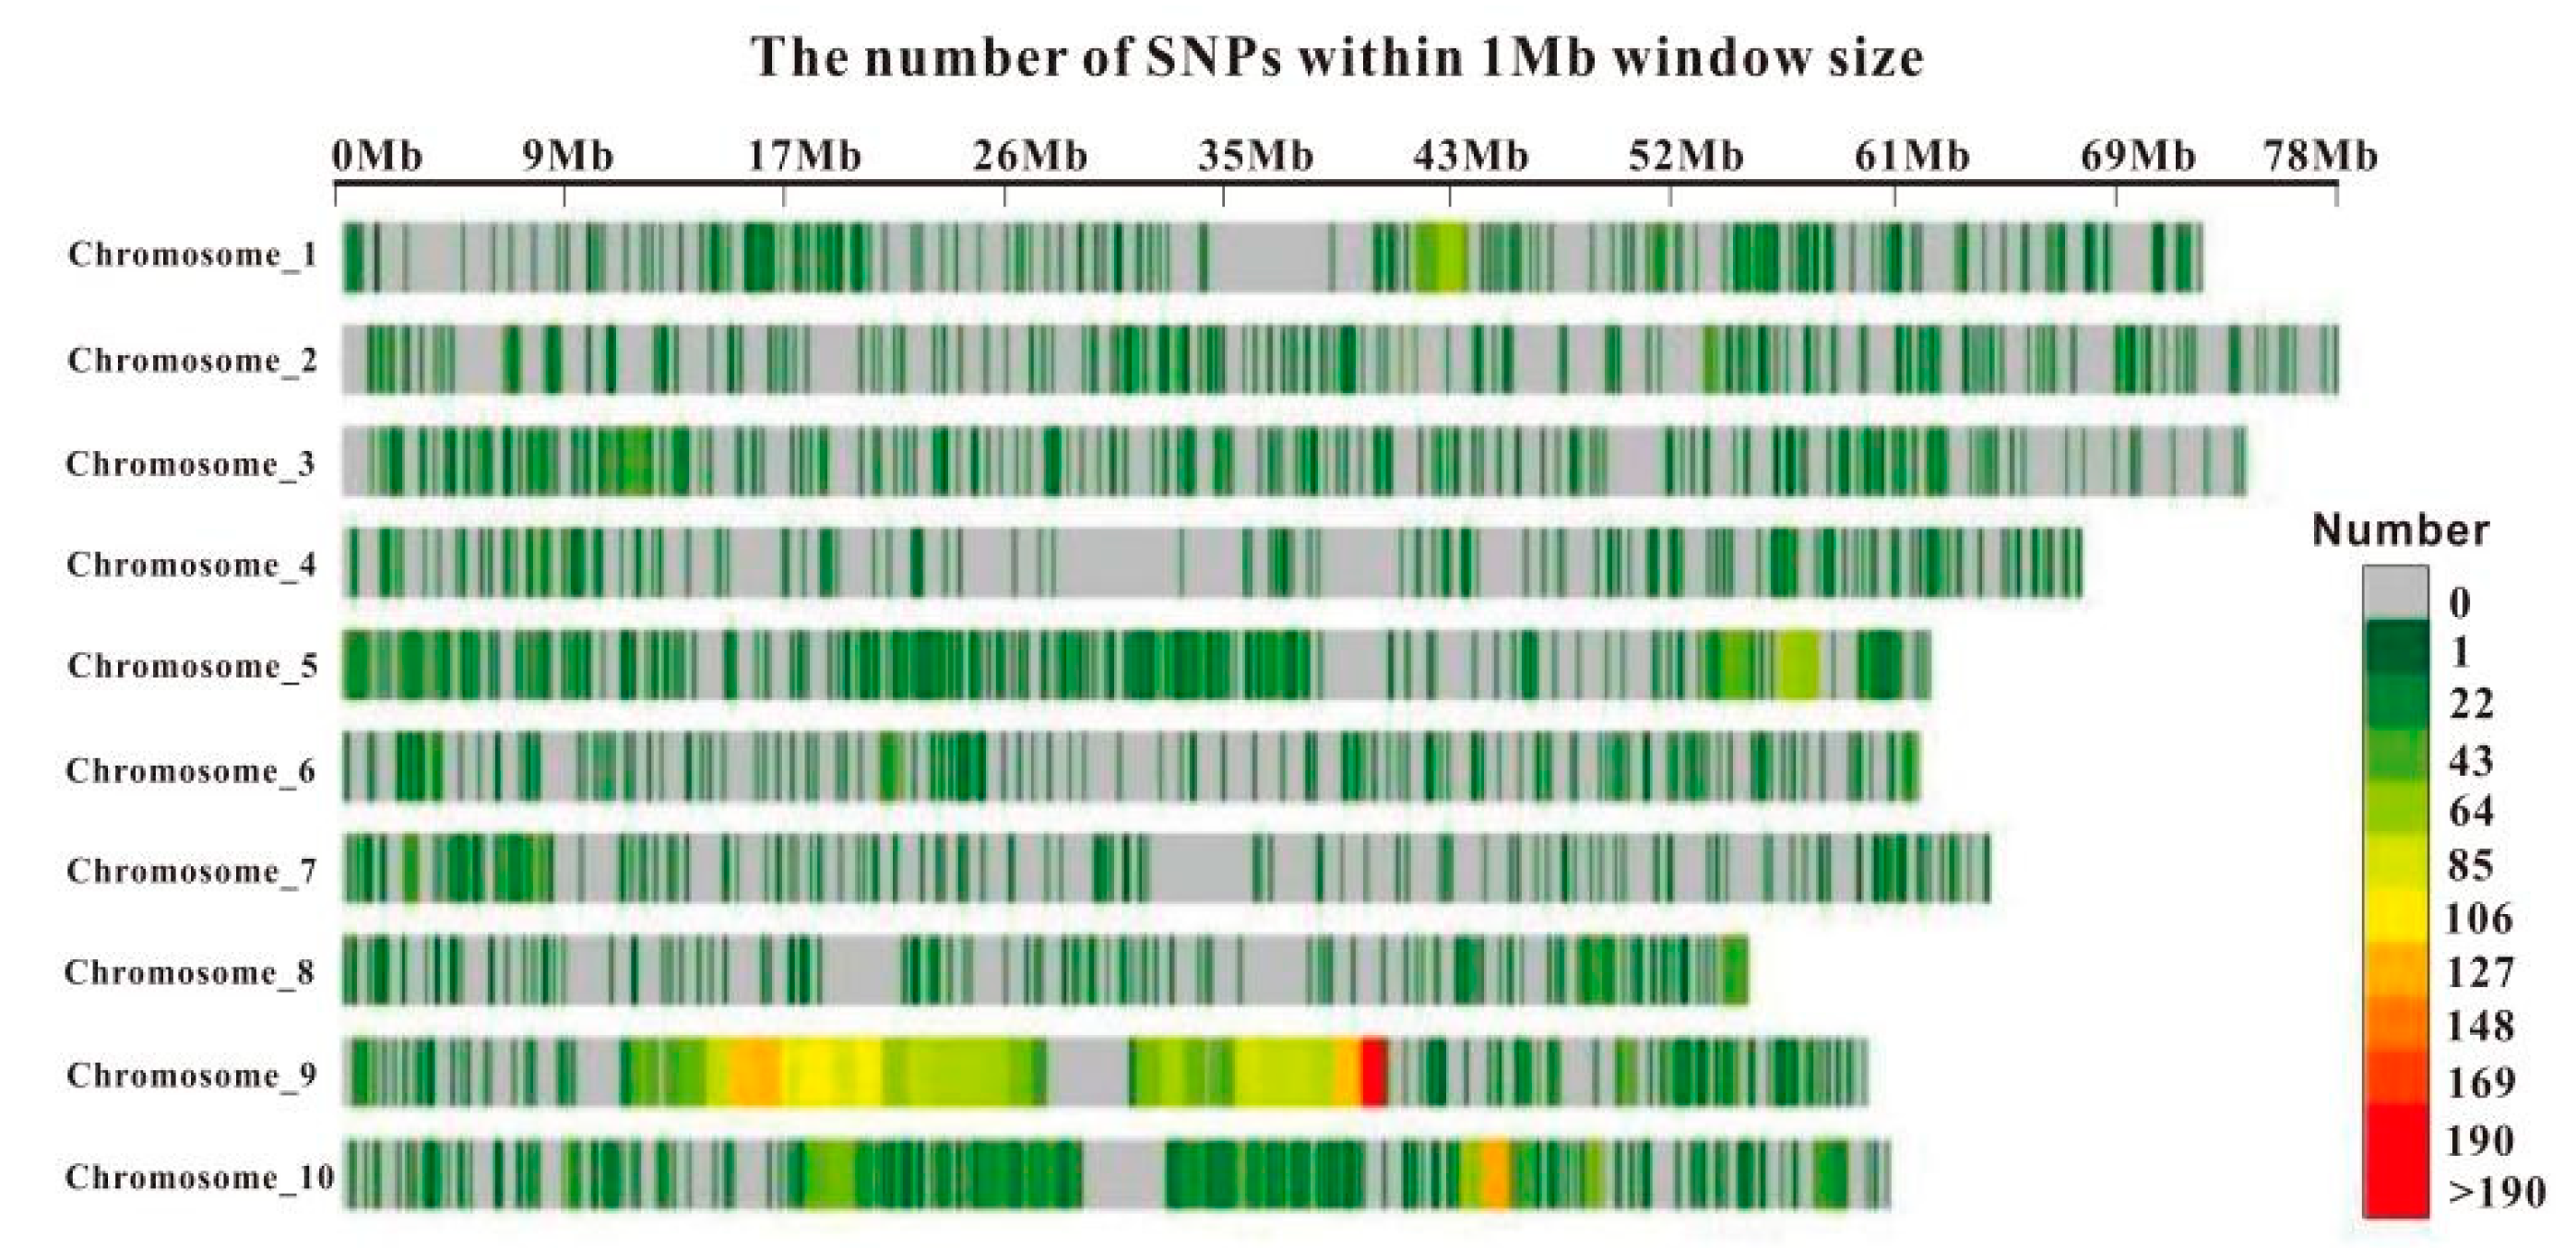
3.2. SNP Marker Density Distribution

The number of SNP markers distributed on ten chromosomes was unbalanced, which resulted in different densities on each chromosome. The chromosome distribution is shown in Figure 2, in which gray represents no SNPs (gaps) in the 1 Mb range, green represents low density, and yellow and red represent medium and high density, respectively. With the deepening of red, its density increased. Chromosome 9 had the highest density with red and yellow regions, among which the yellow region accounted for a large proportion. The density of chromosomes 10 and 5 was relatively high. In addition, there were many obvious gaps in each chromosome, which might be related to chromosome structure and population composition.
A total of 6186 SNPs were obtained after quality control and filling, and filtering with the standard of MAF ≥ 0.01 and missing rate (missing data) ≤ 0.1. Compared with other chromosomes, the number and average density of SNPs on chromosome 9 were the highest, which reached 2401 and 40.1, respectively (Table 1). The next was chromosome 10 with 995 and 16.5. The number and average density of SNPs on chromosome 4 were the lowest, which were 243 and 3.6, respectively. Specific information on other chromosomes is shown in Table 1.

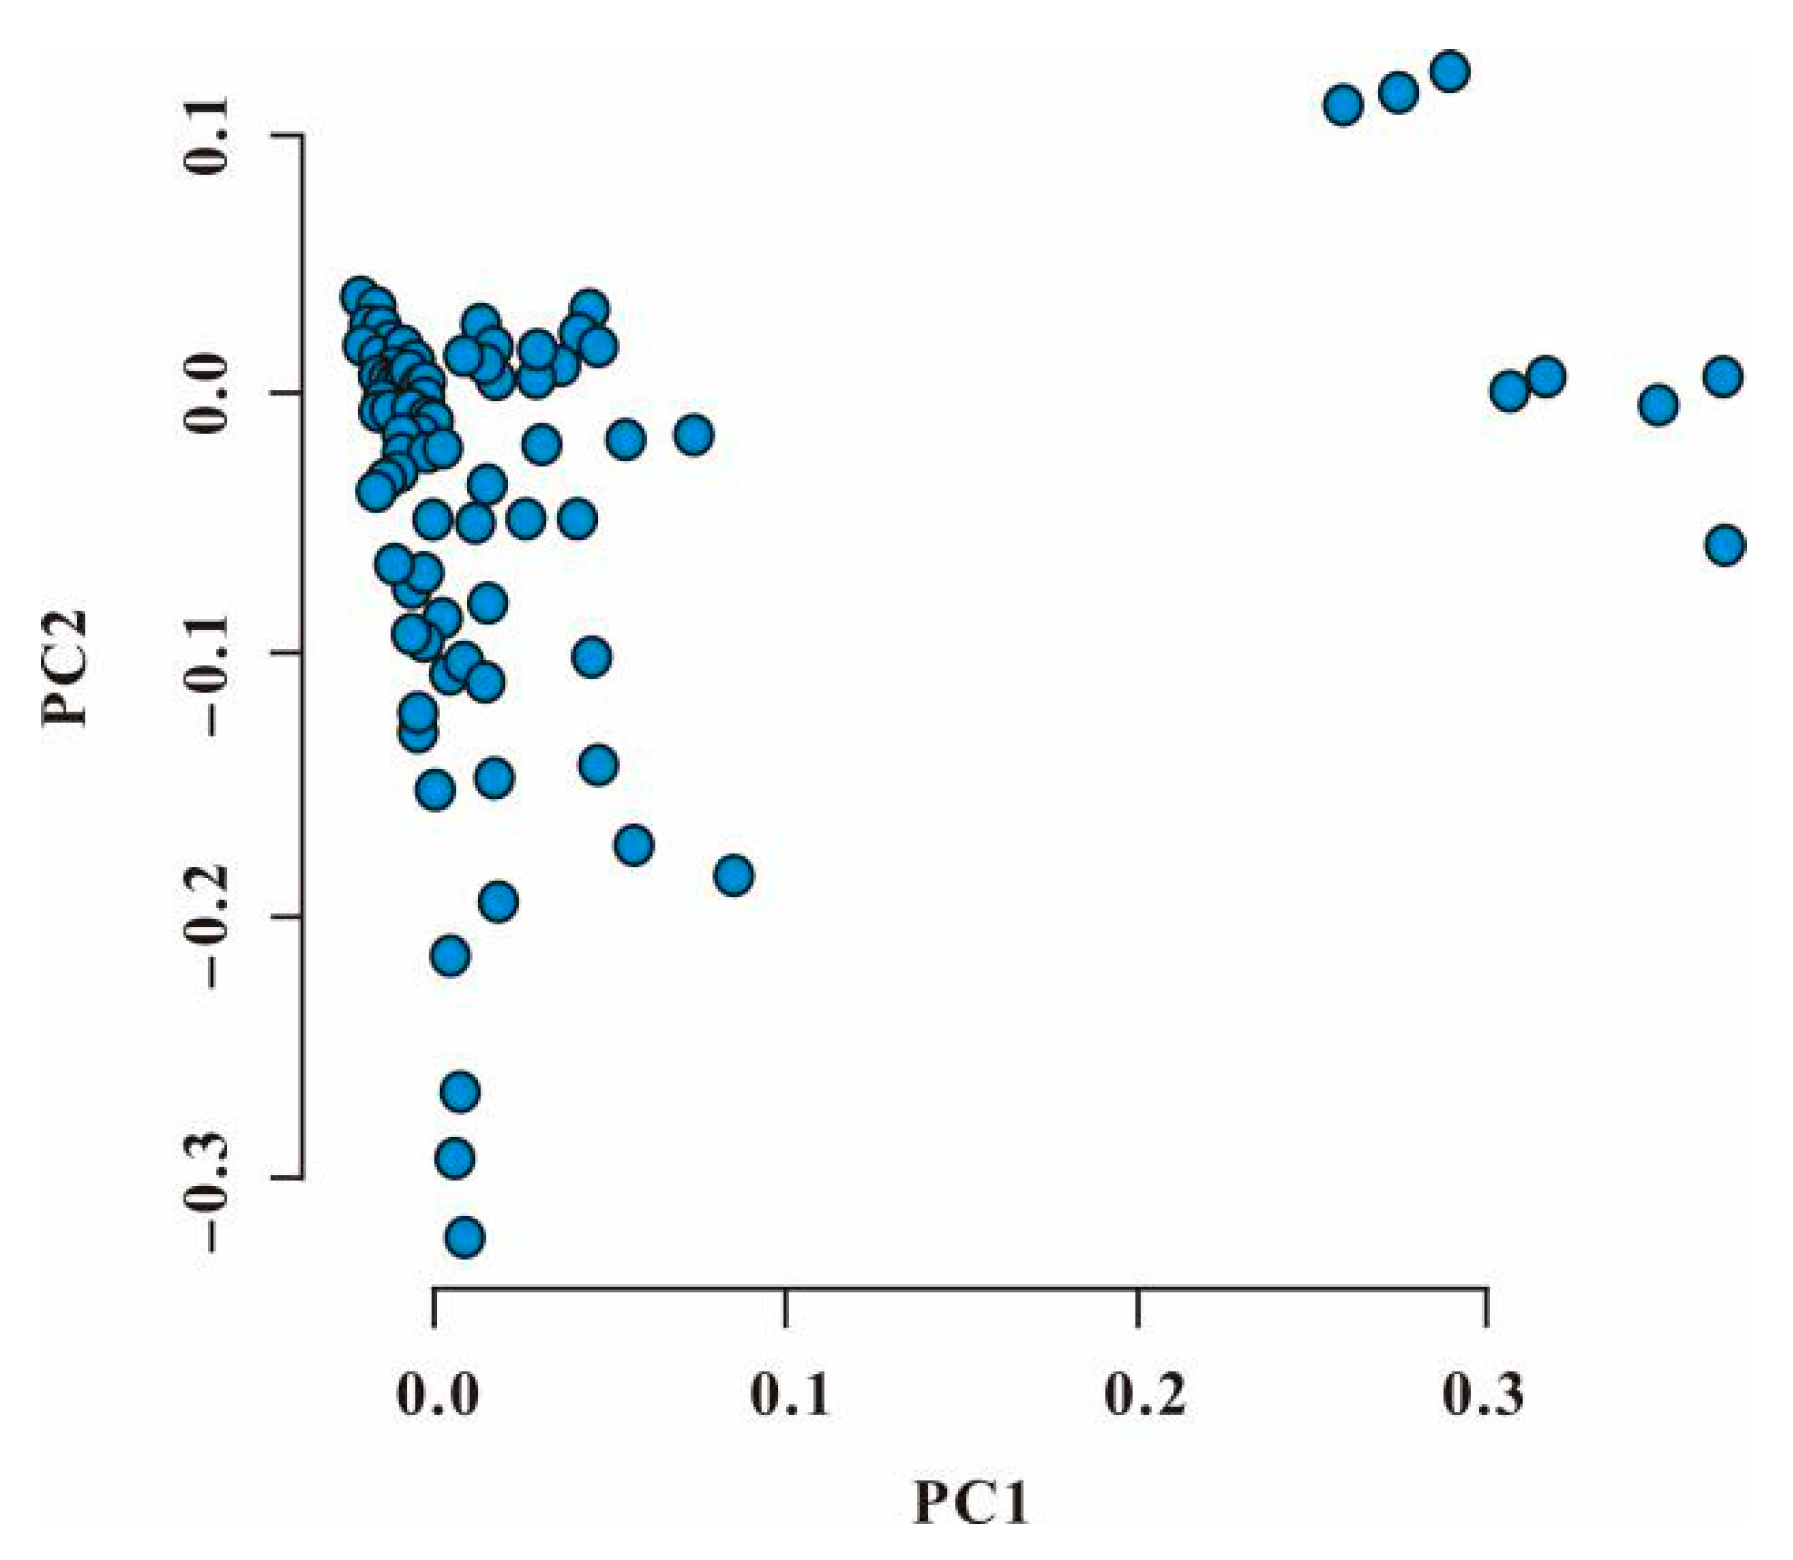
3.3. Principal Component Analysis of Genotype Data

Principal component analysis (PCA) divided the 354 strains into two subgroups by PC1. Most sweet sorghum accessions had little difference in PC1, and the genotype of nine accessions was significantly different from that of others in PC1. The boundary of accessions in PC2 was not apparent (Figure 3).

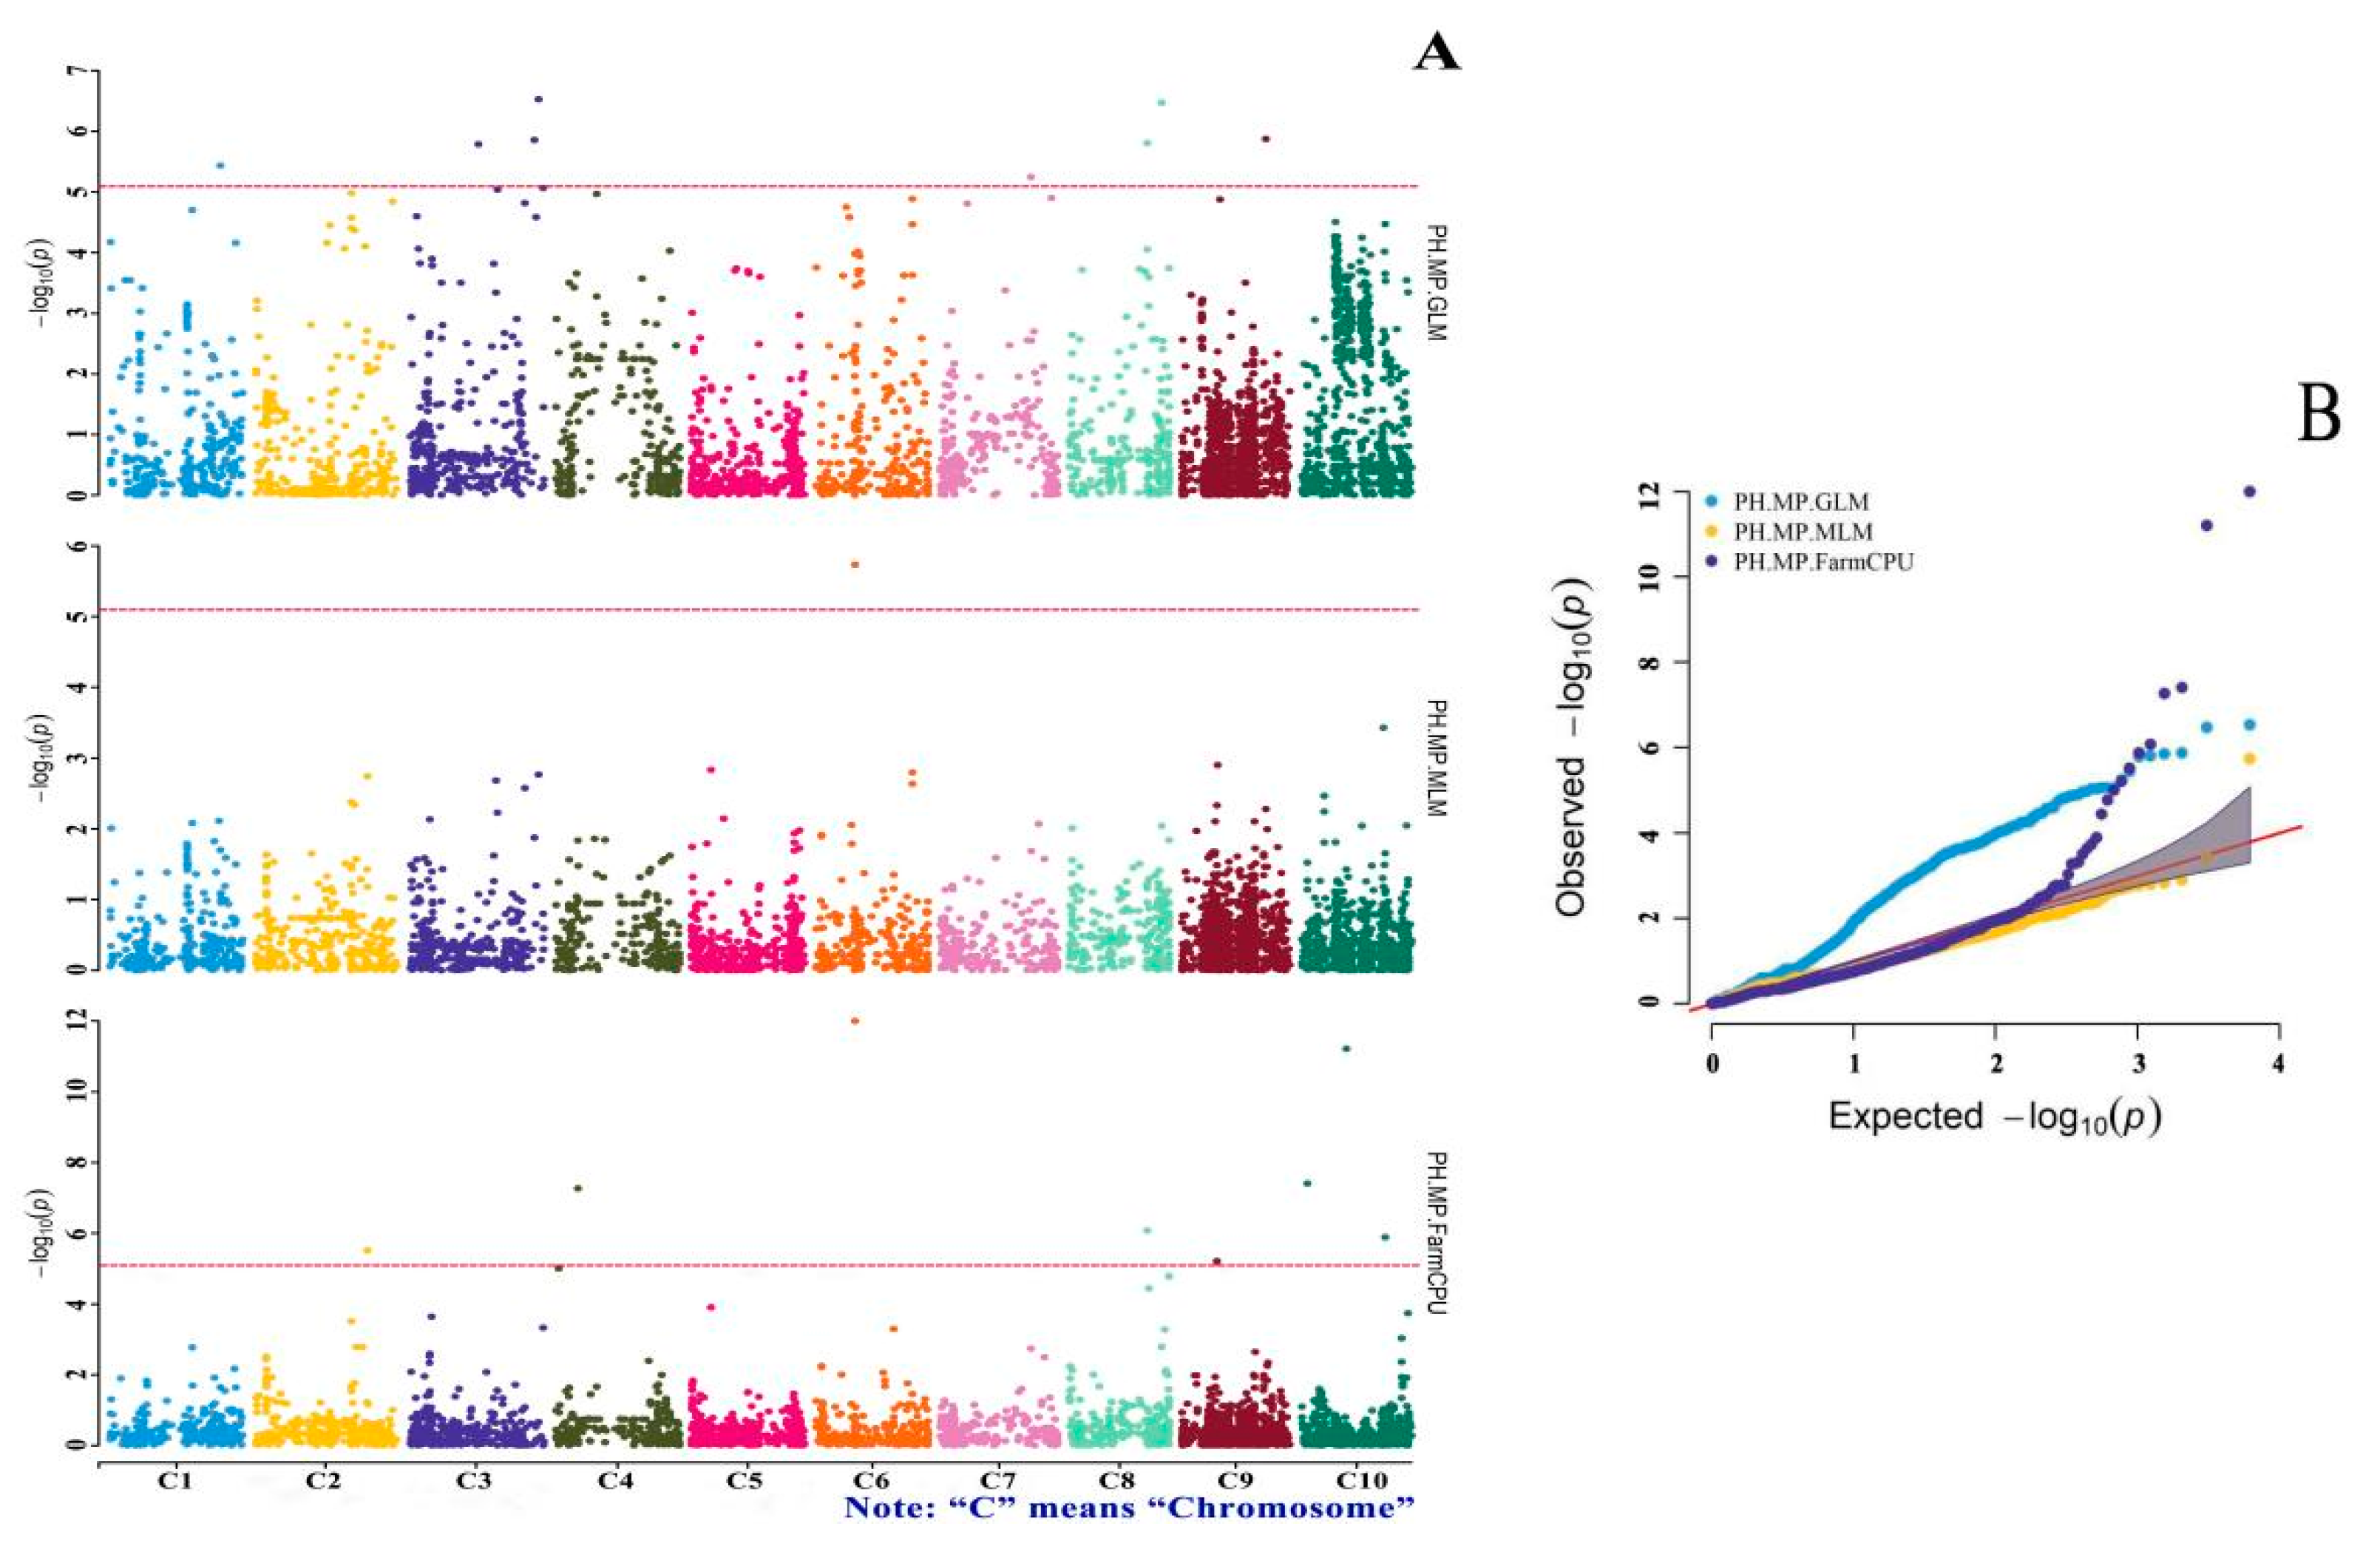
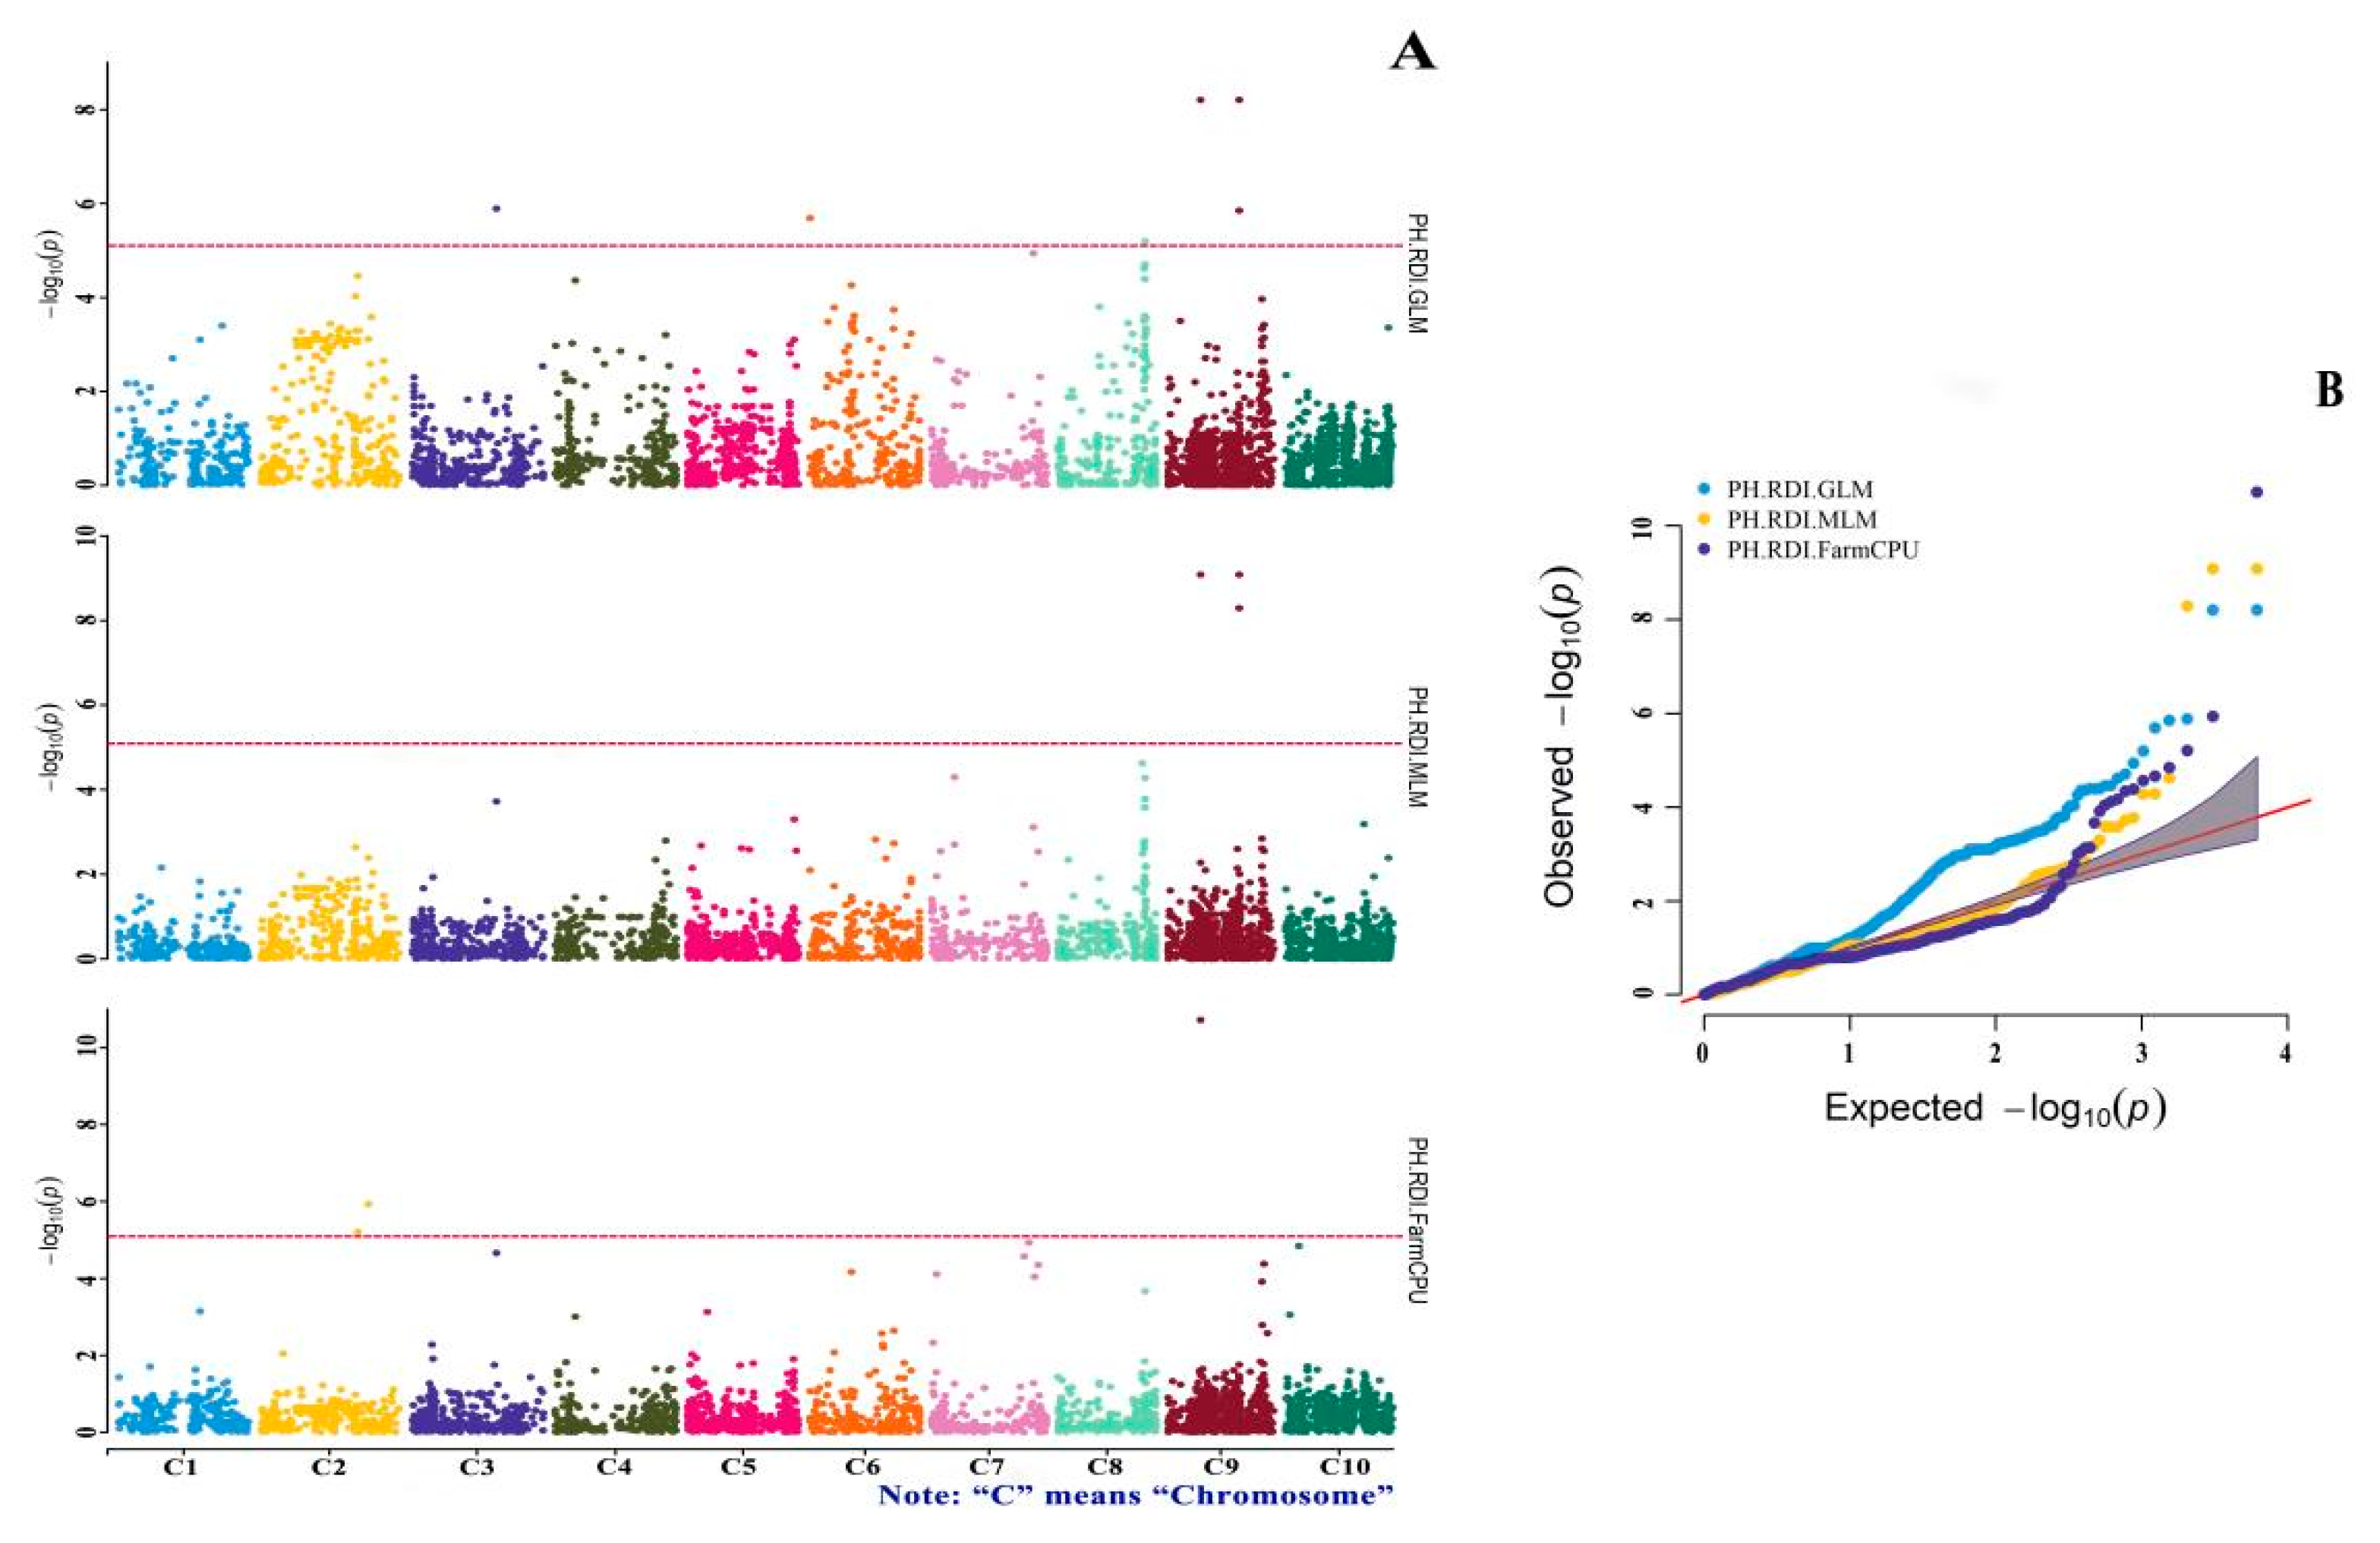
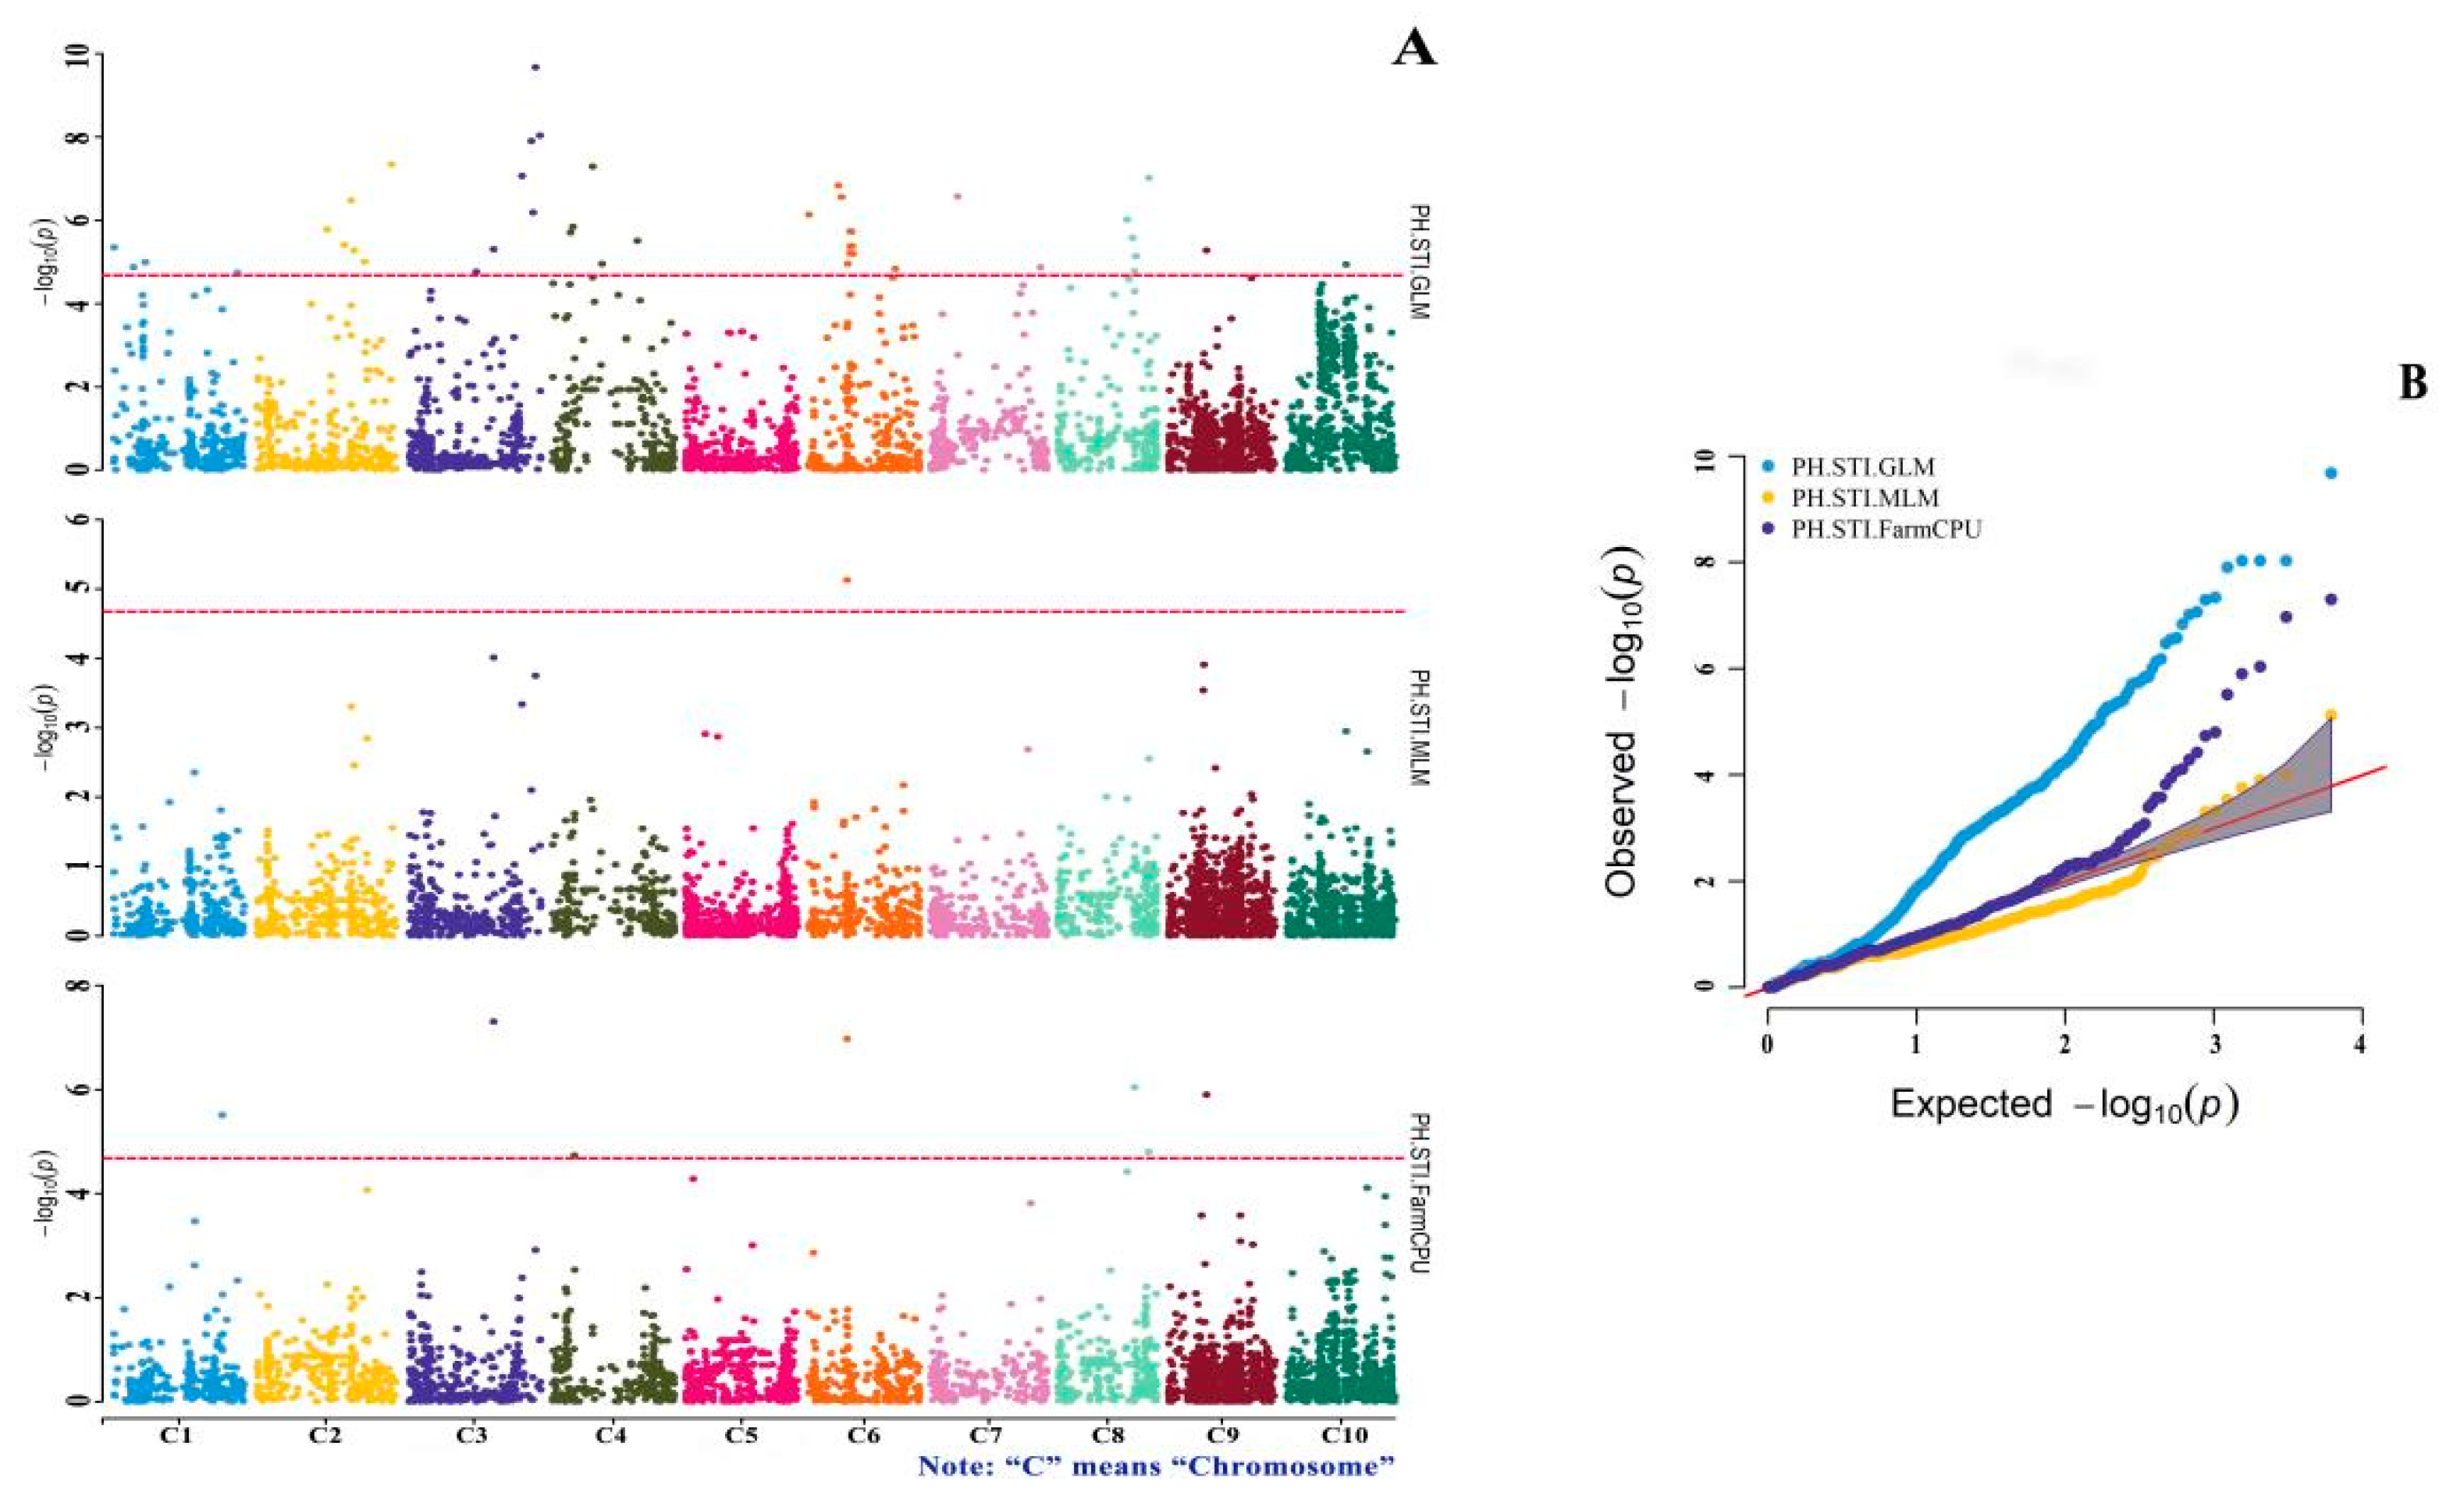
3.4. GWAS of Drought-Tolerance Indices

The genome expansion factors of mean productivity (MP) in the general linear model (GLM), the mixed linear model (MLM) and fixed and random model circulating probability unification (FarmCPU) were 2.104, 1.343 and 1.183, respectively. A total of 19 significant SNPs were detected based on MP, among which 8, 1 and 10 SNPs associated with MP were detected by the GLM, the MLM and FarmCPU, respectively. SNP-8-42803746 was co-detected by the GLM and FarmCPU. SNP-6-21397577 was co-detected by the MLM and FarmCPU (Figure 4, Table 2).
The genome expansion factors of the relative drought index (RDI) in the GLM, the MLM and FarmCPU were 1.300, 0.780 and 0.989, respectively. The RDI detected 19 significant SNPs, with six SNPs detected by GLM, three SNPs detected by the MLM, and 10 SNPs detected by FarmCPU. SNP-9-40211466 and SNP-9-40211299 were detected by the GLM and MLM, respectively. SNP-9-18625001 was co-detected by the three models. SNP-3-48129228 was detected by the GLM and FarmCPU (Figure 5, Table 3).
The genome expansion factors of the stress-tolerance index (STI) in the GLM, the MLM and FarmCPU were 1.654, 0.944 and 1.070, respectively. The STI detected 41 significant SNPs, with 35 SNPs detected by the GLM, one SNP detected by the MLM, and five SNPs detected by FarmCPU. SNP-9-21304761 and SNP-3-48129228 were detected by the GLM and FarmCPU, respectively. SNP-6-21397577 was co-detected by the MLM and FarmCPU (Figure 6, Table 4).

3.5. Gene Function Annotation

The significant loci detected by three PH drought-tolerance indices were annotated by gene function (Table 5). The significant locus SNP-8-50726311 was identified based on the MP and STI and was located in the Sb08g019720.1 gene, which is homologous to the TF LUX-like gene encoding the short anther in wild rice and the gene encoding the early flowering MYB protein (EFM) TF in Arabidopsis thaliana. The Sb01g037050.1, Sb01g037050.2 and Sb01g037050.4 genes were annotated based on the SNP-1-60603003 site identified by the MP and STI. The gene encodes the sorghum TF TGA2.2, which is homologous to the maize bZIP TF. It regulates transcription by binding to specific DNA sequences; the locus SNP-1-159169 identified based on the STI was annotated to the gene Sb01g000300.1, which encodes a sorghum transcription repressor and is homologous to the maize gene LOC100285229.

4. Discussion

Plant height (PH) is an important agronomic trait and a more intuitive and easy-to-measure experimental index. A significant positive correlation exists between PH and yield-related traits in maize under good irrigation and water stress conditions [36]. The GWAS results of maize drought resistance during flowering also showed that maize PH was significantly affected by drought stress, which was reduced by 12.47%. Additionally, maize PH under drought stress was significantly different from that of the control under good irrigation, and it was significantly positively correlated with the ear biomass at the heading stage [37]. Thus, because PH can reflect the growth adaptability of different varieties under drought conditions to a certain extent, it was selected as the index to measure the drought tolerance of sweet sorghum in this study. However, many traits reflect the drought tolerance of crops, such as grain weight, biological yield, root growth and so on. The determination of grain weight and biological yield has been completed, and the correlation analysis is being carried out (in preparation). These results can be used as a supplement and confirmation in this study. However, the determination of root growth, such as root length and root dry weight, has a large workload and requires a lot of effort and material resources. It is indeed challenging to rely solely on manual determination. Therefore, in the study of root traits to be conducted at a later stage, drought-tolerance genes at the seedling stage will be identified using an osmotic regulator to simulate drought in an artificial climate chamber.
Drought tolerance is the ability of crops to grow and reproduce under water-deficit conditions [38]. This complex trait is affected by many factors; thus, accurately evaluating crop drought tolerance is of great importance. To distinguish drought-resistant and sensitive genotypes, researchers have proposed algorithms based on observations of stress and non-stress conditions to derive selection indices to evaluate the response of crops to drought stress [39,40,41]. The stress-tolerance index (STI) and stress sensitivity index (SSI) can provide valuable information for association analyses of wheat drought-tolerance traits and molecular-marker-assisted selection breeding [42]. Therefore, the three drought-tolerance indices’ mean productivity (MP), relative drought index (RDI) and stress-tolerance index (STI), derived from plant height (PH) under regular irrigation and drought stress treatments, were used to distinguish the drought tolerance of different sweet sorghum accessions.
To determine the significant loci of drought tolerance, this study used three models for the GWAS. Among them, the GLM introduced population structure “Q” as a covariate to control false positives. The equation can be conceptually expressed as y = Q + si + e, where “si”, “y”, and “e” are the ith marker, phenotype and residuals, respectively. Q was represented by the PCA results of molecular markers covering the whole genome. The first three PCs were introduced in this study. The MLM introduced the Q (PCA results) and K (genetic relationships between varieties) matrices to control false positives. The equation can be conceptually expressed as y = Q + K + si + e. From the quantile–quantile (QQ) plots of the GWAS (Figure 4B, Figure 5B and Figure 6B), it can be seen that the blue line of the GLM algorithm that only considers Q began to rise from the starting position, and the genome expansion factor was greater than 1, which indicates that population stratification needs to be corrected, which is a cause of false positives [28]. In contrast, by considering the Q and K matrices, the MLM controls false positives and p-value inflation well [29,30,43]. However, for complex traits related to Q, the signals of known genes also disappear into the background, which weakens the true association [33]. The third model was FarmCPU, an algorithm that iteratively uses fixed and random effects. The equation can be conceptually expressed as y = si + S + e (fixed model) and y = u + e (random model), where “S” represents pseudo-quantitative-trait nucleotides as additional covariates, and “u” represents individual genetic effects with the variance and covariance matrix [33]. From the QQ plots of the GWAS (Figure 4B, Figure 5B and Figure 6B), it can be seen that the purple line representing FarmCPU was very close to the theoretical value, better controlled the expansion of the p-value, and the genome expansion factor was near 1. This study showed that FarmCPU had no obvious false positive or false negative values, and more micro-effect genes were captured without weakening the statistical effect. From the results of this study, 49, 5 and 25 significant SNP loci were detected by the GLM, the MLM and FarmCPU, respectively, which also demonstrated the difference in SNP detection among these three models. In addition, the results showed that many loci were detected by two or more models. The SNP-8-42803746 marker identified by the PH MP index, the SNP-3-48129228 marker identified by the PH RDI and the SNP-2130476 and SNP-3-48129228 markers identified by the PH STI were detected by the GLM and FarmCPU. SNP-6-21397577 identified by the MP index and SNP-6-21397577 identified by the STI were detected by the MLM and FarmCPU, respectively. SNP-9-40211466 and SNP-9-40211299 identified by the RDI were detected by the GLM and MLM, respectively. SNP-9-18625001 identified by the RDI was detected by the GLM, the MLM and FarmCPU. The results of these co-detected markers were relatively reliable.
In this study, based on the MP and STI analysis, the SNP-8-50726311-annotated gene, Sb08g019720.1, is homologous to the Arabidopsis MYB family TF EFM gene, and the SNP-1-60603003-annotated gene, Sb01g037050.1, is homologous to the maize bZIP TF gene, indicating that EFM TF and bZIP TF have a significant relationship with the drought-tolerance adaptation mechanism of sweet sorghum. Many plant TFs, such as MYB TF family proteins and bZIP proteins, are associated with crop stress resistance [21,22,23]. Under drought stress, they regulate the expression of target genes at the transcriptional level as a defense mechanism in response to drought. Several MYB TFs are involved in the response to drought stress in Arabidopsis, and these MYB TFs can directly or indirectly regulate the expression of multiple stress-related genes so that Arabidopsis can deal with the adverse external environment [44]. The overexpression of the MYB-related TF OsMYB48-1 can significantly improve the tolerance of rice to simulated drought caused by mannitol and polyethylene glycol. At the same time, the overexpression of this gene can regulate the expression of some ABA biosynthesis genes, early-signal genes and late-response genes, thereby enhancing the drought resistance of rice [45]. ZmbZIP4 is a positive regulator of abiotic stress in maize. ZmbZIP4 overexpression lines developed roots better under normal conditions, showing longer main roots and an increased number of lateral roots. Even under severe abiotic stress, it can still show a higher germination rate and survival rate. ZmbZIP4 overexpression regulated some stress response genes, ABA biosynthesis-related genes and key genes related to root development, thereby increasing ABA biosynthesis and ultimately leading to improved plant resistance to abiotic stress [46]. Thus, the results indicate that TFs, such as MYB and bZIP, are important for resistance in sweet sorghum. In addition, the two genes Sb08g019720.1 and Sb01g037050.1 annotated in this study may be drought-tolerant genes of sweet sorghum.

5. Conclusions

PH traits were investigated under two water treatments (drought stress and regular irrigation), and the MP, RDI and STI based on the PH were used as phenotypic data, combined with 6186 SNPs obtained by the resequencing of sweet sorghum. A total of 49, 5 and 25 significant SNP loci were detected by the GWAS using the GLM, the MLM and FarmCPU with R software packages, and multiple significant loci were detected by two or more models.
Based on the gene function annotation of the significant sites detected by the drought-tolerance indices of sweet sorghum PH traits, two drought-tolerance candidate genes were revealed. Among them, the Sb08g019720.1 gene is homologous to the gene encoding the Athaliana EFM TF, while the Sb01g037050.1 gene is homologous to the gene encoding the maize bZIP TF. The expression of MYB and bZIP TFs led to plant stress resistance, suggesting that both genes are closely related to drought tolerance. The drought-tolerant candidate genes revealed in this study can lay a foundation for subsequent gene function verification and the analysis of the molecular mechanism of drought tolerance in sweet sorghum, as well as enable breeders to cultivate drought-tolerant sweet sorghum varieties.

Supplementary Materials

The following supporting information can be downloaded at: https://0-www-mdpi-com.brum.beds.ac.uk/article/10.3390/su142114339/s1, Gene function annotation; Genotype data; Significant SNP information.

Author Contributions

Conceptualization, C.X. and W.H.; experimental method and design, data analysis, and writing—original draft, Q.G. and W.H.; data curation, L.G. and Y.X.; writing—review and editing, B.Y. and J.Z.; funding acquisition, supervision, and validation, C.X. and W.H. All authors have read and agreed to the published version of the manuscript.

Funding

This study was supported by regional projects of National Natural Funding of China (Nos. 31660300, 31660397).

Institutional Review Board Statement

Not applicable.

Informed Consent Statement

Not applicabble.

Data Availability Statement

All phenotype and genotype data, significant SNP information, and analysis results are available in Supplementary Materials.

Acknowledgments

We are grateful to the National Crop Germplasm Resource Platform (http://icgr.caas.net.cn) for providing the sweet sorghum accessions used in this study.

Conflicts of Interest

The authors declare no conflict of interest.

References

  1. Lei, Y.J.; Zhang, Y.F.; Zhang, M.H.; Liang, X.M.; Shao, X.J. Calculation and prediction of water resource ecological footprint in Xinjiang. Agric. Res. Arid. Areas 2017, 35, 142–150. [Google Scholar]
  2. Hu, M.F.; Tian, C.Y.; Zhao, Z.Y.; Wang, L.X. Salinization causes and research progress of technologies improving saline-alkali soil in Xinjiang. J. Northwest A&F Univ. 2012, 40, 111–117. [Google Scholar]
  3. Mohamed, M.F.M.; Emam, M.M.; Salama, K.H.A.; Morsy, A.A. Sorghum under saline conditions: Responses, tolerance mechanisms, and management strategies. Planta 2021, 254, 24. [Google Scholar]
  4. Huang, X.; Wei, X.; Sang, T.; Zhao, Q.; Feng, Q.; Zhao, Y.; Li, C.; Zhu, C.; Lu, T.; Zhang, Z.; et al. Genome-wide association studies of 14 agronomic traits in rice landraces. Nat Genet. 2010, 42, 961–967. [Google Scholar] [CrossRef]
  5. Ma, X.; Feng, F.; Wei, H.; Mei, H.; Xu, K.; Chen, S.; Li, T.; Liang, X.; Liu, H.; Luo, L. Genome-Wide Association Study for Plant Height and Grain Yield in Rice under Contrasting Moisture Regimes. Front. Plant Sci. 2016, 7, 1801. [Google Scholar] [CrossRef] [Green Version]
  6. Guo, Z.; Yang, W.; Chang, Y.; Ma, X.; Tu, H.; Xiong, F.; Jiang, N.; Feng, H.; Huang, C.; Yang, P.; et al. Genome-Wide Association Studies of Image Traits Reveal Genetic Architecture of Drought Resistance in Rice. Mol. Plant. 2018, 11, 789–805. [Google Scholar] [CrossRef] [Green Version]
  7. Pantalião, G.F.; Narciso, M.; Guimarães, C.; Castro, A.; Colombari, J.M.; Breseghello, F.; Rodrigues, L.; Vianello, R.P.; Borba, T.O.; Brondani, C. Genome-wide association study (GWAS) for grain yield in rice cultivated under water deficit. Genetica 2016, 144, 651–664. [Google Scholar] [CrossRef]
  8. Hoang, G.T.; Van Dinh, L.; Nguyen, T.T.; Ta, N.K.; Gathignol, F.; Mai, C.D.; Jouannic, S.; Tran, K.D.; Khuat, T.H.; Do, V.N.; et al. Genome-wide Association Study of a Panel of Vietnamese Rice Landraces Reveals New QTLs for Tolerance to Water Deficit During the Vegetative Phase. Rice 2019, 12, 4. [Google Scholar] [CrossRef] [Green Version]
  9. Sukumaran, S.; Dreisigacker, S.; Lopes, M.; Chavez, P.; Reynolds, M.P. Genome-wide association study for grain yield and related traits in an elite spring wheat population grown in temperate irrigated environments. Theor. Appl. Genet. 2015, 128, 353–363. [Google Scholar] [CrossRef]
  10. Mei, F.; Chen, B.; Du, L.; Li, S.; Zhu, D.; Chen, N.; Zhang, Y.; Li, F.; Wang, Z.; Cheng, X.; et al. A gain-of-function allele of a DREB transcription factor gene ameliorates drought tolerance in wheat. Plant Cell. 2022, 34, 4472–4494. [Google Scholar] [CrossRef]
  11. Zheng, X.; Qiao, L.; Liu, Y.; Wei, N.; Zhao, J.; Wu, B.; Yang, B.; Wang, J.; Zheng, J. Genome-Wide Association Study of Grain Number in Common Wheat from Shanxi Under Different Water Regimes. Front. Plant Sci. 2022, 12, 806295. [Google Scholar] [CrossRef] [PubMed]
  12. Mathew, I.; Shimelis, H.; Shayanowako, A.; Laing, M.; Chaplot, V. Genome-wide association study of drought tolerance and biomass allocation in wheat. PLoS ONE 2019, 14, e0225383. [Google Scholar] [CrossRef] [Green Version]
  13. Wang, N.; Wang, Z.P.; Liang, X.L.; Weng, J.F.; Lv, X.L.; Zhang, D.G.; Yang, J.; Yong, H.J.; Li, M.S.; Li, H.F.; et al. Identification of loci contributing to maize drought tolerance in a genome-wide association study. Euphytica 2016, 210, 165–179. [Google Scholar] [CrossRef]
  14. Wu, X.; Feng, H.; Wu, D.; Yan, S.; Zhang, P.; Wang, W.; Zhang, J.; Ye, J.; Dai, G.; Fan, Y.; et al. Using high-throughput multiple optical phenotyping to decipher the genetic architecture of maize drought tolerance. Genome Biol. 2021, 22, 185. [Google Scholar] [CrossRef]
  15. Wang, X.; Wang, H.; Liu, S.; Ferjani, A.; Li, J.; Yan, J.; Yang, X.; Qin, F. Genetic variation in ZmVPP1 contributes to drought tolerance in maize seedlings. Nat. Genet. 2016, 48, 1233–1241. [Google Scholar] [CrossRef]
  16. Sun, M.; Li, Y.; Zheng, J.; Wu, D.; Li, C.; Li, Z.; Zang, Z.; Zhang, Y.; Fang, Q.; Li, W.; et al. A Nuclear Factor Y-B Transcription Factor, GmNFYB17, Regulates Resistance to Drought Stress in Soybean. Int. J. Mol. Sci. 2022, 23, 7242. [Google Scholar] [CrossRef]
  17. Chen, L.; Fang, Y.; Li, X.; Zeng, K.; Chen, H.; Zhang, H.; Yang, H.; Cao, D.; Hao, Q.; Yuan, S.; et al. Identification of soybean drought-tolerant genotypes and loci correlated with agronomic traits contributes new candidate genes for breeding. Plant. Mol. Biol. 2020, 102, 109–122. [Google Scholar] [CrossRef]
  18. Spindel, J.E.; Dahlberg, J.; Colgan, M.; Hollingsworth, J.; Sievert, J.; Staggenborg, S.H.; Hutmacher, R.; Jansson, C.; Vogel, J.P. Association mapping by aerial drone reveals 213 genetic associations for Sorghum bicolor biomass traits under drought. BMC Genom. 2018, 19, 679. [Google Scholar] [CrossRef] [Green Version]
  19. Maina, F.; Harou, A.; Hamidou, F.; Morris, G.P. Genome-wide association studies identify putative pleiotropic locus mediating drought tolerance in sorghum. Plant Direct. 2022, 6, 413. [Google Scholar] [CrossRef]
  20. Hou, S.; Zhu, G.; Li, Y.; Li, W.; Fu, J.; Niu, E.; Li, L.; Zhang, D.; Guo, W. Genome-Wide Association Studies Reveal Genetic Variation and Candidate Genes of Drought Stress Related Traits in Cotton (Gossypium hirsutum L.). Front. Plant. Sci. 2018, 9, 1276. [Google Scholar] [CrossRef]
  21. Guan, S.Y.; Jiao, P.; Jiang, Z.Z.; Qi, Z.; Xia, H.F.; Qu, J.; Ma, Y.Y. Research Progress of MYB Transcription Factors in Plant Abiotic Stress. J. Jilin Agric. Univ. 2019, 41, 253–260. [Google Scholar]
  22. Xu, L.; Wang, Y.C.; He, X.L. Huang, Y.H.; Xu, Z.L.; Shao, H.B.; Zhang, D.Y. Isolation, Expression and Binding Function Analysis of the Transcription Factor GmMYB52 in Soybean. Acta Agron. Sin. 2017, 43, 1458–1467. [Google Scholar] [CrossRef]
  23. Wang, C.; Lu, G.; Hao, Y.; Guo, H.; Guo, Y.; Zhao, J.; Cheng, H. ABP9, a maize bZIP transcription factor, enhances tolerance to salt and drought in transgenic cotton. Planta 2017, 246, 453–469. [Google Scholar] [CrossRef]
  24. Bradbury, P.J.; Zhang, Z.; Kroon, D.E.; Casstevens, T.M.; Ramdoss, Y.; Buckler, E.S. TASSEL: Software for association mapping of complex traits in diverse samples. Bioinformatics 2007, 23, 2633–2635. [Google Scholar] [CrossRef]
  25. Yang, J.; Ferreira, T.; Morris, A.P.; Medland, S.E.; Genetic Investigation of ANthropometric Traits (GIANT) Consortium; DIAbetes Genetics Replication and Meta-Analysis (DIAGRAM) Consortium; Madden, P.A.; Heath, A.C.; Martin, N.G.; Montgomery, G.W.; et al. Conditional and joint multiple-SNP analysis of GWAS summary statistics identifies additional variants influencing complex traits. Nat. Genet. 2012, 44, 369–375. [Google Scholar] [CrossRef] [Green Version]
  26. Wang, M.; Wang, L.; Jiang, N.; Jia, T.; Luo, Z. A robust and efficient statistical method for genetic association studies using case and control samples from multiple cohorts. BMC Genom. 2013, 14, 88. [Google Scholar] [CrossRef] [Green Version]
  27. Zhang, Z.; Buckler, E.S.; Casstevens, T.M.; Bradbury, P.J. Software engineering the mixed model for genome-wide association studies on large samples. Brief Bioinform. 2009, 10, 664–675. [Google Scholar] [CrossRef] [Green Version]
  28. Pritchard, J.K.; Stephens, M.; Donnelly, P. Inference of population structure using multilocus genotype data. Genetics 2000, 155, 945–959. [Google Scholar] [CrossRef]
  29. Korte, A.; Vilhjálmsson, B.J.; Segura, V.; Platt, A.; Long, Q.; Nordborg, M. A mixed-model approach for genome-wide association studies of correlated traits in structured populations. Nat. Genet. 2012, 44, 1066–1071. [Google Scholar] [CrossRef] [Green Version]
  30. Yang, J.; Zaitlen, N.A.; Goddard, M.E.; Visscher, P.M.; Price, A.L. Advantages and pitfalls in the application of mixed-model association methods. Nat. Genet. 2014, 46, 100–106. [Google Scholar] [CrossRef] [Green Version]
  31. Zhang, Z.; Ersoz, E.; Lai, C.Q.; Todhunter, R.J.; Tiwari, H.K.; Gore, M.A.; Bradbury, P.J.; Yu, J.; Arnett, D.K.; Ordovas, J.M.; et al. Mixed linear model approach adapted for genome-wide association studies. Nat. Genet. 2010, 42, 355–360. [Google Scholar] [CrossRef] [Green Version]
  32. Li, M.; Liu, X.; Bradbury, P.; Yu, J.; Zhang, Y.M.; Todhunter, R.J.; Buckler, E.S.; Zhang, Z. Enrichment of statistical power for genome-wide association studies. BMC Biol. 2014, 12, 73. [Google Scholar] [CrossRef] [Green Version]
  33. Liu, X.; Huang, M.; Fan, B.; Buckler, E.S.; Zhang, Z. Iterative Usage of Fixed and Random Effect Models for Powerful and Efficient Genome-Wide Association Studies. PLoS Genet. 2016, 12, e1005767. [Google Scholar] [CrossRef]
  34. Dai, Y.H.; Guan, Y.; Liu, M.Q.; Zhang, Q.K.; He, X.H. Dynamic Monitoring and Evaluation of Ecological Environment Quality in Alar Reclamation Area from 1990 to 2020. Bull. Soil Water Conserv. 2022, 42, 122–128. [Google Scholar]
  35. Amiri, R.; Bahraminejad, S.; Sasani, S.; Ghobadi, M. Genetic evaluation of 80 irrigated bread wheat genotypes for drought tolerance indices. Bulg. J. Agric. Sci. 2014, 20, 101–111. [Google Scholar]
  36. Li, C.; Sun, B.; Li, Y.; Liu, C.; Wu, X.; Zhang, D.; Shi, Y.; Song, Y.; Buckler, E.S.; Zhang, Z.; et al. Numerous genetic loci identified for drought tolerance in the maize nested association mapping populations. BMC Genom. 2016, 17, 894. [Google Scholar] [CrossRef]
  37. Khan, S.U.; Zheng, Y.; Chachar, Z.; Zhang, X.; Zhou, G.; Zong, N.; Leng, P.; Zhao, J. Dissection of Maize Drought Tolerance at the Flowering Stage Using Genome-Wide Association Studies. Genes 2022, 13, 564. [Google Scholar] [CrossRef]
  38. Khayatnezhad, M.; Zaefizadeh, M.; Gholamin, R.; Jamaati-E-Somarin, S. Study of Genetic Diversity and Path Analysis for Yield in Durum Wheat Genotypes under Water and Dry Conditions. World Appl. Sci. J. 2010, 9, 655–665. [Google Scholar]
  39. Saeidi, M.; Abdoli, M.; Azhand, M.; Khas-amiri, M. Evaluation of drought resistance of barley (Hordeum vulgare L.) cultivars using agronomic characteristics and drought tolerance indices. Albanian J. Agric. Sci. 2013, 12, 545–554. [Google Scholar]
  40. Aditya, J.; Bhartiya, A.; Pal, R.S.; Kant, L.; Pattanayak, A. Identification of drought tolerant, high yielding rice genotypes for rainfed upland ecosystem of uttarakhand hills through different drought tolerance indices. J. Environ. Biol. 2022, 43, 306–316. [Google Scholar] [CrossRef]
  41. Mueen, A.K.; Hafiz Muhammad, F.U.; Iqbal, M.; Rehman, A.; Chattha, W.S. Evaluation of high-yielding wheat (Triticum aestivum L.) varieties under water limitation. Plant. Genet. Resour. 2021, 19, 245–251. [Google Scholar]
  42. Ballesta, P.; Mora, F.; Del, P.A. Association mapping of drought tolerance indices in wheat: QTL-rich regions on chromosome 4A. Sci. Agric. 2020, 77, 153. [Google Scholar] [CrossRef] [Green Version]
  43. Yu, J.; Pressoir, G.; Briggs, W.H.; Vroh, B.I.; Yamasaki, M.; Doebley, J.F.; McMullen, M.D.; Gaut, B.S.; Nielsen, D.M.; Holland, J.B.; et al. A unified mixed-model method for association mapping that accounts for multiple levels of relatedness. Nat. Genet. 2006, 38, 203–208. [Google Scholar] [CrossRef] [PubMed]
  44. Feng, P.P.; Chen, P.; Hong, W.J.; Zhao, X.Y.; Liu, X.M. Research Progress of MYB Transcription Factor Family in Arabidopsis thaliana. Life Sci. Res. 2016, 20, 555–560. [Google Scholar]
  45. Xiong, H.; Li, J.; Liu, P.; Duan, J.; Zhao, Y.; Guo, X.; Li, Y.; Zhang, H.; Ali, J.; Li, Z. Overexpression of OsMYB48-1, a novel MYB-related transcription factor, enhances drought and salinity tolerance in rice. PLoS ONE 2014, 9, e92913. [Google Scholar] [CrossRef] [Green Version]
  46. Ma, H.; Liu, C.; Li, Z.; Ran, Q.; Xie, G.; Wang, B.; Fang, S.; Chu, J.; Zhang, J. ZmbZIP4 Contributes to Stress Resistance in Maize by Regulating ABA Synthesis and Root Development. Plant Physiol. 2018, 178, 753–770. [Google Scholar] [CrossRef]
Figure 1. Density distribution of drought-tolerance indices of plant height. Density distribution of MP (A), density distribution of RDI (B), density distribution of STI (C).
Sustainability 14 14339 g001
Figure 2. Density distribution of chromosome markers.
Sustainability 14 14339 g002
Figure 3. Principal component analysis plot.
Sustainability 14 14339 g003
Figure 4. Genome-wide association study (GWAS) of mean productivity (MP). Manhattan plots (A) and quantile–quantile (QQ) plot (B).
Sustainability 14 14339 g004
Figure 5. GWAS of relative drought index (RDI). Manhattan plots (A) and QQ plot (B).
Sustainability 14 14339 g005
Figure 6. GWAS of stress-tolerance index (STI). Manhattan plots (A) and QQ plot (B).
Sustainability 14 14339 g006
Table 1. Specific information of SNPs on chromosomes.
ChromosomeLength (bp)No. of SNPsAverage Density (SNPs/Mb)
172,621,6283925.4
277,923,5993404.4
374,347,8263795.1
467,928,8092433.6
561,993,31861510.0
661,563,9092844.6
764,298,0072664.1
854,875,0462714.9
959,493,343240140.4
1060,355,39799516.5
Note: Chromosome length was calculated between the last marker position and the first marker position on the same chromosome of all the test materials.
Table 2. Marker information detected by GWAS of MP.
MarkerVariantEffectp-ValueMethods
SNP-9-46359555T/C0.2591.34 × 10−6MP.GLM
SNP-9-32010157T/C−0.8005.43 × 10−6MP.FarmCPU
SNP-8-54701961C/T−0.2805.27 × 10−6MP.FarmCPU
SNP-8-50726311C/G−0.1803.37 × 10−7MP.GLM
SNP-8-42803746G/A−0.1001.22 × 10−7MP.FarmCPU
SNP-8-42803746G/A−0.1401.57 × 10−6MP.GLM
SNP-7-49761327G/C−0.5035.68 × 10−6MP.GLM
SNP-6-21397577T/C−0.7761.73 × 10−12MP.FarmCPU
SNP-6-21397577T/C−0.7451.84 × 10−6MP.MLM
SNP-4-1724051C/T−0.0993.23 × 10−6MP.FarmCPU
SNP-4-12346536A/T−0.2932.50 × 10−9MP.FarmCPU
SNP-3-71564436A/C−0.3362.98 × 10−7MP.GLM
SNP-3-69226243A/G−0.2871.40 × 10−6MP.GLM
SNP-3-38408072C/A−0.1401.63 × 10−6MP.GLM
SNP-2-62168227A/C0.1371.72 × 10−6MP.FarmCPU
SNP-1-60603003T/C0.3163.69 × 10−6MP.GLM
SNP-10-45922678T/C−0.2081.57 × 10−7MP.FarmCPU
SNP-10-3166515C/T0.3491.21 × 10−9MP.FarmCPU
SNP-10-24652464T/C0.5615.82 × 10−12MP.FarmCPU
Table 3. Marker information detected by GWAS of RDI.
MarkerVariantEffectp-ValueMethods
SNP-9-40211466A/T−0.9201.42 × 10−6RDI.GLM
SNP-9-40211466A/T−1.4795.15 × 10−9RDI.MLM
SNP-9-40211299T/A−1.0596.28 × 10−9RDI.GLM
SNP-9-40211299T/A−1.5048.32 × 10−10RDI.MLM
SNP-9-18625001G/A−0.9913.42 × 10−18RDI.FarmCPU
SNP-9-18625001G/A−1.0596.28 × 10−9RDI.GLM
SNP-9-18625001G/A−1.5048.32 × 10−10RDI.MLM
SNP-8-48976460T/C−0.2376.46 × 10−6RDI.GLM
SNP-7-59879988T/A0.0988.80 × 10−8RDI.FarmCPU
SNP-7-57772159T/A−0.0593.74 × 10−7RDI.FarmCPU
SNP-7-51913862T/C0.0695.20 × 10−8RDI.FarmCPU
SNP-7-2876065A/G−0.1025.05 × 10−7RDI.FarmCPU
SNP-6-23330464C/G−0.0645.51 × 10−7RDI.FarmCPU
SNP-6-153673A/G−0.0912.07 × 10−6RDI.GLM
SNP-3-48129228T/G0.1833.09 × 10−8RDI.FarmCPU
SNP-3-48129228T/G0.2701.30 × 10−6RDI.GLM
SNP-2-60765047T/C−0.0645.09 × 10−10RDI.FarmCPU
SNP-2-54990996T/A−0.0763.20 × 10−9RDI.FarmCPU
SNP-10-7591972C/T−0.1251.82 × 10−7RDI.FarmCPU
Table 4. Marker information detected by GWAS of STI.
MarkerVariantEffectp-ValueMethods
SNP-1-60603003T/C0.1223.11 × 10−6STI.FarmCPU
SNP-9-21304761G/C0.1691.26 × 10−6STI.FarmCPU
SNP-9-21304761G/C0.2105.34 × 10−6STI.GLM
SNP-8-50726311C/G−0.1129.58 × 10−8STI.GLM
SNP-8-43496503A/G−0.1367.33 × 10−6STI.GLM
SNP-8-42803746G/A−0.0689.16 × 10−7STI.FarmCPU
SNP-8-41546525T/C−0.1612.65 × 10−6STI.GLM
SNP-8-38378608G/T−0.1579.75 × 10−7STI.GLM
SNP-7-14894170T/C−0.1982.70 × 10−7STI.GLM
SNP-6-24638786T/C−0.1166.40 × 10−6STI.GLM
SNP-6-24155091C/G−0.1194.23 × 10−6STI.GLM
SNP-6-23766693G/C−0.1201.90 × 10−6STI.GLM
SNP-6-23020118T/C−0.1146.21 × 10−6STI.GLM
SNP-6-22967016C/T−0.1144.32 × 10−6STI.GLM
SNP-6-22966971A/G−0.1201.86 × 10−6STI.GLM
SNP-6-21397577T/C−0.3981.07 × 10−7STI.FarmCPU
SNP-6-21397577T/C−0.4267.49 × 10−6STI.MLM
SNP-6-18184340T/C−0.1382.78 × 10−7STI.GLM
SNP-6-16486758T/C−0.1471.48 × 10−7STI.GLM
SNP-6-153673A/G−0.1087.35 × 10−7STI.GLM
SNP-4-47497728T/C−0.1783.13 × 10−6STI.GLM
SNP-4-22602002A/G−0.2495.12 × 10−8STI.GLM
SNP-4-11561108T/G−0.1641.44 × 10−6STI.GLM
SNP-4-11561107G/C−0.1641.44 × 10−6STI.GLM
SNP-4-10100565G/C−0.2061.98 × 10−6STI.GLM
SNP-3-73977961C/A−0.1459.30 × 10−9STI.GLM
SNP-3-73977959T/A−0.1459.30 × 10−9STI.GLM
SNP-3-73977947T/A−0.1459.30 × 10−9STI.GLM
SNP-3-71564436A/C−0.2462.12 × 10−10STI.GLM
SNP-3-70162204A/G−0.1656.51 × 10−7STI.GLM
SNP-3-69226243A/G−0.2011.24 × 10−8STI.GLM
SNP-3-63949295G/C−0.2138.63 × 10−8STI.GLM
SNP-3-48129228T/G0.2404.95 × 10−8STI.FarmCPU
SNP-3-48129228T/G0.2934.99 × 10−6STI.GLM
SNP-2-75743471G/T−0.1594.57 × 10−8STI.GLM
SNP-2-54990998T/C−0.1205.33 × 10−6STI.GLM
SNP-2-54990996T/A−0.1205.33 × 10−6STI.GLM
SNP-2-53243721C/T0.4863.35 × 10−7STI.GLM
SNP-2-49409474C/G−0.1763.93 × 10−6STI.GLM
SNP-2-39852357A/G−0.2051.67 × 10−6STI.GLM
SNP-1-159169G/T−0.1824.54 × 10−6STI.GLM
Table 5. Annotation information of significant sites of drought-tolerance indices.
SNPGenesGene Function Annotation
SNP-1-159169Sb01g000300.1transcriptional corepressor Leunig-homolog-like [Sorghum bicolor],
Zea mays LOC100285229 (pco116270)
SNP-1-60603003Sb01g037050.1TF TGA2.2 [Sorghum bicolor],
Zea mays putative bZIP TF
(LOC100274089)
SNP-1-60603003Sb01g037050.2TF TGA2.2 [Sorghum bicolor],
Zea mays putative bZIP TF
(LOC100274089)
SNP-1-60603003Sb01g037050.3TF TGA2.2 [Sorghum bicolor],
Setaria italica TF HBP-1b(c1)-like (LOC101767047),
transcript variant X1, mRNA
SNP-1-60603003Sb01g037050.4TF TGA2.2 [Sorghum bicolor],
Zea mays putative bZIP TF
(LOC100274089)
SNP-8-50726311Sb08g019720.1TF LUX-like [Oryza brachyantha],
Sorghum bicolor hypothetical protein, mRNA,
MYB family TF EFM, Arabidopsis thaliana
Publisher’s Note: MDPI stays neutral with regard to jurisdictional claims in published maps and institutional affiliations.

