Article

Power System Voltage Stability Margin Estimation Using Adaptive Neuro-Fuzzy Inference System Enhanced with Particle Swarm Optimization

by
Oludamilare Bode Adewuyi
1,*,
Komla A. Folly
1,
David T. O. Oyedokun
1 and
Emmanuel Idowu Ogunwole
2
1
Department of Electrical Engineering, University of Cape Town, Cape Town 7701, South Africa
2
Department of Electrical, Electronic and Computer Engineering, Cape Peninsula University of Technology, Bellville Campus, Cape Town 7535, South Africa
*
Author to whom correspondence should be addressed.
Sustainability 2022, 14(22), 15448; https://0-doi-org.brum.beds.ac.uk/10.3390/su142215448
Submission received: 3 October 2022 / Revised: 16 November 2022 / Accepted: 18 November 2022 / Published: 21 November 2022

Abstract

:
In the current era of e-mobility and for the planning of sustainable grid infrastructures, developing new efficient tools for real-time grid performance monitoring is essential. Thus, this paper presents the prediction of the voltage stability margin (VSM) of power systems by the critical boundary index (CBI) approach using the machine learning technique. Prediction models are based on an adaptive neuro-fuzzy inference system (ANFIS) and its enhanced model with particle swarm optimization (PSO). Standalone ANFIS and PSO-ANFIS models are implemented using the fuzzy ‘c-means’ clustering method (FCM) to predict the expected values of CBI as a veritable tool for measuring the VSM of power systems under different loading conditions. Six vital power system parameters, including the transmission line and bus parameters, the power injection, and the system voltage derived from load flow analysis, are used as the ANFIS model implementation input. The performances of the two ANFIS models on the standard IEEE 30-bus and the Nigerian 28-bus systems are evaluated using error and regression analysis metrics. The performance metrics are the root mean square error ( R M S E ), mean absolute percentage error ( M A P E ), and Pearson correlation coefficient (R) analyses. For the IEEE 30-bus system, R M S E is estimated to be 0.5833 for standalone ANFIS and 0.1795 for PSO-ANFIS; M A P E is estimated to be 13.6002% for ANFIS and 5.5876% for PSO-ANFIS; and R is estimated to be 0.9518 and 0.9829 for ANFIS and PSO-ANFIS, respectively. For the NIGERIAN 28-bus system, the R M S E values for ANFIS and PSO-ANFIS are 5.5024 and 2.3247, respectively; M A P E is 19.9504% and 8.1705% for both ANFIS and PSO-ANFIS variants, respectively, and the R is estimated to be 0.9277 for ANFIS and 0.9519 for ANFIS-PSO, respectively. Thus, the PSO-ANFIS model shows a superior performance for both test cases, as indicated by the percentage reduction in prediction error, although at the cost of a higher simulation time.

1. Introduction

Challenges of voltage instability are majorly responsible for blackouts and techno-economic depletions in the power systems of many nations [1]. Thus, a vital yardstick for evaluating the viability of a power system network (grid infrastructures) is the amount of available voltage stability margin (VSM). VSM is often considered to measure how long a particular power system can operate before suffering voltage instability in the face of continuously changing load demand, and generation dynamics [2,3]. Theoretically, it can be estimated as the distance between a current operating point and the nearest point of voltage collapse as the real and reactive loading is continuously increased [4]. Generally, the capacity of existing grid infrastructures to accommodate increased load and sometimes increased generation, especially from renewable energy sources, is very limited. However, with the load flow analysis, the VSM of a grid can be sufficiently monitored towards setting up appropriate control for secure operation. Remarkably, significant efforts were devoted to power system security analysis over the years [5,6]. However, most approaches for investigating voltage instabilities in power systems are based on static analysis using the power transfer concept and load flow calculations. Consequently, several voltage stability indices (VSIs) were available in works of literature as products of rigorous research activities for monitoring power system security [7,8]. However, most of these tools, i.e., VSIs, have limited performance capacity for accuracy and precision regarding real networks and large/complex power systems. This underperformance of conventional VSIs is attributed to the fact that these tools are derived approximately considering few power system parameters [4]. Moreover, a vital consideration for the real-time implementation of the conventional VSI procedures, which is the computation time, is considerably large, especially for complex networks [9]. Thus, it is necessary to research the development of better performing intelligent-based techniques for effectively managing voltage stability issues in power systems.
Due to the advent of artificial intelligence (AI), intelligent predictions of future events are taking the prominent stage for critical infrastructure planning and operations in recent time [10]. Different AI-based mechanisms were successfully implemented in various areas of intelligent infrastructure management, such as transportation, water supply, food processing, chemical processing, building design and construction, etc. Common AI-based prediction models include artificial intelligence-based algorithms such as regression analysis, artificial neural networks (ANNs), support vector machines, K-means, Bayesian methods, fuzzy logic, expert systems, etc., [11]. Power system networks are expensive, complex to operate, and significantly critical public infrastructures, and voltage stability monitoring is a significant aspect of its reliable operation and protection [12]. Several predictive analytics tools have been applied in the literature for solving critical power systems problems, such as load flow analysis, contingency planning, transmission congestion management, grid reinforcement planning, etc. [13,14,15]. Thus, one of the imminent prospects for the effective operation of grid infrastructures is the intelligent monitoring of the voltage stability condition of the power systems under a continuously changing loading condition. Thus, in this study, the intelligent monitoring of VSM for the effective control of voltage stability conditions is viewed as an essential tool for real-life and complex power system infrastructure management. Thus, hybridized ANFIS-based intelligent predictive models are implemented for measuring the VSM of power systems based on the concept of a critical boundary index (CBI). Credible information on vital power system parameters for ANFIS training and validation is determined from the line and bus parameters and the load flow analysis solution. The developed ANFIS and PSO-ANFIS models for VSM prediction are tested on the standard IEEE 30-bus and the Nigerian 28-bus networks. Their relative performances are evaluated and compared using adequate statistical analysis.
This work aimed to establish the idea of the critical boundary index (CBI) as a veritable tool for the direct estimation of VSM and using machine learning techniques (ANFIS and its hybrid with PSO) to verify CBI’s capacity for different loading conditions. Specifically, this work adopted ANFIS and its hybridization with PSO to monitor the power systems’ adequate voltage stability margin under different loading conditions. Generally, the first step to voltage collapse mitigation is to achieve efficient estimations of the power system’s closeness to the voltage stability limit; and this can be achieved using veritable machine learning approaches. However, the main challenge in implementing machine learning algorithms is the optimal tuning of the training parameters; thus, the PSO algorithm is combined with the ANFIS in this study to improve the training performance of the predictive analysis. The remaining contents of this paper are structured as follows: Section 2 gives an overview of the application of AI and machine learning to voltage stability analysis; Section 3 discusses the conceptualization of the mathematical models and methods adopted for this study. The simulation results are presented and discussed in Section 4, and the conclusion is presented in Section 5.

2. Artificial Intelligence/Machine Learning Approaches to Voltage Stability Analysis

Voltage stability problems are highly dynamic; however, the evaluation of voltage stability conditions of power systems can be approximated using steady-state analysis with different voltage stability indices (VSIs). Some of the notable VSIs are as; P–V and Q–V curves, line stability index (Lmn), fast voltage stability index (FVSI), voltage collapse prediction index (VCPI), novel line stability index (NLSI), line stability factor (LQP), L-index, etc., [7]. However, steady-state VSIs are approximated and relatively time-consuming; thus, they are often unreliable for the accurate and precise determination of the voltage stability condition of power systems [4]. One of the prominent attributes of AI models is the ability to work through data and establish a precise pattern for producing reliable output information within the shortest possible time. Thus, a number of research studies have applied AI vis-à-vis machine learning and deep learning techniques for voltage stability analysis, and for the efficient implementation of AI-based voltage stability analysis, the structure of the input data matters significantly. Some existing works on machine learning applications to voltage stability analysis are discussed below.

2.1. Artificial Neural Network (ANN) for Voltage Stability Margin Estimation

In reference [16], a multilayer feedforward ANN model for VSM estimation was developed using the error backpropagation learning algorithm. The power system loading conditions and the corresponding voltage stability margin were correlated using sensitivity for performance analysis. ANN models are deployed for verifying the voltage stability condition with different VSIs using the pre-estimated results from Newton Rapson load flow analysis for training an ANN model in [17,18]. In [19], a three-layer feedforward neural network was trained with calculated VSI values for detecting applicable VSM limits for power systems susceptible to voltage collapse. Online ANN models in real-time are developed for voltage stability margin estimation, adopting the data augmentation method and supervised learning based on node voltage magnitudes, and the phase angle information was presented [20,21,22,23]. For effective implementation, especially for complex multi-area power networks, handling the training data is very significant. Thus, the authors in [24] proposed an ANN model for VSI estimation that was implemented based on network data reduction and exploring the adaptive training capabilities of ANNs. The authors in [25] discussed the real-time voltage stability monitoring technique that considers the VSM as the nearest power system loading distance before the occurrence of voltage collapse. Short-term voltage stability assessment using the machine learning and deep learning techniques requires a sufficient amount of the dataset. The authors in [26] adopted a novel data technique referred to as the conditional least squares generative adversarial network (LSGAN)-based data augmentation to artificially generate a sufficient amount of required data set for the implementation of the predictive analytic model. The approach was found to be efficient for proliferating the representative and diversified training datasets while preserving the data label.
Due to the complexities of the considered procedure, which involves a continuously loading condition, researchers often deploy the orthogonalization process based on sensitivity analysis for the input data set to achieve adequate feature reduction. Another notable adaptation of AI vis-à-vis ANN and other hybridization of ML and deep learning techniques for voltage stability analysis are reported in the following literature: PSO-based recurrent neural network (PSO-RNN) [27], Salp swarm algorithm-tuned ANN (SSA-ANN) [28], ANN and Ward-type equivalent approach [29], self-organizing Kohonen-neural network (SKNN) [30], parallel self-organizing hierarchical neural network with static VAR compensator (SHNN-SVC) [31], self-organizing feature map with radial basis function (SOFM-RBF) [32], extreme learning machine (ELM) [33,34], hybrid kernel extreme learning machine approach [35], deep recurrent neural network [36], genetic algorithm-based support vector machine (GA-SVM) [37], weighted least square support vector machine (WLS-SVM) [38,39], particle swarm optimization-based support vector machine (PSO-SVM) [40], dragonfly optimization algorithm and support vector regression (DFO–SVR) [41], random forest algorithms [42,43,44,45], deep learning, and convolution neural networks [26,46,47] and more. The authors in [48] developed a deep learning model for short-term voltage stability (STVS) assessment in real-time using a long short-term memory (LSTM) model based on the understanding of the latent temporal dependencies of power systems’ behavior on the post-disturbance system dynamics. The authors deployed a semi-supervised cluster algorithm for label classification for different STVS instances in order to obtain relevant quantitative criteria.

2.2. Fuzzy Expert System and ANFIS for Voltage Stability Margin Estimation

One of the robust ML techniques rapidly gaining research attention in recent times is the fuzzy inference system (FIS). The FIS involves adopting the concept of fuzzy logic and ANN for the nonlinear mapping of a given set of input information to meet the appropriate output data [49]. A prominent member of the fuzzy expert systems family that was found to be easily adaptable toward solving several power systems-related issues is the adaptive neuro-fuzzy inference system (ANFIS) [50]. The adaptive neuro-fuzzy inference system (ANFIS) is an FL expert system that has been augmented with the learning abilities of ANN for supervised learning [51]. It has become one of the vital faces of contemporary data analytics and predictive systems [52]. ANFIS was used several times for predicting power systems parameters and determining the specific operating conditions of power systems. The ANFIS model based on association rules and trained by the Harris hawks optimization algorithm for monitoring effective VSM of a power system was developed in [53]. The capacity of the proposed hybrid ANFIS model for VSM assessment is explored in three essential parts: feature selection, model training, and data estimation. In [54], a fusion of support vector regression (SVR) and ANFIS models was developed for online voltage stability assessment based on synchronized phasor measurements. The SVR-ANFIS parameters are optimally tuned using the ant lion optimizer (ALO) to achieve adequate model training for precise performance.
In [55], the hybridization of the NN using the multi-layer perceptron (MLP) and ANFIS was proposed, developed, and compared for monitoring the power system’s VSM based on the power system’s information from phasor measurement units (PMUs). In the proposed hybrid MLP–MSA and ANFIS–MSA models, the moth swarm algorithm (MSA) algorithm is adopted to optimize the model parameters. The ANFIS model and its hybridized variants are famous for their ability to handle information based on linguistics using fuzzy rules, combined with the capabilities for processing numbers [56]. ANFIS is also known for its clarity in data exploitation with limited operator involvement and its ability to be trained faster with significantly lower computational memory requirements [57]. Thus, studies have been repleted with different real-life engineering applications of ANFIS, ranging from pollution management and environmental sustainability [58,59] and sport prediction [60] to petroleum industry analysis [61], transportation [62], the field of medicine [63], social demography [64], and so on. For power system-related predictive analysis, several ML techniques including ANFIS and its variants have been significantly deployed for the prediction of the closeness of power system networks to voltage collapse. However, as observed from the literature, the input parameters are mostly limited to a few power system parameters such as voltage magnitudes and their phases [41,53,54] etc. Thus, the ANFIS-based voltage stability monitoring prediction model implemented in this study considered six significant power systems analysis parameters and the voltage stability margin is measured using the critical boundary index per unit of the system’s base power. Moreover, the potential of the standalone ANFIS model and its hybridization with particle swarm optimization (PSO) for effective prediction is compared as discussed below.

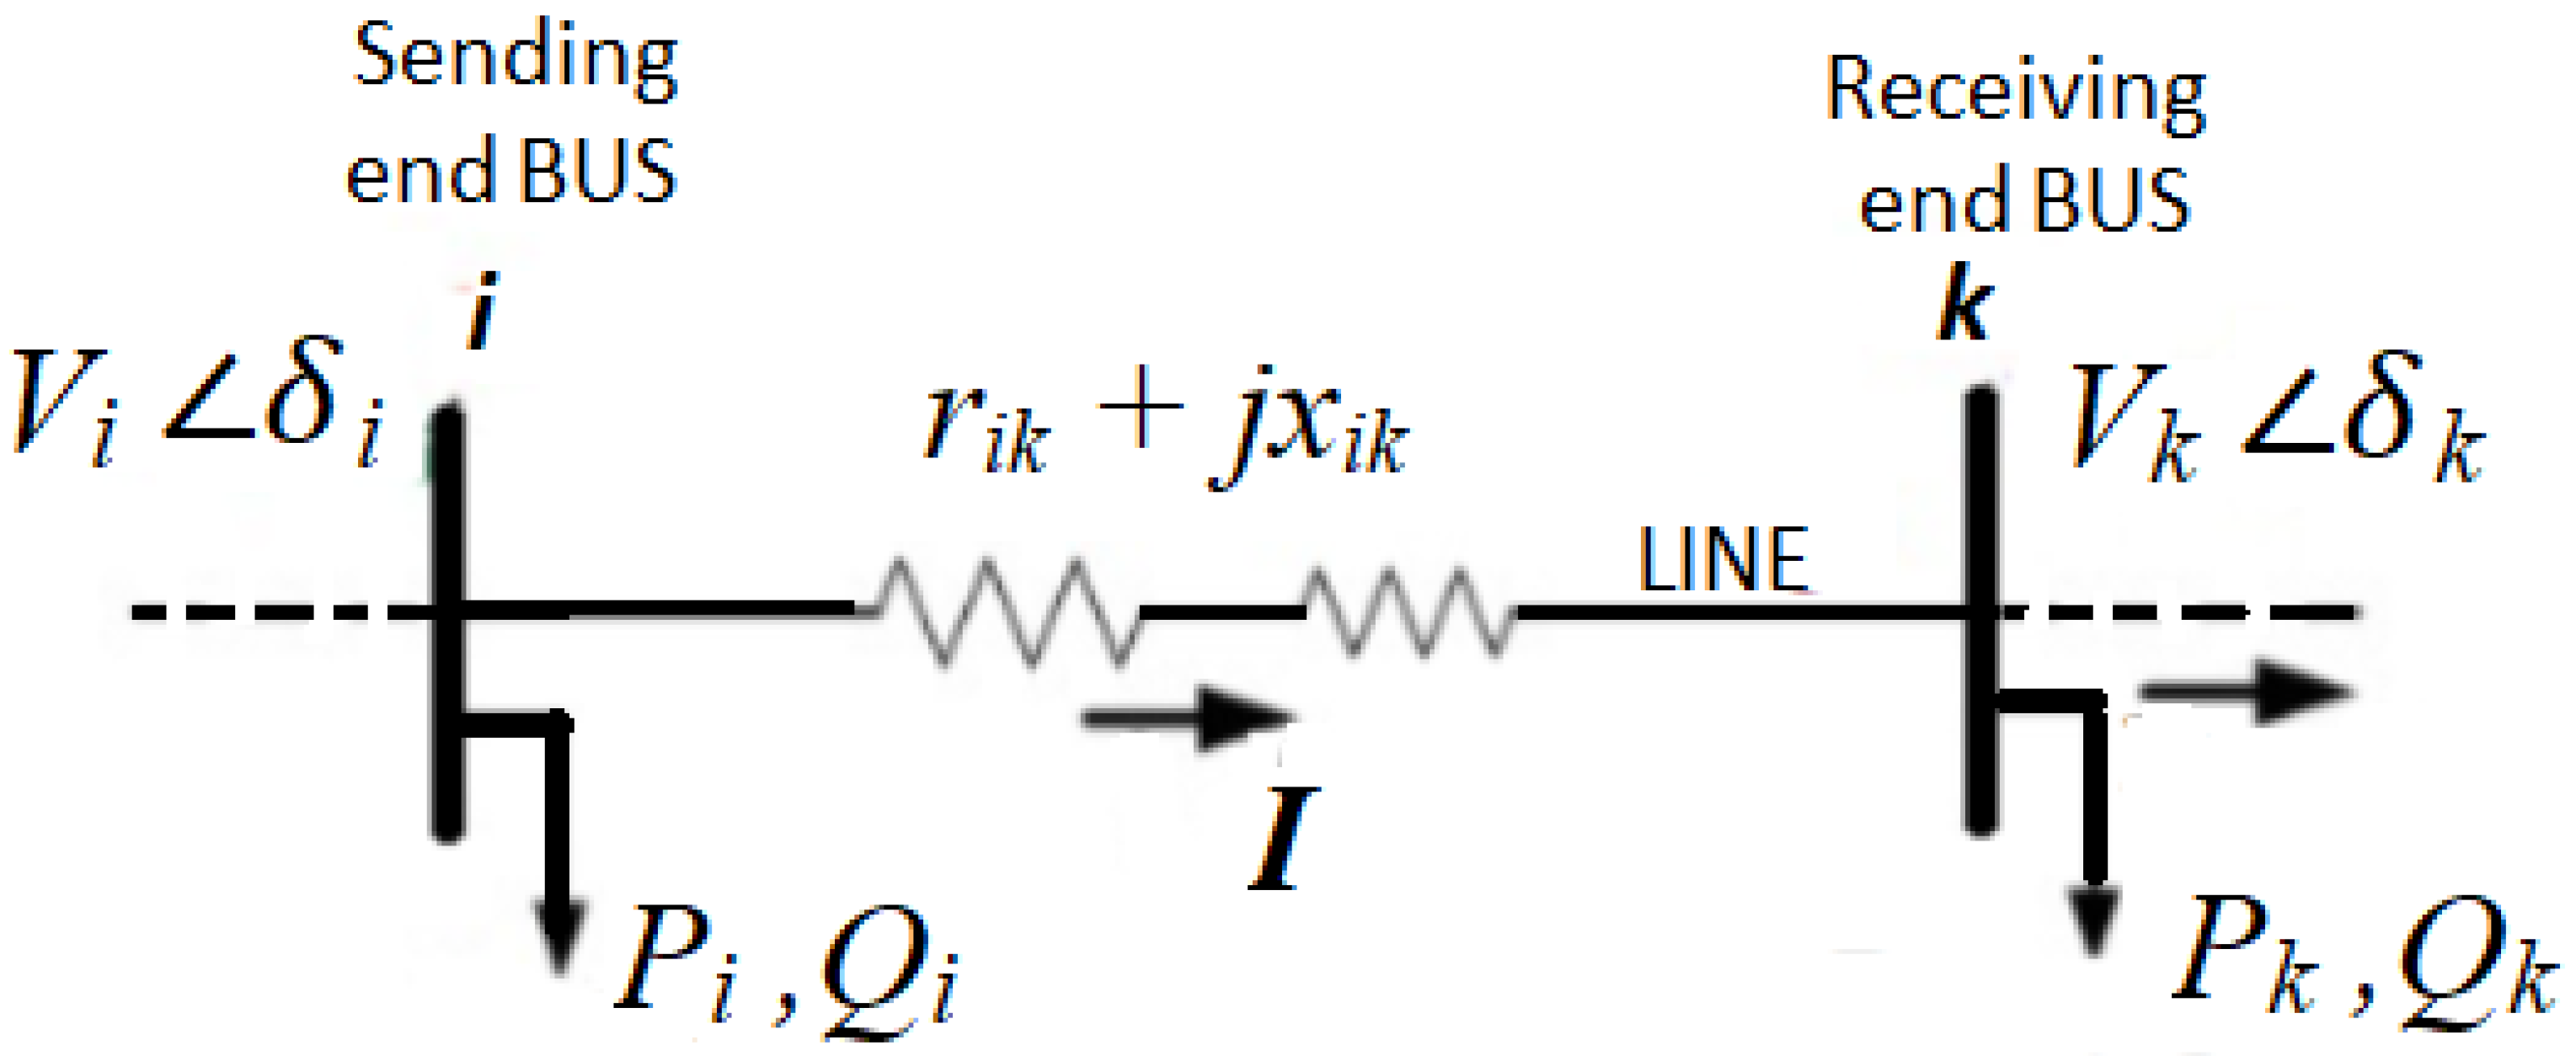
3. Mathematical Modeling

3.1. Voltage Stability Margin (VSM)

For a simple transmission network model shown in Figure 1, i and k indicate the transmission network’s sending and receiving end, P and Q are the active power and reactive power loading at the buses, whilst V and δ are the bus voltage magnitude and angle. The line reactance and resistance are r and x, respectively.
Considering the line flow equations, the power transfer equation at the receiving end of the power system is obtained as given below:
P k + j Q k = ( V k δ k ) V i δ i V k δ k r i k + j x i k *
The above Equation (1) is further resolved, as found in [4,65], to yield the simplified power transfer Equations (2) and (3)) which wholly describes the voltage stability condition of power systems:
P k r i k + x i k Q k + j P k x i k r i k Q k = V i V k cos δ i δ k j V i V k sin δ i δ k V k 2
V k 4 + 2 V k 2 P k r i k + Q k x i k 0.5 V i 2 + P k 2 + Q k 2 r i k 2 + x i k 2 = 0
For the given power system to be within a stable voltage stability operating limit, Equation (3) must have unique positive solutions (stable roots). Thus, the power system is voltage stability-proof when it fulfills the condition described by Equation (4):
P k r i k + Q k x i k 0.5 V i 2 2 + P k 2 + Q k 2 r i k 2 + x i k 2 0
The critical boundary index (CBI) approach for VSM estimation was derived in [4] as an approach for directly approximating the real and reactive power loading distance of a power system network to the point of voltage collapse based on the criticality of the transmission lines. As shown in Figure 2, the stability boundary that describes the maximum real and reactive load that the power system can bear without the occurrence of voltage collapse (i.e., the VSM) is ruled by Equation (4). Consequently, CBI is calculated as the distance between the current operating point, K ( P k , Q k ) , and the critical point C ( X , Y ) located on the stability boundary.
To obtain the solution to the critical operating point C ( X , Y ) , a constrained function (Equation (5) is formed and solved using the Lagrange multiplier approach. The CBI values, obtained from Equation (6), give information about the VSM of the power system in per unit (pu) equivalent of the base MVA power. The susceptibility of the power network to voltage collapse due to transmission line failure is reflected by a low CBI value which indicates poor VSM.
F ( X , Y , λ ) = X P k 2 + Y Q k 2 1 2 λ r i k X + x i k Y 0.5 V i 2 2 + X 2 + Y 2 r i k 2 + x i k 2
C B I = X P k 2 + Y Q k 2 1 2

3.2. ANFIS and PSO-ANFIS Implementation Procedures

The fundamental ANFIS model uses the ’if–then’ probabilistic rules based on either Mamdani-type or Sugeno-type implementation qualitative decision-making purposes with no distinctive quantitative information [66]. The Takagi–Sugeno ANFIS model was implemented in this work using the hybrid rule of learning and backpropagation gradient descent with least square methods for pre-processing, and the optimal estimation of output parameters [67]. The five crucial parts of the ANFIS model are fuzzification, multiplication, normalization, de-fuzzification, and the summation final output by summation, as shown in Figure 3 [68]. The clustering technique used in implementing the ANFIS models discussed in this work is the fuzzy ’c-Means’ clustering algorithm using fifteen (15) clusters [69].
The implementation procedure for the ANFIS model is as described: for an ANFIS model with two inputs (x,y) and one output (f), two ‘if–then’ probabilistic rules are defined based on the first-order Takagi–Sugeno model given below:
Rule 1 : if x is A 1 and y is B 1 , then : f 1 = p 1 x + q 1 y + r 1 Rule 2 : if x is A 2 and y is B 2 , then : f 2 = p 2 x + q 2 y + r 2
where x and y are the inputs, A k and B k are the fuzzy sets, f i are the outputs within a fuzzy rule, and p k , q k and r k are the consequent parameters as obtained from the training process.
Layer 1: The fuzzification layer contains square adaptive nodes with fuzzy membership functions described by a set of inference rules as given below:
O k 1 = μ A k ( x ) , k = 1 , 2
O k 1 = μ B k ( y ) , k = 1 , 2
where O k 1 is the membership grade of the fuzzy sets, which specifies the degree of agreement between the input (x,y). The fuzzy sets A k and B k , μ are the Gaussian membership functions that handle the degree of membership and quantify the grade of membership of the element within the fuzzy set.
Layer 2: At the next layer, i.e., the multiplication/product layer, the input values from the fuzzification layer are weighted based on the strength of each membership function and processed according to the pre-specified product rule. The node at this layer is fixed and non-adaptive; all the input values reaching this node are multiplied to determine the output at each node. The output is called the firing strength of a fuzzy rule and is estimated according to the equation below.
O k 2 = w k = μ A k ( x ) · μ B k ( y ) , k = 1 , 2
Layer 3: This layer also consists of fixed and non-adaptive nodes. At this layer, all the calculated firing strengths are normalized by calculating the ratio of the firing strength of each rule to the total firing strength of all rules combined; i.e., the normalized firing strength of the k-th rule is obtained as shown below.
O k 3 = w k ¯ = w k w 1 + w 2 ; k = 1 , 2
Layer 4: This layer is the defuzzification layer, and it consists of adaptive nodes whose results are decoded from the set of inference rules used to code the input in layer 2. At this layer, a nodal first-order polynomial function is obtained by calculating the effect of the k-th rule on the output of the model; this is achieved by finding the product of the normalized firing strengths of the rule obtained from the third layer and expressed as a function of the consequent parameters as illustrated below:
O k 4 = w k ¯ ( p k x + q k y + r k ) = w k ¯ f k , k = 1 , 2
where w k ¯ is the normalized firing strengths of the rule, p k , q k and r k are the consequent parameters, and f i is a function of the output.
Layer 5: the last layer of the ANFIS architecture consists of a single non-adaptive node for summation. At this node, the final output is obtained by summing up all the incoming values from layer 4. After that, all the results of the fuzzy classification processes are translated into appropriate concrete values.
O k 5 = k w k ¯ f k = k w k ¯ f k k w k ¯
In this study, the performance of the ANFIS model implementation was enhanced by modifying the parameters and finetuning the prediction process using the particle swarm optimization (PSO) algorithm. PSO is an evolutionary optimization algorithm that was found to be effective for diverse optimization problems with various levels of intricacies [70]. PSO implementations involve two steps which are the estimation of the modification size/value, which is often called the velocity, and the update of the specific target function, which is referred to as ‘the position’; in this case, ‘the position’ will be the ANFIS parameters. The modification of the particle’s velocity is calculated as:
V i k + 1 = w · V i k + c 1 · r 1 · ( P b e s t i k X i k ) + c 2 · r 2 · ( G b e s t k X i k )
The particle’s position is then updated using the calculated particle’s velocity as given:
X i k + 1 = X i k + V i k + 1
where w is the weighting function, c 1 and c 2 , are the acceleration coefficients, r 1 and r 2 , are random numbers between 0 and 1, V i k and X i k are the current velocity and position of particle i at iteration k, V i k + 1 and X i k + 1 are the modified velocity and position of particle i, P b e s t i k and G b e s t i k are the personal and global bests of particle i. The dynamically changing inertia weight or weighting factor is employed because it guides the exploration and utilization of the search space, and it is expressed as [71].
w = w m a x w m a x w m i n m a x i t × I t
where w m a x and w m i n are the inertia weight’s final and initial values, respectively, I t and m a x i t are current and maximum iteration numbers, respectively, whilst w m a x and w m i n are taken to be 0.4 and 0.9, respectively. The fitness function of the PSO-ANFIS parameters optimization procedure is the minimization of the root mean square error ( R M S E ) which is a measure of the deviation between the target values and the predicted outputs. The simplified illustration for the implementation of the PSO-ANFIS model is shown in Figure 4 and the PSO implementation parameters, as shown in Table 1, are selected considering their previous implementation in the literature [68].

3.3. FIS Model Performance Analysis

Based on the prediction errors, the performance of the developed ANFIS models is evaluated by the application of following performance-based statistical tools [69]:
  • Root mean square error ( R M S E ):
    R M S E = n = 1 N y n y ^ n 2 N
  • Mean absolute percentage error ( M A P E ):
    M A P E = 1 N n = 1 N y n y ^ n y n × 100 %
  • Coefficient of correlation (R):
    R = 1 n = 1 N y n y ^ n 2 i = 1 N y n y ¯ 2
where N is the data length, y n , y ^ n and y ¯ are the calculated VSM values (targets), predicted VSM values (outputs) using the FIS models, and the mean of the calculated VSM values. The values of R M S E and M A P E show the model accuracy regarding the deviation of outputs from the true values (targets). Thus, the lower the values of R M S E and M A P E , the better the performance of the FIS model. Pearson’s correlation shows the agreement of the predicted data with the target using regression analysis, and R should have a value close to 1.0 to indicate the effectiveness of the prediction model.

3.4. PSO-ANFIS Optimization Procedure for CBI Prediction

The primary optimization problem for ANFIS parameter tuning using the PSO algorithm is described below. The considered fitness function is the minimization of the root mean square error (RMSE):
minimize R M S E = n = 1 N y n y ^ n 2 N
The constraints are the load flow and critical boundary conditions as described below:
P k V k k i , i = 1 N b u s V i [ G i k cos δ i k + B i k sin δ i k ] = 0
Q k V k k i , i = 1 N b u s V i [ G i k sin δ i k B i k cos δ i k ] = 0
V k m i n V k V k m a x k ; k N b u s
| S L k | S L k m a x k ; k N b r .
C B I k C B I k l i m . k ; k N b r .
Equation (22) is the stability constraint and S L k m a x is the line flow limit. The stability limits on the power flow along a transmission line can be as low as 20% of the line’s thermal limit [72,73]. Thus:
C B I k l i m = 0.2 × S L k m a x k ; k n t l
where N b r . is the total number of lines/branches and N b u s is the number of buses/nodes.

4. Simulation Procedure and Results’ Discussion

The model development and simulation was performed using Matlab 2022a (student version) on a PC workstation with 64-bit data configuration and Intel(R) Core(TM), i7-8650U processor at an average speed of 1.90GHz (2112 Mhz, 4 core(s), 8 logical processor(s)).

4.1. Description of Case Studies and Data Pre-Processing for ANFIS Model Implementation

Six important operation parameters of power systems are considered as the input data; these are: line resistance r i k , line reactance x i k , active power injected at the receiving bus P k , reactive power injected at the receiving bus Q k , the sending end voltage magnitude V i and the voltage angle δ i k . The target output is the VSM using critical boundary index (CBI) values. The real and reactive powers increase in small steps and from the base loads and the Newton–Raphson (NR)-based load, flow analysis is run for the base loading and each load step while ensuring the tractability (convergence) of the NR power flow solution. The information obtained from the NR load flow analysis are the independent/input parameters P k , Q k , V i , δ i k and the dependent/output parameter CBI, while the line parameters r i k and x i k are directly obtained from the power system line data. Alongside the base load, five additional load levels are generated using a load incremental step of 10% of the base load, i.e., at a base load, and [base load + (10%, 20%, 30%, 40% and 50%)], respectively.
Thus, the total length L d a t a of the data for ANFIS implementation is ( 6 × N b r . ) and the size of the data is ( 6 × N b r . ) by 7 , where N b r . is the number of lines/branches in the network. For the development of the ANFIS-VSI model, 75% of the entire data length is selected the training data and the remaining 25% are considered the testing data. The two test cases considered in this work are the standard IEEE 30-bus system and the Nigerian 28-bus system and the details of both systems are contained in [73]. The IEEE 30-bus system has forty-one (41) transmission lines, N b r . ; thus, the total data length, L d a t a , is 246, out of which 185 of the data length are used for training and the remaining 61 are used for testing the ANFIS model. For the other test case, the Nigerian 28-bus system has fifty-two transmission lines, N b r . ; thus, the total data length, L d a t a , is 312 and 234 of the total data length are used for training while the remaining 78 were deployed for testing the developed ANFIS model. The simple illustration of the considered ANFIS models and the input parameters and output information link is shown in Figure 5.

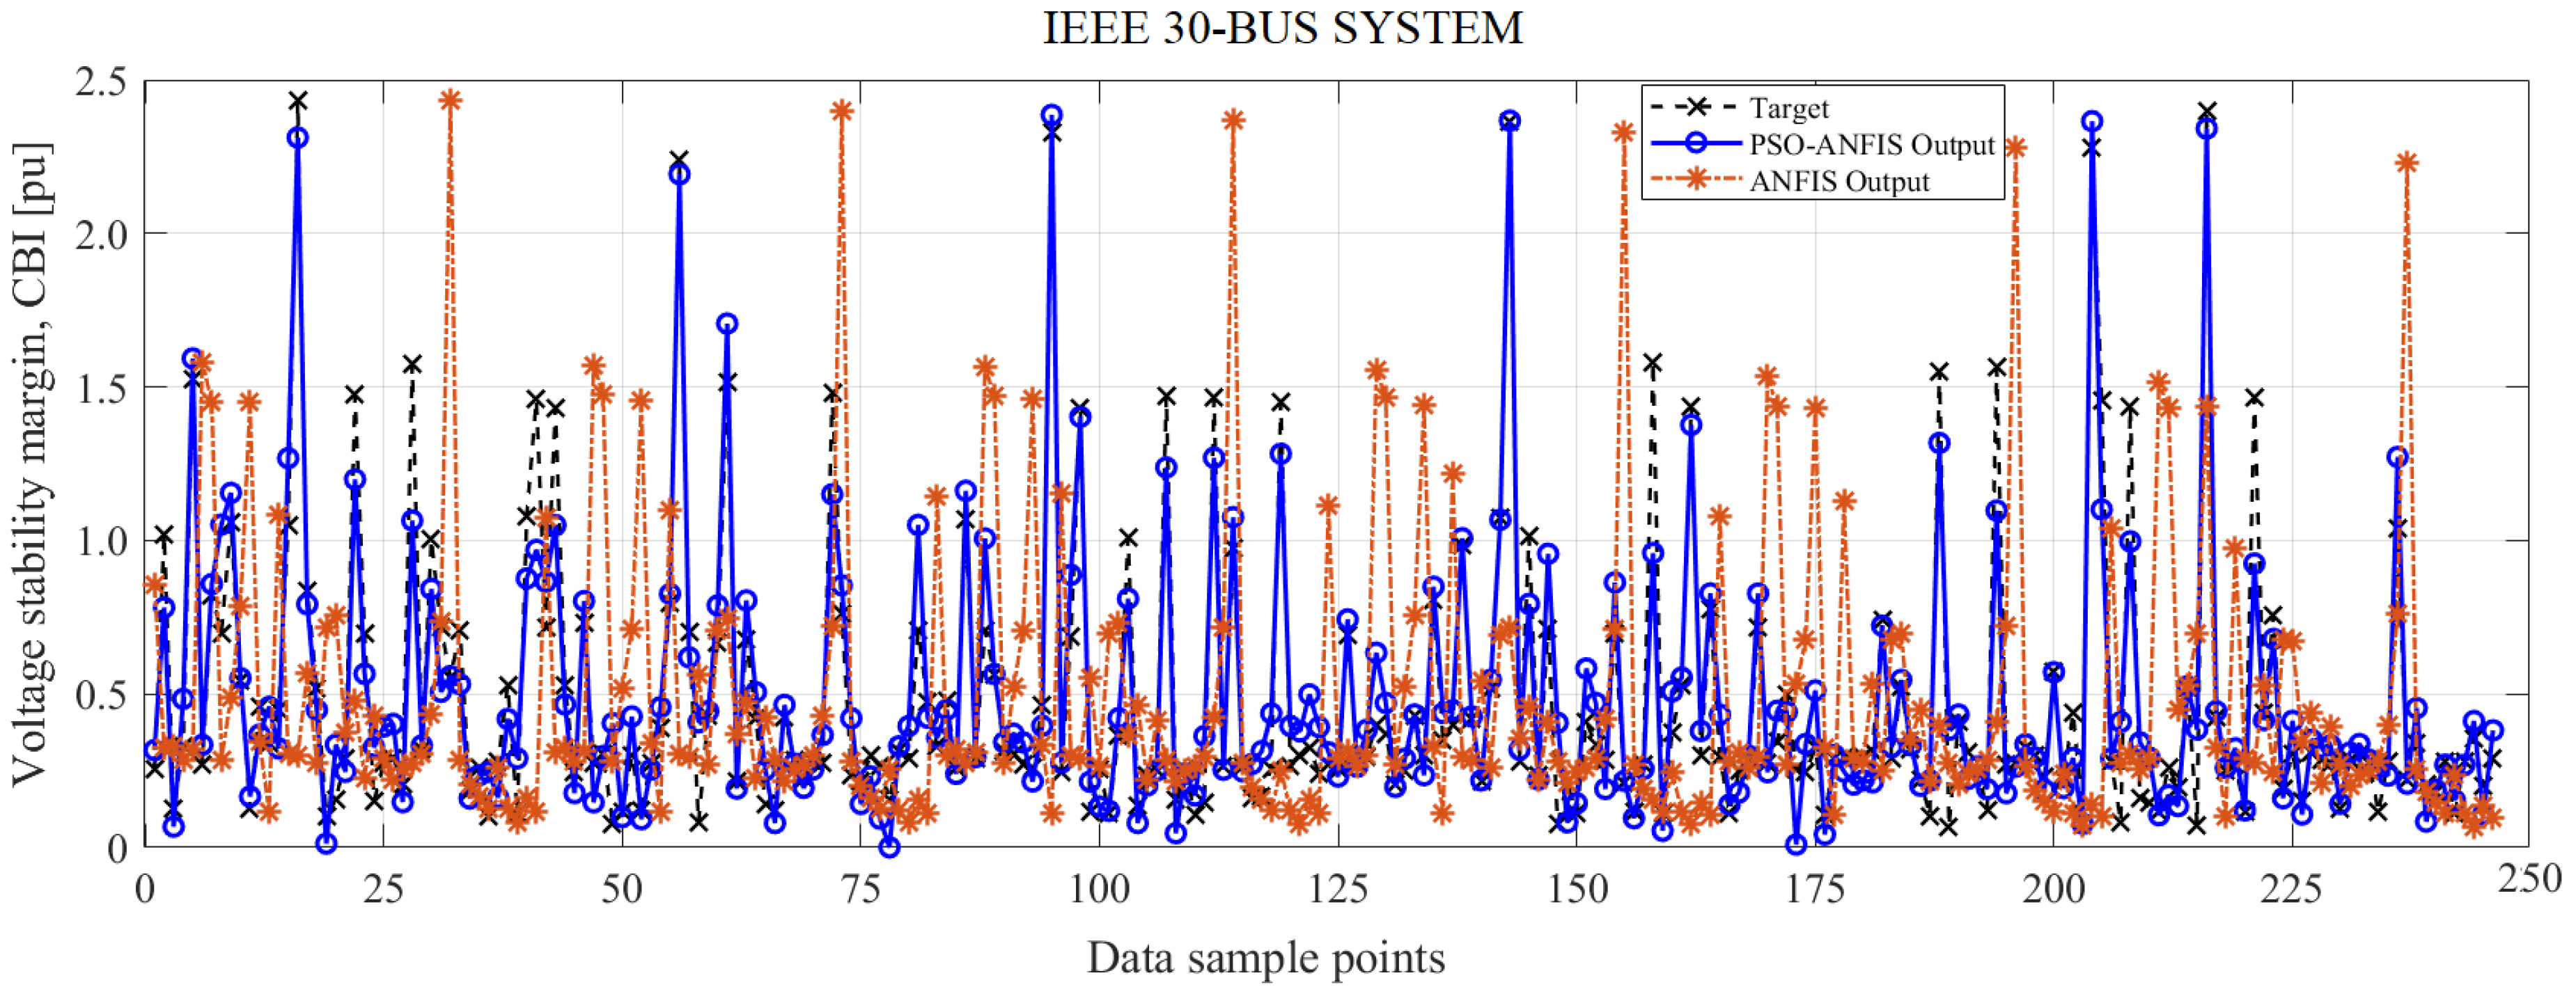
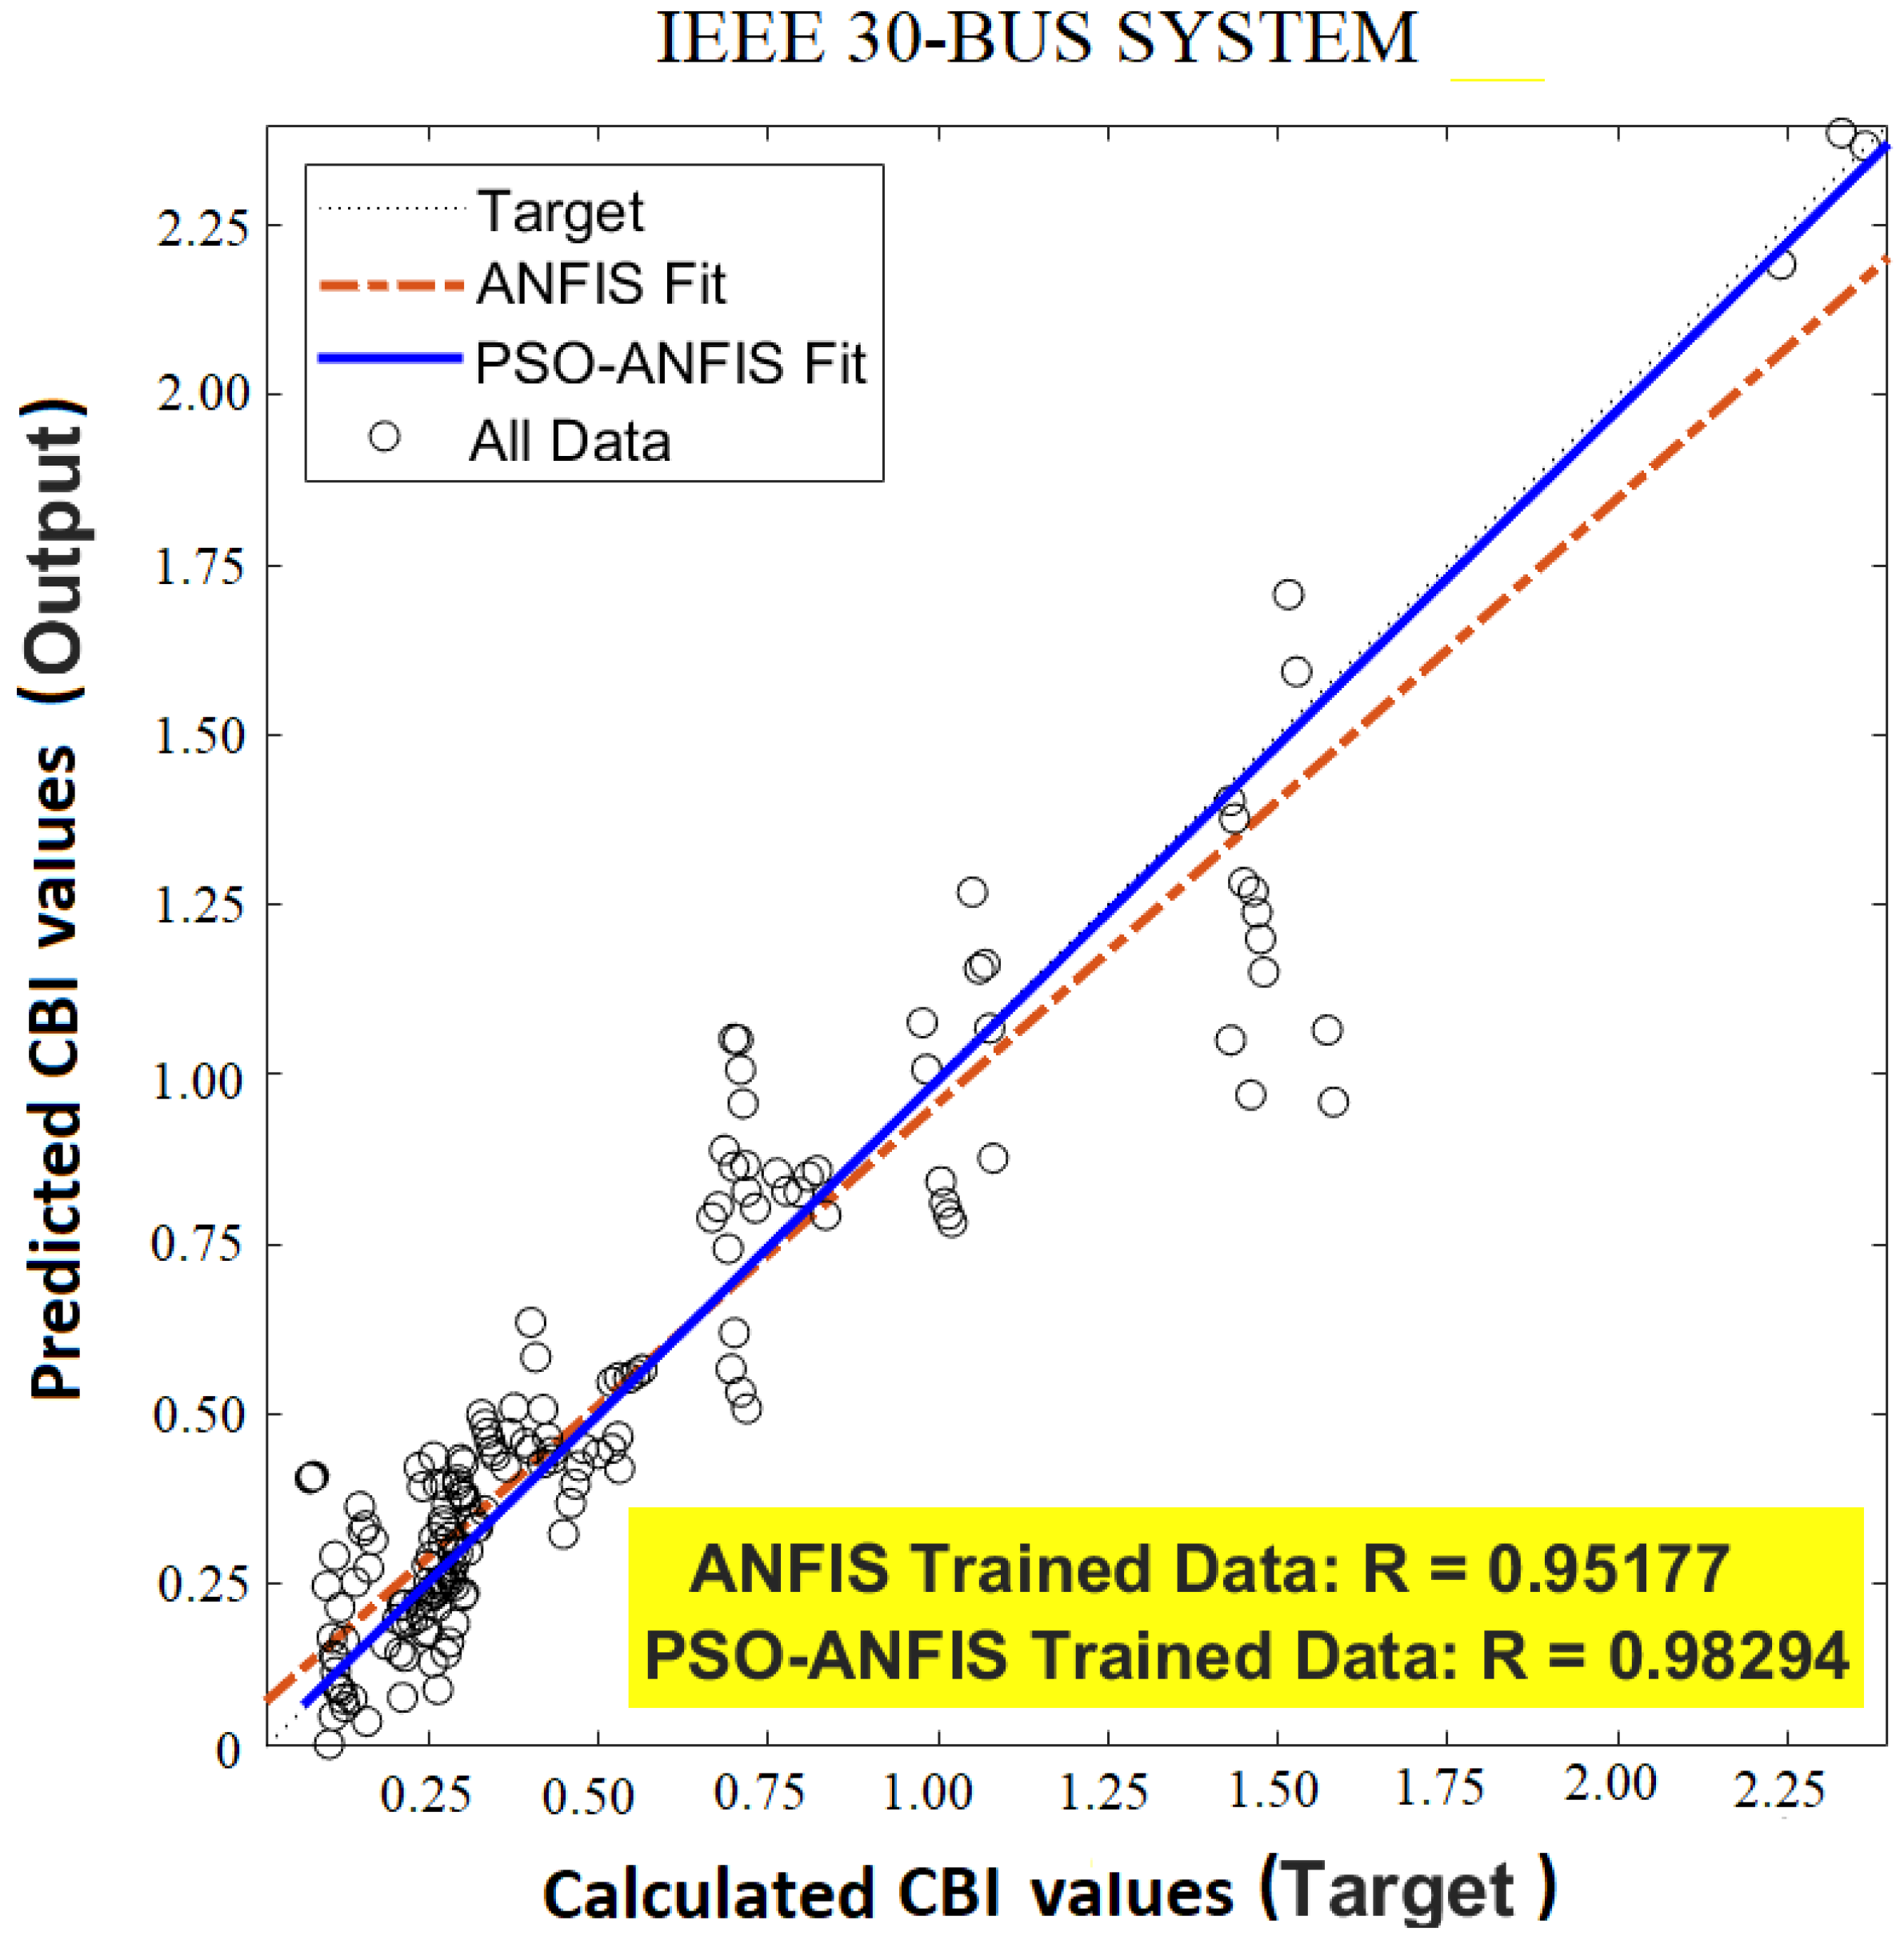
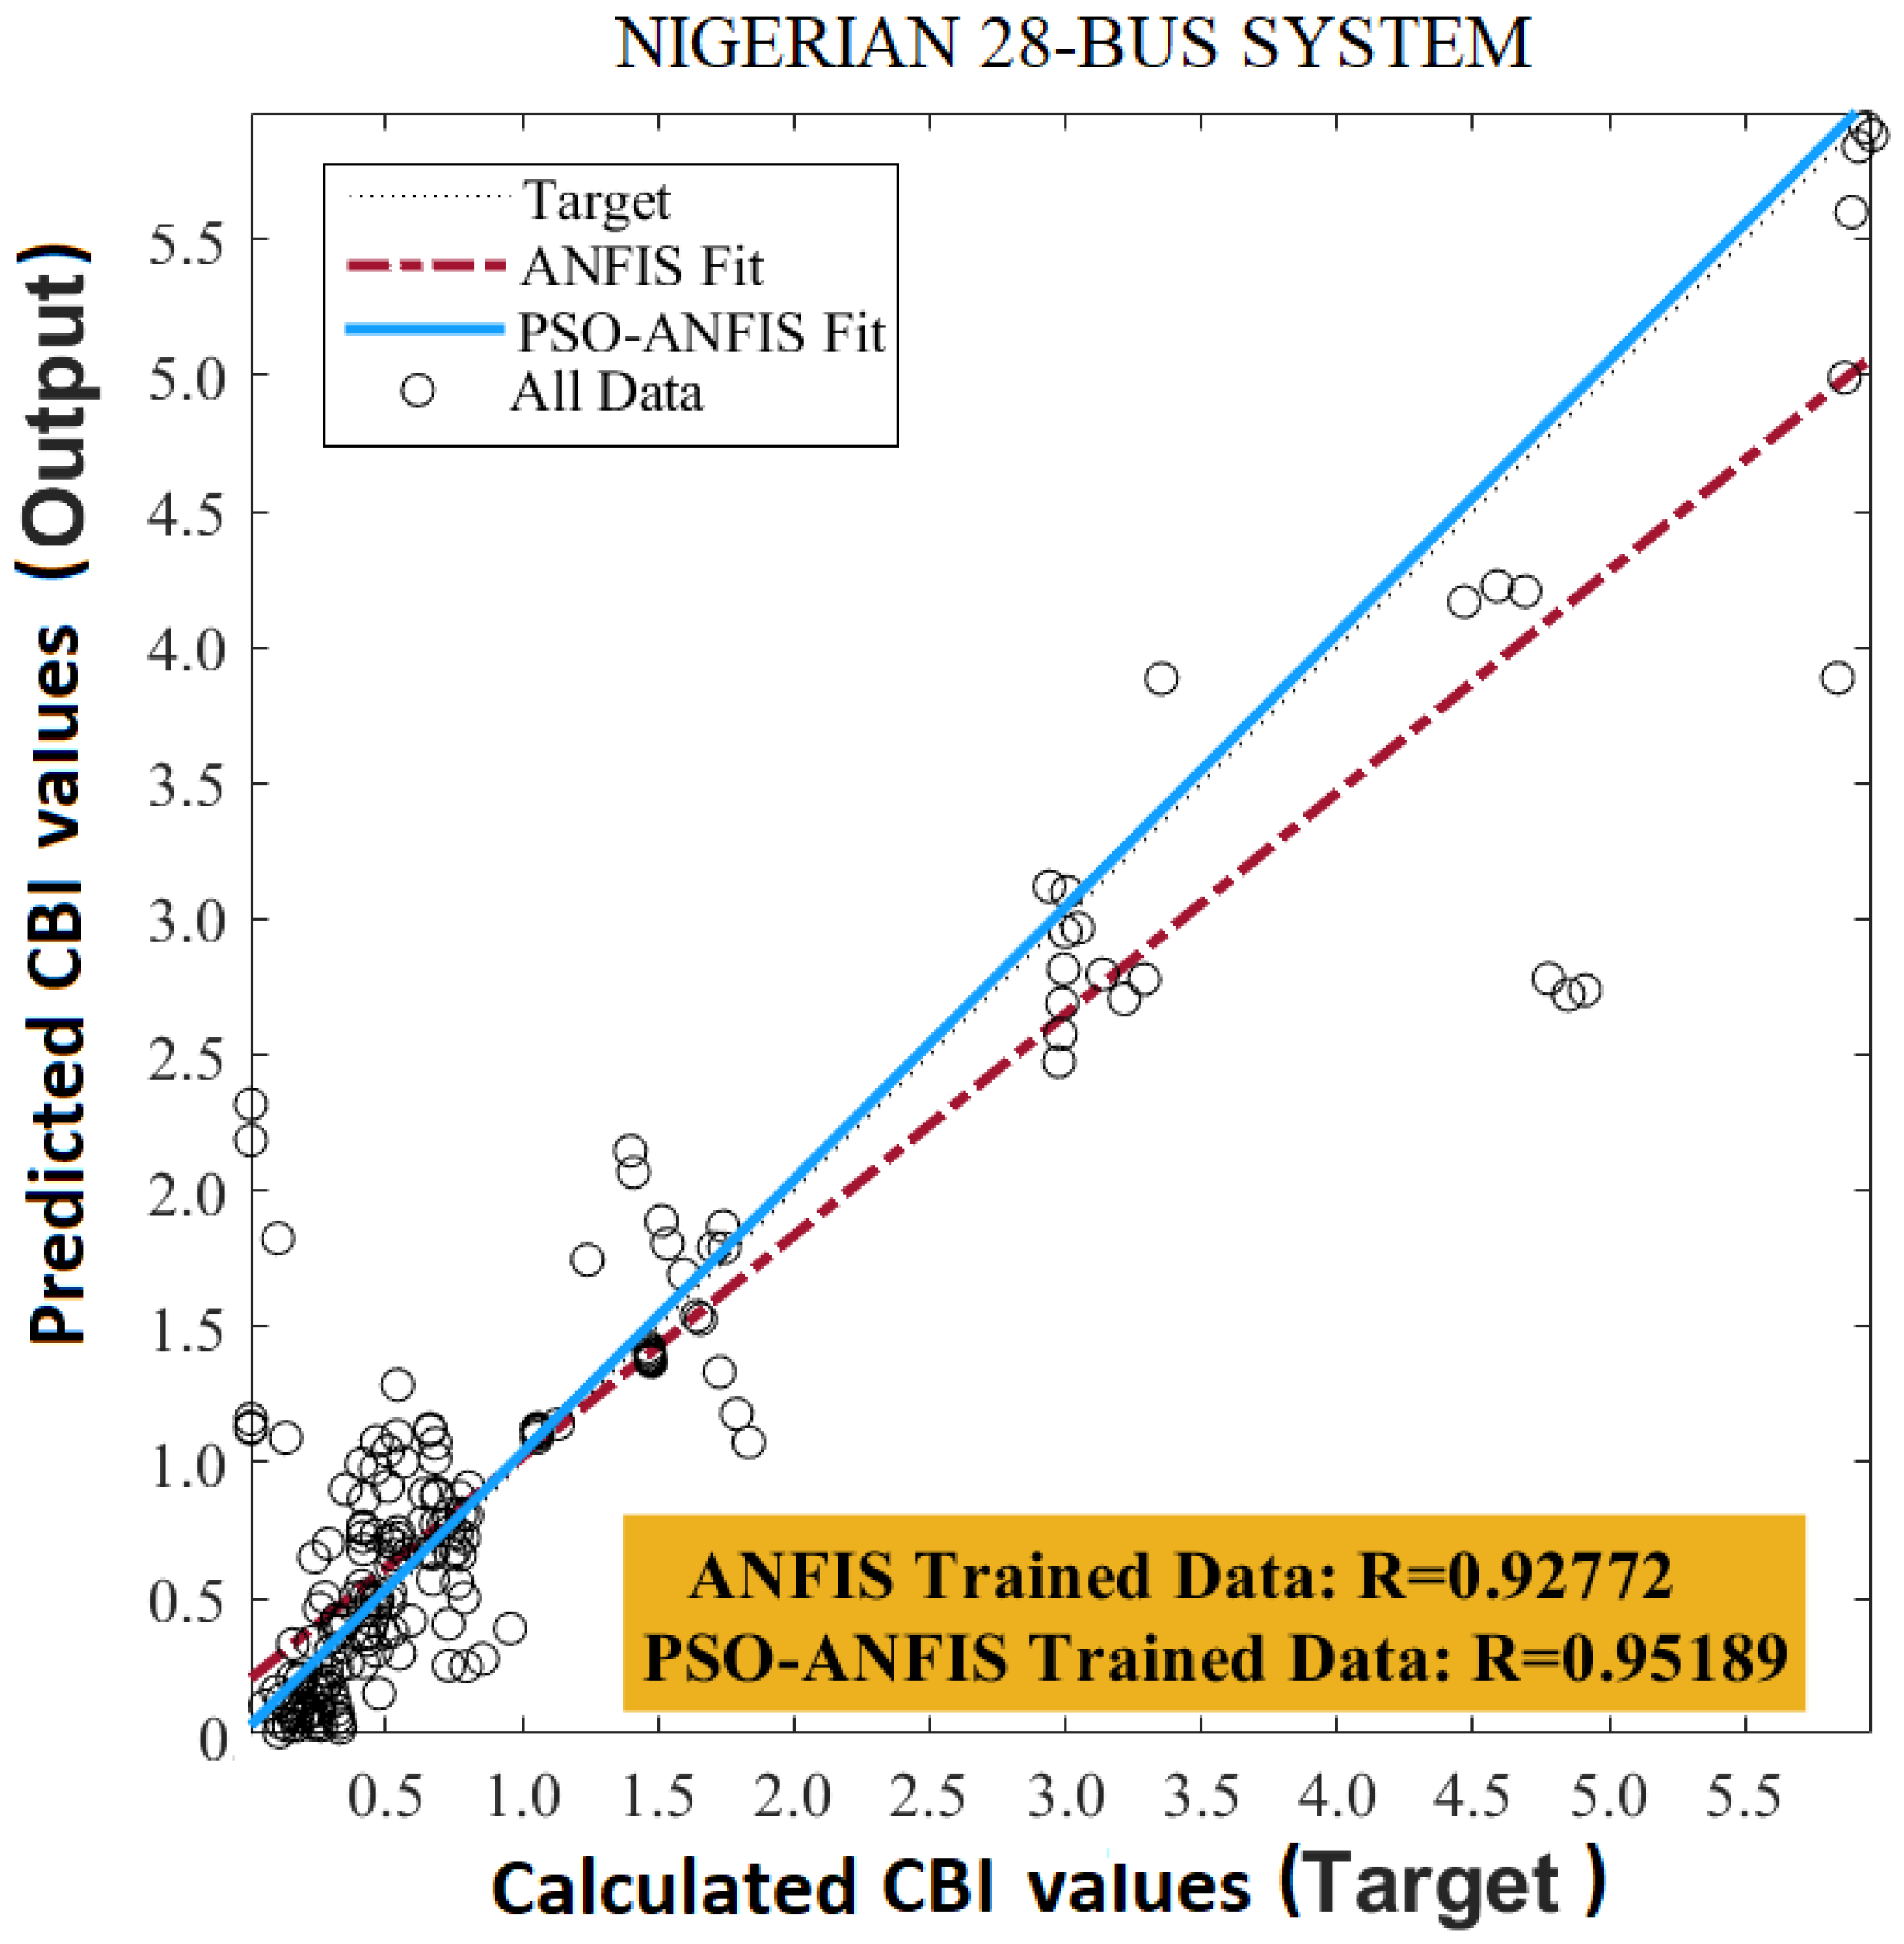
4.2. Discussion of Results

The data plots showing the trend of the predicted CBI values using ANFIS and PSO-ANFIS against the target CBI values and the corresponding regression analysis are presented in Figure 6 and Figure 7 for the standard IEEE 30-bus system, respectively. Moreover, plot of the predicted CBI values versus the target values and the regression analysis for the Nigerian 28-bus system are illustrated in Figure 8 and Figure 9, respectively. Finally, the detailed analysis of the performance of the developed ANFIS models using the statistical error-based analysis and the regression tool for both systems are summarized in Table 2 for a concise comparison and detailed discussion of findings.
Considering the standard IEEE 30-bus system with 41 transmission lines corresponding to 246 data points for six different load levels, with the values of R M S E = 0.1795 and R M S E = 0.5833 for PSO-ANFIS and ANFIS models, respectively, the developed models performed considerably. However, PSO-ANFIS performs better than the ANFIS prediction model in terms of deviation between the expected output and the predicted output as validated by the mean absolute percentage error at M A P E = 5.5876% for PSO-ANFIS against M A P E = 13.6002% for the standalone ANFIS model. The regression analysis using the R values shows that the correlation between the target and the predicted outcomes for both FIS models shows positive results, as indicated by values significantly close to the ideal value, which is R = 1.0. With R = 0.9829 and R = 0.9518, for PSO-ANFIS and ANFIS models, respectively; with the hybrid, PSO-ANFIS performs slightly better. However, the simulation time of 182.5 min for PSO-ANFIS (in 200 iterations) against 24.5 min for standalone ANFIS, which indicates the need to prioritize either accuracy or time when deciding which of the models to deploy for real-time voltage stability condition monitoring.
The Nigerian 28-bus system has 52 transmission lines (branches), corresponding to 312 sampling points considering the six loading conditions. The performance of the developed ANFIS and PSO-ANFIS models for effectively predicting the power systems VSM is observed to be substantially accurate. The two statistical error analysis and the regression analysis allude to the effectiveness of both models, with the hybrid ANFIS model performing comparatively better. The lower estimated value of R M S E = 2.3247 and M A P E = 8.1705% for PSO-ANFIS as against R M S E = 5.5024 and M A P E = 8.1705 for ANFIS shows the superiority of the PSO-ANFIS. The regression analysis shows the R values for both ANFIS models to be within the extremely strong positive correlation range of 0.9 R 1.0; and PSO-ANFIS shows better performance at R = 0.9519 against the ANFIS model with R = 0.9277. The time for PSO-ANFIS implementation is significantly higher than that of PSO due to the optimization process involved in achieving the FIS initial parameters. The computational time can increase with the number of iterations required to achieve the optimal performance of the PSO-ANFIS model.

5. Conclusions

Developing efficient techniques for predicting the voltage instability levels of power systems using artificial intelligence and machine learning is one of the exciting areas of power system research in recent times. Based on the existing works on voltage stability analysis in the steady-state, stability level of power systems mainly depends on some voltage and power injection parameters. Based on these parameters, this study developed and evaluated the performance of the standalone ANFIS model and PSO-ANFIS hybrid model for predicting the voltage stability margin of power systems using the critical boundary index (CBI) approach. Both models are tested on the standard IEEE 30-bus network and the Nigerian 28-bus system using six different load levels. Error-based performance metrics, such as R M S E , M A P E , and R are considered to compare the effectiveness of the ANFIS and PSO-ANFIS variants for VSM monitoring. Consequently, the performance of the PSO-ANFIS model is found to be superior in terms of the percentage reduction in prediction error and the results obtained from the regression analysis. Finally, the performance of the PSO-ANFIS model in terms of simulation time and memory consumption can be enhanced using supercomputer workstations and parallel computing techniques, which opens this work to further research.

Author Contributions

O.B.A.—conceptualization, resource, modeling and writing; K.A.F.—proofreading and supervision; D.T.O.O.—resource and proofreading; E.I.O.—resource and validation. All authors have read and agreed to the published version of this manuscript.

Funding

This research received no external funding.

Institutional Review Board Statement

Not applicable.

Informed Consent Statement

Not applicable.

Data Availability Statement

The main data used for this work are the bus and line parameters for the standard IEEE 30-bus and the Nigerian 28-bus networks [73].

Acknowledgments

Special thanks to M. Furukakoi for providing the Matlab files for voltage stability analysis and P. Adedeji for providing the Matlab files for the PSO-ANFIS model.

Conflicts of Interest

The authors declare no conflict of interest.

References

  1. Adhikari, A.; Naetiladdanon, S.; Sagswang, A.; Gurung, S. Comparison of Voltage Stability Assessment using Different Machine Learning Algorithms. In Proceedings of the 2020 IEEE 4th Conference on Energy Internet and Energy System Integration (EI2), Wuhan, China, 30 October–1 November 2020; pp. 2023–2026. [Google Scholar]
  2. Cutsem, T.V.; Vournas, C. Voltage Stability of Electric Power Systems, 3rd ed.; Kluver: Norwell, MA, USA, 2003. [Google Scholar]
  3. Canizares, C.A.; De Souza, A.C.; Quintana, V.H. Comparison of performance indices for detection of proximity to voltage collapse. IEEE Trans. Power Syst. 1996, 11, 1441–1450. [Google Scholar] [CrossRef] [Green Version]
  4. Furukakoi, M.; Adewuyi, O.B.; Danish, M.S.S.; Howlader, A.M.; Senjyu, T.; Funabashi, T. Critical Boundary Index (CBI) based on active and reactive power deviations. Int. J. Electr. Power Energy Syst. 2018, 100, 50–57. [Google Scholar] [CrossRef]
  5. Dobson, I.; Lu, L. New methods for computing a closest saddle node bifurcation and worst case load power margin for voltage collapse. IEEE Trans. Power Syst. 1993, 8, 905–913. [Google Scholar] [CrossRef] [Green Version]
  6. Taylor, C.W. Power System Voltage Stability, 1st ed.; McGraw-Hill: Palo Alto, CA, USA, 1994. [Google Scholar]
  7. Danish, M.S.S.; Senjyu, T.; Danish, S.M.S.; Sabory, N.R.; Mandal, P. A recap of voltage stability indices in the past three decades. Energies 2019, 12, 1544. [Google Scholar] [CrossRef] [Green Version]
  8. Kumar, R.; Mittal, A.; Sharma, N.; Duggal, I.V.; Kumar, A. PV and QV curve analysis using series and shunt compensation. In Proceedings of the 2020 IEEE 9th Power India International Conference (PIICON), Murthal, India, 28 February–1 March 2020; pp. 1–6. [Google Scholar]
  9. Adewuyi, O.B.; Adeagbo, A.P.; Adebayo, I.G.; Howlader, H.O.R.; Sun, Y. Modified analytical approach for PV-DGs integration into a radial distribution network considering loss sensitivity and voltage stability. Energies 2021, 14, 7775. [Google Scholar] [CrossRef]
  10. Laplante, P.; Milojicic, D.; Serebryakov, S.; Bennett, D. Artificial intelligence and critical systems: From hype to reality. Computer 2020, 53, 45–52. [Google Scholar] [CrossRef]
  11. Sarker, I.H. Ai-based modeling: Techniques, applications and research issues towards automation, intelligent and smart systems. SN Comput. Sci. 2022, 3, 1–20. [Google Scholar] [CrossRef]
  12. Monti, A.; Ponci, F. Electric power systems. In Intelligent Monitoring, Control, and Security of Critical Infrastructure Systems, 1st ed.; Kyriakides, E., Polycarpou, M., Eds.; Springer: Berlin/Heidelberg, Germany, 2015. [Google Scholar]
  13. Laughton, M. Artificial intelligence techniques in power systems. In Proceedings of the IEE Colloquium on Artificial Intelligence Techniques in Power Systems (Digest No: 1997/354), London, UK, 3 November 1997; p. 1. [Google Scholar]
  14. Ongsakul, W.; Dieu, V.N. Artificial Intelligence in Power System Optimization; CRC Press: Boca Raton, FL, USA, 2013. [Google Scholar]
  15. Yousuf, H.; Zainal, A.Y.; Alshurideh, M.; Salloum, S.A. Artificial intelligence models in power system analysis. In Artificial Intelligence for Sustainable Development: Theory, Practice and Future Applications; Springer: Berlin/Heidelberg, Germany, 2021; pp. 231–242. [Google Scholar]
  16. El-Keib, A.; Ma, X. Application of artificial neural networks in voltage stability assessment. IEEE Trans. Power Syst. 1995, 10, 1890–1896. [Google Scholar] [CrossRef]
  17. Rahi, O.; Yadav, A.K.; Malik, H.; Azeem, A.; Kr, B. Power system voltage stability assessment through artificial neural network. Procedia Eng. 2012, 30, 53–60. [Google Scholar] [CrossRef] [Green Version]
  18. Singh, P.; Parida, S.; Chauhan, B.; Choudhary, N. Online Voltage Stability Assessment Using Artificial Neural Network considering Voltage stability indices. In Proceedings of the 2020 21st National Power Systems Conference (NPSC), Gandhinagar, India, 17–19 December 2020; pp. 1–5. [Google Scholar]
  19. La Scala, M.; Trovato, M.; Torelli, F. A neural network-based method for voltage security monitoring. IEEE Trans. Power Syst. 1996, 11, 1332–1341. [Google Scholar] [CrossRef]
  20. Nakawiro, W.; Erlich, I. Online voltage stability monitoring using artificial neural network. In Proceedings of the 2008 Third International Conference on Electric Utility Deregulation and Restructuring and Power Technologies, Nanjing, China, 6–9 April 2008; pp. 941–947. [Google Scholar]
  21. Popović, D.; Kukolj, D.; Kulić, F. Monitoring and assessment of voltage stability margins using artificial neural networks with a reduced input set. IEE Proc.-Gener. Transm. Distrib. 1998, 145, 355–362. [Google Scholar] [CrossRef]
  22. Goh, H.; Chua, Q.; Lee, S.; Kok, B.; Goh, K.; Teo, K. Evaluation for voltage stability indices in power system using artificial neural network. Procedia Eng. 2015, 118, 1127–1136. [Google Scholar] [CrossRef] [Green Version]
  23. Jayasankar, V.; Kamaraj, N.; Vanaja, N. Estimation of voltage stability index for power system employing artificial neural network technique and TCSC placement. Neurocomputing 2010, 73, 3005–3011. [Google Scholar] [CrossRef]
  24. Ashraf, S.M.; Gupta, A.; Choudhary, D.K.; Chakrabarti, S. Voltage stability monitoring of power systems using reduced network and artificial neural network. Int. J. Electr. Power Energy Syst. 2017, 87, 43–51. [Google Scholar] [CrossRef]
  25. Bahmanyar, A.; Karami, A. Power system voltage stability monitoring using artificial neural networks with a reduced set of inputs. Int. J. Electr. Power Energy Syst. 2014, 58, 246–256. [Google Scholar] [CrossRef]
  26. Li, S.; Ajjarapu, V. Real-time monitoring of long-term voltage stability via convolutional neural network. In Proceedings of the 2017 IEEE Power & Energy Society General Meeting, Chicago, IL, USA, 16–20 July 2017; pp. 1–5. [Google Scholar]
  27. Ibrahim, A.M.; El-Amary, N.H. Particle Swarm Optimization trained recurrent neural network for voltage instability prediction. J. Electr. Syst. Inf. Technol. 2018, 5, 216–228. [Google Scholar] [CrossRef]
  28. Rao, A.N.; Vijayapriya, P. A robust neural network model for monitoring online voltage stability. Int. J. Comput. Appl. 2019, 1–10. [Google Scholar] [CrossRef]
  29. Fu, Y.; Chung, T. A hybrid artificial neural network (ANN) and Ward equivalent approach for on-line power system voltage security assessment. Electr. Power Syst. Res. 2000, 53, 165–171. [Google Scholar] [CrossRef]
  30. Handschin, E.; Kuhlmann, D.; Rehtanz, C. Visualization and analysis of voltage stability using self-organizing neural networks. In Proceedings of the International Conference on Artificial Neural Networks, Lausanne, Switzerland, 8–10 October 1997; pp. 1113–1118. [Google Scholar]
  31. Modi, P.; Singh, S.P.; Sharma, J. Loadability margin calculation of power system with SVC using artificial neural network. Eng. Appl. Artif. Intell. 2005, 18, 695–703. [Google Scholar] [CrossRef]
  32. Chakraborty, K.; De, A.; Chakrabarti, A. Voltage stability assessment in power network using self organizing feature map and radial basis function. Comput. Electr. Eng. 2012, 38, 819–826. [Google Scholar] [CrossRef]
  33. Duraipandy, P.; Devaraj, D. Extreme learning machine approach for on-line voltage stability assessment. In Proceedings of the International Conference on Swarm, Evolutionary, and Memetic Computing, Chennai, India, 19–21 December 2013; pp. 397–405. [Google Scholar]
  34. Suganyadevi, M.; Babulal, C. Online voltage stability assessment of power system by comparing voltage stability indices and extreme learning machine. In Proceedings of the International Conference on Swarm, Evolutionary, and Memetic Computing, Chennai, India, 19–21 December 2013; pp. 710–724. [Google Scholar]
  35. Villa-Acevedo, W.M.; López-Lezama, J.M.; Colomé, D.G. Voltage stability margin index estimation using a hybrid kernel extreme learning machine approach. Energies 2020, 13, 857. [Google Scholar] [CrossRef] [Green Version]
  36. Hagmar, H.; Tong, L.; Eriksson, R.; Le Anh, T. Voltage instability prediction using a deep recurrent neural network. IEEE Trans. Power Syst. 2020, 36, 17–27. [Google Scholar] [CrossRef]
  37. Sajan, K.; Kumar, V.; Tyagi, B. Genetic algorithm based support vector machine for on-line voltage stability monitoring. Int. J. Electr. Power Energy Syst. 2015, 73, 200–208. [Google Scholar] [CrossRef]
  38. Poursaeed, A.H.; Namdari, F. Real-time voltage stability monitoring using weighted least square support vector machine considering overcurrent protection. Int. J. Electr. Power Energy Syst. 2022, 136, 107690. [Google Scholar] [CrossRef]
  39. Duraipandy, P.; Devaraj, D. On-line voltage stability assessment using least squares support vector machine with reduced input features. In Proceedings of the 2014 International Conference on Control, Instrumentation, Communication and Computational Technologies (ICCICCT), Kanyakumari, India, 10–11 July 2014; pp. 1070–1074. [Google Scholar]
  40. Naganathan, G.; Babulal, C. Optimization of support vector machine parameters for voltage stability margin assessment in the deregulated power system. Soft Comput. 2019, 23, 10495–10507. [Google Scholar] [CrossRef]
  41. Amroune, M.; Bouktir, T.; Musirin, I. Power system voltage stability assessment using a hybrid approach combining dragonfly optimization algorithm and support vector regression. Arab. J. Sci. Eng. 2018, 43, 3023–3036. [Google Scholar] [CrossRef]
  42. Dharmapala, K.D.; Rajapakse, A.; Narendra, K.; Zhang, Y. Machine learning based real-time monitoring of long-term voltage stability using voltage stability indices. IEEE Access 2020, 8, 222544–222555. [Google Scholar] [CrossRef]
  43. Liu, S.; Shi, R.; Huang, Y.; Li, X.; Li, Z.; Wang, L.; Mao, D.; Liu, L.; Liao, S.; Zhang, M.; et al. A data-driven and data-based framework for online voltage stability assessment using partial mutual information and iterated random forest. Energies 2021, 14, 715. [Google Scholar] [CrossRef]
  44. Pinzón, J.D.; Colomé, D.G. Real-time multi-state classification of short-term voltage stability based on multivariate time series machine learning. Int. J. Electr. Power Energy Syst. 2019, 108, 402–414. [Google Scholar] [CrossRef]
  45. Su, H.Y.; Lin, Y.J.; Chu, C.C. Applications of Decision Tree and Random Forest Methods for Real-Time Voltage Stability Assessment Using Wide Area Measurements. In Wide Area Power Systems Stability, Protection, and Security; Springer: Berlin/Heidelberg, Germany, 2021; pp. 373–391. [Google Scholar]
  46. Wu, T.; Zhang, Y.J.A.; Wen, H. Voltage stability monitoring based on disagreement-based deep learning in a time-varying environment. IEEE Trans. Power Syst. 2020, 36, 28–38. [Google Scholar] [CrossRef]
  47. Li, Y.; Zhang, M.; Chen, C. A deep-learning intelligent system incorporating data augmentation for short-term voltage stability assessment of power systems. Appl. Energy 2022, 308, 118347. [Google Scholar] [CrossRef]
  48. Zhang, M.; Li, J.; Li, Y.; Xu, R. Deep learning for short-term voltage stability assessment of power systems. IEEE Access 2021, 9, 29711–29718. [Google Scholar] [CrossRef]
  49. Ashfaq, M. A Tribute to Father of Fuzzy Set Theory and Fuzzy Logic (Dr. Lotfi A. Zadeh). Int. J. Swarm Intell. Evol. Comput. 2018, 7, 2. [Google Scholar]
  50. Modi, P.; Singh, S.P.; Sharma, J. Fuzzy neural network based voltage stability evaluation of power systems with SVC. Appl. Soft Comput. 2008, 8, 657–665. [Google Scholar] [CrossRef]
  51. Mendel, J.M. Type-2 fuzzy sets as well as computing with words. IEEE Comput. Intell. Mag. 2019, 14, 82–95. [Google Scholar] [CrossRef]
  52. Jang, J.S. ANFIS: Adaptive-network-based fuzzy inference system. IEEE Trans. Syst. Man Cybern. 1993, 23, 665–685. [Google Scholar] [CrossRef]
  53. Ghaghishpour, A.; Koochaki, A. An intelligent method for online voltage stability margin assessment using optimized ANFIS and associated rules technique. ISA Trans. 2020, 102, 91–104. [Google Scholar] [CrossRef]
  54. Amroune, M.; Musirin, I.; Bouktir, T.; Othman, M.M. The amalgamation of SVR and ANFIS models with synchronized phasor measurements for on-line voltage stability assessment. Energies 2017, 10, 1693. [Google Scholar] [CrossRef]
  55. Amroune, M.; Bourzami, A.; Zellagui, M.; Musirin, I. Real-time voltage stability monitoring using machine learning-based pmu measurements. In Wide Area Power Systems Stability, Protection, and Security; Springer: Berlin/Heidelberg, Germany, 2021; pp. 423–448. [Google Scholar]
  56. Walia, N.; Singh, H.; Sharma, A. ANFIS: Adaptive neuro-fuzzy inference system—A survey. Int. J. Comput. Appl. 2015, 123, 32–38. [Google Scholar] [CrossRef]
  57. Srisaeng, P.; Baxter, G.S.; Wild, G. An adaptive neuro-fuzzy inference system for forecasting Australia’s domestic low cost carrier passenger demand. Aviation 2015, 19, 150–163. [Google Scholar] [CrossRef] [Green Version]
  58. Prasad, K.; Gorai, A.K.; Goyal, P. Development of ANFIS models for air quality forecasting and input optimization for reducing the computational cost and time. Atmos. Environ. 2016, 128, 246–262. [Google Scholar] [CrossRef]
  59. Adeleke, O.; Akinlabi, S.A.; Jen, T.C.; Dunmade, I. Prediction of municipal solid waste generation: An investigation of the effect of clustering techniques and parameters on ANFIS model performance. Environ. Technol. 2022, 43, 1634–1647. [Google Scholar] [CrossRef] [PubMed]
  60. Şahin, M.; Erol, R. A comparative study of neural networks and ANFIS for forecasting attendance rate of soccer games. Math. Comput. Appl. 2017, 22, 43. [Google Scholar] [CrossRef] [Green Version]
  61. Panapakidis, I.P.; Dagoumas, A.S. Day-ahead natural gas demand forecasting based on the combination of wavelet transform and ANFIS/genetic algorithm/neural network model. Energy 2017, 118, 231–245. [Google Scholar] [CrossRef]
  62. Atmaca, H.; Cetisli, B.; Yavuz, H.S. The comparison of fuzzy inference systems and neural network approaches with ANFIS method for fuel consumption data. In Proceedings of the Second International Conference on Electrical and Electronics Engineering Papers ELECO, Bursa, Turkey, 7–11 November 2001; Volume 6, pp. 1–4. [Google Scholar]
  63. Nagy, E.; Puskás, M.; Drexler, D.A. Comparison of artificial neural network and ANFIS for parameter estimation of a tumor model. In Proceedings of the 2022 IEEE 20th Jubilee World Symposium on Applied Machine Intelligence and Informatics (SAMI), Poprad, Slovakia, 19–22 January 2022; pp. 000133–000140. [Google Scholar]
  64. Ghobadiha, Y.; Motieyan, H. Urban growth modelling in Qazvin, Iran: An investigation into the performance of three ANFIS methods. J. Spat. Sci. 2022, 1–20. [Google Scholar] [CrossRef]
  65. Juanuwattanakul, P.; Masoum, M.A.S.; Niyomsak, C.; Mohseni, M. Voltage analysis for placement of DG in multiphase distribution networks. In Proceedings of the 2012 IEEE Power and Energy Society General Meeting, San Diego, CA, USA, 22–26 July 2012; pp. 1–5. [Google Scholar] [CrossRef] [Green Version]
  66. Adedeji, P.A.; Akinlabi, S.A.; Madushele, N.; Olatunji, O.O. Hybrid neurofuzzy investigation of short-term variability of wind resource in site suitability analysis: A case study in South Africa. Neural Comput. Appl. 2021, 33, 13049–13074. [Google Scholar] [CrossRef]
  67. Singh, R.; Kainthola, A.; Singh, T. Estimation of elastic constant of rocks using an ANFIS approach. Appl. Soft Comput. 2012, 12, 40–45. [Google Scholar] [CrossRef]
  68. Adedeji, P.A.; Akinlabi, S.; Madushele, N.; Olatunji, O.O. Wind turbine power output very short-term forecast: A comparative study of data clustering techniques in a PSO-ANFIS model. J. Clean. Prod. 2020, 254, 120135. [Google Scholar] [CrossRef]
  69. Adedeji, P.A.; Akinlabi, S.; Madushele, N.; Olatunji, O.O. Hybrid adaptive neuro-fuzzy inference system (ANFIS) for a multi-campus university energy consumption forecast. Int. J. Ambient Energy 2022, 43, 1685–1694. [Google Scholar] [CrossRef]
  70. Valle, Y.D.; Venayagamoorthy, G.K.; Mohagheghi, S.; Hernandez, J.C.; Harley, R.G. Particle swarm optimization: Basic concepts, variants and applications in power systems. IEEE Trans. Evol. Comput. 2008, 12, 171–195. [Google Scholar] [CrossRef]
  71. Rathore, A.; Sharma, H. Review on inertia weight strategies for particle swarm optimization. In Proceedings of the Sixth International Conference on Soft Computing for Problem Solving; Springer: Berlin/Heidelberg, Germany, 2017; pp. 76–86. [Google Scholar]
  72. What Limits Power Flow Through an Overhead Transmission Line? 2013. Available online: www.pdc-cables.com/oh_limits_powerflow.pdf (accessed on 15 August 2022).
  73. Adewuyi, O.B.; Howlader, H.O.R.; Olaniyi, I.O.; Konneh, D.A.; Senjyu, T. Comparative analysis of a new VSC-optimal power flow formulation for power system security planning. Int. Trans. Electr. Energy Syst. 2020, 30, e12250. [Google Scholar] [CrossRef]
Figure 1. A two-node simplified transmission network [9].
Sustainability 14 15448 g001
Figure 2. P–Q curve showing the voltage stability margin as a function to load increase [4].
Sustainability 14 15448 g002
Figure 3. The five-layer architecture of the ANFIS model [69].
Sustainability 14 15448 g003
Figure 4. The simplified illustration for PSO-ANFIS training and testing.
Sustainability 14 15448 g004
Figure 5. Illustration of the developed ANFIS model architecture.
Sustainability 14 15448 g005
Figure 6. Plot of target (calculated) and output (predicted) VSM values for IEEE 30-bus system.
Sustainability 14 15448 g006
Figure 7. Regression plots for IEEE 30-bus system.
Sustainability 14 15448 g007
Figure 8. Plot of target (calculated) and output (predicted) VSM values for NIGERIAN 28-bus system.
Sustainability 14 15448 g008
Figure 9. Regression plots for NIGERIAN 28-bus system.
Sustainability 14 15448 g009
Table 1. PSO parameters.
ParameterValues
Population size50
Number of iterations200
Cognitive factor, C 1 2.0
Social factor, C 2 2.0
Inertia weight, w0.9–0.4
Table 2. Model performance comparison for both test cases.
Test
Systems
FIS
Models
Performance AnalysisComp. Time
(mins)
RMSEMAPE (%)R
IEEE 30-BUSANFIS0.583313.60020.951824.5
PSO-ANFIS0.17955.58760.9829182.5
NIGERIAN 28-BUSANFIS5.502419.95040.927757.2
PSO-ANFIS2.32478.17050.9519212.7
Publisher’s Note: MDPI stays neutral with regard to jurisdictional claims in published maps and institutional affiliations.

