

Effect of PdNiBi Metal Content: Cost Reduction in Alkaline Direct Ethanol Fuel Cells


1
Institute of Chemical Engineering and Environmental Technology, Graz University of Technology, Inffeldgasse 25/C, 8010 Graz, Austria
2
Faculty of Chemistry and Chemical Technology, University of Ljubljana, Večna pot 113, 1000 Ljubljana, Slovenia
*
Author to whom correspondence should be addressed.
Sustainability 2022, 14(22), 15485; https://0-doi-org.brum.beds.ac.uk/10.3390/su142215485
Submission received: 2 November 2022
/
Revised: 17 November 2022
/
Accepted: 18 November 2022
/
Published: 21 November 2022
(This article belongs to the Topic Nanomaterials for Sustainable Energy Applications)
Abstract
:In this work, the metal content of Pd85Ni10Bi5/C catalysts for the alkaline ethanol-oxidation reaction was reduced from 40 wt.% (PdNiBi/C (40/60)) to 30 wt.% (PdNiBi/C (30/70)), 20 wt.% (PdNiBi/C (20/80)) and 10 wt.% (PdNiBi/C (10/90)), while increasing performance. The synthesized catalysts were examined using physicochemical measurements and electrochemical measurements. The best performing catalysts were used to fabricate membrane electrode assemblies for carrying out single-cell tests and to determine the influence of the metal/carbon ratio of the electrode. The electrochemical surface area (695 cm2 mg−1) and activity were increased, resulting in high peak-current densities for the ethanol oxidation reaction (3.72 A mg−1) by the resulting more accessible metal particles. The electrode produced with the PdNiBi/C (30/70) catalyst reached a maximum power density of 34.8 mW mg−1 at 50 °C. This successfully demonstrated a doubling of the power density compared with the performance of the PdNiBi/C (40/60) electrode, while simultaneously reducing the costs.
1. Introduction
Research in the field of alkaline direct ethanol fuel cells (ADEFCs) has experienced an upturn in recent years, due to the increasing demand for the use of renewable resources. ADEFCs have significant advantages over other types of fuel cells. The benefits of ethanol as a liquid fuel include its ease of storage and transportation, its sustainable production from biomass and its high volumetric-energy-density. The alkaline medium has great advantages in terms of cost reduction, due to its improvement of reaction kinetics, the use of non-noble metals as co-catalysts and the lower cost of the anion exchange membrane [1,2,3,4,5,6,7,8,9,10,11,12,13,14,15,16,17,18].
The biggest challenge, however, is the incomplete cleavage of the C-C bond of the ethanol molecule. This has the result that only intermediates are produced, instead of the desired product carbon dioxide, which prevents commercial use. Unfortunately, even the expensive, widely used Pt- or Pd-containing catalysts are unable to meet this requirement. Compared to Pt, Pd shows a better performance and higher activity for the ethanol oxidation reaction (EOR), less susceptibility to poisoning, higher efficiency for C-C cleavage and a higher stability [19,20,21,22,23]. In recent years, attempts have been made to improve the performance and reduce the cost of these catalysts by the addition of co-catalysts such as Bi, Ni, Pb, Sn, Ru, Ag or Au [9,16,17,24,25,26,27,28,29,30]. Ni and Bi, for example, improve the performance in terms of EOR, due to their affinity for OH− ions and the increase of OH− adsorption on the catalyst surface by additional oxide and hydroxide on the surface, respectively [9,16,27,31]. However, monometallic Bi/C and Ni/C catalysts show no activity for alkaline EOR in the potential range used in this work [9,16,32]. Ternary PdNiBi catalysts with different metal ratios [33,34], prepared by the modified instant-reduction method, demonstrated good performance for the EOR. The use of this synthesis method allows the production of catalysts with uniform distribution, no particle agglomerates and homogeneous morphology [34].
Another significant aspect in addition to cost reduction is the choice of the substrate material, since it is inexpensive and the homogeneous distribution of metal particles on it means that accessibility plays an important role. The support material has an influence on the metal particles deposited on it in accordance with activity, particle size and stability [35,36]. In addition, the available carbon support-materials show a high corrosion resistance and electrical conductivity, which has a positive effect on the performance and stability of the entire catalyst [35,36,37]. An additional option to minimize the costs of the catalyst is to reduce the metal content, i.e., varying the metal/carbon ratio. The variation of the metal/carbon ratio affects the activity and the stability [38]. Reducing the metal content and at the same time keeping the catalyst loading of the electrode in the fuel-cell constant, electrodes with increasing thicknesses are obtained [39]. A thicker anode layer unfortunately increases resistance and reduces catalyst layer utilization, but reduces the possibility of ethanol crossover [40]. This ethanol crossover from the anode through the membrane to the cathode is a major problem, because the cathode is poisoned, the cathode potential decreases, and it leads to mixed potentials and performance degradation in the cell. To counteract this phenomena, many studies on improving the anode and cathode structure have been conducted in recent years [41,42,43,44,45,46,47].
Although studies on PdNiBi/C catalysts already exist in the literature [33,34], as described above, the influence of the metal/carbon ratio of these catalysts on activity, stability and ADEFC performance has, to the best of our knowledge, never been determined. Therefore, the aim of this work was to study for the first time the effect of the metal content of PdNiBi/C catalysts and to reduce the costs by metal-content reduction, while at the same time not having any loss in performance. The influence of the accessibility of the ethanol molecule to the active catalyst particles of the newly produced metal-content-reduced PdNiBi/C-catalysts was investigated outside as well as inside the fuel cell. In addition, the influence of the metal/carbon ratio of the electrode on the single-cell measurements was examined. The optimization of the catalyst showed great success regarding the activity of the catalyst, while at the same time reducing the costs.
2. Materials and Methods
2.1. Chemicals and Materials
For the synthesis of the anode catalysts, the physicochemical, electrochemical and single-cell measurements, the following chemicals and materials were used and source and purity were listed. All reagents were used without further purification. Vulcan XC72R (carbon black, CABOT Corporation (Boston, MA, USA)), Nafion™ Solution (5 wt.% in H2O, Quintech (Göppingen, Germany)), sodium borohydride (NaBH4, purity of 97%, Alfa Aesar (Haverhill, MA, USA)), ultrapure water (~18 MΩ cm, Barnstead NANOpureWater Purification system (Dubuque, IA, USA)), alumina suspension (Al2O3, 0.05 µm, MasterPrep Bühler (Lake Bluff, IL, USA)), commercial PtRu/C (HiSPEC 10000, Platinum, nominally 40%, Ruthenium, nominally 20% on carbon black, Johnson Matthey (London, UK)). Palladium chloride (PdCl2, anhydrous, 59–60% Pd basis), nickel(II) nitrate hexahydrate (Ni(NO3)2⋅6H2O, 99% trace metal basis), bismuth(III) chloride (BiCl3, reagent grade, ≥98%) and potassium hydroxide (KOH, 1.0 M Fixanal 1 L Ampoule) were supplied from Sigma-Aldrich (Darmstadt, Germany). Hydrochloric acid (HCl, ROTIPURAN® 37% fuming, p.a., ACS, ISO), ethanol (EtOH, 99.9% p.a.), potassium hydroxide (KOH, ≥85%, p.a., pellets) and 2-propanol (Isopropanol, 99.9% p.a.) were purchased from Carl Roth (Karlsruhe, Germany). Sodium hydroxide (NaOH, ≥98%, ACS, pellets), nitric acid (HNO3, ISO, Ph. Eur grade, 30%) and hydrogen peroxide (H2O2, ISO, Ph. Eur grade, 65%) were delivered by Honeywell Fluka (Charlotte, NC, USA). Fumasep® FAA-3-50 (anion-exchange membrane, non-reinforced), fumion® FAA-3 solution (10 wt.% in NMP), carbon cloth (ELAT-Hydrophilic Plain Cloth, 0.406 mm thick) and carbon paper (Sigracet 29 BC, 0.235 mm thick) were derived from the fuel cell store (College Station, TX, USA).
2.2. Catalyst Synthesis
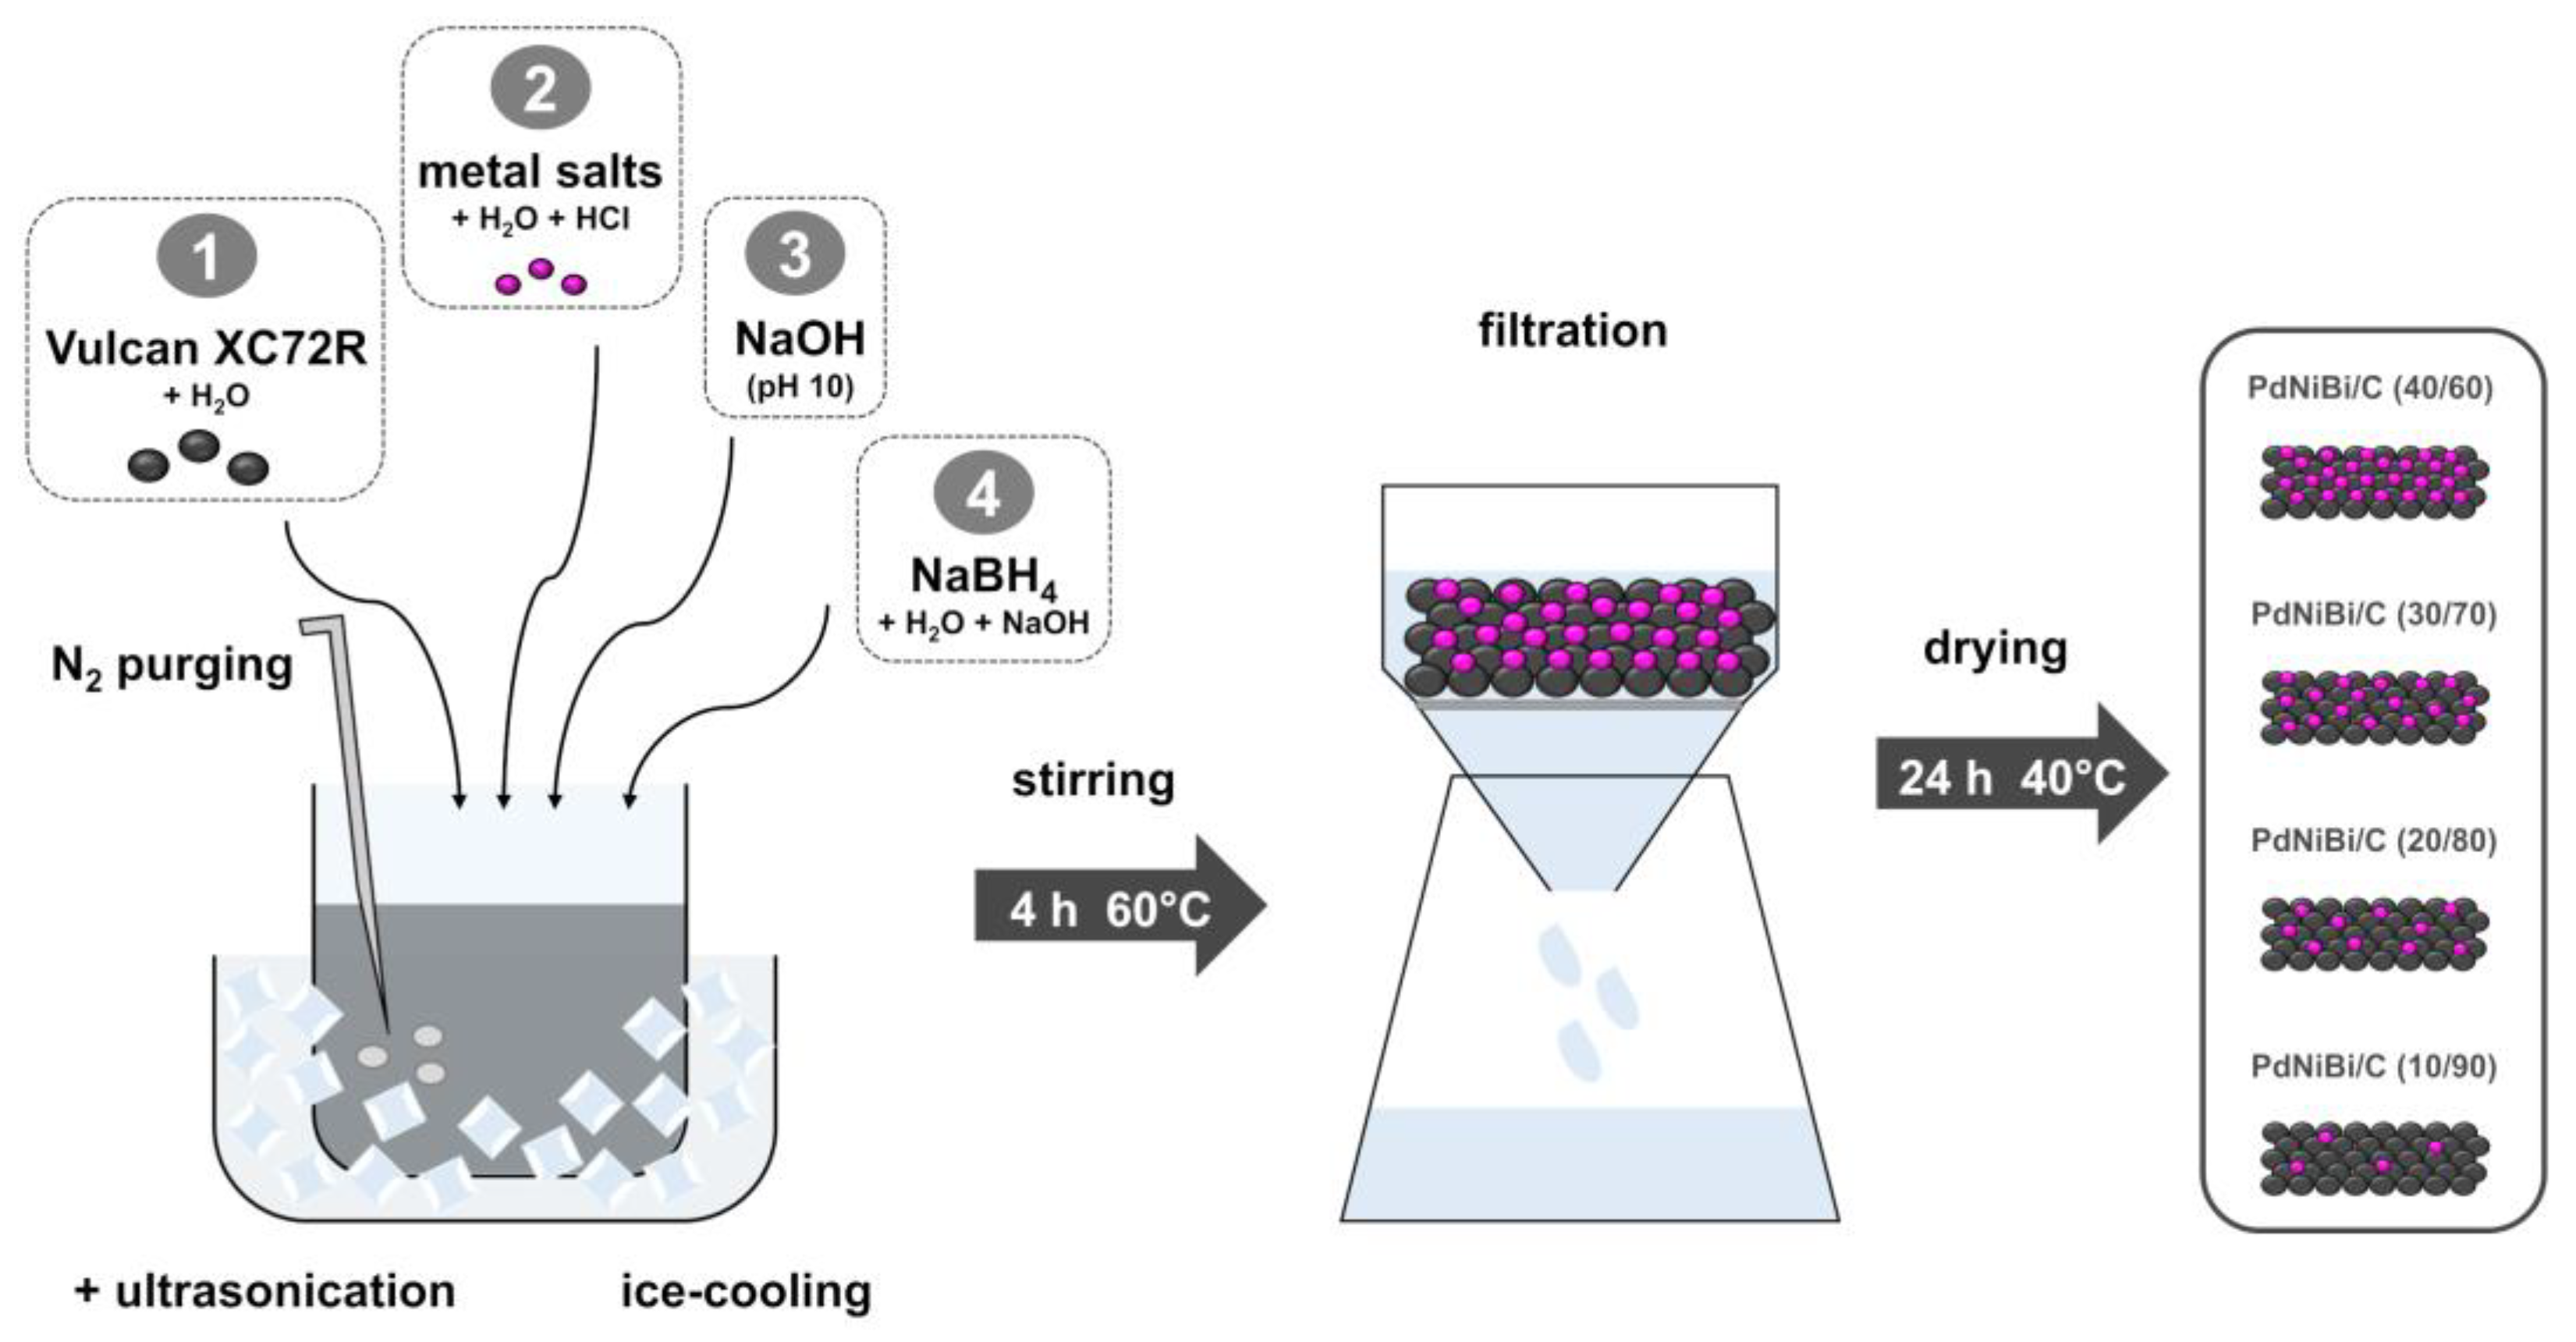
The modified instant reduction method [34] was used to prepare the carbon-supported Pd85Ni10Bi5-catalysts. The optimal atomic-metal ratio was maintained, but the metal content on the carbon-support material (Vulcan XC72R) was reduced from 40 wt.% (PdNiBi/C (40/60)) to 30 wt.% (PdNiBi/C (30/70)), 20 wt.% (PdNiBi/C (20/80)) and 10 wt.% (PdNiBi/C (10/90)). The synthesis itself was performed as described for the liquid-NaBH4- synthesis route, but different metal salt quantities were weighed and added in, and therefore the synthesis route is briefly described here and shown in Figure 1. First, the carrier material Vulcan XC72R is dispersed in ultrapure water under ice cooling, sonication, and nitrogen bubbling. Meanwhile, the three metal-salt precursor-solutions are prepared separately. PdCl2 and Ni(NO3)2 6H2O are dissolved in ultrapure water and 1 M HCl, respectively. For the BiCl3 solution, concentrated HCl is used in addition to water. These solutions are added to the carbon-support dispersion. After adjusting the pH to 10, a solution of NaBH4 in ultrapure water and 1 M NaOH as reducing agent is added dropwise. When the addition is complete, the reaction mixture is stirred at 60 °C for four hours. The product is obtained, after cooling to RT, by filtration with extensive washing with ultrapure water, and then dried for 24 h at 40 °C.
2.3. Physicochemical Characterization
The concentration of Bi in all catalysts was determined by inductively coupled plasma-mass spectrometry (ICP-MS) using an ICP-MS Agilent Technologies 7900 (Palo Alto, CA, USA), with micro mist nebulizer, quartz spray chamber and quadrupole mass analyzer. Ar gas with high-purity argon (5.0) was used at 15 L min−1 flow rate. Data was processed and analyzed with MassHunter 4.4. software. The concentrations of Pd and Ni in all catalysts were determined by atomic absorption spectroscopy (AAS) using AAS Varian AA 240 (Varian, Palo Alto, CA USA) with the settings: λ = 247.6 nm, Δλ = 0.2 nm, iHC = 5 mA, ΦC2H2 = 1.5 mL min−1, Φair = 3.5 mL min−1. The absorbance was then measured for all prepared solutions. The Pd and Ni concentrations in the samples were determined using a calibration curve. Sample preparation: approximately 50 mg of the catalyst powder was placed into a 100 mL beaker and 25 mL HNO3 and 2 mL of H2O2 were added. The mixture was heated until boiling point and left to boil until half of the volume evaporated. The mixture was quantitatively transferred to a 50 mL flask and diluted to the mark. Before ICP-MS or AAS measurement, the mixture was filtered through a 0.45 µm filter and diluted 100 times with ultrapure water.
The determination of the crystal structure of the PdNiBi/C catalysts was performed by powder X-ray diffraction (XRD) on a PANalytical X’Pert PRO MPD diffractometer (Malvern Panalytical, Malvern, UK) with Cu Kα1 radiation (λ = 1.5406 Å) in the 2θ range from 2° to 80° with the 0.034° step per 100 s, using a fully opened X’Celerator detector. Samples were prepared on a zero-background Si holder.
The morphology, particle size and distribution of the catalyst powders and, additionally, the layer thickness and coating of the electrodes were analyzed with scanning electron microscopy (SEM) Zeiss ULTRA plus (Jena, Germany). Samples were adhered to the conductive carbon-tape placed on the aluminum SEM holder. SEM images were taken at 2 kV or 5 kV using SE2 and Inlens detectors at WD 5.5 mm. The cross section of the electrodes was made by cutting the catalyst electrodes with a scalpel on a hard, flat surface.
2.4. Electrochemical Characterization
The four prepared PdNiBi/C catalysts were first electrochemically characterized with cyclic voltammetry (CV) and chronoamperometry (CA) measurements, to determine the electrochemical active surface area (ECSA), the activity towards the EOR and stability. For this purpose, a three-electrode arrangement was used, consisting of: working electrode (glassy-carbon rotating-disk electrode (GC-RDE) from PINE Research Instrumentation (AFE5T0GC Durham (NC, USA))), reference electrode (reversible hydrogen electrode (RHE) from Hydroflex® gaskatel (Kassel, Germany)) and counter electrode (platinized titanium rod from Bank Elektronik - Intelligent controls GmbH (Pohlheim, Germany)). A potentiostat (Reference 600TM Potentiostat/Galvanostat/ZRA) and an evaluation program from GAMRY Instruments (Warminster, PA, USA) were used for the measurement and data analysis.
The working electrode was cleaned with an Al2O3 powder (0.5 µm) solution and ultrapure water before each use. A total of 10 µL of the slurry were pipetted onto the GC surface (2 times 5 µL) and the electrode was rotated at 700 rpm for 1 h until a uniform dry surface was achieved. The slurry for each catalyst measurement consisted of 8.1 mg catalyst powder, 1.75 mL isopropanol, 0.737 µL ultrapure water and 13 µL of the ionomer solution Nafion. The film thickness was kept nearly constant for all the catalyst samples at between 10–15 µm (Table S1), since the thickness of the layer on the working electrode influences the electrochemical measurements [48]. Different catalyst loadings on the electrode were achieved (PdNiBi/C (40/60): 56 µg cm−2, PdNiBi/C (30/70): 42 µg cm−2, PdNiBi/C (20/80): 28 µg cm−2, PdNiBi/C (10/90): 14 µg cm−2).
After the cleaning cycles (until a steady CV was obtained), in a range of 0.05–1.5 V vs. RHE with a scan rate of 50 mV s−1 to remove impurities from the surface of the electrode, the CVs were recorded in N2-purged 1 M KOH. Three CV cycles with a scan rate of 10 mV s−1 at 30 °C were measured in a potential range of 0.05–1.5 V vs. RHE, to obtain the Ni peaks, and afterwards between 0.05–1.2 V vs. RHE for the calculation of the ECSA and the background correction for the EOR measurement. The third cycle of each measurement was used for the evaluation. Thereafter, ethanol was added to the electrolyte to achieve a 1 M KOH + 1 M EtOH solution. The measurements were repeated at the same CV parameters, to determine the activity towards EOR.
The stability of the catalysts was determined by performing CA measurements at a potential of 0.83 V vs. RHE for 3600 s in 1 M KOH + 1 M EtOH solution at 30 °C.
2.5. Cell Performance Measurement
After the electrochemical characterization of the catalysts, the following were used to fabricate electrodes and subsequently membrane electrode assemblies (MEAs): PdNiBi/C (40/60), PdNiBi/C (30/70) and PdNiBi/C (20/80) for the anodes and the commercial PtRu/C catalyst for the cathode. For this purpose, catalyst solutions were prepared with a concentration of 4 mg mL−1 catalyst in isopropanol and water (7:3). In addition, the anion-exchange ionomer was added to the solution to obtain a loading of 30 wt.% of ionomer on the electrode. The electrodes were fabricated with an ultrasonic spray coater from Sonotek Corporation (Milton, NY, USA). Therefore, the catalyst inks were evenly sprayed on the corresponding gas diffusion layers (GDLs) with an area of 4 cm2. The anode catalysts were applied on a carbon cloth with a resulting metal loading of 0.75 mg cm−2, and the cathode catalyst on a carbon paper with a metal loading of 0.5 mg cm−2. By keeping the metal content on the electrode constant in order to compare the performance, the electrode became thicker as the metal content of the anode catalysts decreased. Therefore, the mass loadings for the electrodes with the PdNiBi/C (40/60), PdNiBi/C (30/70) and PdNiBi/C (20/80) catalysts are 1.9 mg cm−2, 2.5 mg cm−2 and 3.8 mg cm−2, respectively.
The commercial membrane was pretreated in 1 M KOH and cleaned with ultrapure water before assembling it between the electrodes to obtain the MEA. The resulting three different MEAs were installed in our own fabricated ADEFC, to perform the single-cell tests. At the cathode, pure oxygen gas (25 mL min−1) and at the anode a mixture of 1 M KOH and 1 M EtOH or a mixture of 5 M KOH and 3 M EtOH (5 mL min−1) were utilized as fuels. The measurement series was first performed with low anode-fuel concentration at different temperatures (RT, 35 °C, 42 °C, 50 °C) and then repeated with the higher concentration. The potentiostat used for the electrochemical characterization was adapted to record the current density-potential (I-V) curves in galvanostatic mode. The power density was then calculated and plotted against the current density to obtain the power density-current density (P-I) curve.
3. Results and Discussion
3.1. Physicochemical Characterization
The synthesized Pd85Ni10Bi5/C catalysts were physicochemically characterized with various methods such as ICP-MS (Bi) and AAS (Pd and Ni), XRD and SEM to determine the chemical composition, crystal structure, particle size and distribution.
The analysis via ICP-MS and AAS was performed to determine the reduction of the metal loading from 40 wt.% to 30 wt.%, 20 wt.% and 10 wt.%. The results of the elemental analysis are listed in Table 1 in wt.% and in Table S2 in at.%.
The total metal loading (totalmetal) of the catalysts, as well as the mass fraction of each metal are in good agreement with the theoretical calculated values. This analysis method showed that the preparation of the metal-content-reduced Pd85Ni10Bi5/C catalysts (PdNiBi/C (30/70), PdNiBi/C (20/80), PdNiBi/C (10/90)) and also the PdNiBi/C (40/60) with the targeted values, worked.
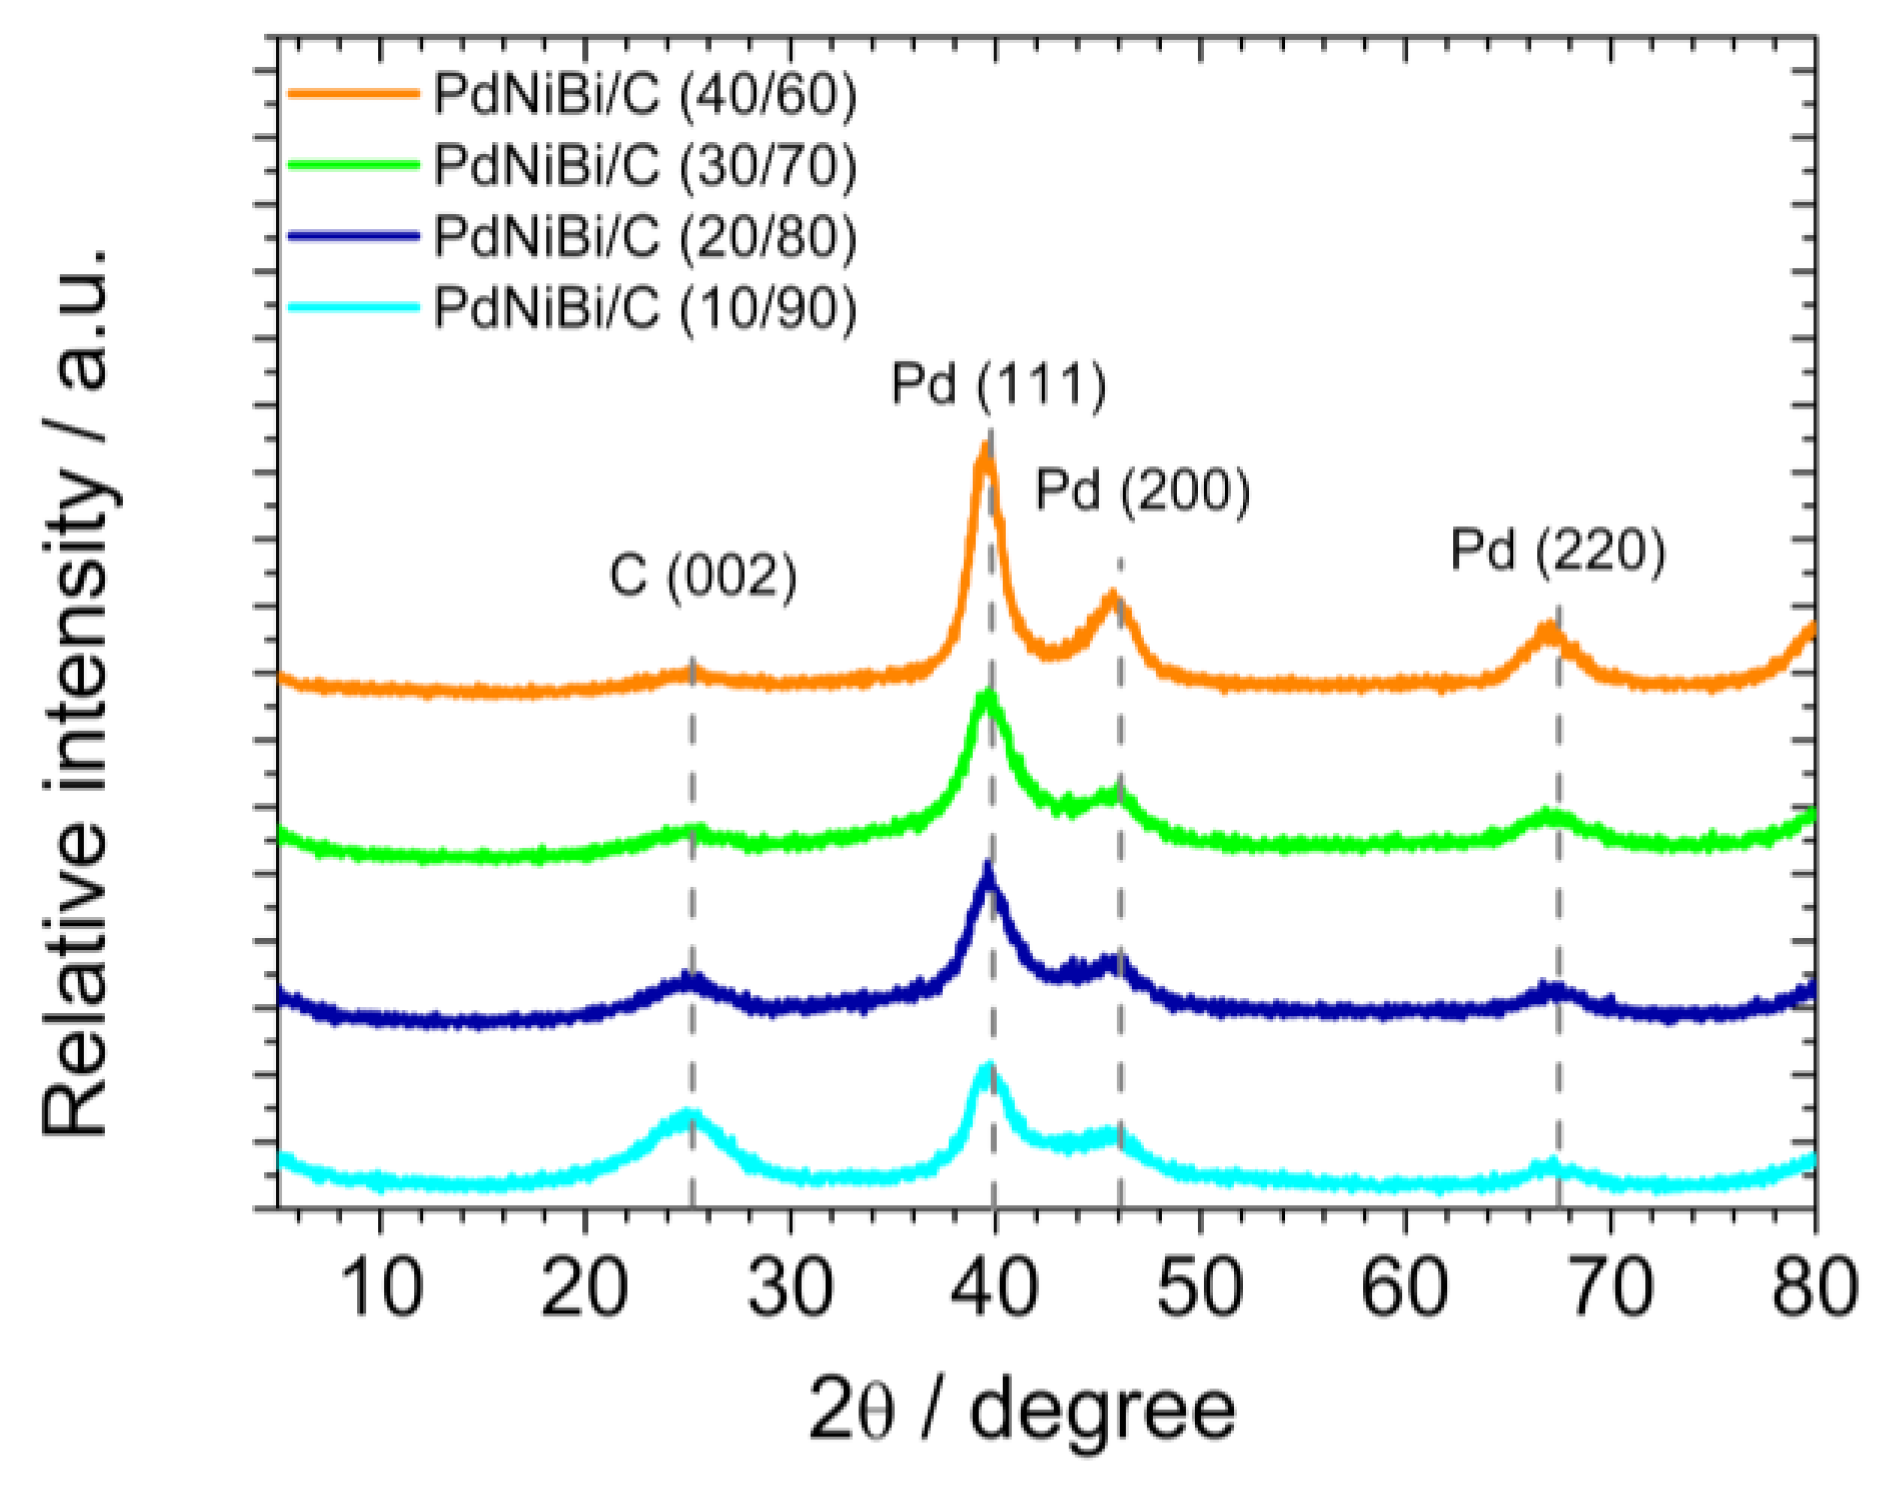
As expected, the XRD characterization of the PdNiBi/C catalysts show the typical diffraction peaks (shown with the bright dashed line) for the (111), (200) and (220) planes of the fcc Pd crystalline structure (Pd_64922-ICSD) at 2θ values of 40°, 47° and 68° and the characteristic peak of the (002) plane of graphite (2H_187640-ICSD) at a 2θ value of 25°. Alloying Pd with Ni and Bi shifts the peaks to lower values, due to the expansion of the Pd lattice, as observed before (Figure 2) [33,34]. The exact values of all peaks are summarized in the Supplementary Material (Table S3).
The intensity of the Pd peaks decreases with the reduced metal-content in the following order: PdNiBi/C (40/60) > PdNiBi/C (30/70) > PdNiBi/C (20/80) > PdNiBi/C (10/90). In comparison, the intensity of the (002) plane of graphite, which is attributed to the Vulcan XC72R carbon-support material, increases with reduced metal-content, as a result of the catalyst containing more support material. The broad peaks designate small crystallite sizes, as already described for the PdNiBi/C (40/60) catalyst by Cermenek et al. [33,34]. The average crystallite size was estimated according to Scherrer, assuming spherical crystallites with a cubic crystal system using the full width at half maximum (FWHM) of the (111) plane peak at a 2θ value of 40°. The crystallites for the PdNiBi/C catalysts with reduced metal loading are smaller (2.7–2.8 nm) than the PdNiBi/C (40/60) catalyst (4.6 nm), as seen in Table S1.
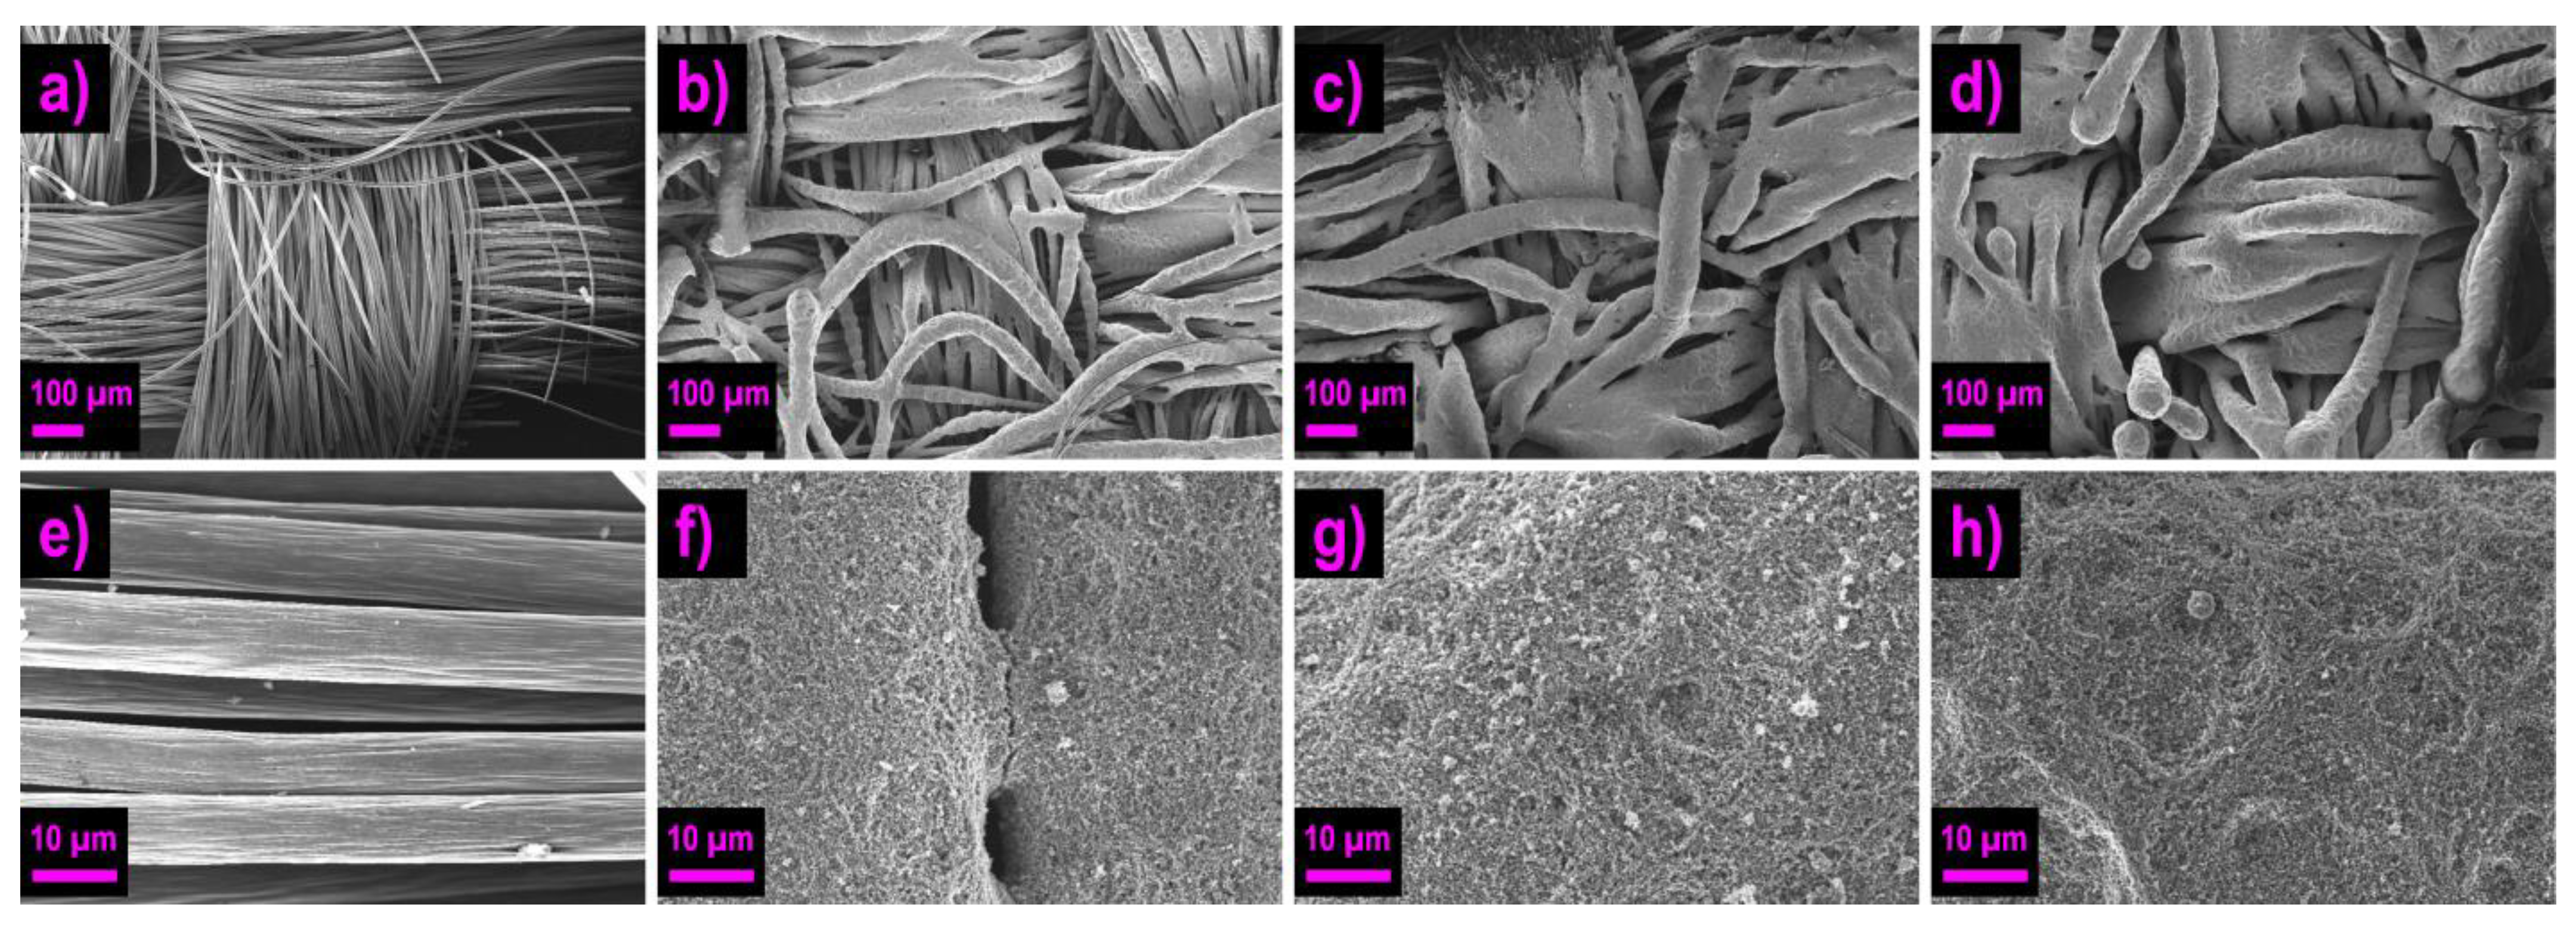
The morphology, particle size and distribution of the catalysts were characterized by SEM with low and high magnification (Figure 3a–h).
Overall, the nanoparticles of all catalysts are uniformly distributed on the carbon-support material. The images show that the agglomeration of the nanoparticles of the catalysts decreases with decreasing metal loading. The particles have more space on the support material in the following order: PdNiBi/C (40/60) < PdNiBi/C (30/70) < PdNiBi/C (20/80) < PdNiBi/C (10/90). These results are in good agreement with the results of the ICP-MS, AAS and XRD analysis. Based on the SEM images, a comparison of the size of the particles of the PdNiBi/C (30/70), PdNiBi/C (20/80) and PdNiBi/C (10/90) catalysts with the size of the particles of the already published PdNiBi/C (40/60) catalyst, which was characterized by transmission electron microscopy (TEM) reveals that they are in the same order of magnitude within a few nm (3–6 nm).
The morphology, coating, and thickness of the layers on the three prepared anode electrodes and the cathode electrode were also analyzed by SEM. The cross section of the PdNiBi/C electrodes and the dimensioning of one thread of the carbon cloth can be seen in Figure S1. As expected, the layer thickness increases with the decreasing metal content of the catalysts, as the metal loading on the electrode was kept constant. The trend is clearly evident, resulting in the following order of thickness: PdNiBi/C (40/60) 26 ± 2 µm < PdNiBi/C (30/70) 40 ± 4 µm < PdNiBi/C (20/80) 68 ± 4 µm. The thickness of the electrode produced with the PdNiBi/C (20/80) catalyst and the PdNiBi/C (30/70) catalyst increased by a factor of 2.6 and 1.5 respectively, in comparison with the PdNiBi/C (40/60) catalyst,. These results are in good agreement with the literature. Grandi et al. [49] showed that an increment by a factor of 2.7 of the layer thickness was observed through the comparison of two commercial Pt/C catalyst layers with metal contents of 40 wt.% and 20 wt.%. The cross-section and the measured value (22 µm ± 4) of the layer thickness of the cathode electrode of the commercial PtRu/C catalyst is shown in Figure S2c–d. The straight surface shape of the carbon cloth makes the dimensioning simple.
The pictures (Figure 4a–h) of the electrode surface show an even distribution of all PdNiBi/C catalysts on the electrodes; only small agglomerates can be seen. The analysis of the surface coating had the result that with a lower metal-content of the catalysts and therefore more material on the electrode (to obtain the same metal loading) the threads of the carbon cloth become coated more thickly, and consequently they stuck together increasingly. The furrowed surface of the cathode electrode (Figure S2a,b) with the comm. PtRu/C catalyst arises from the small cracks in the carbon paper that already existed before the catalyst was applied.
3.2. Electrochemical Characterization
All newly synthesized PdNiBi/C catalysts (PdNiBi/C (30/70), PdNiBi/C (20/80), PdNiBi/C (10/90)) and the already published [34] PdNiBi/C (40/60) were electrochemically characterized, and the resulting ECSA, activity towards the EOR and stability, compared (Table 2).
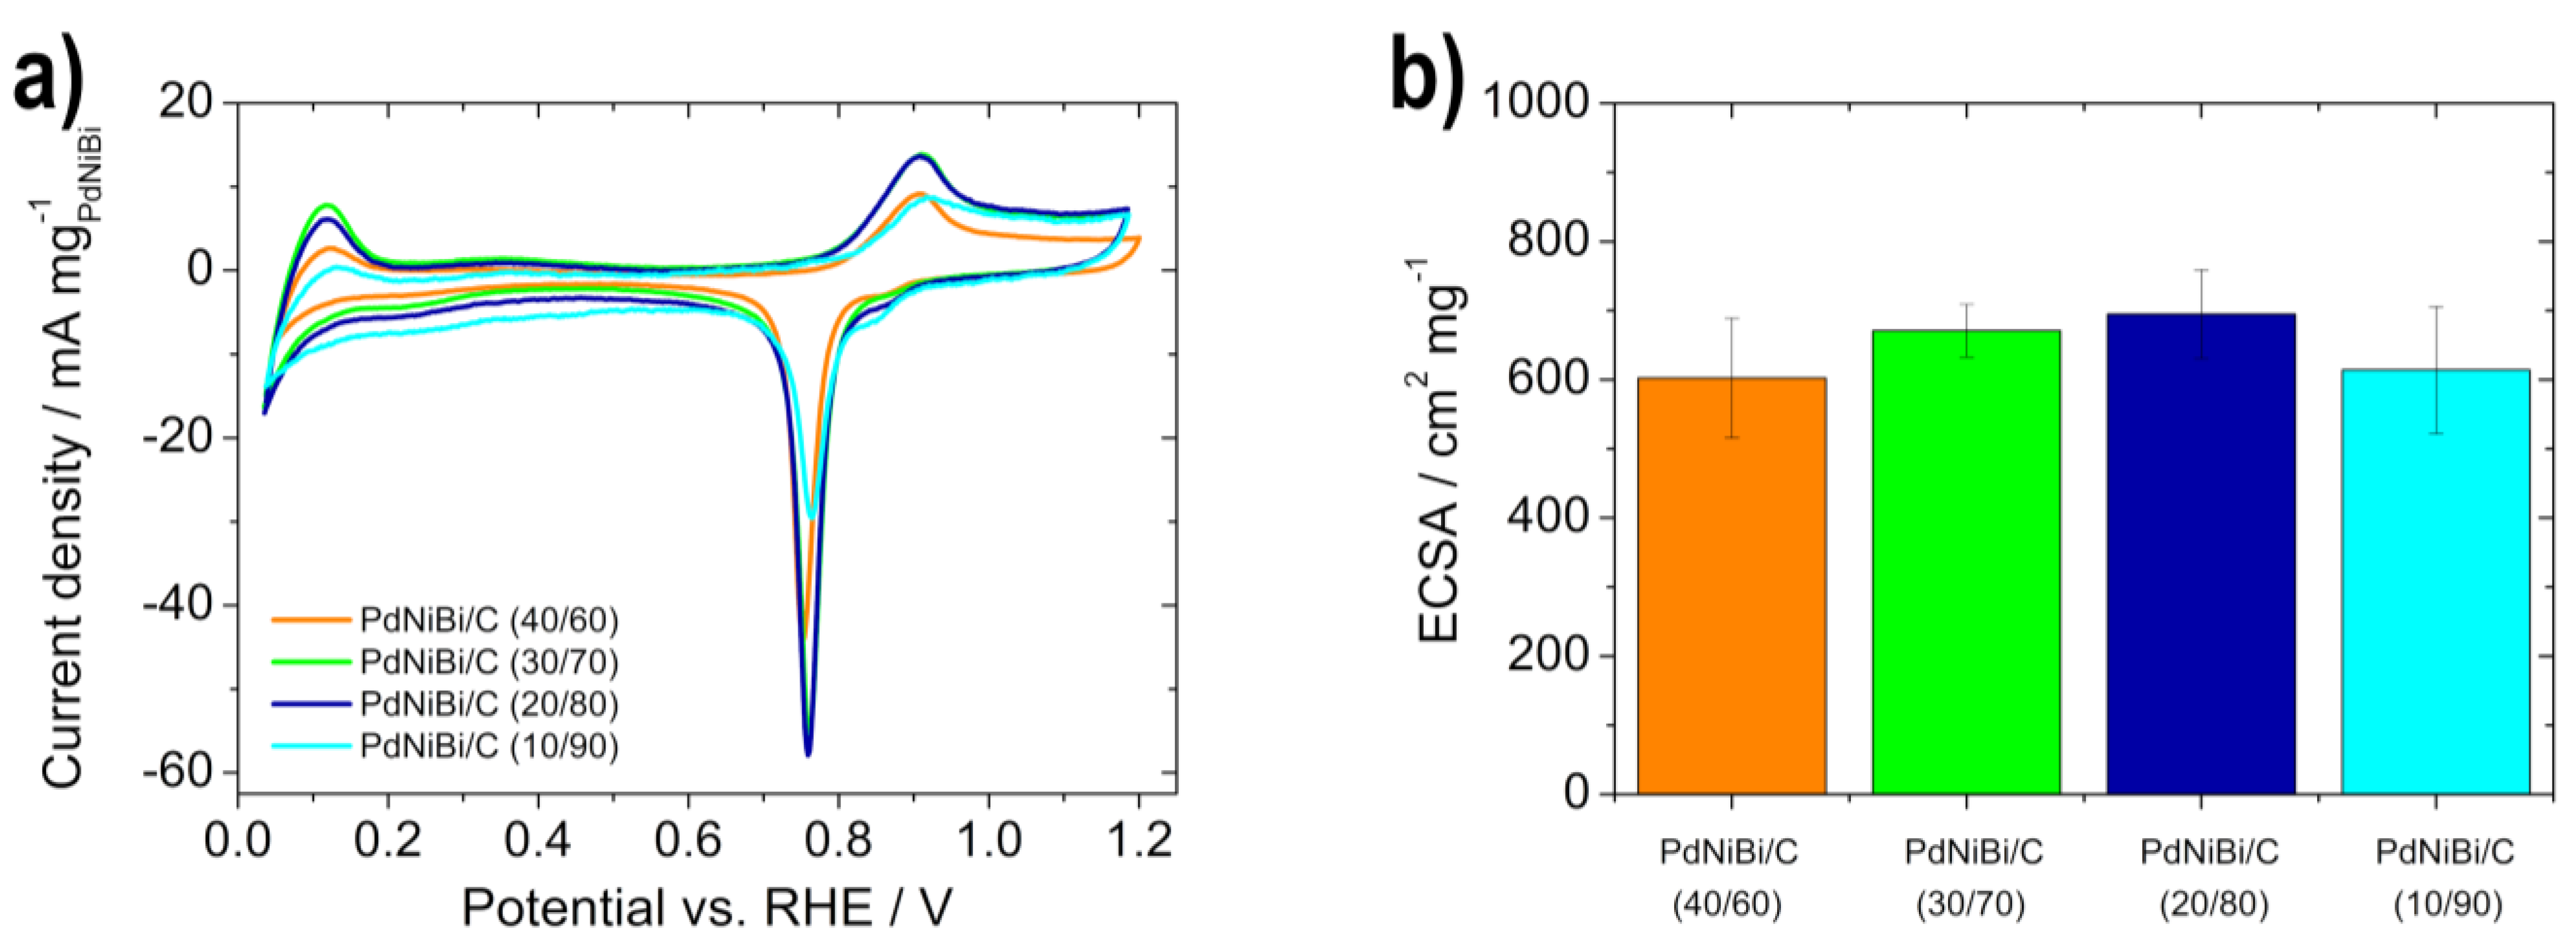
The recorded CVs in N2-purged 1 M KOH in a potential range of 0.05–1.5 V vs. RHE (Figure S3) show the characteristic peaks for the three metals for all catalysts. The oxidation of Ni(OH)2 to NiOOH and the associated reduction can be seen in the potential window of 1.2 V to 1.5 V vs. RHE in the anodic and cathodic scan [16]. In alkaline media, the oxidation of Bi to Bi2O3 appears at approximately 0.9 V vs. RHE in the anodic scan [50]. Furthermore, the alloying of Pd catalysts with Bi suppresses the ad/absorption of hydrogen (0.05–0.5 V vs. RHE) [9,50,51]. The reduction peak of PdO to Pd in Figure 5a (CV measured in the potential range of 0.05–1.2 V vs. RHE) was integrated to calculate the ECSA (1) [33,52].
The received catalyst charge (QPd) is divided by the assumed value of the reduction charge of PdO to Pd (Q*Pd: 405 µC cm.−2), the surface area (AGC: 0.196 cm2) of the electrode and the corresponding catalyst loading for the different catalysts (cL) [33,53]. The ECSA (Figure 5b) was increased for all newly synthesized catalysts (PdNiBi/C (30/70), PdNiBi/C (20/80), PdNiBi/C (10/90)) compared to PdNiBi/C (40/60), as the particles are more accessible, due to the lower metal-content on the carbon-support material, as determined by SEM.
The EOR curves can be used to discover the onset potential and the intensive/extensive activity towards the EOR. The EOR curves (Figure 6a) show two characteristic oxidation peaks. The current first rises in the forward scan until PdO is formed, and then drops rapidly to zero-level, since PdO shows no EOR activity. After the successful regeneration of Pd in the backward scan (the reduction of PdO to Pd), the current increases again, due to the oxidation of ethanol [54,55,56].
The onset potential (Figure 6b), at which the EOR begins via dissociative adsorption is for all catalysts in the range of 0.2 to 0.3 V vs. RHE. PdNiBi/C (30/70) and PdNiBi/C (40/60) show nearly the same low value, which is attributed to the higher Ni and Bi content in the sample, which lowers the blocking by CO-like species of the Pd active sites at low potentials, due to the OH− adsorption [9,16,27], and therefore increases activity. Other significant values for the comparison of the activity towards EOR are the maximum current density (jf and jb) and the charge density (Qf and Qb) of the anodic forward scan and backward scan (important: after background correction with the CV without ethanol [56]). As seen in Figure 6c, both maximum-current-density values (jf and jb) enlarge for the catalysts in the following order: PdNiBi/C (40/60) < PdNiBi/C (30/70) < PdNiBi/C (20/80) = PdNiBi/C (10/90). Furthermore, jf is shifted to lower potential values in the same order. These phenomena result from the better accessibility of the metal particles, since the activity is increased as more ethanol can be oxidized faster at the active sites. The maximum current– peak-intensity ratio jb/jf, describes the reactivation efficiency [56], which is at 0.8 for the PdNiBi/C (40/60), but at approx. 1 for the new, prepared catalysts (PdNiBi/C (30/70), PdNiBi/C (20/80) and PdNiBi/C (10/90). This means that the maximum peak-current densities of the forward and backward scan are the same for each catalyst with lower loading. In other words, the reactivation of the Pd-oxide surface works well for them. The intensive activity of the catalysts can be derived by adding jb and jf [56]. The same trend as for the individual values is observed. Another possibility for describing the activity towards EOR is the use of the charge densities (Qf and Qb) of both peaks (Figure 6d). Thereby, a differentiation between catalysts with same current densities, but different peak widths can be made [56]. Qf is for all catalysts larger than Qb. By adding together Qf and Qb, the extensive activity is calculated. The same trend as for the ECSA (also derived from the charge, but from the reduction peak of PdO to Pd) can be seen, due to the more accessible metal particles.
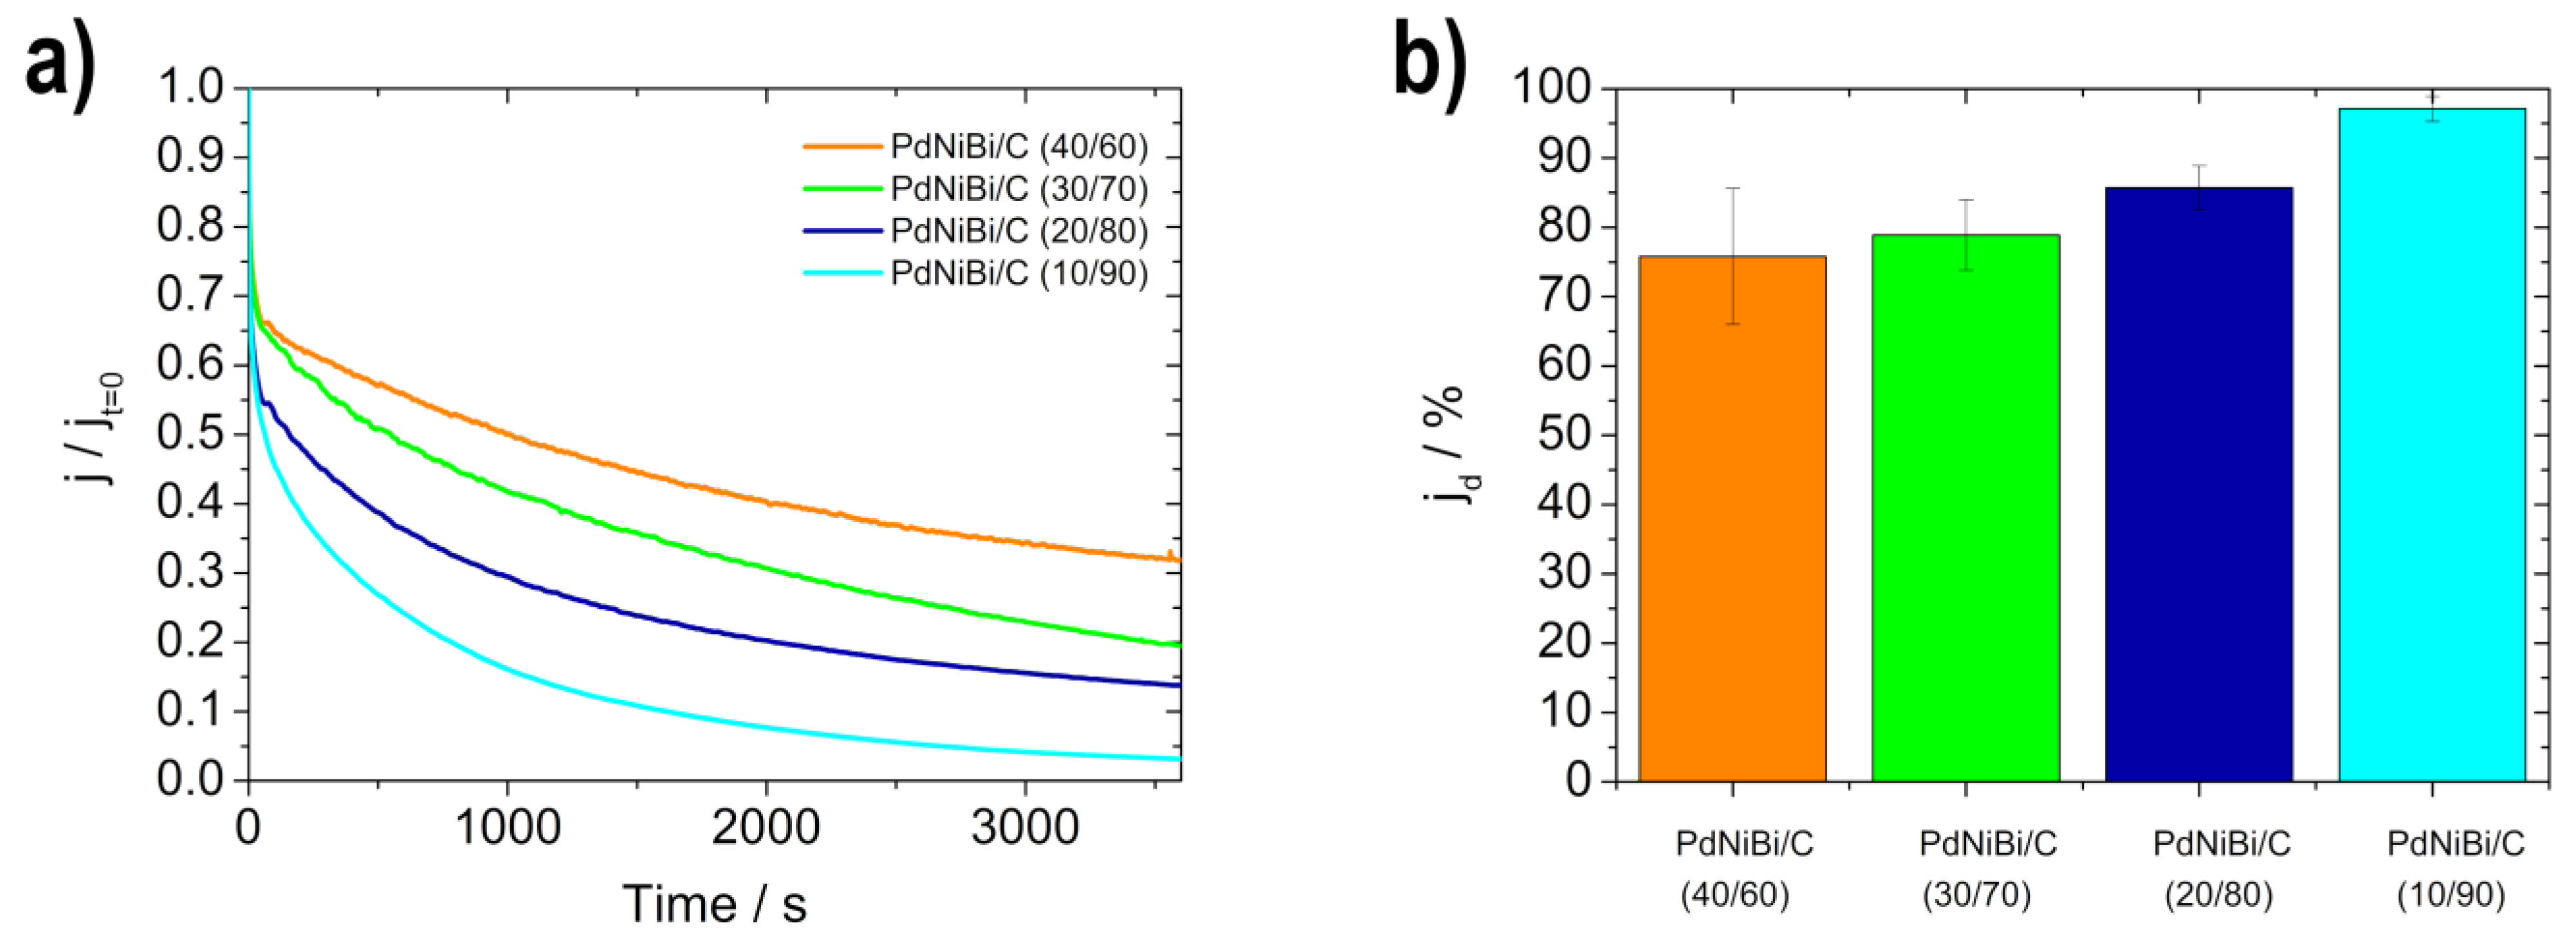
The results of the EOR stability-measurements with CA (0.83 V vs. RHE for 1 h) show that the stability of the catalysts decrease with reduced metal content (Figure 7). Therefore, by reducing the metal content, the stability of the catalysts was not improved.
Of all the catalysts produced, the PdNiBi/C (30/70) catalyst has the best synergy between the related values (summarized in Table 2), and therefore the optimal ratio between metal and support-material content, as it has a high ECSA, a low onset-potential and high maximum current-densities for the EOR, and a reasonably good stability. A literature comparison of Pd-based catalysts is given in Table 3 to support our statement of the high EOR activity of the catalysts produced.
3.3. Cell Performance Measurement and Cost Analysis
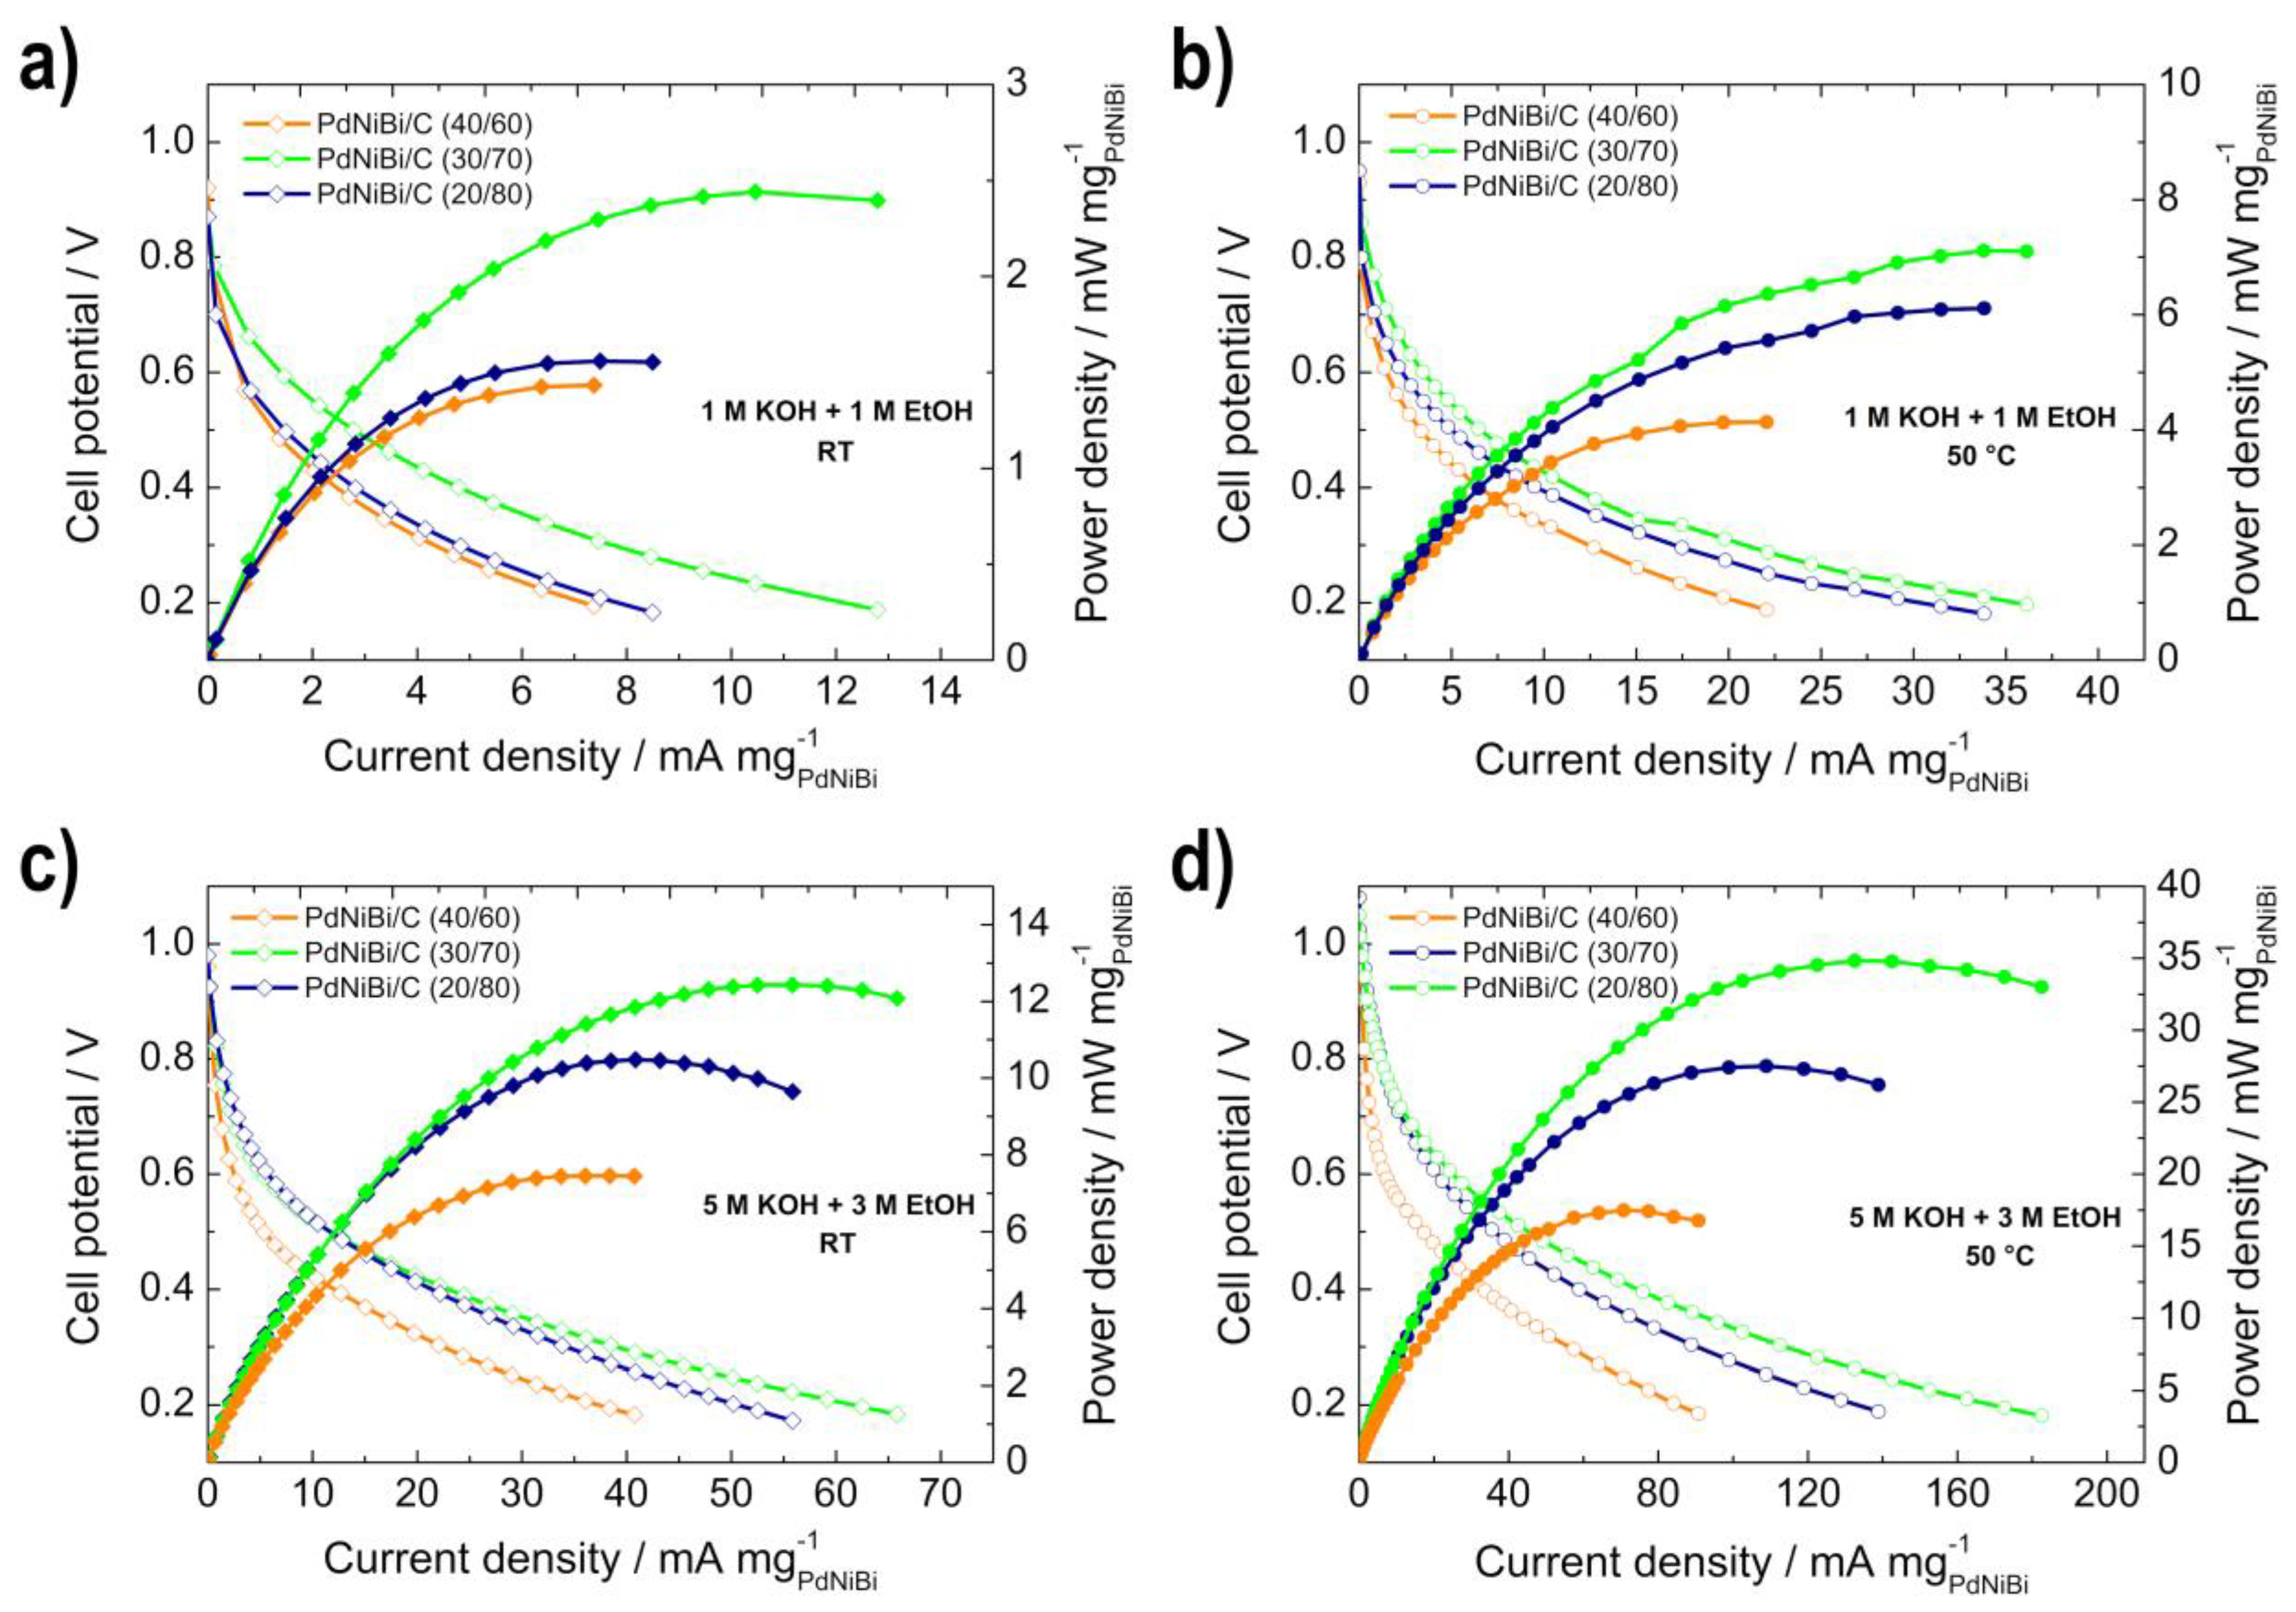
The in situ performance of the synthesized EOR catalysts was determined in single-cell tests. The effect of the reduced metal loading and the metal/carbon ratio of the electrodes on the performance of the cell measurement was investigated by using different operating temperatures and anode-fuel concentrations. The measured curves for RT and 50 °C operational temperature and the different concentrations can be seen in Figure 8. All temperature curves for each catalyst and all concentrations are shown in Figure S4.
Both the open circuit voltage (OCV) and the maximum power density (Pmax), shown in Table 4 increase with higher temperature in both measurement series, as the reaction kinetics and the conductivity of the cell are improved. Furthermore, a comparison of the different anode-fuel concentrations shows that increasing the EtOH and KOH concentrations also enhances OCV and Pmax. This can be explained by the higher availability of ethanol, the improved reaction-kinetics of the EOR, the increased conductivity (OH− ions) and the enhanced mass-transport through the membrane [42].
The three measured electrodes show the same behavior in comparison to each other, regardless of temperature and concentration of the anode fuel. The Pmax increases in the following order: PdNiBi/C (40/60) < PdNiBi/C (20/80) < PdNiBi/C (30/70), whereas the OCV is in the same order of magnitude for each measurement parameter, and nearly no change can be seen. The Pmax increases between PdNiBi/C (40/60) and PdNiBi/C (30/70) because, as already determined by RDE measurements, the PdNiBi/C (30/70) catalyst has a higher activity, and the metal particles are more accessible than at the PdNiBi/C (40/60) catalyst. The decrease between PdNiBi/C (30/70) and PdNiBi/C (20/80) is explained by the varied metal/carbon ratio due to the thicker catalyst layer, as determined by SEM. This phenomenon is reduced by increased fuel concentration and cell temperature, since, as can be seen from Figure 8, the polarization curves of the PdNiBi/C (20/80) electrode move closer to the curves of the PdNiBi/C (30/70) electrode.
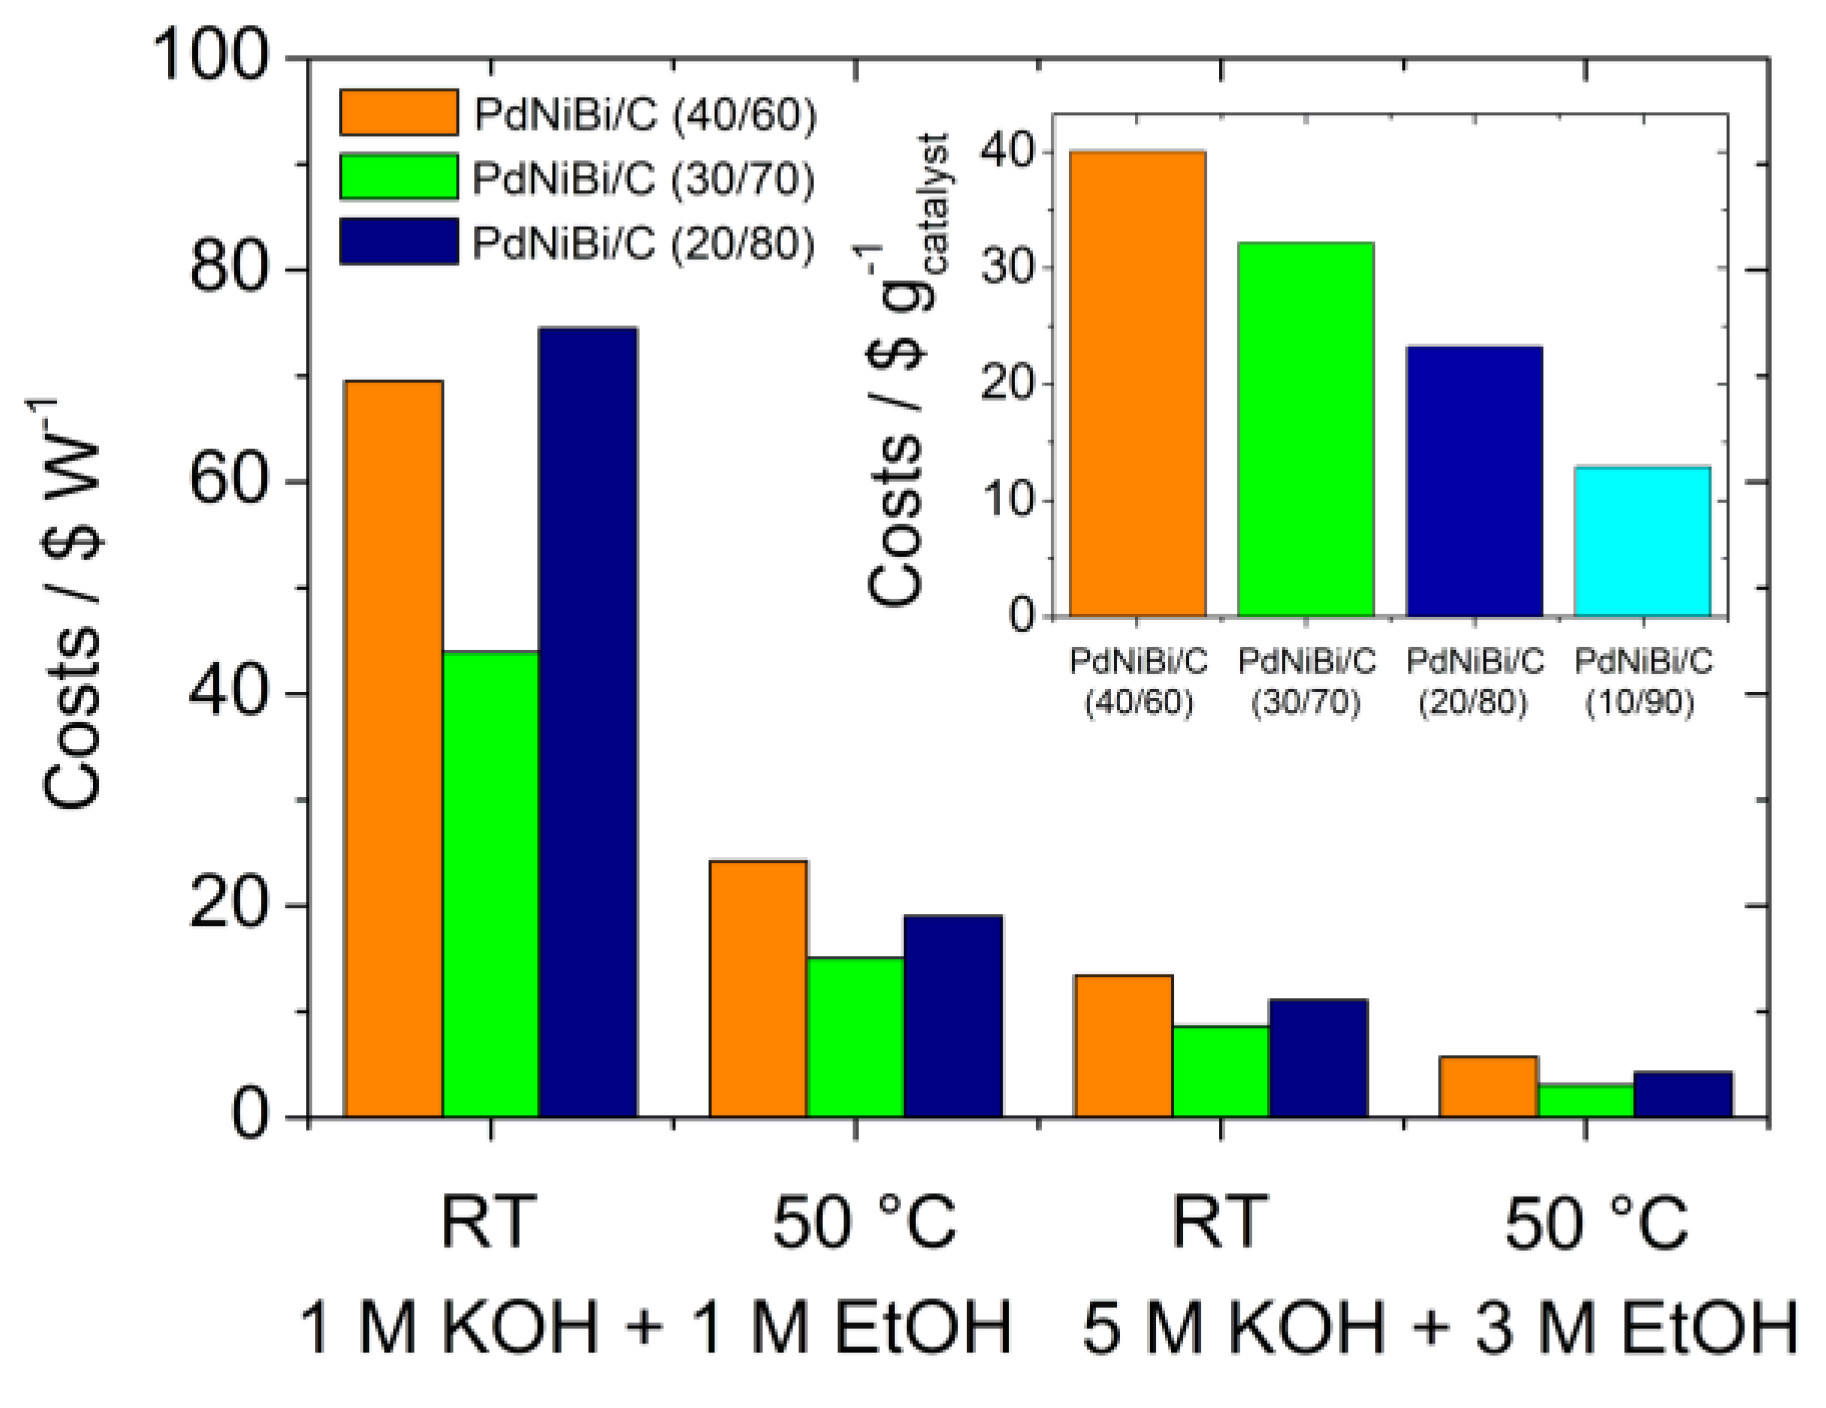
In summary, the PdNiBi/C (30/70) electrode showed the best performance, with an Pmax of 34.8 mW mg−1 at 50 °C, due to the higher activity of the catalyst and the enhanced catalyst-layer utilization. In comparison, the PdNiBi/C (20/80) electrode and the PdNiBi/C (40/60) electrode with the already published catalyst [34] only achieved values of 27.5 mW mg−1 and 17.5 mW mg−1, respectively, under the same conditions. Thus, the cell performance was doubled (an enlargement by almost 20 mW mg−1) by reducing the metal content of the catalyst from 40 wt.% to 30 wt.% and reducing the costs. In the context of cost reduction, a brief analysis was performed by considering the prices (27 October 2022, 16:03 UTC; exchange rate 1€ = 1$) of the metal salts and support material used (the main components of the whole catalyst and those that were varied), and the maximum power-density of the cell. The prices or costs in Figure 9 refer to the costs of the metal salts and support material for the anode catalyst and not to the costs of the entire cell, since the main focus of this work is on reducing the metal content of the anode catalyst.
The costs of the anode catalyst decreases with reduced metal-content (Figure 9 inset), since the Pd price is the driving factor. The use of the PdNiBi/C (30/70) catalyst is most economical, regardless of fuel concentration and temperature, when comparing the cell performance and the prices of the catalysts. It is noticeable that the utilization of the PdNiBi/C (20/80) at low temperature and low concentration is more expensive than the PdNiBi/C (40/60) catalyst. Otherwise, the price of the catalyst reduces in relation to the power as follows: PdNiBi/C (40/60) > PdNiBi/C (20/80) > PdNiBi/C (30/70). The price decreases as the temperature rises and the fuel concentration increases, due to the higher power output. Using 5 M KOH and 3 M EtOH as fuel at 50 °C, the costs of the PdNiBi/C (30/70) catalyst per W amounts to USD 3.08; for the PdNiBi/C (40/60) and the PdNiBi/C (20/80) to USD 5.73 and USD 4.23, respectively. Thus, the costs could be reduced by nearly 50%.
4. Conclusions
In this study, the metal content of the Pd85Ni10Bi5/C catalysts was successfully reduced, and the activity improved. The ECSA (695 cm2 mg−1) of the catalysts and the performance in terms of EOR were increased, resulting in high peak-current densities up to 3.72 A mg−1, which can be attributed to the more accessible metal particles. The reduction in the metal content of the PdNiBi/C catalysts also positively affects and improves the performance of the catalysts in MEAs in single-cell measurements in an ADEFC. The maximum power-density was doubled (enlargement by almost 20 mW mg−1) by reducing the metal content of the catalyst by 10 wt.% and keeping the metal loading on the electrode constant. A maximum power-density of 34.8 mW mg−1 was achieved at an operating temperature of 50 °C.
By this means, the costs of the prepared catalysts were reduced, the performance was increased and the influence of the metal/carbon ratio of the electrode on the cell measurement was shown.
Supplementary Materials
https://0-www-mdpi-com.brum.beds.ac.uk/article/10.3390/su142215485/s1, Table S1: Results of the layer-thickness calculation on the GC-RDE., Table S2: Chemical composition of the PdNiBi/C active-catalyst material determined by ICP-MS (Bi) and AAS (Pd, Ni) in at.%., Table S3: XRD data of the Pd85Ni10Bi5/C catalysts., Figure S1: SEM images with the dimensioning of the cross section of the different PdNiBi/C electrodes (catalyst on carbon cloth) (a) without catalyst; (b) with PdNiBi/C (40/60); (c) PdNiBi/C (30/70); and (d) PdNiBi/C (20/80)., Figure S2: SEM images of the PtRu/C cathode electrodes (a) blank carbon paper; (b) carbon paper with catalyst; (c) cross section of the blank carbon paper; (d) cross section of the carbon paper with catalyst. Figure S3: Electrochemical characterization of the PdNiBi/C catalysts with a scan rate of 10 mV s−1 at 30 °C in a potential range from 0.05 V–1.5 V vs. RHE in N2-purged 1 M KOH. Figure S4: Power density (filled symbols) and polarization curves (unfilled symbols) for the single-cell measurements of the different PdNiBi/C electrodes at different temperatures (RT, 36 °C, 43 °C, 50 °C) and different fuel concentrations (a) PdNiBi/C (20/80), 1 M KOH + 1 M EtOH; (b) PdNiBi/C (20/80), 5 M KOH + 3 M EtOH; (c) PdNiBi/C (30/70), 1 M KOH + 1 M EtOH, (d) PdNiBi/C (30/70), 5 M KOH + 3 M EtOH; (e) PdNiBi/C (40/60), 1 M KOH + 1 M EtOH; and (f) PdNiBi/C (40/60), 5 M KOH + 3 M EtOH.
Author Contributions
V.H. and B.G.; formal analysis, M.R., S.W. and B.G.; investigation, M.R., S.W. and B.G.; resources, V.H. and B.G.; data curation, M.R. and B.G.; writing—original draft preparation, M.R., S.W. and B.G.; writing—review and editing, V.H., B.G., M.R. and S.W.; visualization, M.R.; supervision, V.H. and B.G.; project administration, V.H. and B.G.; funding acquisition, V.H., B.G. and M.R. All authors have read and agreed to the published version of the manuscript.
Funding
This research was funded by the AUSTRIAN SCIENCE FUND (FWF), grant number I 3871-N37 in the frame of the project Graphene Oxide based MEAs for the Direct Ethanol Fuel Cell and the Slovenian research agency (ARRS) program P2 0423 and project N2-0087.
Institutional Review Board Statement
Not applicable.
Informed Consent Statement
Not applicable.
Data Availability Statement
The data that support the findings of this study are available within the article.
Acknowledgments
Special thanks to Marlene Anzengruber for her help in performing the measurements. Open Access Funding by the Austrian Science Fund (FWF) is gratefully acknowledged.
Conflicts of Interest
The authors declare no conflict of interest.
References
- Zhao, T.S.; Li, Y.S.; Shen, S.Y. Anion-Exchange Membrane Direct Ethanol Fuel Cells: Status and Perspective. Front. Energy Power Eng. China 2010, 4, 443–458. [Google Scholar] [CrossRef]
- An, L.; Zhao, T.S.; Li, Y.S. Carbon-Neutral Sustainable Energy Technology: Direct Ethanol Fuel Cells. Renew. Sustain. Energy Rev. 2015, 50, 1462–1468. [Google Scholar] [CrossRef]
- Gielen, D.; Boshell, F.; Saygin, D.; Bazilian, M.D.; Wagner, N.; Gorini, R. The Role of Renewable Energy in the Global Energy Transformation. Energy Strateg. Rev. 2019, 24, 38–50. [Google Scholar] [CrossRef]
- Shindell, D.; Smith, C.J. Climate and Air-Quality Benefits of a Realistic Phase-out of Fossil Fuels. Nature 2019, 573, 408–411. [Google Scholar] [CrossRef] [PubMed] [Green Version]
- Wolf, S.; Roschger, M.; Genorio, B.; Kolar, M.; Garstenauer, D.; Bitschnau, B.; Hacker, V. Ag-MnxOy on Graphene Oxide Derivatives as Oxygen Reduction Reaction Catalyst in Alkaline Direct Ethanol Fuel Cells. Catalysts 2022, 12, 780. [Google Scholar] [CrossRef]
- Yu, E.H.; Wang, X.; Krewer, U.; Li, L.; Scott, K. Direct Oxidation Alkaline Fuel Cells: From Materials to Systems. Energy Environ. Sci. 2012, 5, 5668–5680. [Google Scholar] [CrossRef] [Green Version]
- Wang, Y.; Shi, F.F.; Yang, Y.Y.; Cai, W. Bin. Carbon Supported Pd-Ni-P Nanoalloy as an Efficient Catalyst for Ethanol Electro-Oxidation in Alkaline Media. J. Power Sources 2013, 243, 369–373. [Google Scholar] [CrossRef]
- Wu, Q.; Jiang, L.; Qi, L.; Yuan, L.; Wang, E.; Sun, G. Electrocatalytic Activity and Stability of Ag-MnOx/C Composites toward Oxygen Reduction Reaction in Alkaline Solution. Electrochim. Acta 2014, 123, 167–175. [Google Scholar] [CrossRef]
- Neto, A.O.; Tusi, M.M.; De Oliveira Polanco, N.S.; Da Silva, S.G.; Coelho Dos Santos, M.; Spinacé, E.V. PdBi/C Electrocatalysts for Ethanol Electro-Oxidation in Alkaline Medium. Int. J. Hydrogen Energy 2011, 36, 10522–10526. [Google Scholar] [CrossRef]
- Roschger, M.; Wolf, S.; Mayer, K.; Singer, M.; Hacker, V. Alkaline Direct Ethanol Fuel Cell: Effect of the Anode Flow Field Design and the Setup Parameters on Performance. Energies 2022, 15, 7234. [Google Scholar] [CrossRef]
- Panwar, N.L.; Kaushik, S.C.; Kothari, S. Role of Renewable Energy Sources in Environmental Protection: A Review. Renew. Sustain. Energy Rev. 2011, 15, 1513–1524. [Google Scholar] [CrossRef]
- Muktham, R.; Bhargava, K.S.; Bankupalli, S.; Ball, A. A Review on 1st and 2nd Generation Bioethanol Production-Recent Progress. J. Sustain. Bioenergy Syst. 2016, 6, 72–92. [Google Scholar] [CrossRef] [Green Version]
- Shen, S.Y.; Zhao, T.S.; Wu, Q.X. Product Analysis of the Ethanol Oxidation Reaction on Palladium-Based Catalysts in an Anion-Exchange Membrane Fuel Cell Environment. Int. J. Hydrogen Energy 2012, 37, 575–582. [Google Scholar] [CrossRef]
- An, L.; Zhao, T.S. Transport Phenomena in Alkaline Direct Ethanol Fuel Cells for Sustainable Energy Production. J. Power Sources 2017, 341, 199–211. [Google Scholar] [CrossRef]
- Antolini, E. Catalysts for Direct Ethanol Fuel Cells. J. Power Sources 2007, 170, 1–12. [Google Scholar] [CrossRef]
- Zhang, Z.; Xin, L.; Sun, K.; Li, W. Pd-Ni Electrocatalysts for Efficient Ethanol Oxidation Reaction in Alkaline Electrolyte. Int. J. Hydrogen Energy 2011, 36, 12686–12697. [Google Scholar] [CrossRef]
- Shen, S.Y.; Zhao, T.S.; Xu, J.B.; Li, Y.S. Synthesis of PdNi Catalysts for the Oxidation of Ethanol in Alkaline Direct Ethanol Fuel Cells. J. Power Sources 2010, 195, 1001–1006. [Google Scholar] [CrossRef]
- Bilgen, S. Structure and Environmental Impact of Global Energy Consumption. Renew. Sustain. Energy Rev. 2014, 38, 890–902. [Google Scholar] [CrossRef]
- Kamarudin, M.Z.F.; Kamarudin, S.K.; Masdar, M.S.; Daud, W.R.W. Review: Direct Ethanol Fuel Cells. Int. J. Hydrogen Energy 2013, 38, 9438–9453. [Google Scholar] [CrossRef]
- Ma, L.; Chu, D.; Chen, R. Comparison of Ethanol Electro-Oxidation on Pt/C and Pd/C Catalysts in Alkaline Media. Int. J. Hydrogen Energy 2012, 37, 11185–11194. [Google Scholar] [CrossRef]
- Geraldes, A.N.; Da Silva, D.F.; Pino, E.S.; Da Silva, J.C.M.; De Souza, R.F.B.; Hammer, P.; Spinacé, E.V.; Neto, A.O.; Linardi, M.; Dos Santos, M.C. Ethanol Electro-Oxidation in an Alkaline Medium Using Pd/C, Au/C and PdAu/C Electrocatalysts Prepared by Electron Beam Irradiation. Electrochim. Acta 2013, 111, 455–465. [Google Scholar] [CrossRef]
- Wang, L.; Lavacchi, A.; Bevilacqua, M.; Bellini, M.; Fornasiero, P.; Filippi, J.; Innocenti, M.; Marchionni, A.; Miller, H.A.; Vizza, F. Energy Efficiency of Alkaline Direct Ethanol Fuel Cells Employing Nanostructured Palladium Electrocatalysts. Chem. Cat. Chem. 2015, 7, 2214–2221. [Google Scholar] [CrossRef]
- Lafforgue, C.; Maillard, F.; Martin, V.; Dubau, L.; Chatenet, M. Degradation of Carbon-Supported Platinum-Group-Metal Electrocatalysts in Alkaline Media Studied by in Situ Fourier Transform Infrared Spectroscopy and Identical-Location Transmission Electron Microscopy. ACS Catal. 2019, 9, 5613–5622. [Google Scholar] [CrossRef] [Green Version]
- Zhang, L.; Wang, H.; Li, X.; Xia, F.; Liu, Y.; Xu, X.; Gao, J.; Xing, F. One-Step Synthesis of Palladium-Gold-Silver Ternary Nanoparticles Supported on Reduced Graphene Oxide for the Electrooxidation of Methanol and Ethanol. Electrochim. Acta 2015, 172, 42–51. [Google Scholar] [CrossRef]
- Cai, J.; Huang, Y.; Guo, Y. Bi-Modified Pd/C Catalyst via Irreversible Adsorption and Its Catalytic Activity for Ethanol Oxidation in Alkaline Medium. Electrochim. Acta 2013, 99, 22–29. [Google Scholar] [CrossRef]
- Tan, J.L.; De Jesus, A.M.; Chua, S.L.; Sanetuntikul, J.; Shanmugam, S.; Tongol, B.J.V.; Kim, H. Preparation and Characterization of Palladium-Nickel on Graphene Oxide Support as Anode Catalyst for Alkaline Direct Ethanol Fuel Cell. Appl. Catal. A Gen. 2017, 531, 29–35. [Google Scholar] [CrossRef]
- Su, P.C.; Chen, H.S.; Chen, T.Y.; Liu, C.W.; Lee, C.H.; Lee, J.F.; Chan, T.S.; Wang, K.W. Enhancement of Electrochemical Properties of Pd/C Catalysts toward Ethanol Oxidation Reaction in Alkaline Solution through Ni and Au Alloying. Int. J. Hydrogen Energy 2013, 38, 4474–4482. [Google Scholar] [CrossRef]
- Ma, L.; He, H.; Hsu, A.; Chen, R. PdRu/C Catalysts for Ethanol Oxidation in Anion-Exchange Membrane Direct Ethanol Fuel Cells. J. Power Sources 2013, 241, 696–702. [Google Scholar] [CrossRef]
- Zhu, F.; Wang, M.; He, Y.; Ma, G.; Zhang, Z.; Wang, X. A Comparative Study of Elemental Additives (Ni, Co and Ag) on Electrocatalytic Activity Improvement of PdSn-Based Catalysts for Ethanol and Formic Acid Electro-Oxidation. Electrochim. Acta 2014, 148, 291–301. [Google Scholar] [CrossRef]
- Guo, J.; Chen, R.; Zhu, F.C.; Sun, S.G.; Villullas, H.M. New Understandings of Ethanol Oxidation Reaction Mechanism on Pd/C and Pd2Ru/C Catalysts in Alkaline Direct Ethanol Fuel Cells. Appl. Catal. B Environ. 2018, 224, 602–611. [Google Scholar] [CrossRef]
- Sekol, R.C.; Carmo, M.; Kumar, G.; Gittleson, F.; Doubek, G.; Sun, K.; Schroers, J.; Taylor, A.D. Pd-Ni-Cu-P Metallic Glass Nanowires for Methanol and Ethanol Oxidation in Alkaline Media. Int. J. Hydrogen Energy 2013, 38, 11248–11255. [Google Scholar] [CrossRef]
- Tusi, M.M.; Polanco, N.S.O.; Da Silva, S.G.; Spinacé, E.V.; Neto, A.O. The High Activity of PtBi/C Electrocatalysts for Ethanol Electro-Oxidation in Alkaline Medium. Electrochem. Commun. 2011, 13, 143–146. [Google Scholar] [CrossRef] [Green Version]
- Cermenek, B.; Ranninger, J.; Feketeföldi, B.; Letofsky-Papst, I.; Kienzl, N.; Bitschnau, B.; Hacker, V. Novel Highly Active Carbon Supported Ternary PdNiBi Nanoparticles as Anode Catalyst for the Alkaline Direct Ethanol Fuel Cell. Nano Res. 2019, 12, 683–693. [Google Scholar] [CrossRef] [Green Version]
- Cermenek, B.; Genorio, B.; Winter, T.; Wolf, S.; Connell, J.G.; Roschger, M.; Letofsky-Papst, I.; Kienzl, N.; Bitschnau, B.; Hacker, V. Alkaline Ethanol Oxidation Reaction on Carbon Supported Ternary PdNiBi Nanocatalyst Using Modified Instant Reduction Synthesis Method. Electrocatalysis 2020, 11, 203–214. [Google Scholar] [CrossRef] [PubMed] [Green Version]
- Yu, X.; Ye, S. Recent Advances in Activity and Durability Enhancement of Pt/C Catalytic Cathode in PEMFC. Part I. Physico-Chemical and Electronic Interaction between Pt and Carbon Support, and Activity Enhancement of Pt/C Catalyst. J. Power Sources 2007, 172, 133–144. [Google Scholar] [CrossRef]
- Kim, M.; Park, J.N.; Kim, H.; Song, S.; Lee, W.H. The Preparation of Pt/C Catalysts Using Various Carbon Materials for the Cathode of PEMFC. J. Power Sources 2006, 163, 93–97. [Google Scholar] [CrossRef]
- Tang, S.; Sun, G.; Qi, J.; Sun, S.; Guo, J.; Xin, Q.; Haarberg, G.M. Review of New Carbon Materials as Catalyst Supports in Direct Alcohol Fuel Cells. Chinese J. Catal. 2010, 31, 12–17. [Google Scholar] [CrossRef]
- Lobato, J.; Cañizares, P.; Ubeda, D.; Pinar, F.J.; Rodrigo, M.A. Testing PtRu/CNF Catalysts for a High Temperature Polybenzimidazole-Based Direct Ethanol Fuel Cell. Effect of Metal Content. Appl. Catal. B Environ. 2011, 106, 174–180. [Google Scholar] [CrossRef]
- Darab, M.; Barnett, A.O.; Lindbergh, G.; Thomassen, M.S.; Sunde, S. The Influence of Catalyst Layer Thickness on the Performance and Degradation of PEM Fuel Cell Cathodes with Constant Catalyst Loading. Electrochim. Acta 2017, 232, 505–516. [Google Scholar] [CrossRef] [Green Version]
- Yong, Y.W.; Azam, A.M.I.N.; Masdar, M.S.; Zainoodin, A.M.; Kamarudin, S.K. Anode Structure with Double-Catalyst Layers for Improving the Direct Ethanol Fuel Cell Performance. Int. J. Hydrogen Energy 2020, 45, 22302–22314. [Google Scholar] [CrossRef]
- Ekdharmasuit, P.; Therdthianwong, A.; Therdthianwong, S. Anode Structure Design for Generating High Stable Power Output for Direct Ethanol Fuel Cells. Fuel 2013, 113, 69–76. [Google Scholar] [CrossRef]
- Abdullah, S.; Kamarudin, S.K.; Hasran, U.A.; Masdar, M.S.; Daud, W.R.W. Electrochemical Kinetic and Mass Transfer Model for Direct Ethanol Alkaline Fuel Cell (DEAFC). J. Power Sources 2016, 320, 111–119. [Google Scholar] [CrossRef]
- James, D.D.; Pickup, P.G. Effects of Crossover on Product Yields Measured for Direct Ethanol Fuel Cells. Electrochim. Acta 2010, 55, 3824–3829. [Google Scholar] [CrossRef]
- Sundar Pethaiah, S.; Arunkumar, J.; Ramos, M.; Al-Jumaily, A.; Manivannan, N. The Impact of Anode Design on Fuel Crossover of Direct Ethanol Fuel Cell. Bull. Mater. Sci 2016, 39, 273–278. [Google Scholar] [CrossRef] [Green Version]
- Alzate, V.; Fatih, K.; Wang, H. Effect of Operating Parameters and Anode Diffusion Layer on the Direct Ethanol Fuel Cell Performance. J. Power Sources 2011, 196, 10625–10631. [Google Scholar] [CrossRef] [Green Version]
- Moreno-Jiménez, D.A.; Pacheco-Catalán, D.E.; Ordóñez, L.C. Influence of MEA Catalytic Layer Location and Air Supply on Open-CathodeDirect Ethanol Fuel Cell Performance. Int. J. Electrochem. Sci. 2015, 10, 8808–8822. [Google Scholar]
- Song, S.; Wang, G.; Zhou, W.; Zhao, X.; Sun, G.; Xin, Q.; Kontou, S.; Tsiakaras, P. The Effect of the MEA Preparation Procedure on Both Ethanol Crossover and DEFC Performance. J. Power Sources 2005, 140, 103–110. [Google Scholar] [CrossRef]
- Mayrhofer, K.J.J.; Strmcnik, D.; Blizanac, B.B.; Stamenkovic, V.; Arenz, M.; Markovic, N.M. Measurement of Oxygen Reduction Activities via the Rotating Disc Electrode Method: From Pt Model Surfaces to Carbon-Supported High Surface Area Catalysts. Electrochim. Acta 2008, 53, 3181–3188. [Google Scholar] [CrossRef]
- Grandi, M.; Mayer, K.; Gatalo, M.; Kapun, G.; Ruiz-Zepeda, F.; Marius, B.; Gaberšček, M.; Hacker, V. The Influence Catalyst Layer Thickness on Resistance Contributions of PEMFC Determined by Electrochemical Impedance Spectroscopy. Energies 2021, 14, 7299. [Google Scholar] [CrossRef]
- Casella, I.G.; Contursi, M. Characterization of Bismuth Adatom-Modified Palladium Electrodes. The Electrocatalytic Oxidation of Aliphatic Aldehydes in Alkaline Solutions. Electrochim. Acta 2006, 52, 649–657. [Google Scholar] [CrossRef]
- Simões, M.; Baranton, S.; Coutanceau, C. Influence of Bismuth on the Structure and Activity of Pt and Pd Nanocatalysts for the Direct Electrooxidation of NaBH4. Electrochim. Acta 2010, 56, 580–591. [Google Scholar] [CrossRef]
- Singh, R.N.; Singh, A.; Anindita. Electrocatalytic Activity of Binary and Ternary Composite Films of Pd, MWCNT, and Ni for Ethanol Electro-Oxidation in Alkaline Solutions. Carbon N.Y. 2009, 47, 271–278. [Google Scholar] [CrossRef]
- Jongsomjit, S.; Prapainainar, P.; Sombatmankhong, K. Synthesis and Characterisation of Pd-Ni-Sn Electrocatalyst for Use in Direct Ethanol Fuel Cells. Solid State Ionics 2016, 288, 147–153. [Google Scholar] [CrossRef]
- Liang, Z.X.; Zhao, T.S.; Xu, J.B.; Zhu, L.D. Mechanism Study of the Ethanol Oxidation Reaction on Palladium in Alkaline Media. Electrochim. Acta 2009, 54, 2203–2208. [Google Scholar] [CrossRef]
- Hofstead-Duffy, A.M.; Chen, D.J.; Sun, S.G.; Tong, Y.J. Origin of the Current Peak of Negative Scan in the Cyclic Voltammetry of Methanol Electro-Oxidation on Pt-Based Electrocatalysts: A Revisit to the Current Ratio Criterion. J. Mater. Chem. 2012, 22, 5205–5208. [Google Scholar] [CrossRef]
- Zhao, Y.; Li, X.; Schechter, J.M.; Yang, Y. Revisiting the Oxidation Peak in the Cathodic Scan of the Cyclic Voltammogram of Alcohol Oxidation on Noble Metal Electrodes. RSC Adv. 2016, 6, 5384–5390. [Google Scholar] [CrossRef]
Figure 1.
Schematic illustration of the synthesis route for the PdNiBi/C catalysts.

Figure 2.
X-ray diffraction patterns of all synthesized PdNiBi/C catalysts.

Figure 3.
Scanning electron microscopy images of the catalysts with low and high magnification (a,e) PdNiBi/C (40/60); (b,f) PdNiBi/C (30/70); (c,g) PdNiBi/C (20/80); and (d,h) PdNiBi/C (10/90).
Figure 3.
Scanning electron microscopy images of the catalysts with low and high magnification (a,e) PdNiBi/C (40/60); (b,f) PdNiBi/C (30/70); (c,g) PdNiBi/C (20/80); and (d,h) PdNiBi/C (10/90).

Figure 4.
Scanning electron microscopy images of the anode electrode (a,e) without catalyst—blank carbon cloth; (b,f) PdNiBi/C (40/60); (c,g) PdNiBi/C (30/70); and (d,h) PdNiBi/C (20/80).
Figure 4.
Scanning electron microscopy images of the anode electrode (a,e) without catalyst—blank carbon cloth; (b,f) PdNiBi/C (40/60); (c,g) PdNiBi/C (30/70); and (d,h) PdNiBi/C (20/80).

Figure 5.
(a) Cyclic voltammograms of the PdNiBi/C catalysts with a scan rate of 10 mV s−1 at 30 °C in N2-purged 1 M KOH; and (b) calculated electrochemical active-surface-area (ECSA).
Figure 5.
(a) Cyclic voltammograms of the PdNiBi/C catalysts with a scan rate of 10 mV s−1 at 30 °C in N2-purged 1 M KOH; and (b) calculated electrochemical active-surface-area (ECSA).

Figure 6.
(a) Ethanol oxidation reaction (EOR) curves of the PdNiBi/C catalysts in 1 M KOH and 1 M EtOH solution; (b) onset potentials (Eonset); (c) intensive activity js (jf or jb: max. current-density forward or backward scan); and (d) extensive activity Qs (Qf or Qb: charge-density forward or backward scan).

Figure 7.
(a) EOR stability-measurements; and (b) current-density decrease (jd).

Figure 8.
Power density (filled symbols) and polarization curves (unfilled symbols) of the single-cell measurements of the different PdNiBi/C electrodes at different operating conditions (a) 1 M KOH + 1 M EtOH at RT; (b) 1 M KOH + 1 M EtOH at 50 °C; (c) 5 M KOH + 3 M EtOH at RT; and (d) 5 M KOH + 3 M EtOH at 50 °C.

Figure 9.
Cost analysis of the different PdNiBi/C electrodes (inset: costs per catalyst) at different operating conditions.
Figure 9.
Cost analysis of the different PdNiBi/C electrodes (inset: costs per catalyst) at different operating conditions.


Table 1.
Elemental analysis of the PdNiBi/C catalysts by inductively coupled plasma-mass spectrometry (Bi) and atomic absorption spectroscopy (Pd, Ni) combined (in wt.%).
Table 1.
Elemental analysis of the PdNiBi/C catalysts by inductively coupled plasma-mass spectrometry (Bi) and atomic absorption spectroscopy (Pd, Ni) combined (in wt.%).
| Catalysts | Measured | Calculated | ||||||
|---|---|---|---|---|---|---|---|---|
| Pd | Ni | Bi | Totalmetal | Pd | Ni | Bi | Totalmetal | |
| PdNiBi/C (40/60) | 33.7 | 2.2 | 4.7 | 40.6 | 33.9 | 2.2 | 3.9 | 40 |
| PdNiBi/C (30/70) | 27.0 | 1.8 | 3.4 | 32.2 | 25.4 | 1.7 | 2.9 | 30 |
| PdNiBi/C (20/80) | 17.4 | 1.2 | 2.6 | 21.2 | 16.9 | 1.1 | 2.0 | 20 |
| PdNiBi/C (10/90) | 8.6 | 0.5 | 1.3 | 10.4 | 8.5 | 0.5 | 1.0 | 10 |
Table 2.
Electrochemical characterization results for all prepared PdNiBi/C catalysts.
| Catalyst | ECSA/cm2 mg−1 | Eonseta/V vs. RHE | jfb/A mg−1 | jbb/A mg−1 | Qfc/C mg−1 | Qbc/C mg−1 | jdd/% |
|---|---|---|---|---|---|---|---|
| PdNiBi/C (40/60) | 602 ± 87.0 | 0.20 ± 0.01 | 2.42 ± 0.13 | 1.84 ± 0.38 | 88.2 ± 9.18 | 25.3 ± 3.24 | 75.8 ± 9.8 |
| PdNiBi/C (30/70) | 671 ± 38.3 | 0.20 ± 0.02 | 3.00 ± 0.14 | 3.05 ± 0.45 | 83.2 ± 4.18 | 36.8 ± 3.94 | 78.9 ± 5.1 |
| PdNiBi/C (20/80) | 695 ± 64.3 | 0.24 ± 0.01 | 3.72 ± 0.33 | 3.70 ± 0.74 | 94.8 ± 3.25 | 43.2 ± 6.95 | 85.7 ± 3.2 |
| PdNiBi/C (10/90) | 614 ± 92.1 | 0.30 ± 0.02 | 3.67 ± 0.79 | 3.69 ± 1.02 | 78.5 ± 18.1 | 46.9 ± 10.0 | 97.1 ± 1.8 |
a onset potential for EOR at 0.02 mA; b maximum current-density of forward or backward scan of the EOR; c charge density of the integrated areas of forward or backward scan of the EOR; d current-density decrease during the CA measurement.
Table 3.
Comparison of the EOR performances of various Pd-based catalysts containing Ni or Bi.
| Catalyst a | Scan Rate/mV s−1 | Electrolyte + EtOH Concentration | Eonset/V vs. RE b | jf/mA mg−1 | jb/mA mg−1 | Ref. |
|---|---|---|---|---|---|---|
| comm. Pd/C | 10 | 1 M NaOH + 1 M EtOH | - | ~1400 | ~1900 | [20] |
| Pd2Ni1/C | 50 | 1 M NaOH + 1 M EtOH | −0.758 vs. Hg/HgO | 2956.6 | ~3400 | [16] |
| PdBi/C | 50 | 1 M KOH + 1 M EtOH | −0.75 vs. Hg/HgO | 5667 | - | [25] |
| PdNiP/C | 50 | 0.5 M NaOH + 1 M EtOH | −0.61 vs. SCE | 2533 | ~2400 | [7] |
| Pd2Sn2Ni1/C | 50 | 1 M KOH + 1 M EtOH | −0.50 vs. Hg/HgO | 463 | ~350 | [29] |
| Pd20%Ni10%Sn10%/CB | 50 | 1 M KOH + 1 M EtOH | −0.564 vs. Ag/AgCl | 2151 | - | [53] |
| PdNiBi/C (30/70) * | 10 | 1 M KOH + 1 M EtOH | 0.20 vs. RHE | 3000 | 3050 | This study |
| PdNiBi/C (20/80) * | 10 | 1 M KOH + 1 M EtOH | 0.24 vs. RHE | 3720 | 3700 | This study |
| PdNiBi/C (10/90) * | 10 | 1 M KOH + 1 M EtOH | 0.30 vs. RHE | 3670 | 3690 | This study |
a Pd content in all catalysts is 20 wt.%, except for the PdNiBi catalysts (* PdNiBi content varies); b RE: reference electrode.
Table 4.
Open-circuit voltage and maximum power-density values of the single-cell tests.
| Catalyst | Open Circuit Voltage/V | Pmax/mW mg−1PdNiBi | ||||||
|---|---|---|---|---|---|---|---|---|
| 1 M KOH + 1 M EtOH | 5 M KOH + 3 M EtOH | 1 M KOH + 1 M EtOH | 5 M KOH + 3 M EtOH | |||||
| RT | 50 °C | RT | 50 °C | RT | 50 °C | RT | 50 °C | |
| PdNiBi/C (40/60) | 0.92 | 0.93 | 0.96 | 1.05 | 1.43 | 4.14 | 7.46 | 17.5 |
| PdNiBi/C (30/70) | 0.87 | 0.93 | 0.93 | 1.05 | 2.44 | 7.11 | 12.4 | 34.8 |
| PdNiBi/C (20/80) | 0.87 | 0.95 | 0.98 | 1.08 | 1.56 | 6.11 | 10.5 | 27.5 |
Publisher’s Note: MDPI stays neutral with regard to jurisdictional claims in published maps and institutional affiliations. |
© 2022 by the authors. Licensee MDPI, Basel, Switzerland. This article is an open access article distributed under the terms and conditions of the Creative Commons Attribution (CC BY) license (https://creativecommons.org/licenses/by/4.0/).
Share and Cite
MDPI and ACS Style
Roschger, M.; Wolf, S.; Genorio, B.; Hacker, V. Effect of PdNiBi Metal Content: Cost Reduction in Alkaline Direct Ethanol Fuel Cells. Sustainability 2022, 14, 15485. https://0-doi-org.brum.beds.ac.uk/10.3390/su142215485
AMA Style
Roschger M, Wolf S, Genorio B, Hacker V. Effect of PdNiBi Metal Content: Cost Reduction in Alkaline Direct Ethanol Fuel Cells. Sustainability. 2022; 14(22):15485. https://0-doi-org.brum.beds.ac.uk/10.3390/su142215485
Chicago/Turabian StyleRoschger, Michaela, Sigrid Wolf, Boštjan Genorio, and Viktor Hacker. 2022. "Effect of PdNiBi Metal Content: Cost Reduction in Alkaline Direct Ethanol Fuel Cells" Sustainability 14, no. 22: 15485. https://0-doi-org.brum.beds.ac.uk/10.3390/su142215485
Note that from the first issue of 2016, this journal uses article numbers instead of page numbers. See further details here.