
Cultivation of Desmodesmus multivariabilis for the Treatment of Cosmetic Wastewater

1
Department of Chemical Engineering, Faculty of Engineering, Built Environment and Information Technology, University of Pretoria, Pretoria 0002, South Africa
2
Institute of Chemical Technology, Technische Universität Bergakademie Freiberg, Leipziger Straße 29, 09599 Freiberg, Germany
3
Td Lab Sustainable Mineral Resources, University for Continuing Education Krems, Dr.-Karl-Dorrek-Straße 30, 3500 Krems, Austria
*
Author to whom correspondence should be addressed.
Sustainability 2022, 14(23), 15665; https://0-doi-org.brum.beds.ac.uk/10.3390/su142315665
Submission received: 13 October 2022
/
Revised: 17 November 2022
/
Accepted: 22 November 2022
/
Published: 24 November 2022
(This article belongs to the Special Issue Cultivation of Microalgae and Sustainability)
Abstract
:The discharge of cosmetic wastewater into the wastewater treatment systems has become an environmental concern due to high concentrations of nutrients. The current study explored the phytoremediation potential of Desmodesmus multivariabilis, under mixotrophic growth, to remove total organic carbon (TOC), sulfur (TS), nitrogen (TN), and phosphorus (TP) from cosmetic wastewater (CWW). The CWW was prepared using samples supplied by a local cosmetic production company (two dyes, two hair relaxers, as well as two shampoos and conditioners). The bioremediation potential of D. multivariabilis was tested under four different conditions: raw CWW with 0% CO2 in the aeration stream (i.e., atmospheric air); pre-treated CWW with 0% CO2, 2.5% CO2, and 5% CO2. Control experiments were run in parallel. Under mixotrophic growth, the microalga performed best at 5% CO2 in the pre-treated CWW where TOC, TN, TP, and TS removal of >88%, >98%, >95%, and >90% were measured, respectively. The corresponding biomass (dry weight) was >203 mg/L. Relaxers promoted growth most prominently; however, it was observed that there was significant nutrient removal even in the absence of growth in all experiments. The growth followed Liebig’s Law, displaying three distinct phases (CO2 concentration, CO2 mass transfer, and nutrient limited growth). The results demonstrated the potential for the successful bioremediation of cosmetic wastewater by D. multivariabilis.
1. Introduction
Cultivation of microalgae occurs in a wide range of environments due to their high tolerance to stress induced by environmental factors. Microalgae are found in saltwater, freshwater, and wastewater and can be utilized in biofuel production or wastewater treatment [1]. Microalgae are often considered to be green bio-factories that can produce bioactive compounds. Microalgae are a valuable source of nutraceuticals and renewable energy due to their high growth rate, photosynthetic ability, carbon neutral/negative properties, high content of lipids and carbohydrate, and ability to obtain nutrients from wastewater [2,3].
In recent studies, microalgal cultivation has been combined with wastewater treatments. This negates the cost of nutrients and the use of freshwater that is needed for the cultivation of biomass while remediating the wastewater [4]. Wastewater treatment plants are increasingly concerned with nutrient removal because excess nitrogen and phosphorus in the wastewater may lead to downstream eutrophication and ecosystem damage. Moreover, growing microalgae can reduce nitrogen and phosphorous in wastewater to very low levels [5]. Due to the significant involvement of carbon fixation in the algal metabolism, the process has the potential for carbon neutral or even carbon negative operation, which is an imperative for climate change amelioration [6,7]. Significant research has been performed on the effects of greenhouse gases on climate change, and the amelioration of these effects has gained much traction [8,9].
Changes in cultivation conditions can affect microalgal growth rates, biomass growth rates, and their nutritional content, such as production of lipids and fatty acids [7,10,11,12,13,14]. These conditions include mode of cultivation, light/dark cycles, and nutrients such as carbon, nitrogen, phosphorus, pH, salinity, and temperature [2,4,11,15]. There are several ways to cultivate microalgae, including photoautotrophic, heterotrophic, and mixotrophic cultures [16]. Some microalgal species can grow in both photoautotrophic and heterotrophic conditions. When grown in heterotrophic conditions, green algae can use organic compounds as their source of energy in the absence of light. When growing in a mixotrophic environment, organisms may use both light and organic compounds [4,16].
Microalgae can help to fix carbon dioxide from industrial exhaust gases, as well as consume dissolved inorganic carbon from the surrounding environment for the purpose of active photosynthesis [2,17]. CO2 can be sourced from waste gas such as biogas and flue gas. Flue gas compositions vary depending on the difference sources of fuel. Gas emitted by a plant powered by coal typically contains CO2 in the range of 10–15% CO2 [18,19]. In addition, CO2 can be crucial for pH control: Each microalgal species has a specific pH range that maximizes the production of cells and lipids. This range is narrow and specific to each strain [17]. The pH of microalgal cultures rises steadily throughout the day as the microalgae take up inorganic carbon. Higher pH levels limit the availability of carbon dioxide, thus, inhibiting biomass growth. On the other hand, growing algae at a high pH can suppress unwanted biological pollutants [17].
Since most wastewater streams are low in total carbon, the supply of CO2 (as a source of carbon) is important for photosynthesis, the fixation of carbon dioxide, and the generation of cells with desired products in microalgae. Bubbling CO2 into algae treated wastewater was shown to increase the biomass of the microalgae and reduce nutrients and elements such as Al, As, Cd, Ni, and Zn [20].
One of the hydrodynamic variables related to the growth of microalgae and the effectiveness of the removal of CO2 is the mass transfer of CO2. The mass transfer of carbon dioxide from the air into the media can be a limiting factor in dense algal cultures. The rate of transfer of carbon dioxide (CO2) from a gas to a liquid depends on many factors, such as the flow rate of the gas, the CO2 partial pressure, the size and duration of the bubbles, and the lifetime of the gas/liquid mixture. The gas–liquid mass transfer coefficient (kLa) value (CO2) is a general hydrodynamic parameter that is often used to evaluate the functioning of the bioreactor in the cultivation of microalgae. The high value of kLa indicates improved mass transfer of CO2 to the microalgal culture [21]. The determination of CO2 transfer rate is very important because it affects algal biological and physicochemical processes and the concentration of CO2 in solution [22].
Types of wastewater that have been successfully tested for potential growth of algae include piggery wastewater, municipal wastewater, monosodium glutamate wastewater, and industrial wastewater such as pulp and paper and dairy wastewater [4,20]. An excellent example is the study on Scenedesmus sphaerocephalus, which was used to treat wastewater from swine farms, and it was reported that the removal of P, N, and TOC in piggery wastewater was 83%, 87%, and 12%, respectively, within 40 days [10,23].
The current state of knowledge concerning wastewater treatment from the cosmetic industry is low, as evidenced by the scarcity of publications related to this topic. The cosmetic industry generates wastewater with high levels of COD (>100,000 mg/L), BOD5, and TOC and high concentrations of petroleum ether extracts, organic nitrogen, organic phosphorus, suspended solids, grease, oils, and detergents (>1700 mg/L) [24]. The generated wastewater contains a combination of various chemicals such as acids, alkalis, dyes, expanders, bleaching agents, and other organic and inorganic compounds. These substances can to a large extent be toxic to humans and the environment and can accumulate in many components of ecosystems [25,26].
Different types of treatment processes are used to treat cosmetic waste, mainly by coagulation/flocculation [27], ultra-filtration, advanced oxidation and catalytic wet peroxide oxidation processes [28]. Current studies on cosmetic wastewater in South Africa utilize rapid granular multimedia filtration systems. It was noted that nutrient removal was up to 98% and organics removal was up to 68% [25]. However, the widespread application of this technology has not yet been realized and the majority of cosmetic wastewater is discharged directly to the sewer and, subsequently, conventional wastewater treatment plants, where it adds to the already strained water treatment system [25]. The cheapest and most widely used cosmetic wastewater treatment method is the application of biological processes. However, the effect obtained is not always satisfactory, especially in the case of high concentrations of oils and greases, and studies have shown that surfactants, especially at higher concentrations, can significantly impair biological processes [26,29].
Microalgal phyco-valorization of wastewater and waste gas is a promising technology that offers the integration of wastewater treatment, greenhouse gas generation, and the usage of fossil fuel alternatives into a single solution. Despite the immense potential that this emerging technology may hold, there has not yet been any significant commercialization [30].
The main aim of this study was to research the improvement of low-carbon cosmetic wastewater treatment with the addition of CO2 and explore biomass growth rates and nutrient uptake due to culturing microalgae in low organic carbon cosmetic wastewater supplemented with CO2. This study analyzed synthetic cosmetic wastewater before and after pre-treatment to identify the components of the wastewater. The concentration of carbon dioxide and the ensuing ratio of organic to inorganic carbon in the media were varied. This was achieved by diluting CO2 with air to CO2 concentrations at 0%, 2.5%, and 5%, respectively. The study was limited to ambient temperatures and pressures.
The research will provide a starting point for further research into treating cosmetic wastewater and waste gas streams together in an integrated process, which holds a potential economic benefit as growing algae on site may yield valuable biomass.
2. Materials and Methods
2.1. Microlagal Culture Source and Preparation
The microalgae culture was extracted from cultures isolated from the Hartbeespoort Dam reservoir, a eutrophic dam in the North West province of South Africa [31]. Algal samples used for identification were isolated using the streak plating technique and cultivated in Bold’s Basal Medium with three-fold nitrogen and vitamins (3N-BBM+V) [32]. The identity of the algae was confirmed as Desmodesmus multivariabilis [19]. Before inoculation, algal starter cultures were cultivated to a cell density of 200–450 mg/L in 3N-BBM+V. Starter cultures were cultivated for at least three weeks before being used for inoculation.
2.2. Cosmetic Wastewater Source and Preparation
The raw wastewater contained suspended matter or particulates and possibly harmful pathogens that could interfere with the experimental results. It was, therefore, treated by filtration and sterilization (by autoclaving) before use [33]. It was filtered two to three times by using vacuum filtration. A filter flask (all glassware used, unless otherwise stated, was manufactured by Schott-Duran (Jena, Germany) and supplied by Glassworld, Johannesburg, South Africa) was connected to a vacuum pump (Sartorius (Gottingen, Germany), supplied by Labotec (Johannesburg, South Africa), and Whatman No. 1 filter paper (supplied by Glassworld, Johannesburg, South Africa) was used. The hair products were provided by the research group at L’Oréal South Africa and prepared at the Water Utilisation laboratories at the University of Pretoria, as shown in Table 1.
After filtration, the wastewater was characterized and then transferred to 3-L glass jars (Consol, South Africa), supplied by Plastilon (Pretoria, South Africa), which were sealed and autoclaved at 121 °C at 2 bar (using a Hirayama HV-series autoclave supplied by Labotec, Johannesburg, South Africa) for 20 min before being stored at 4 °C for long-term storage.
2.3. Carbon Dioxide Source and Preparation
Simulated flue gas (801240-IE-A–GOC MIX 1017) was obtained from African Oxygen Limited (trading as AFROX, Johannesburg, South Africa) with a certified volumetric CO2 content of 12.35–13.65%, the balance being made up of oxygen (19–21%) and nitrogen. Analytical grade air (513207-SE-C–AIR IG ZERO), also from African Oxygen Limited, was used to dilute the flue gas to the desired concentration. Atmospheric air was used to supply two of the experiments that were not enriched with CO2, using an off-the-shelf aquarium pump (model AP318) from Daro (Pretoria, South Africa).
2.4. Experimental Design and Planning
The lighting was supplied by a lighting rig equipped with 2 × Osram L 36W/77 Floura fluorescent bulbs per experiment, with two rigs in total per run. A light/dark cycle of 14/10 h was used to approximate optimal conditions experienced by the microalgae in their natural environment, i.e., the lighting conditions experienced by the micro-organism during the summer months. The reactors themselves were designed to minimize contact with unfiltered atmospheric air. Figure 1 and Table 2 summarize the experimental set up.
Experiments supplied with the air-CO2 are termed “active aerated experiments”, while those that only received air from the atmosphere are termed “passive aerated experiments”.
2.5. Sampling and Methods of Analysis
Sampling of the reactor content was performed twice a day for the duration of the experiments, and the media was stored in 10 mL centrifuge tubes. Ultraviolet-visible spectrophotometry (WPA LightWave II, supplied by Labotech, Johannesburg, South Africa) was used to track the growth of the algae in the mixed liquor. The growth was tracked at 680, 660, and 600 nm.
A Hettich Universal 320R Centrifuge was used for biomass separation by centrifuging at 6500 RPM for 10 min. The biomass was dried using Mettler-Toledo XS205 Dual Range at 50 °C for 24 h before being weighed. This was recorded as the dry weight cell biomass. Filtration through Whatman No. 1 filter paper was performed before the samples were diluted to a ratio of 1:30 with distilled water prior to TOC analysis.
The experiments were performed until there was a noticeable decrease in growth and the cultures started exhibiting maintenance growth characteristics, i.e., metabolically active yet non-reproducing. The growth and mixed liquor were harvested after termination, and the cellular material was separated using centrifuging. The supernatant, which is cell-free, was analyzed for organic carbon, nitrogen, pH, sulfur, and phosphorus concentration.
A TOC analyzer (Shimadzu TOC-VWP, supplied by Shimadzu Corporation, Kyoto, Japan) was used for analysis of the TOC concentration of the supernatant. Total nitrogen analysis was performed using the Spectroquant 14763 and 14537 kits with the Spectroquant Nova 60 spectrophotometer (all Spectroquant kits and accessories were manufactured and supplied by Merck, Darmstadt, Germany). For chemical oxygen demand (COD) analysis, the Lovibond 2420721 kit was used with a Lovibond COD Vario photometer (Model number 209250; all Lovibond kits and accessories were supplied by Selectech, Johannesburg, South Africa). A Hanna Instruments analyzer and analysis kit (HI 93717, supplied by Hanna instruments, Woonsocket, RI, USA) was used for total phosphate analysis. Total sulphate (TS) analysis was performed using the Spectroquant 14763 and 14537 kits with the Spectroquant Nova 60 spectrophotometer (all Spectroquant kits and accessories were manufactured and supplied by Merck, Darmstadt, Germany).
The algal sample was placed in the cooled-down crucible, which was placed in the Shimadzu TOC-SSM 5000A solid TOC (total organic carbon) analyzer, which operates with analytical oxygen as an oxidizer and nitrogen as carrier gas (both gases are instrument grade, obtained from Afrox, Johannesburg, South Africa).
2.6. Definition of Data Metrics
Analysis of data was then performed, with a summary shown in Table 3:
2.7. Wastewater Characterization and Initial Growth Profiles
Growth was measured by performing both UV-Vis growth measurement and gravimetric growth measurement to have a form of inherent redundancy in the results that would ensure the robustness of the data presented [35]. To reduce the amount of scattering, which was required to build a good correlation, the results of all three wavelengths were fed into an optimization where the parameters in Equation (8) were optimized to maximize the R2 obtained [36].
Linearized graphs of cell density vs optimized absorptivity were plotted for all six media, and results are given in Table 4. The regression of the cellular density over the absorptivity (results of the UV-Vis measurement from all the experiments were combined for every wavelength) showed a linear correlation, with the R2 value of the fit being 0.82 and 0.97 for the relaxers, 0.96 and 0.94 for the dyes, and finally, 0.95 and 0.93 for the shampoos and conditioners.
The wastewater characterization indicated that the dyes contained the highest initial concentration of organics in the media; Table 5 shows the results from the initial characterization.
3. Results and Discussion
3.1. Growth of Profiles of Desmodesmus multivariabilis in Cosmetic Wastewater
This section of the study investigated whether Desmodesmus multivariabilis effectively removed the TOC, COD, and total phosphorus (TP), total sulfur (TS), and total nitrogen (TN) from cosmetic wastewater while simultaneously monitoring the resulting biomass growth. The batch reactors that were inoculated with D. multivariabilis showed better nutrient removal performance than the control experiment. Rapid growth was observed in experiments that were pre-treated and supplemented with CO2.
Cultures in Experiments 3 and 4 showcased the most rapid growth, and it was noted that the cultures reached the stationary phase in the shortest period. The cell concentrations and growth rate of cells harvested are shown in Table 6. Harvesting of the biomass was inhibited in the media with the shampoos and conditioners (SC1 and SC2) due to the presence of surfactants and the media with the dyes (D1 and D2) due to the suspended particles of the pigments. The biomass was embedded in the surfactants, and the dye pigments and flocculation of the algae was prevented. This caused the discrepancy in the values of the harvested biomass and the calculated cellular biomass. However, gravitational analysis was deemed more accurate than spectrographic analysis due to the morphology of the cosmetic wastewater.
The growth parameters i.e., total dry weight, specific biomass, and average biomass yield, are shown below in Table 6.
Figure 2 shows the general growth response of Desmodesmus multivariabilis at different concentrations of CO2. These profiles indicate that the dry weight of biomass as growth response was affected by the flow rate and concentration of CO2 that was injected into the photobioreactor. In all cultures of Experiments 1 and 2, there was a poor growth response compared to the cultures in Experiments 3 and 4. It is remarkable to note the differences in the error bars between the different media—nearly negligible error bars were measured in R1 and R2, while significant differences in the measured biomass concentrations were observed for D1, D2, SC1, and SC2. This was likely due to the interaction between the algal biomass and the surfactants and suspended dye particles present in the media, as mentioned previously.
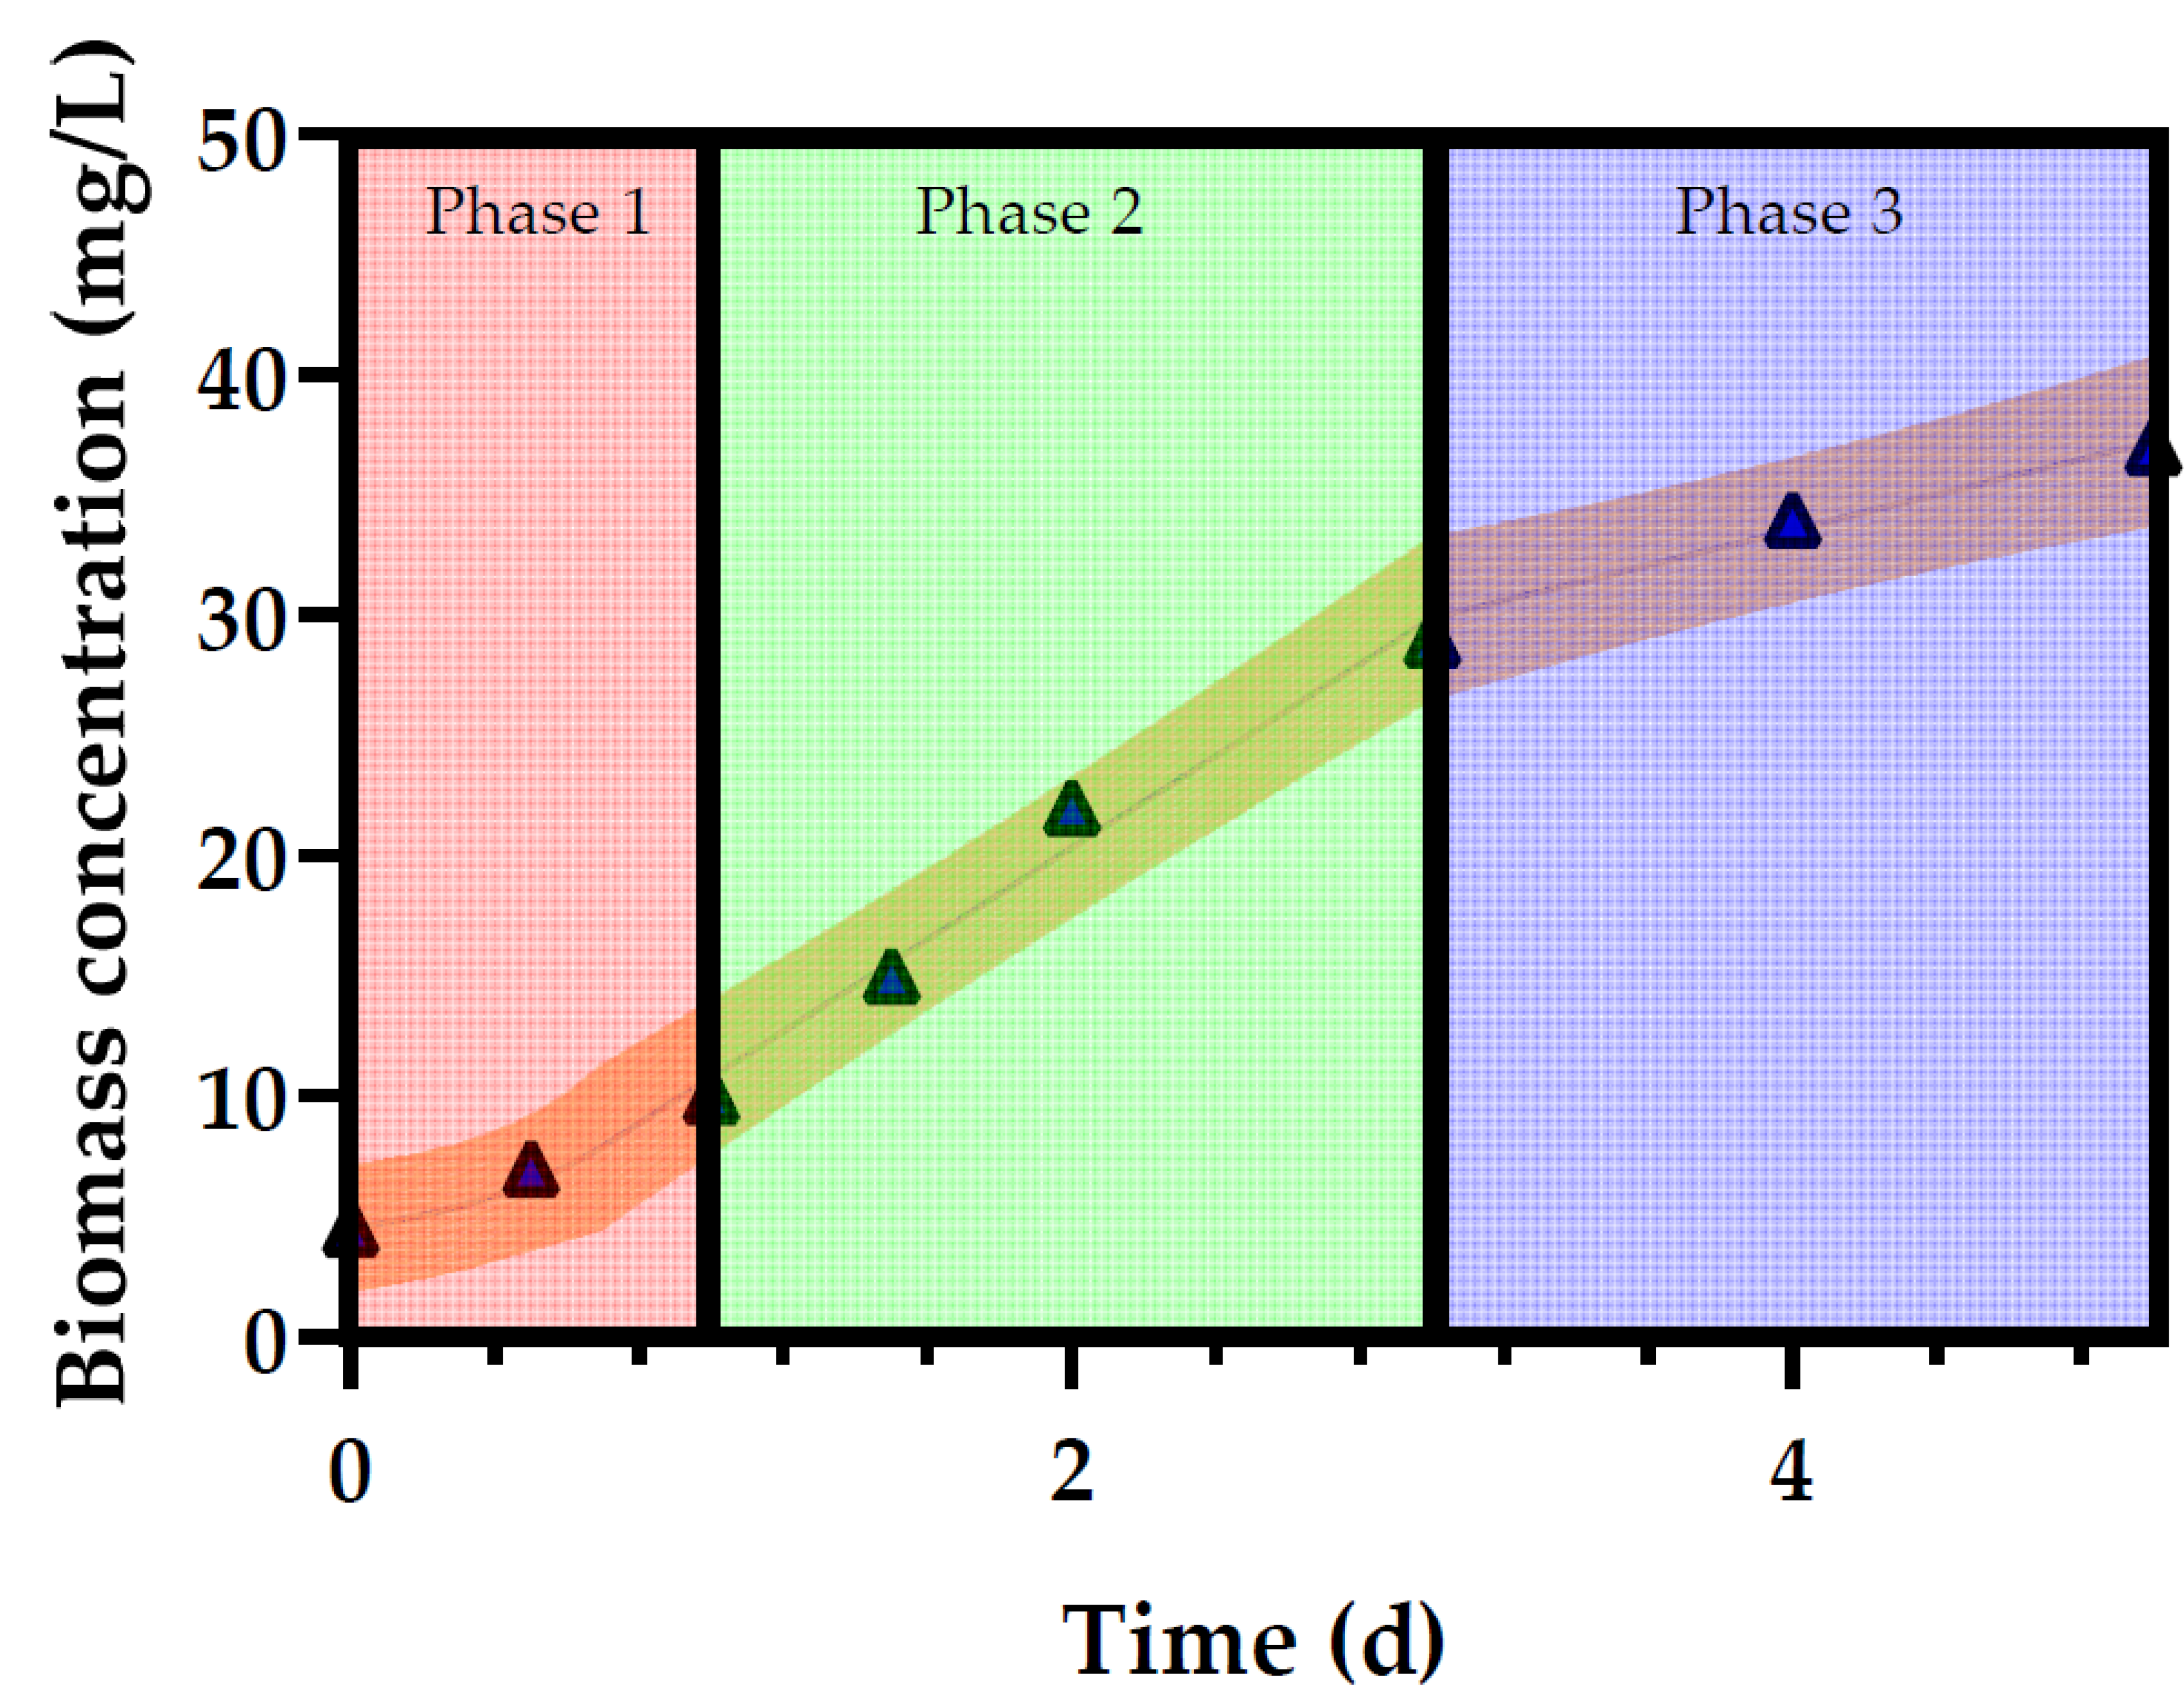
The profiles in Figure 3 were fitted using Liebig’s Law [22], which proposes that the growth of an organism is limited by the rate permitted by the most limiting factor. The model can be described by Equation (9):
where μi represents the specific growth rate of the microalgae as it relates to nutrient i, kLa represents the gas-liquid mass transfer coefficient of CO2 in the liquid, and pCO2 represents the partial pressure of CO2 in the gas phase.
The results demonstrated that for the conditions tested, three phases of growth could be observed. These phases are illustrated in Figure 3 below and represent a growth-rate-controlled (Phase 1), a CO2-mass-transfer rate-controlled (Phase 2), and a final-growth-rate-controlled phase (Phase 3).
3.2. Relationship between the Observed Specific Growth Rate and CO2 Availability
The values of the determined specific growth rates and slopes are shown in Table 7 below.
To determine the kLa values, the slopes of the curves in phase 2 () were plotted against the partial pressure of CO2 in the sparged gas. The fits obtained are shown in Figure 4, and the fitted kLa values are reported in Table 8; the results clearly demonstrate that mass transfer of CO2 was the dominant rate-limiting step in phase 2.
From Table 8, it can clearly be seen that a marked difference between the kLa values was measured as it relates to the specific wastewater treated. This is interesting as it would indicate that the nature of the wastewater itself, as opposed to the reactor configuration, affects the mass transfer of CO2 to the liquid phase. According to Kraakman et al. [38], variations in gas–liquid mass transfer were traditionally associated with changes in power applied to the system, i.e., through agitation, sparging, etc. In contrast, a more nuanced approach to the factors affecting mass transfer in biological systems is gaining traction to ensure a reduction in the power requirements of these systems. Due to the complex nature of these systems, the factors influencing mass transfer include the physico-chemical properties of the gas; the medium properties such as viscosity, salt, and organic content; the reactor characteristics (hydrodynamic behavior, surface area, etc.); and the operating conditions (e.g., gas/liquid velocity, pH, temperature) [38]. Within the system under consideration, the factors that varied between the different media runs were the wastewater properties, with significant difference measured between specifically the compositions. Barton et al. [39] found that changes of several orders of magnitude in the Henry’s constant were observed due to the presence of organics in a bioreactor media.
To determine if a relationship between the observed specific growth rate and CO2 availability existed, the values for μ1 and μ3 were plotted against the pCO2 (Figure 5).
The results suggest that a positive relationship between μ1 and pCO2 exists, while a much more tenuous relationship between μ3 and pCO2 was observed. This indicates that the rate-limiting nutrient in phase 1 is likely the CO2, while some other nutrient (e.g., TP, TN, TOC) limited the growth in phase 3 [40].
3.3. Cell Organics Concentration Profiles in Cosmetic Wastewater
For Experiment 1 (with 0% carbon dioxide and raw wastewater), the extracellular organics depleted steadily in all six media. During the lag phase of the experiment (4 days for the dyes, 6 days for the relaxers, and 8 days for the shampoo and conditioners), the organics decreased steadily by less than an average of 10% in all the media. During the log phase (3 days for the dyes, 5 for the relaxers, and 5 days for the shampoo and conditioners), the organics depleted at a faster rate in this phase for the relaxers and the shampoos and conditioners at an average percentage of 20%. Table 9 shows the results obtained from nutrient analysis.
The TOC concentrations in the dyes depleted at a slower rate during the initial phase of growth at an average of 10%. Transitioning from the lag phase into the stationary phase, it was noted that the organics were consumed by 25% in R1, 23% in R2, 24% in D1, 28% in D2, 29% in SC1, and 23% in SC2. These observations were similar to those in Experiment 2 (with 0% carbon dioxide and pre-treated wastewater); the extracellular organics depleted steadily in all six media. By the end of the experiments, there was a net reduction in organics in the wastewater by 25% in R1, 23% in R2, 24% in D1, 28% in D2, 29% in SC1, and 23% in SC2.
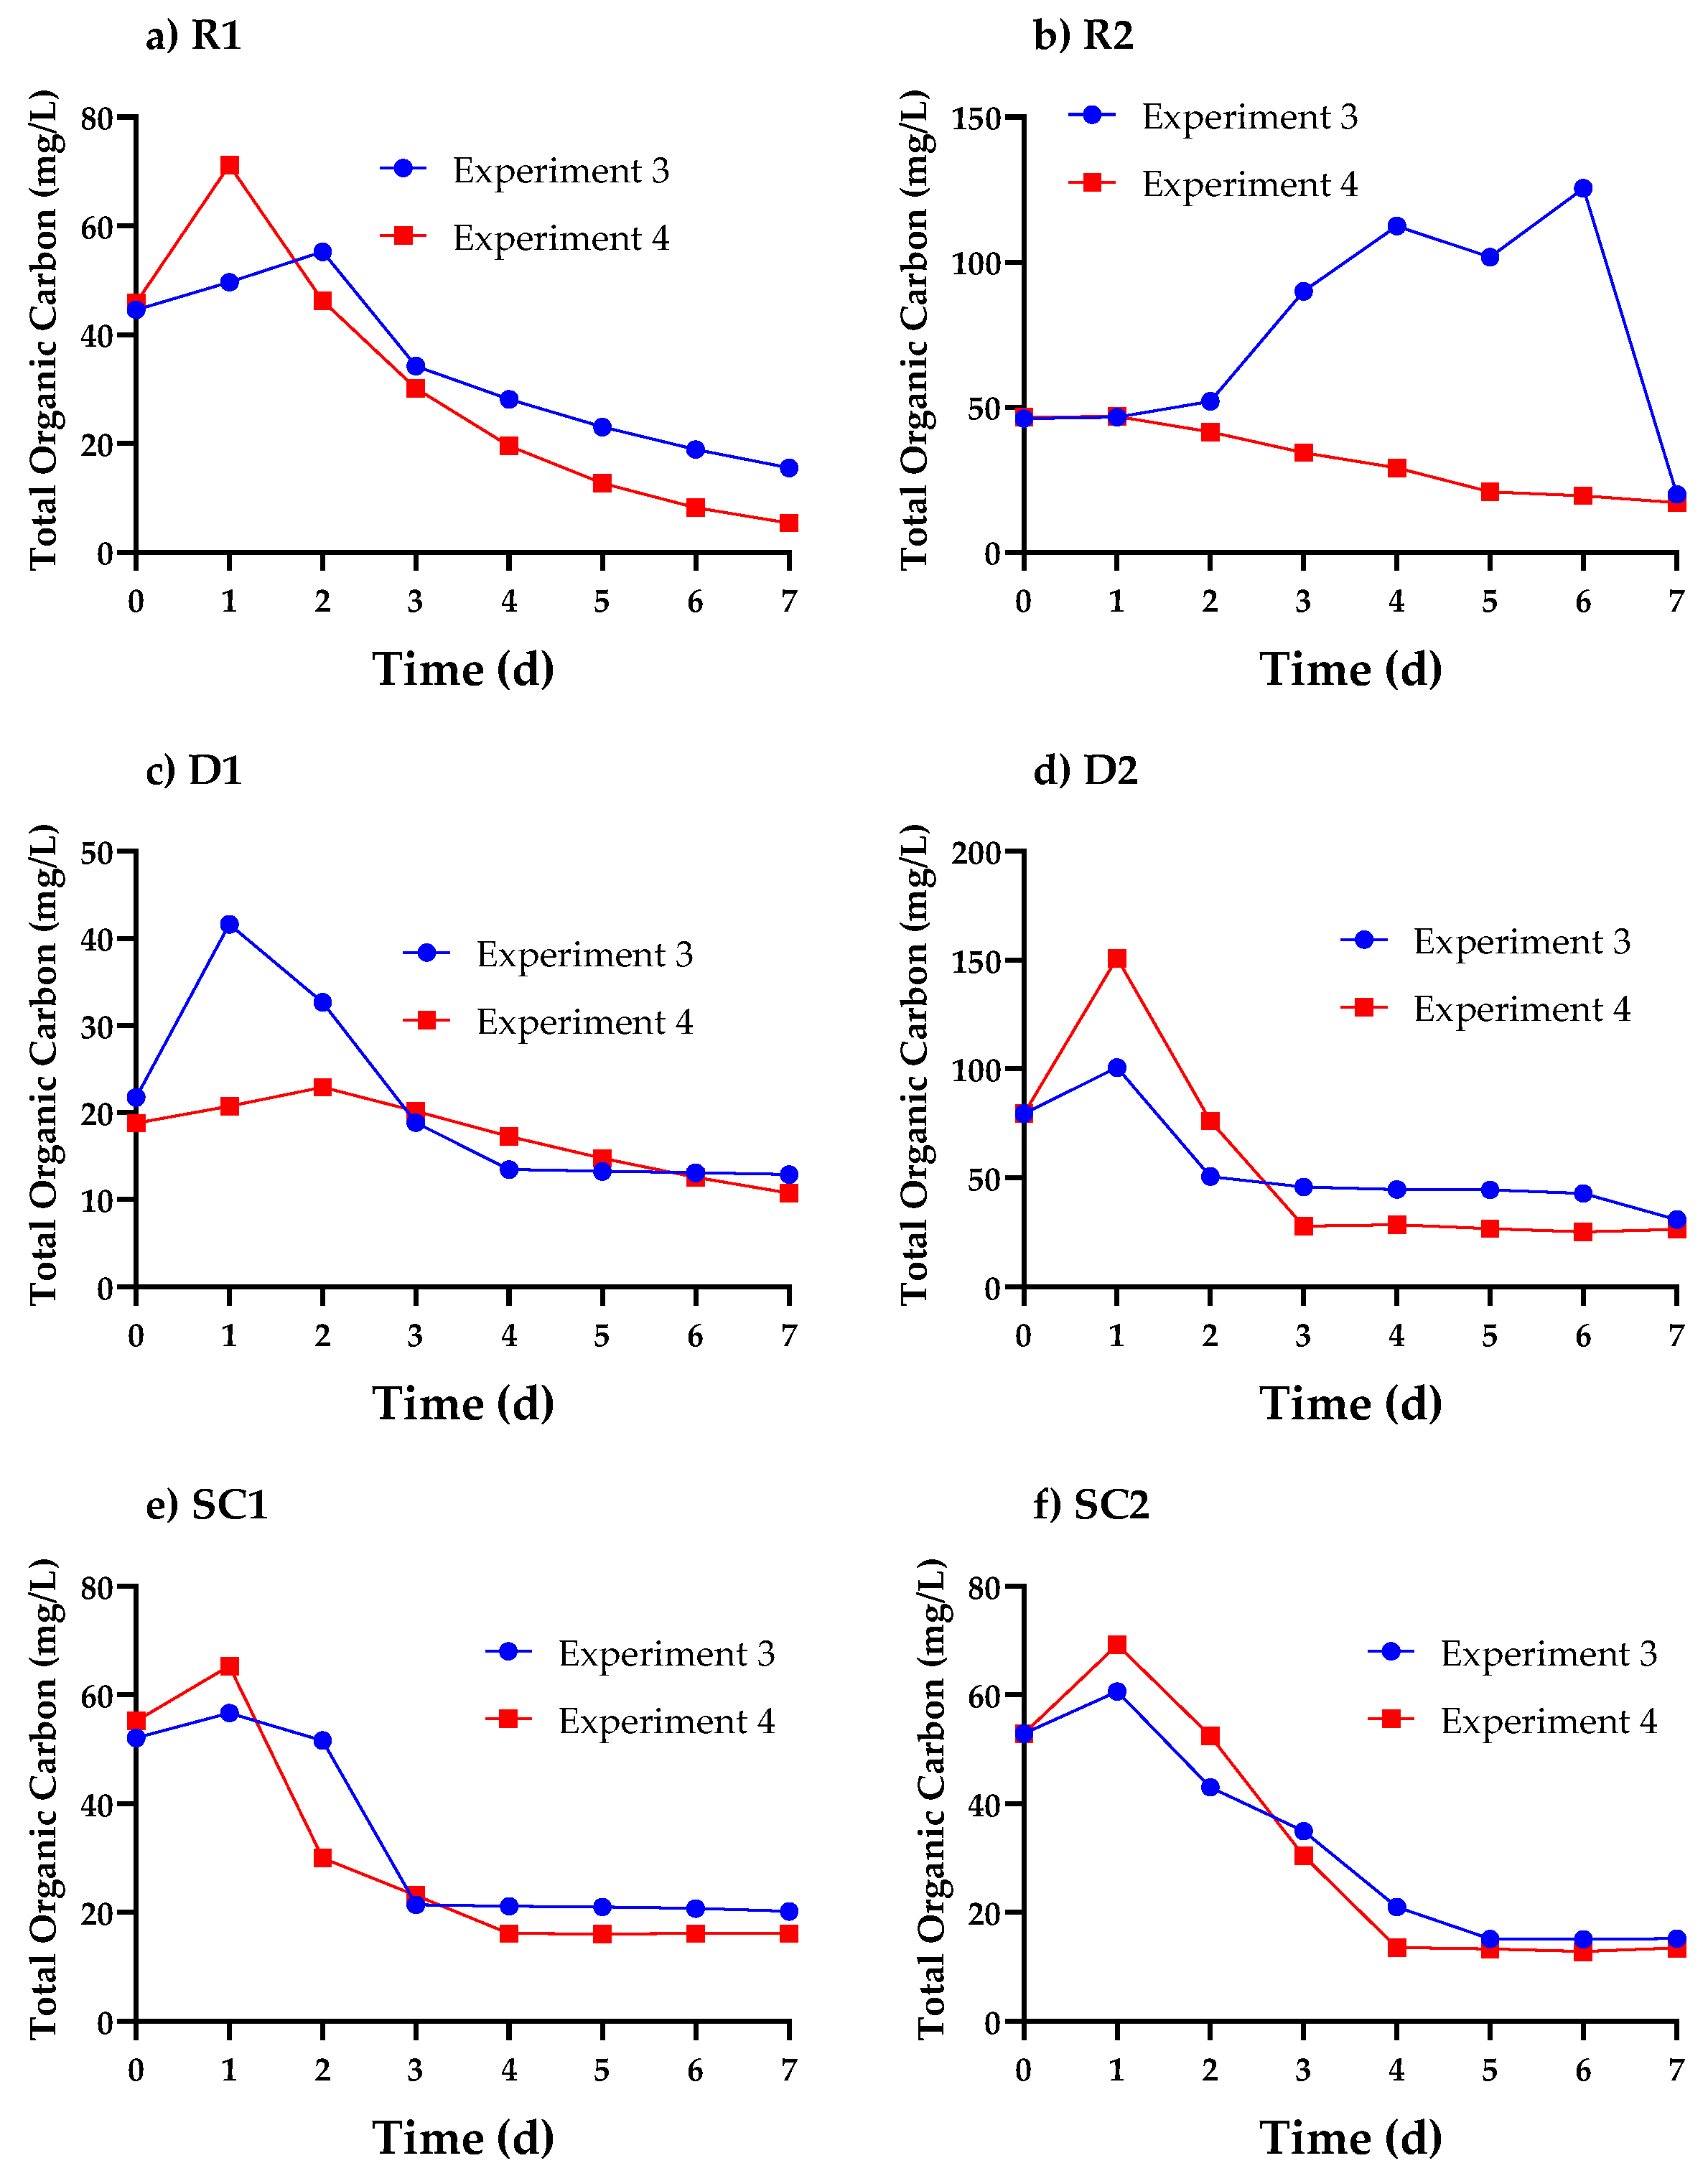
For experiments 3 and 4 (with 2.5% and 5% CO2 in pre-treated wastewater), the concentrations of organics initially increased in the media for R1, R2, SC1, and SC2. In experiment 3, the initial increase in the cell organics was significantly lower, being 69–78% in the relaxers and 33–47% in the shampoos and conditioners, respectively, while in Experiment 4, the organics had increased by over 193–181% in the relaxers and 196–203% in the shampoos and conditioners. Thereafter, the organics concentration gradually decreased with time, seemingly as the extracellular organics initially produced were consumed during cellular growth.
In the control experiment (with raw wastewater and no biomass activity), there was no significant change in the mass of organics in all six media. As indicated previously in Section 3.1 and adding to that observation, the harvesting of the biomass was also complicated by the presence of certain unknown organic compounds in the media and the low biomass growth rates, which inhibited the settling and flocculation of the cells. The COD removal and consumption in Experiment 4 achieved the highest removal percentage.
It was observed that the concentrations of TOC and COD decreased with time, as shown in Table 9, demonstrating the potential of D. multivariabilis for removal of these nutrients from the solution.
3.4. Nutrient Concentration Profiles in Cosmetic Wastewater
In the control experiment where there was no growth, nutrient removal was less than 10% in all six media, confirming these removals can be attributed to biological activity.
TN and TS consumption were observed most prominently when growth occurred. TN and TS were removed by less than 30% and 60% by the end of Experiments 1 and 2, respectively, where the growth of biomass was significantly suppressed. In Experiments 3 and 4 where significant growth was observed in the relaxers, shampoos, and conditioners, TN concentration removal was observed to be correspondingly high. It was observed that the concentrations of TN, TP, and TS decreased with time, as shown in Table 10, demonstrating the potential of D. multivariabilis for removal of theses nutrients from a solution.
In contrast to the TN findings, TP consumption was more pronounced in the experiments and media where growth was less significant. This could likely be explained by the precipitation of phosphates at high pH due to the elevated pH resulting from photosynthesis [41]—as observed for Exp 1 and 2 in all media (Table 10).
In similar studies, the TN concentration was reduced by an average of 86% in the reactor grown with C. Vulgaris. The SO42- and PO43- removal efficiencies were >85% and >95%, respectively [42,43].
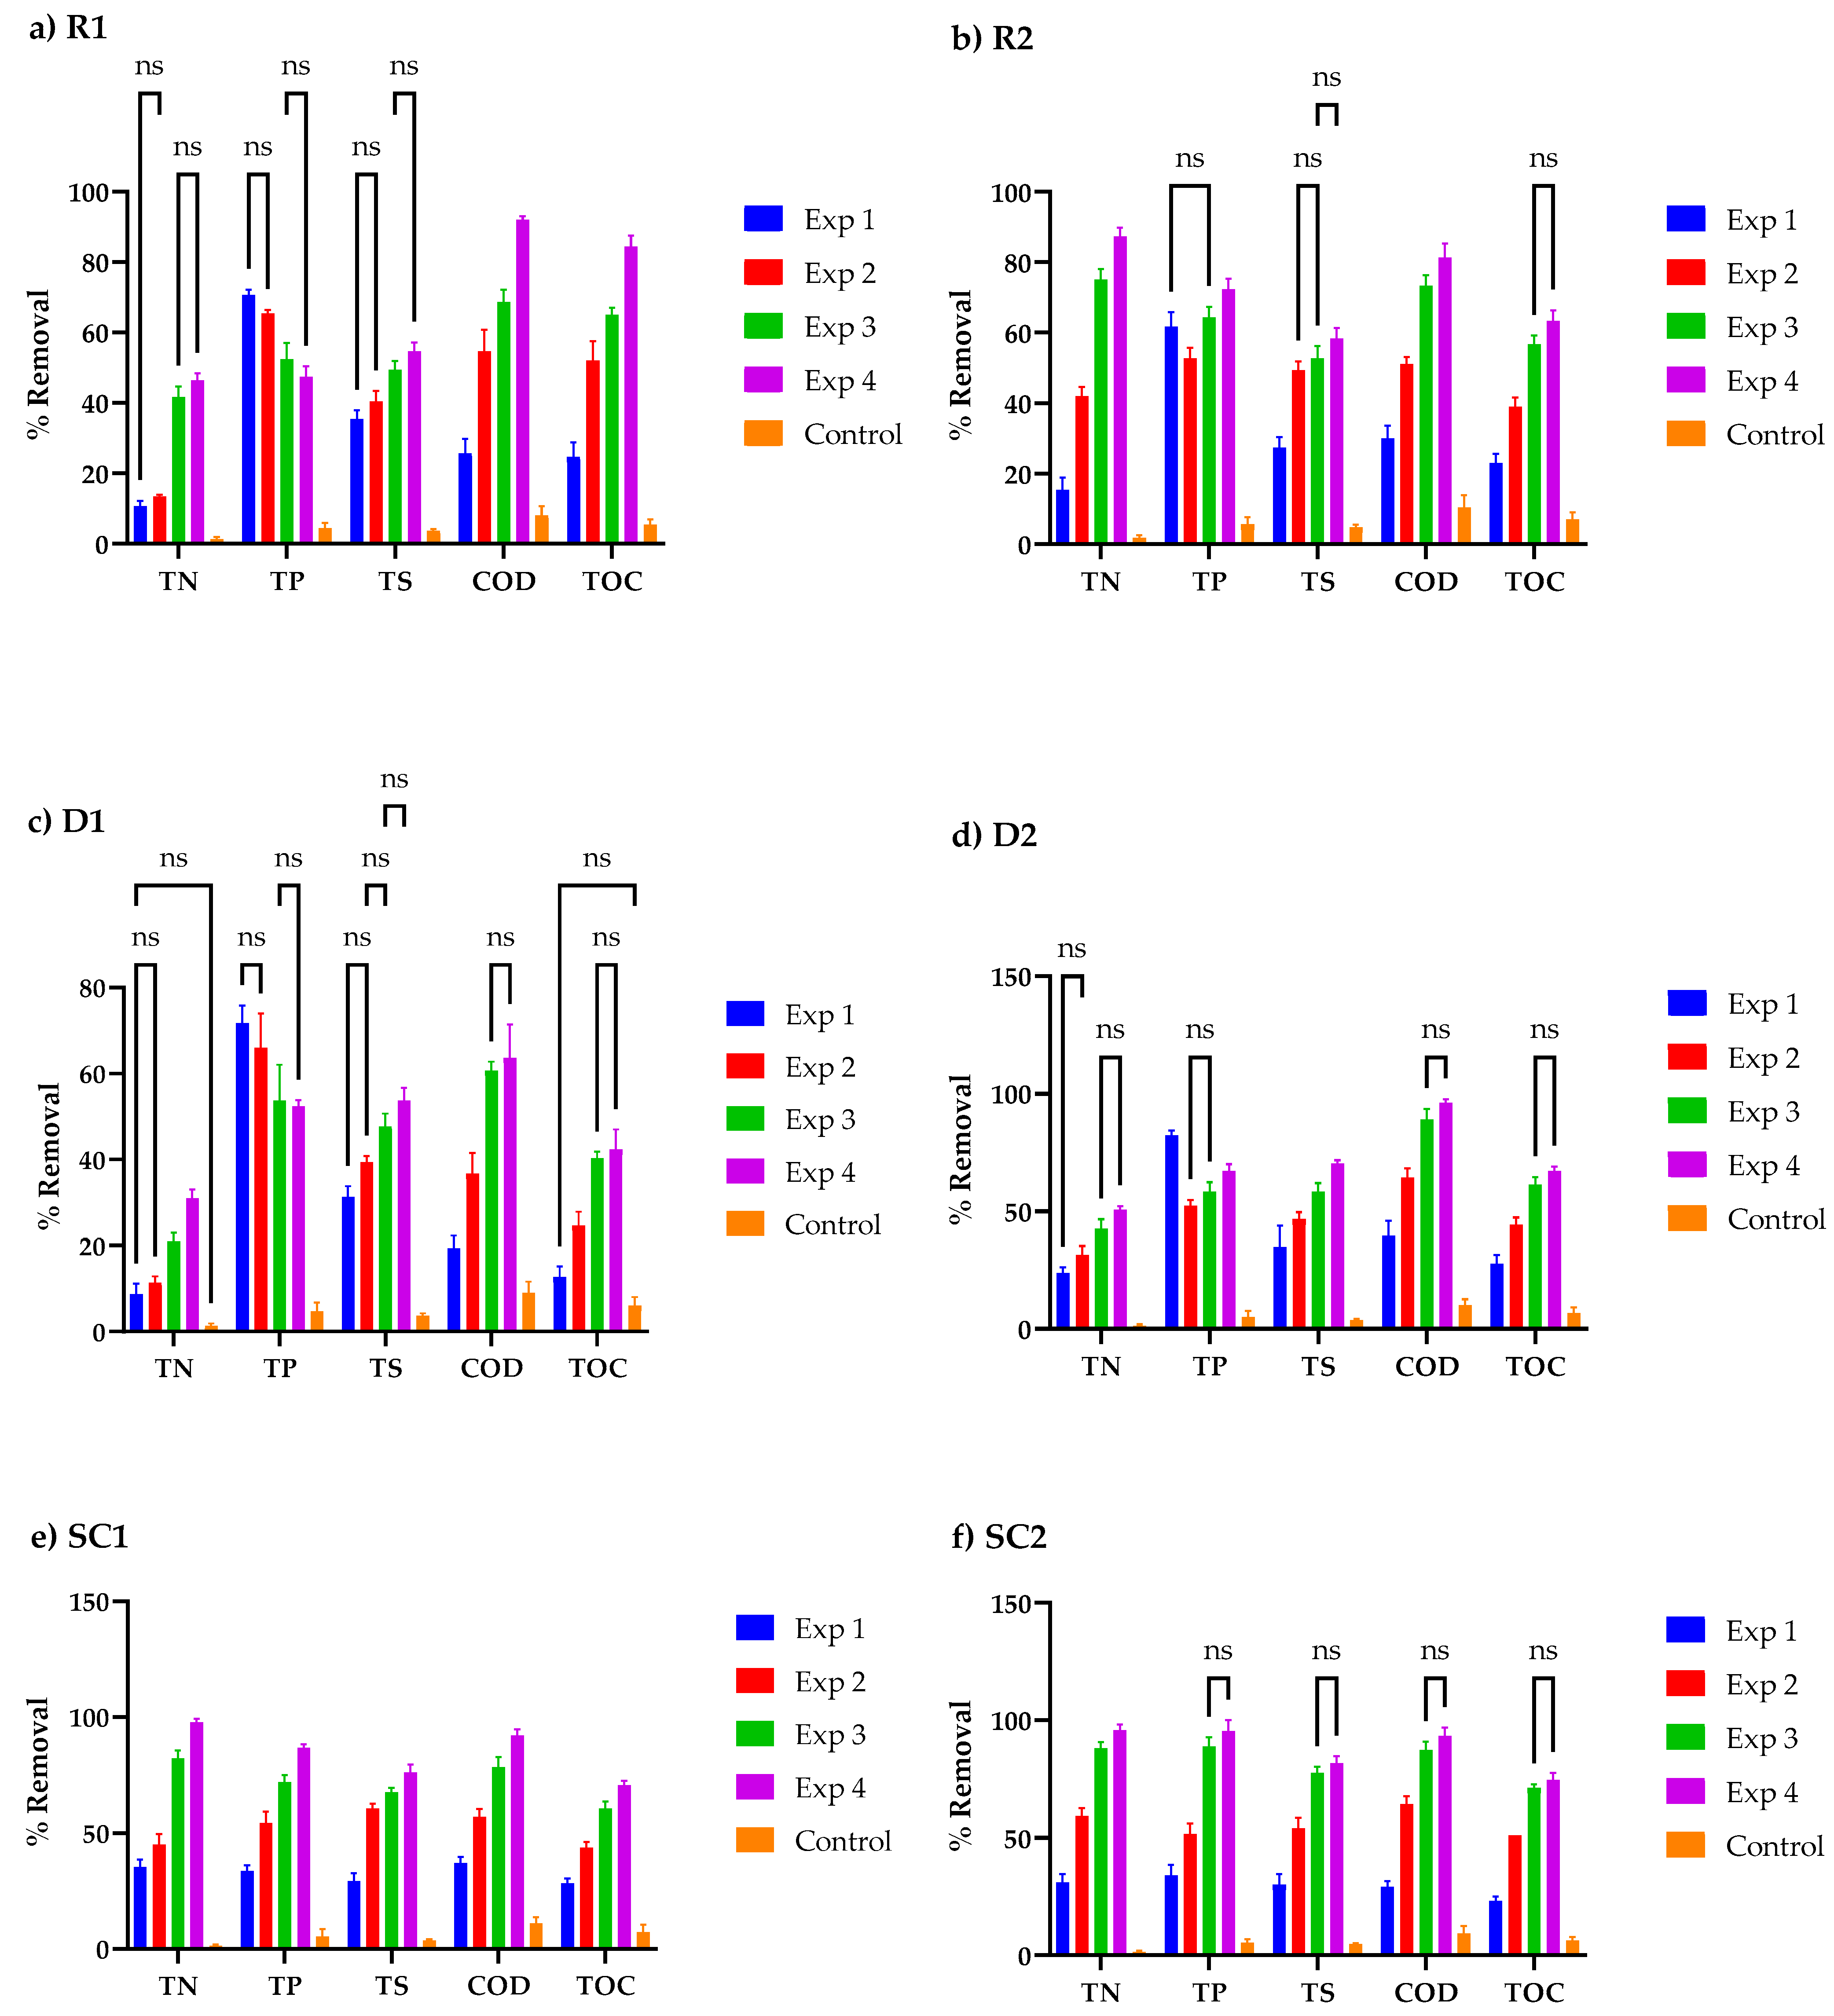
Figure 6 shows the summarized percentage removals of the organics and the nutrients in the cosmetic wastewater.
To assess the statistical differences between the nutrient removal % for the different growth media, two-way ANOVA comparisons were performed between all experiments at a significance level of 5%. The Tukey method to correct for multiple comparisons was used [44]. The brackets in Figure 5 indicate those comparisons that were found to be not significant (all other comparisons were found to exhibit significant differences) and demonstrate the remarkable influence that the pre-treatment method (Exp 1 vs. Exp2) and the addition of CO2 (Exp 2 vs. Exp 3 vs. Exp 4) had on the removal of nutrients from the solution.
The most significant change in pH was noticed in Experiments 3 and 4, as seen in Table 11. The reason for the difference was that in Experiments 3 and 4 (pre-treated wastewater and carbon dioxide at 5% and 2.5%, respectively), the high rate of carbon dioxide supplementation equilibrated the media at a pH of 6.5–7.5, which is within the optimal range for effective CO2 fixation in microalgae [14]. In Experiments 1 and 2, in the media where growth occurred, the carbon species equilibrium shifted because of the mass transfer of carbon dioxide into the cosmetic wastewater being the rate-limiting step. This led to a decrease in the dissolved inorganic carbon concentration before the equilibrium was achieved, resulting in an increase in pH.
3.5. Relationship between Cell Organics, Biomass Growth, and Nutrient Uptake in Cosmetic Wastewater
In experiments 1 and 2, the obtained results show that the specific growth rate gradually increased with decreasing organics concentration. In R2, D1, and D2, the decrease in the rate of microalgal growth when there was an increase in the substrate (CO2) concentration proved that D. multivariabilis can grow heterotrophically in addition to the conventional autotrophic growth. The decrease in growth performance and growth rate of algae with increasing substrate concentration indicates that D. multivariabilis can perform heterotrophic growth in addition to conventional autotrophic growth. The organic matters in the wastewater can act directly as essential organic nutrients or act as a secondary growth factor [45,46]. In addition, as observed in experiments 3 and 4, the results in Figure 7 initially show a pattern of increasing extracellular organics and then a steady depletion.
Growth was maximum at this condition. This may be related to the algae alternating its metabolism. When D. multivariabilis is under environmental stress, it releases organics in large amounts in an attempt to alter the growing conditions [47].
The other focus of this study was on inorganic carbon supplementation as a function of pH. As the microalgal growth occurred in Experiments 1 and 2, the TOC concentration decreased as the pH gradually increased. After adding the additional CO2 to the media in Experiments 3 and 4, the pH dropped the optimum value (6.5–7.5), and the equilibrium was attained. From the outcome of this study, D. multivariabilis appeared to have the ability to utilize bicarbonate (HCO3−) as the only carbon source; however, the rate of algal biomass growth was notably lower than when carbonate (CO32−) was present in the media [48]. Biomass production increased with decreasing pH.
Mass transfer of CO2 from the air into the growth medium limited the growth of microalgae. Comparing the growth rates of microalgae and mass transfer demonstrated that performance was highly dependent on the microalgae metabolism, and the magnitude carried microalgae growth rate was influenced by the mass transfer of CO2 into the cell, which would then be used for the sustainability of photosynthetic activity by microalgae.
In some cultures, the green color of the microalgae was observed, indicating the synthesis of chlorophyll. Visual monitoring was impossible in the red and black dyes. After pre-treatment, the red pigmentation in D2 was reduced, and the green algae could be seen. Studies have shown that dyes hinder growth by inhibiting photosynthesis [49], which would explain why the dyes were not a good medium for the growth of biomass. Another reason for the poor performance was the high concentration of cell organics in the initial media. Experiments with COD concentrations above 500 mg/L experienced slow growth due to COD inhibition. These high COD concentrations impacted the biomass production efficiency [41].
The growth rate in the shampoos and conditioners was slightly lower than that of the relaxers, and this can be attributed to the inhibition of cell reproduction by surfactant concentration in the media. Similar studies concluded that the toxicity of both surfactants interferes with processes involved in the cell reproduction [50]. Another significant observation was the performance of D. multivariabilis in Wave Nouveau perm (R2). Biomass productivity was lower than its counterparts, even though nutrient removal was maximum. This could be because of the growth inhibition caused by the limitation of the initial concentration of nitrogen and phosphate in the medium, which are crucial components of growth.
4. Conclusions
The findings in this present study indicated the potential of D. multivariabilis to utilize the pollutants in cosmetic wastewater as substrates. From this study, the microalgal biomass efficiently removed TOC, TN, TS, TP, and COD from cosmetic wastewater, proving that D. multivariabilis can be favorably used in bioremediation.
The best medium for growth was found to be the relaxers. Surfactants in shampoo and dye components are possibly toxic to biomass, limiting the photosynthesis and erupting the cell walls of algae. The results further demonstrated that the cosmetic wastewater requires prior pre-treatment to ensure growth of microalgae, especially in the black and red-pigmented dyes. Of note is that even without significant growth, the microalgae still managed to uptake nutrients from the wastewater, therefore, treating the wastewater.
D. multivariabilis demonstrated its ability to use CO2 as an inorganic substrate for growth and production of organics. It was shown that the growth of biomass was markedly limited by the mass transfer of carbon dioxide into the media.
In future, quantifying the extracellular polysaccharides (EPS), fatty acid methyl esters (FAME), and the intermediate samples for TN, TP, and TS would provide insight into the underlying mechanisms driving the observed algal behavior. In addition, a study exploring the use of authentic flue gas, with the same cosmetic wastewater parameters, should be performed to determine whether the toxic by-products of combustion have any significant inhibitory effect that would result in a deviation from the values obtained in this study.
Author Contributions
Conceptualization, F.M.O. and H.G.B.; methodology, F.M.O. and H.G.B.; software, F.M.O. and H.G.B.; validation, F.M.O. and H.G.B.; formal analysis, F.M.O. and H.G.B.; investigation, F.M.O.; resources, N.H.H. and H.G.B.; data curation, F.M.O.; writing—original draft preparation, F.M.O., N.H.H., and H.G.B.; writing—review and editing, F.M.O., N.H.H., and H.G.B.; visualization, F.M.O. and H.G.B.; supervision, H.G.B.; project administration, H.G.B.; funding acquisition, N.H.H. and H.G.B. All authors have read and agreed to the published version of the manuscript.
Funding
This research was funded by the National Research Foundation South Africa (Grant 145848) and supported by L’Oréal South Africa, under the supervision of Prof HG Brink. This work further received support from the Federal Ministry of Education, Science and Research (BMBWF) through Austria’s Agency for Education and Internationalization (OeAD) [Grant Number: Africa UNINET P056].
Institutional Review Board Statement
Not applicable.
Informed Consent Statement
Not applicable.
Data Availability Statement
Not appliable.
Acknowledgments
The authors acknowledge the support provided by Heidi Rolfes—Research Manager at L’Oréal South Africa.
Conflicts of Interest
The funders had no role in the design of the study; in the collection, analyses, or interpretation of data; in the writing of the manuscript; or in the decision to publish the results.
References
- Azrina Yaakob, M.; Maya Saphira Radin Mohamed, R.; Al-Gheethi, A.; Aswathnarayana Gokare, R.; Rao Ambati, R. Influence of Nitrogen and Phosphorus on Microalgal Growth, Biomass, Lipid, and Fatty Acid Production: An Overview. Cells 2021, 10, 393. [Google Scholar] [CrossRef] [PubMed]
- Pancha, I.; Chokshi, K.; Ghosh, T.; Paliwal, C.; Maurya, R.; Mishra, S. Bicarbonate supplementation enhanced biofuel production potential as well as nutritional stress mitigation in the microalgae Scenedesmus sp. CCNM 1077. Bioresour. Technol. 2015, 193, 315–323. [Google Scholar] [CrossRef]
- Chen, H.; Qiu, T.; Rong, J.; He, C.; Wang, Q. Microalgal biofuel revisited: An informatics-based analysis of developments to date and future prospects. Appl. Energy 2015, 155, 585–598. [Google Scholar] [CrossRef]
- Gao, F.; Yang, H.L.; Li, C.; Peng, Y.Y.; Lu, M.M.; Jin, W.H.; Bao, J.J.; Guo, Y.M. Effect of organic carbon to nitrogen ratio in wastewater on growth, nutrient uptake and lipid accumulation of a mixotrophic microalgae Chlorella sp. Bioresour. Technol. 2019, 282, 118–124. [Google Scholar] [CrossRef] [PubMed]
- Vasconcelos Fernandes, T.; Shrestha, R.; Sui, Y.; Papini, G.; Zeeman, G.; Vet, L.E.M.; Wijffels, R.H.; Lamers, P. Closing Domestic Nutrient Cycles Using Microalgae. Environ. Sci. Technol. 2015, 49, 12450–12456. [Google Scholar] [CrossRef] [PubMed]
- Moheimani, N.R. Tetraselmis suecica culture for CO2 bioremediation of untreated flue gas from a coal-fired power station. J. Appl. Phycol. 2016, 28, 2139–2146. [Google Scholar] [CrossRef]
- Doucha, J.; Straka, F.; Lívansk´y, K.L. Utilization of flue gas for cultivation of microalgae (Chlorella sp.) in an outdoor open thin-layer photobioreactor. J. Appl. Phycol. 2005, 17, 403–412. [Google Scholar] [CrossRef]
- Irfan, M.; Zhao, Z.Y.; Rehman, A.; Ozturk, I.; Li, H. Consumers’ intention-based influence factors of renewable energy adoption in Pakistan: A structural equation modeling approach. Environ. Sci. Pollut. Res. 2021, 28, 432–445. [Google Scholar] [CrossRef] [PubMed]
- Irfan, M.; Zhao, Z.Y.; Li, H.; Rehman, A. The influence of consumers’ intention factors on willingness to pay for renewable energy: A structural equation modeling approach. Environ. Sci. Pollut. Res. 2020, 27, 21747–21761. [Google Scholar] [CrossRef] [PubMed]
- Brown, L.M. Uptake of carbon dioxide from flue gas by microalgae. Energy Convers. Manag. 1996, 37, 1363–1367. [Google Scholar] [CrossRef]
- Borkenstein, C.G.; Knoblechner, J.; Frühwirth, H.; Schagerl, M. Cultivation of Chlorella emersonii with flue gas derived from a cement plant. J. Appl. Phycol. 2011, 23, 131–135. [Google Scholar] [CrossRef]
- Cantrell, K.B.; Ducey, T.; Ro, K.S.; Hunt, P.G. Livestock waste-to-bioenergy generation opportunities. Bioresour. Technol. 2008, 99, 7941–7953. [Google Scholar] [CrossRef] [PubMed]
- de Godos, I.; Blanco, S.; García-Encina, P.A.; Becares, E.; Muñoz, R. Influence of flue gas sparging on the performance of high rate algae ponds treating agro-industrial wastewaters. J. Hazard. Mater. 2010, 179, 1049–1054. [Google Scholar] [CrossRef] [PubMed]
- Yadav, G.; Mathimani, T.; Sekar, M.; Sindhu, R.; Pugazhendhi, A. Strategic evaluation of limiting factors affecting algal growth—An approach to waste mitigation and carbon dioxide sequestration. Sci. Total Environ. 2021, 796, 149049. [Google Scholar] [CrossRef]
- Moheimani, N.R.; Borowitzka, M.A. Increased CO2 and the effect of pH on growth and calcification of Pleurochrysis carterae and Emiliania huxleyi (Haptophyta) in semicontinuous cultures. Appl. Microbiol. Biotechnol. 2011, 90, 1399–1407. [Google Scholar] [CrossRef]
- Nirmalakhandan, N.; Selvaratnam, T.; Henkanatte-Gedera, S.M.; Tchinda, D.; Abeysiriwardana-Arachchige, I.S.A.; Delanka-Pedige, H.M.K.; Munasinghe-Arachchige, S.P.; Zhang, Y.; Holguin, F.O.; Lammers, P.J. Algal wastewater treatment: Photoautotrophic vs. mixotrophic processes. Algal Res. 2019, 41, 101569. [Google Scholar] [CrossRef]
- Qiu, R.; Gao, S.; Lopez, P.A.; Ogden, K.L. Effects of pH on cell growth, lipid production and CO2 addition of microalgae Chlorella sorokiniana. Algal Res. 2017, 28, 192–199. [Google Scholar] [CrossRef]
- Schediwy, K.; Trautmann, A.; Steinweg, C.; Posten, C. Microalgal kinetics—A guideline for photobioreactor design and process development. Eng. Life Sci. 2019, 19, 830–843. [Google Scholar] [CrossRef] [PubMed] [Green Version]
- Lubbe, F.V.F.V.; Brink, H.G.H.G. CaCO3 supplementation of low-carbon wastewaters for the cultivation of microalgae: A Study with Desmodesmus multivariabilis. Chem. Eng. Trans. 2019, 74, 1465–1470. [Google Scholar] [CrossRef]
- Nielsen, A. Treatment of Wastewater with Microalgae under Mixotrophic Growth; Umea University: Umea, Sweden, 2015. [Google Scholar]
- Rinanti, A.; Dewi, K.; Astuti, D.I.; Halomoan, N. Preliminary Study on Biomitigation Green House Gas Carbon Dioxide in Closed System Bubble Photobioreactor: Relationship Among the Mass Transfer Rate and CO2 Removal Efficiency in High Level of CO2. J. Teknol. 2014, 69, 93–99. [Google Scholar] [CrossRef]
- Spijkerman, E.; de Castro, F.; Gaedke, U. Independent Colimitation for Carbon Dioxide and Inorganic Phosphorus. PLoS ONE 2011, 6, e28219. [Google Scholar] [CrossRef] [Green Version]
- Greenwell, H.C.; Laurens, L.M.L.; Shields, R.J.; Lovitt, R.W.; Flynn, K.J. Placing microalgae on the biofuels priority list: A review of the technological challenges. J. R. Soc. Interface 2010, 7, 703–726. [Google Scholar] [CrossRef] [PubMed] [Green Version]
- Bautista, P.; Mohedano, A.F.; Gilarranz, M.A.; Casas, J.A.; Rodriguez, J.J. Application of Fenton oxidation to cosmetic wastewaters treatment. J. Hazard. Mater. 2007, 143, 128–134. [Google Scholar] [CrossRef] [PubMed]
- Maifadi, S.; Mhlanga, S.D.; Nxumalo, E.N.; Motsa, M.M.; Kuvarega, A.T. Analysis and pretreatment of beauty hair salon wastewater using a rapid granular multimedia filtration system. J. Water Process Eng. 2020, 33, 101050. [Google Scholar] [CrossRef]
- Bogacki, J.; Naumczyk, J.; Marcinowski, P.; Kucharska, M. Treatment of cosmetic wastewater using physicochemical and chemical methods. Chemik 2011, 65, 94–97. [Google Scholar]
- Gkika, D.A.; Mitropoulos, A.C.; Lambropoulou, D.A.; Kalavrouziotis, I.K.; Kyzas, G.Z. Cosmetic wastewater treatment technologies: A review. Environ. Sci. Pollut. Res. 2022, 29, 75223–75247. [Google Scholar] [CrossRef] [PubMed]
- Huisman, I. Optimising UF for wastewater treatment through membrane autopsy and failure analysis. Filtr. Sep. 2004, 41, 26–27. [Google Scholar] [CrossRef]
- Friha, I.; Karray, F.; Feki, F.; Jlaiel, L.; Sayadi, S. Treatment of cosmetic industry wastewater by submerged membrane bioreactor with consideration of microbial community dynamics. Int. Biodeterior. Biodegradation 2014, 88, 125–133. [Google Scholar] [CrossRef]
- Onyancha, F.; Lubbe, D.; Brink, H.G. Enhancing low-carbon wastewaters with flue gas for the optimal cultivation of desmodesmus multivariabilis. Chem. Eng. Trans. 2021, 86, 355–360. [Google Scholar] [CrossRef]
- Birungi, Z.S.; Chirwa, E.M.N. Bioreduction of thallium and cadmium toxicity from industrial wastewater using microalgae. Chem. Eng. Trans. 2017, 57, 1183–1188. [Google Scholar] [CrossRef]
- CCAP (Culture Collection of Algae and Protozoa) 3N-BBM+V (Bold Basal Medium with 3-Fold Nitrogen and Vitamins; Modified). Available online: https://www.ccap.ac.uk/wp-content/uploads/MR_3N_BBM_V.pdf (accessed on 27 September 2022).
- Nguyen, L.N.; Aditya, L.; Vu, H.P.; Johir, A.H.; Bennar, L.; Ralph, P.; Hoang, N.B.; Zdarta, J.; Nghiem, L.D. Nutrient Removal by Algae-Based Wastewater Treatment. Curr. Pollut. Reports 2022, 1, 1–15. [Google Scholar] [CrossRef]
- Fair Labor Association Fair Labor Code. Available online: https://www.fairlabor.org/accountability/standards/manufacturing/mfg-code/ (accessed on 17 November 2022).
- Andersen, R.A. Algal Culturing Techniques, 1st ed.; Andersen, R.A., Ed.; Elsevier: Amsterdam, The Netherlands, 2004; ISBN 9780080456508. [Google Scholar]
- Roestorff, M.M.; Chirwa, E.M.N. Cr(VI) mediated hydrolysis of algae cell walls to release TOC for enhanced biotransformation of Cr(VI) by a culture of Cr(VI) reducing bacteria. J. Appl. Phycol. 2019, 31, 3637–3649. [Google Scholar] [CrossRef]
- Mokwatlo, S.C.; Nicol, W.; Brink, H.G. Internal mass transfer considerations in biofilms of succinic acid producing Actinobacillus succinogenes. Chem. Eng. J. 2021, 407, 127220. [Google Scholar] [CrossRef]
- Kraakman, N.J.R.; Rocha-Rios, J.; van Loosdrecht, M.C.M. Review of mass transfer aspects for biological gas treatment. Appl. Microbiol. Biotechnol. 2011, 91, 873–886. [Google Scholar] [CrossRef] [PubMed] [Green Version]
- Barton, J.W.; Davison, B.H.; Klasson, K.T.; Gable, C.C. Estimation of mass transfer and kinetics in operating trickle-bed bioreactors for removal of VOCS. Environ. Prog. 1999, 18, 87–92. [Google Scholar] [CrossRef]
- Lee, E.; Jalalizadeh, M.; Zhang, Q. Growth kinetic models for microalgae cultivation: A review. Algal Res. 2015, 12, 497–512. [Google Scholar] [CrossRef]
- Muñoz, R.; Guieysse, B. Algal–bacterial processes for the treatment of hazardous contaminants: A review. Water Res. 2006, 40, 2799–2815. [Google Scholar] [CrossRef]
- Sharma, J.; Kumar, V.; Kumar, S.S.; Malyan, S.K.; Mathimani, T.; Bishnoi, N.R.; Pugazhendhi, A. Microalgal consortia for municipal wastewater treatment—Lipid augmentation and fatty acid profiling for biodiesel production. J. Photochem. Photobiol. B Biol. 2020, 202, 111638. [Google Scholar] [CrossRef]
- Kamyab, H.; Md Din, M.F.; Tin, C.L.; Ponraj, M.; Soltani, M.; Mohamad, S.E.; Roudi, A.M. Micro-Macro Algal Mixture as a Promising Agent for Treating POME Discharge and its Potential Use as Animal Feed Stock Enhancer. J. Teknol. 2014, 68, 1–4. [Google Scholar] [CrossRef] [Green Version]
- Haynes, W. Tukey’s Test. In Encyclopedia of Systems Biology; Springer: New York, NY, USA, 2013; pp. 2303–2304. [Google Scholar]
- Pavlić, Ž.; Vidaković-Cifrek, Ž.; Puntarić, D. Toxicity of surfactants to green microalgae Pseudokirchneriella subcapitata and Scenedesmus subspicatus and to marine diatoms Phaeodactylum tricornutum and Skeletonema costatum. Chemosphere 2005, 61, 1061–1068. [Google Scholar] [CrossRef]
- Hussain, F.; Shah, S.Z.; Zhou, W.; Iqbal, M. Microalgae screening under CO2 stress: Growth and micro-nutrients removal efficiency. J. Photochem. Photobiol. B Biol. 2017, 170, 91–98. [Google Scholar] [CrossRef] [PubMed]
- Serejo, M.L.; Farias, S.L.; Ruas, G.; Paulo, P.L.; Boncz, M.A. Surfactant removal and biomass production in a microalgal-bacterial process: Effect of feeding regime. Water Sci. Technol. 2020, 82, 1176–1183. [Google Scholar] [CrossRef] [PubMed]
- Peña-Castro, J.M.; Martínez-Jerónimo, F.; Esparza-García, F.; Cañizares-Villanueva, R.O. Phenotypic plasticity in Scenedesmus incrassatulus (Chlorophyceae) in response to heavy metals stress. Chemosphere 2004, 57, 1629–1636. [Google Scholar] [CrossRef] [PubMed]
- Lellis, B.; Fávaro-Polonio, C.Z.; Pamphile, J.A.; Polonio, J.C. Effects of textile dyes on health and the environment and bioremediation potential of living organisms. Biotechnol. Res. Innov. 2019, 3, 275–290. [Google Scholar] [CrossRef]
- Roy, R.; Fakhruddin, A.; Khatun, R.; Islam, M.; Ahsan, M.; Neger, A. Characterization of Textile Industrial Effluents and its Effects on Aquatic Macrophytes and Algae. Bangladesh J. Sci. Ind. Res. 2010, 45, 79–84. [Google Scholar] [CrossRef]
Figure 1.
Experimental set up.

Figure 2.
Growth profiles (biomass vs time) of Desmodesmus multivariabilis in six different media in (a) passive aerated experiments and (b) active aerated experiments. The error bars represent the standard deviations of the triplicate measurements. The shaded areas represent the 95% prediction interval (95% probability of future observations) [37]. Legend: Experiment 1 (0% CO2 + RCWW), Experiment 2 (0% CO2 + CWW), Experiment 3 (2.5% CO2 + CWW), and Experiment 4 (5% CO2 + CWW).

Figure 3.
Separation of growth-rate-controlled and mass-transfer-controlled regions on the growth profiles. The colors represent the different growth phases—Phase 1: Red, Phase 2: Green, Phase 3: Purple.
Figure 3.
Separation of growth-rate-controlled and mass-transfer-controlled regions on the growth profiles. The colors represent the different growth phases—Phase 1: Red, Phase 2: Green, Phase 3: Purple.

Figure 4.
Determination of kLa values for the various experimental media.

Figure 5.
The comparison between the specific growth rates for (a) phase 1 (μ1) and (b) phase 3 (μ3) against the partial pressure of CO2 in the gas phase.
Figure 5.
The comparison between the specific growth rates for (a) phase 1 (μ1) and (b) phase 3 (μ3) against the partial pressure of CO2 in the gas phase.

Figure 6.
Percentage removal of nutrients from the media. The subplots represent: (a) R1, (b) R2, (c) D1, (d) D2, (e) SC1, (f) SC2. Error bars denote the standard deviation for the triplicate results. The brackets indicate those statistical comparisons that yielded non-significant differences at the 5% significance level.

Figure 7.
Extracellular organics profiles in the media for Experiments 3 and 4. The subplots represent: (a) R1, (b) R2, (c) D1, (d) D2, (e) SC1, (f) SC2.
Figure 7.
Extracellular organics profiles in the media for Experiments 3 and 4. The subplots represent: (a) R1, (b) R2, (c) D1, (d) D2, (e) SC1, (f) SC2.


Table 1.
Hair products supplied by L’Oréal South Africa for the preparation of synthetic cosmetic wastewater used in the study.
Table 1.
Hair products supplied by L’Oréal South Africa for the preparation of synthetic cosmetic wastewater used in the study.
| Routine | Products | 1FLA Numbers |
|---|---|---|
| R1 | Dark and Lovely Superior Moisture Plus Kit Relaxer, shampoo, and conditioner | 1185566 02, 8900 SA2, 43122 SA7, 43123 SA3 |
| R2 | Wave Nouveau perm | 42172 SS6, 42180 SS9, 42098 SS4 |
| D1 | Inoa black Dye | 1094875, 1071397 |
| D2 | Majirel red Dye | 1162585, 178914 U |
| SC1 | Au Naturale Moisture-Replenishing Shampoo and Knot-Out Conditioner | 42914 SS1, 42913 SS5 |
| SC2 | Mizani Scalp Care Shampoo and conditioner Mizani Scalp Care Conditioner | 42517 SS6, 42518 SS5 |
1FLA defines Fair Labor Codes [34].
Table 2.
Summary of the experimental set up.
| Experiment | Wastewater | Aeration | Inoculation | Period | Repeats |
|---|---|---|---|---|---|
| 1 | Raw | 0% CO2 | 15 mL | 14 days | 3 |
| 2 | Pre-treated | 0% CO2 | 15 mL | 14 days | 3 |
| 3 | Pre-treated | 2.5% CO2 | 15 mL | 5 days | 3 |
| 4 | Pre-treated | 5% CO2 | 15 mL | 5 days | 3 |
| Control | Pre-treated | 0% CO2 | 0 mL | 14 days | 3 |
Table 3.
Definition of data metrics.
| Description | Parameter | Unit | Equation/Definition | |
|---|---|---|---|---|
| Average biomass growth rate | mg/(L.d) | (1) | ||
| Specific growth rate | 1/d | (2) | ||
| TOC removal efficiency | %TOC | % | (3) | |
| COD removal efficiency | %COD | % | (4) | |
| N removal efficiency | %N | % | (5) | |
| P removal efficiency | %P | % | (6) | |
| S removal efficiency | %S | % | (7) |
M, Mi (mg)—Total mass of cells produced; Initial mass of cells inoculated. , (mg/L)—Initial concentrations of total organic carbon, chemical oxygen demand. , (mg/L)—Final concentrations of total organic carbon, chemical oxygen demand. Δt (d)—Duration of the experiment. (mg/d)—Rate of growth. TN, TP, TS (mg/L)—Final total nitrogen, phosphate, and sulphate concentrations. TNi, TPi TSi (mg/L)—Initial total nitrogen, phosphate, and sulphate concentrations.
Table 4.
Graphical constants for the linearized graph of cell density (mg/L) vs optimized absorptivity in different CWW media.
Table 4.
Graphical constants for the linearized graph of cell density (mg/L) vs optimized absorptivity in different CWW media.
| Parameter | R1 | R2 | D1 | D2 | SC1 | SC2 |
|---|---|---|---|---|---|---|
| R2 | 0.8179 | 0.9672 | 0.9648 | 0.9434 | 0.9503 | 0.9316 |
| Slope | 140.75 | 139.62 | 39.303 | 39.121 | 71.281 | 39.241 |
| Intercept | 4.773 | 5.9393 | 3.2167 | 8.7563 | 2.851 | 6.627 |
Table 5.
Initial measurements for CWW media.
| Parameter | Unit | R1 | R2 | D1 | D2 | SC1 | SC2 | |
|---|---|---|---|---|---|---|---|---|
| Experiment 1 | COD | mg/L | 2483 | 4670 | 14,586 | 9968 | 1379 | 2498 |
| TOC | mg/L | 45 | 47 | 22 | 71 | 53 | 50 | |
| TN | mg/L | 61 | 7.1 | 51 | 44 | 43 | 14 | |
| TS | mg/L | 179 | 248 | 1238 | 239 | 52 | 87 | |
| TPO | mg/L | 45 | 6 | 51 | 70.8 | 66 | 70 | |
| pH | - | 10.07 | 9.03 | 9.3 | 9.55 | 7.24 | 7.81 | |
| Control, Experiments 2–4 | COD | mg/L | 1983 | 4120 | 11,102 | 9662 | 1296 | 2296 |
| TOC | mg/L | 42 | 33 | 18 | 67 | 56 | 46 | |
| TN | mg/L | 58 | 6.0 | 16.6 | 39.2 | 41.3 | 10 | |
| TS | mg/L | 124 | 163 | 1170 | 216 | 37.5 | 70 | |
| TPO | mg/L | 39 | 5.5 | 78.4 | 65.4 | 57 | 61 | |
| pH | - | 10.07 | 9.03 | 9.3 | 9.55 | 7.24 | 7.81 |
Table 6.
Biomass concentrations and average growth rates of cells harvested. The results show the average ± standard deviations of the triplicate experiments.
Table 6.
Biomass concentrations and average growth rates of cells harvested. The results show the average ± standard deviations of the triplicate experiments.
| Parameter | Exp 1,2 | R1 | R2 | D1 | D2 | SC1 | SC2 |
|---|---|---|---|---|---|---|---|
| Biomass concentration (mg dry Biomass/L) | 1 | 30 ± 0.52 | 11 ± 0.69 | 8 ± 0.70 | 12 ± 2.27 | 24 ± 1.19 | 12 ± 0.54 |
| 2 | 79 ± 1.38 | 58 ± 3.55 | 19 ± 1.66 | 24 ± 4.42 | 55 ± 5.15 | 82 ± 3.61 | |
| 3 | 183 ± 3.17 | 95 ± 5.79 | 25 ± 2.18 | 37 ± 6.87 | 162 ± 7.92 | 134 ± 5.92 | |
| 4 | 283 ± 4.89 | 129 ± 7.88 | 42 ± 3.63 | 63 ± 11.64 | 252 ± 12.33 | 176 ± 7.78 | |
| , (mg/(L.day)) | 1 | 1.3 ± 0.02 | 0.5 ± 0.03 | 0.4 ± 0.03 | 0.6 ± 0.10 | 1.1 ± 0.05 | 0.5 ± 0.02 |
| 2 | 3.2 ± 0.06 | 2.4 ± 0.14 | 1.0 ± 0.07 | 1.0 ± 0.18 | 4.3 ± 0.21 | 3.3 ± 0.15 | |
| 3 | 25.3 ± 0.44 | 13.0 ± 0.80 | 3.5 ± 0.30 | 5.2 ± 0.95 | 22.3 ± 1.09 | 18.5 ± 0.82 | |
| 4 | 40.7 ± 0.70 | 18.5 ± 1.13 | 6.0 ± 0.52 | 9.1 ± 1.67 | 36.3 ± 1.77 | 25.3 ± 1.12 |
1 Experiments 1 and 2 ran for 14 days, while 3 and 4 ran for 5 days. 2 Exp 1 (0% CO2 + RCWW), Exp 2 (0% CO2 + CWW), Exp 3 (2.5% CO2 + CWW), and Exp 4 (5% CO2 + CWW).
Table 7.
Summary of fitted parameter values for Figure 2 using Equation (9).
Table 7.
Summary of fitted parameter values for Figure 2 using Equation (9).
| Parameter | Exp 1 | R1 | R2 | D1 | D2 | SC1 | SC2 |
|---|---|---|---|---|---|---|---|
| μ1 (d−1) | 1 | 0.1365 | 0.06784 | 0.03742 | 0.1355 | 0.2193 | 0.1613 |
| 2 | 0.5806 | 0.4655 | 0.1251 | 0.2055 | 0.2574 | 0.331 | |
| 3 | 1.05 | 1.248 | 0.6277 | 0.8407 | 0.8919 | 1.62 | |
| 4 | 4.168 | 1.765 | 1.081 | 1.195 | 1.105 | 4.168 | |
| (g.L−1. d−1) | 1 | 4.208 | - | - | 0.5556 | 2.388 | 3.104 |
| 2 | 8.049 | 3.123 | 1.163 | 1.489 | 11.51 | 9.397 | |
| 3 | 37.52 | 17.25 | 5.056 | 9.747 | 43.08 | 35.17 | |
| 4 | 74.97 | 29.01 | 9.655 | 18.78 | 65.04 | 55.01 | |
| μ3 (d−1) | 1 | 0.03523 | - | - | 0.04561 | 0.03241 | 0.02813 |
| 2 | 0.05944 | 0.05222 | - | 0.05303 | 0.02374 | 0.02915 | |
| 3 | 0.2298 | 0.1629 | 0.1302 | 0.1074 | 0.1796 | 0.1519 | |
| 4 | 0.2076 | 0.1377 | 0.09136 | 0.1825 | 0.2506 | 0.1613 | |
| R2 | 1 | 0.9984 | 0.9879 | 0.9645 | 0.9971 | 0.9976 | 0.9959 |
| 2 | 0.9992 | 0.9926 | 0.997 | 0.9966 | 0.9988 | 0.999 | |
| 3 | 0.9905 | 0.998 | 0.9964 | 0.9956 | 0.9941 | 0.9991 | |
| 4 | 0.9978 | 0.9964 | 0.9967 | 0.9964 | 0.9833 | 0.9963 |
1 Exp 1 (0% CO2 + RCWW), Exp 2 (0% CO2 + CWW), Exp 3(2.5% CO2 + CWW), and Exp 4 (5% CO2 + CWW).
Table 8.
Summary of fitted parameter values from Figure 4.
Table 8.
Summary of fitted parameter values from Figure 4.
| Parameter | R1 | R2 | D1 | D2 | SC1 | SC2 |
|---|---|---|---|---|---|---|
| kLa (g.L−1.atm−1.d−1) | 12.58 | 5.102 | 1.933 | 3.935 | 12.19 | 10.36 |
| R2 | 0.9975 | 0.9739 | 0.9989 | 0.9999 | 0.9865 | 0.9920 |
Table 9.
Removal rates of Cell Organics in mg/(L.d).
| Parameter | Experiment 1,2 | R1 | R2 | D1 | D2 | SC1 | SC2 |
|---|---|---|---|---|---|---|---|
| TOC | 1 | 0.79 | 0.77 | 0.20 | 1.40 | 1.08 | 0.83 |
| 2 | 1.67 | 1.30 | 0.38 | 2.26 | 1.65 | 1.85 | |
| 3 | 5.86 | 5.31 | 1.79 | 8.72 | 6.45 | 7.17 | |
| 4 | 7.93 | 5.92 | 1.88 | 9.52 | 7.46 | 7.51 | |
| Control | 0.17 | 0.23 | 0.09 | 0.33 | 0.27 | 0.23 | |
| COD | 1 | 46 | 100 | 201 | 285 | 37 | 52 |
| 2 | 97 | 167 | 379 | 458 | 56 | 114 | |
| 3 | 340 | 684 | 1777 | 1769 | 219 | 445 | |
| 4 | 460 | 763 | 1861 | 1913 | 254 | 465 | |
| Control | 14 | 35 | 92 | 69 | 10 | 17 |
1 Experiments 1 and 2 ran for 14 days while control and Experiments 3 and 4 ran for 5 days. 2 Exp 1 (0% CO2 + RCWW), Exp 2 (0% CO2 + CWW), Exp 3 (2.5% CO2 + CWW), and Exp 4 (5% CO2 + CWW).
Table 10.
Removal rates of nitrogen, phosphates, and sulphates in mg/(L.d).
| Parameter | Experiment 1,2 | R1 | R2 | D1 | D2 | SC1 | SC2 |
|---|---|---|---|---|---|---|---|
| TN | 1 | 0.05 | 0.08 | 0.32 | 0.74 | 1.09 | 0.31 |
| 2 | 0.06 | 0.21 | 0.41 | 0.98 | 1.38 | 0.59 | |
| 3 | 0.51 | 1.07 | 2.14 | 3.75 | 7.05 | 2.46 | |
| 4 | 0.57 | 1.24 | 3.16 | 4.46 | 8.40 | 2.68 | |
| Control | 0.01 | 0.01 | 0.05 | 0.05 | 0.05 | 0.02 | |
| TS | 1 | 4.52 | 4.84 | 27.71 | 5.92 | 1.09 | 1.86 |
| 2 | 5.16 | 8.74 | 34.78 | 7.97 | 2.25 | 3.36 | |
| 3 | 17.66 | 26.12 | 118.02 | 27.88 | 7.04 | 13.51 | |
| 4 | 19.57 | 28.93 | 132.88 | 33.62 | 7.94 | 14.21 | |
| Control | 0.47 | 0.84 | 3.57 | 0.76 | 0.18 | 0.27 | |
| TP | 1 | 0.30 | 1.98 | 5.04 | 4.16 | 1.59 | 1.70 |
| 2 | 0.28 | 1.69 | 4.64 | 2.65 | 2.56 | 2.58 | |
| 3 | 0.63 | 5.79 | 10.57 | 8.26 | 9.50 | 12.41 | |
| 4 | 0.57 | 6.51 | 10.31 | 9.49 | 11.44 | 13.35 | |
| Control | 0.02 | 0.18 | 0.34 | 0.27 | 0.27 | 0.26 |
1 Experiments 1 and 2 ran for 14 days while control and Experiments 3 and 4 ran for 5 days. 2 Exp 1 (0%CO2 + RCWW), Exp 2 (0%CO2 + CWW), Exp 3(2.5%CO2 + CWW), and Exp 4 (5%CO2 + CWW).
Table 11.
Final pH averages and standard deviation.
| Exp 1,2 | R1 | R2 | D1 | D2 | SC1 | SC2 |
|---|---|---|---|---|---|---|
| 1 | 12.07 ± 0.22 | 8.20 ± 0.05 | 9.60 ± 0.15 | 9.88 ± 0.17 | 10.16 ± 0.09 | 9.62 ± 0.09 |
| 2 | 10.80 ± 0.16 | 10.65 ± 0.03 | 10.74 ± 0.17 | 10.56 ± 0.00 | 11.84 ± 0.05 | 10.34 ± 0.10 |
| 3 | 6.90 ± 0.08 | 6.93 ± 0.02 | 7.10 ± 0.08 | 7.00 ± 0.08 | 6.63 ± 0.05 | 6.72 ± 0.08 |
| 4 | 6.47 ± 0.05 | 6.35 ± 0.09 | 6.83 ± 0.12 | 6.57 ± 0.05 | 6.33 ± 0.12 | 6.37 ± 0.10 |
| Control | 11.88 ± 0.03 | 8.92 ± 0.06 | 8.91 ± 0.04 | 9.44 ± 0.05 | 7.13 ± 0.05 | 7.58 ± 0.06 |
1 Experiments 1 and 2 ran for 14 days while control and Experiments 3 and 4 ran for 5 days. 2 Exp 1 (0%CO2 + RCWW), Exp 2 (0%CO2 + CWW), Exp 3(2.5%CO2 + CWW), and Exp 4 (5%CO2 + CWW).
Publisher’s Note: MDPI stays neutral with regard to jurisdictional claims in published maps and institutional affiliations. |
© 2022 by the authors. Licensee MDPI, Basel, Switzerland. This article is an open access article distributed under the terms and conditions of the Creative Commons Attribution (CC BY) license (https://creativecommons.org/licenses/by/4.0/).
Share and Cite
MDPI and ACS Style
Onyancha, F.M.; Haneklaus, N.H.; Brink, H.G. Cultivation of Desmodesmus multivariabilis for the Treatment of Cosmetic Wastewater. Sustainability 2022, 14, 15665. https://0-doi-org.brum.beds.ac.uk/10.3390/su142315665
AMA Style
Onyancha FM, Haneklaus NH, Brink HG. Cultivation of Desmodesmus multivariabilis for the Treatment of Cosmetic Wastewater. Sustainability. 2022; 14(23):15665. https://0-doi-org.brum.beds.ac.uk/10.3390/su142315665
Chicago/Turabian StyleOnyancha, Faith M., Nils H. Haneklaus, and Hendrik G. Brink. 2022. "Cultivation of Desmodesmus multivariabilis for the Treatment of Cosmetic Wastewater" Sustainability 14, no. 23: 15665. https://0-doi-org.brum.beds.ac.uk/10.3390/su142315665
Note that from the first issue of 2016, this journal uses article numbers instead of page numbers. See further details here.